Authors: Abigail Swillens 1, Joris Degroote 2, Jan Vierendeels 2, Lasse Lovstakken 3, Patrick Segers 1. Pietersnieuwstraat 41,9000 Gent
|
|
|
- Collin Anderson
- 5 years ago
- Views:
Transcription
1 A simulation environment for validating ultrasonic blood flow and vessel wall imaging based on fluid-structure interaction simulations: ultrasonic assessment of arterial distension and wall shear rate 5 Authors: Abigail Swillens 1, Joris Degroote 2, Jan Vierendeels 2, Lasse Lovstakken 3, Patrick Segers 1 1 Institute Biomedical Technology, Ghent University, De Pintelaan 185, 9000 Gent 10 2 Department of flow, heat and combustion mechanics, Ghent University, Sint- Pietersnieuwstraat 41,9000 Gent 3 Norwegian University of Science and Technology, Department of Circulation and Medical Imaging, Olav Kyrres gt. 9, 7489 Trondheim, Norway 15 Correspondence: Abigail Swillens Ghent University IBiTech-bioMMeda De Pintelaan Gent, Belgium abigail.swillens@ugent.be Tel: Fax:
2 Abstract Purpose: Ultrasound is a commonly used vascular imaging tool when screening for 30 patients at high cardiovascular risk. However, current blood flow and vessel wall imaging methods are hampered by several limitations. When optimizing and developing new ultrasound modalities, proper validation is required before clinical implementation. Therefore, we present a simulation environment integrating ultrasound (US) and fluid-structure interaction (FSI) simulations, allowing construction 35 of synthetic ultrasound images based on physiologically realistic behavior of an artery. To demonstrate the potential of our model for vascular ultrasound research, we studied clinically relevant imaging modalities of arterial function related to both vessel wall deformation and arterial hemodynamics: arterial distension (related to arterial stiffness) and wall shear rate (related to the development of atherosclerosis) imaging. 40 Methods: An in-house code ( Tango ) was developed to strongly couple the flow solver Fluent and structural solver Abaqus using an Interface Quasi-Newton technique. Field II was used to model realistic transducer and scan settings. The input to the FSI-US model is a scatterer phantom on which the US-waves reflect, with the scatterer displacement derived from the FSI flow and displacement fields. We 45 applied our simulation tool to a 3D straight tube, representative of the common carotid artery (length 5cm, inner and outer radius: 3 and 4 mm). A mass flow inlet boundary condition, based on flow measured in a healthy subject, was applied. A downstream pressure condition, based on a non-invasively measured pressure waveform, was chosen and scaled to simulate three different degrees of arterial 50 distension (1%, 4%, 9%). The RF-data from the FSI-US coupling were further processed for arterial wall and flow imaging. Using an available wall tracking algorithm, arterial distensibility was assessed. Using an autocorrelation estimator, 2
3 blood velocity and shear rate were obtained along a scanline. Results: We obtained very good agreement between the flow and distension as obtained from the FSI-US 55 model and the reference FSI values. The wall application showed a high sensitivity of distension measurements to the measurement location, previously reported based on in vivo data. Interestingly, the model indicated strong reflections between tissue transitions can potentially cloud a correct measurement. The flow imaging application demonstrated maximum shear rate was underestimated for a relevant simulation 60 setup. Moreover, given the difficulty of measuring near-wall velocities with ultrasound, maximal shear rate was obtained at a distance from the wall (0.812 mm for the anterior and mm for the posterior side (9%-case)). However, ultrasound shear rates correlated well with the FSI ground truth for all distension degrees, suggesting correction of the severe underestimation by ultrasound might be feasible in certain 65 flow conditions. Conclusions: We demonstrated a simulation environment to validate and develop ultrasonic vascular imaging. An elaborate technique to integrate FSI and Field II ultrasound simulations was presented. This multiphysics simulation tool was applied to two imaging applications where distensible ultrasound phantoms are indispensable: wall distension and shear rate measurement. Results showed our 70 method to couple fluid-structure interaction and ultrasound simulations provides realistic RF signals from the tissue and the blood pool. Keywords: multiphysics, ultrasound, fluid-structure interaction, vessel distension, wall shear rate 75 3
4 Introduction At present, ultrasonic echography is still the preferred method for clinical screening of atherosclerosis in large, superficial arteries. In particular, the carotid artery is often investigated in clinical protocols since the artery directly supplies blood to the brain 80 and the location is prone to development of atherosclerosis. Moreover, as the carotid artery is a large elastic vessel, measuring its stiffness might indirectly provide information on aortic stiffening. Hence, its screening may identify subjects at risk of cardiovascular disease in general, and stroke in particular. However, current ultrasound modalities have their limitations in this setting. Most commonly used 85 clinical blood flow imaging modalities are still limited to 1D measurements since only the velocity component in the direction of the ultrasound beam is visualized. This is particularly a disadvantage for complex velocity fields as may occur in the vicinity of the carotid bulb, where zones of blood recirculation and swirling flow patterns may arise 1. Other imaging modalities aim to assess arterial stiffness, but here the current 90 methods are also hampered. A common application is measuring tissue velocities using Doppler based methods, which is limited to 1D visualization as well. Often, tissue velocities are further integrated to assess vessel distension 2. However, vessel kinematics rather than vessel mechanics is hence assessed. With the rapid evolution in ultrasound imaging technology and computer processing 95 power, it has become feasible to design better imaging modalities. A practical problem is however the validation and optimization of these imaging modalities. Especially for complex settings as the carotid artery, which shows complex flow patterns and a highly deformable elastic wall, new and optimized ultrasound modalities (pulse firing sequences, beam-forming, processing of radio-frequency (RF) 100 ultrasound data) aiming for improved visualization would require thorough validation. 4
5 In recent work 3, we developed a computer simulation tool which integrated computational fluid dynamics (CFD) with ultrasound simulation (US) software (Field II 4, 5 ), providing a flexible tool for the validation and development of ultrasound blood flow modalities in the presence of complex flow. In the simulation environment, the 105 ultrasonic echoes are simulated by modeling blood as a random point scatterer distribution on which the ultrasound waves reflect. The scatterer positions are updated using the CFD-velocity fields interpolated in space and time. We used this tool to construct a patient-specific 3D ultrasound phantom of the carotid artery and we assessed the performance of 1D flow imaging methods like pulsed wave Doppler 110 and color flow imaging, demonstrating its inability to portray complex flow patterns 3. We further compared the performance of two major research lines in 2D velocity estimators: crossed-beam vector Doppler and speckle tracking, demonstrating that speckle tracking would probably make most chance to be practically applicable 6. An important limitation of our work, however, was the absence of the moving vessel 115 wall in our model, which influences flow visualization through the motion of the 120 boundaries of the fluid domain, as well as via ultrasound echoes generated by the vessel wall. Fluid-structure interaction (FSI) simulations allow for the coupled computation of blood flow and arterial wall mechanics. It is therefore a natural extension of our work to seed scatterers also in the vessel wall, and to use FSIsimulations to calculate scatterer positions in both the blood flow and vessel wall. Although the basic principle behind this extension is logical and straightforward, the practical implementation is not. A first challenge is the grid formulation used in FSIsimulations, where both the fluid and structural part are described with nodal grid positions changing with time, which challenges the scatterer position assessment. 125 Further, the creation of a vessel wall phantom also poses specific challenges. In 5
6 contrast to blood scatterers which move in and out of the computational domain, tissue scatterers are fixed to the tissue. The complex composition and layering of the vessel wall also requires flexibility in adapting scattering properties in localized regions. Implementing the layered structure in the scatterer phantom imposes 130 additional requirements on the mesh elements used to solve the structural problem. Furthermore, the transition between the vessel wall and surrounding tissue/blood creates strong specular reflections, which should be appropriately mimicked in the ultrasound software. The aim of this paper is two-fold. In a first section, we elaborate on our methodology 135 based on a 3D FSI-simulation of blood flow and wave propagation in a 3-layered tube, representative of the common carotid artery. Scatterer phantoms of both the blood flow and arterial wall are generated and hence a virtual echographic phantom of a straight arterial segment is obtained. In a second section, the potential of the model is illustrated via two applications on currently used ultrasound modalities in vascular 140 research, one related to measuring distension of the arterial wall and one related to assessing the wall shear stress exerted by the blood flow on the arterial wall. As a first application, the ultrasonic measurement of vessel distension will be investigated, which is often used to measure arterial stiffness. We will use the RFdata resulting from scatterers in the arterial wall to assess the performance of a 145 previously used 7 vessel wall-tracking algorithm based on a modified autocorrelation velocity estimation algorithm 2. In particular, the sensitivity of these wall-tracking algorithms to the measuring position in the arterial wall will be demonstrated, where we anticipate a decrease in measured diameter distension from the blood-lumen interface towards the adventitia, as we have previously reported in vivo 7. In a second 150 application, we will study to what extent it is possible to measure velocity and shear 6
7 rate profiles using Doppler-based measurements along one scanline. The shear rate relates to the tangential force exerted by the blood on the endothelial cells, which line the lumen of the blood vessel. Low or oscillating shear stress has been shown to promote the development of atherosclerosis, and is hence a clinically relevant 155 hemodynamic parameter when screening for patients at high cardiovascular risk 8. As earlier described by Brands et al. 9, shear rate profiles can be derived from flow velocity profiles measured with ultrasound. However, due to difficulties in measuring the low velocities in the vicinity of the moving wall, the maximal shear rate is measured at a certain distance from the wall, while the actual maximal shear rate 160 might be differing from this position and in magnitude. To the best of our knowledge, the relationship between ground-truth and ultrasound-derived shear rate has never been studied in detail. As the magnitude of the wall motion might have an effect on this relation, we have performed three simulations with various degrees of arterial distension
8 Methods A. Simulating Fluid-Structure interaction (FSI) 175 FSI-simulations were performed in a partitioned way, computing the flow and structural equations with a separate flow and structural solver. An in-house code Tango was used to couple the flow solver Fluent (Ansys, Canonsburg, PA, USA) and the structural solver Abaqus (Simulia,Inc., Providence, RI, USA). In particular, Dirichlet-Neumann partitioning was used, which means the flow problem is solved for 180 a given displacement, and the structural problem is solved for a stress boundary condition applied on the wet side of the structure. For each timestep, coupling iterations were performed between the flow and structural solver, and the transfer of information was limited to the fluid-structure interface: a face stress transfer from fluid to structural domain and a displacement transfer from structural to fluid domain. 185 However, vascular FSI-problems are often strongly coupled problems due to the compliant vessel walls and the similar fluid and structural densities. Hence, a weak coupling, i.e. directly transferring the stresses and displacements may lead to numerical instabilities 10, 11. To enhance convergence of the coupling iterations, an Interface Quasi-Newton method was used 12, 13. This technique replaces the complex 190 fluid or solid solver on the interface by approaching the Jacobian of the solver on the interface. Further, an Arbitrary Lagrangian Eulerian (ALE) method was used to match the different grid formulations for the fluid and structural domain. The fluid domain is often described in the Eulerian way, which considers motion from a fixed point. The Lagrangian formulation is the intuitive way of describing the structural domain, and 195 considers motion from a point moving with the material. In the ALE method, the flow equations are written in an arbitrary Lagrangian-Eulerian formulation and are solved 8
9 on a deforming mesh. The fluid grid deforms in an arbitrary way, independent from the flow velocity, and its boundaries follow the structural domain s deformation. The structural problem is formulated in the Lagrangian manner. 200 A straight elastic tube with inner radius 3 mm, outer radius 4 mm, and length 5 cm was simulated. The vessel wall was modeled using a linearized elastic material model with a Young modulus of 250 kpa, Poisson modulus of 0.49, and density 1200 kg/m 3. The linearization was performed with respect to a reference pressure and inner radius of respectively 10 mmhg and 3mm. Circumferential and longitudinal 205 movement of the tube was prevented. Blood was modeled as a Newtonian liquid with a viscosity of 3.5 mpas and a density of 1050 kg/m 3. A velocity profile was measured in the common carotid artery of a healthy volunteer using ultrasonic pulsed wave Doppler (12L linear array vascular probe, GE Medical Systems, Milwaukee, WI, USA) and was applied as a mass flow inlet condition to increase stability during the 210 coupling iterations. The outlet boundary condition was a non-invasively measured pressure waveform, scaled with a pulse pressure of 40 mmhg, representative of a healthy hemodynamical condition. This pressure condition resulted in an arterial distension D/D ( D=D max -D min and D=D min ) of 9%. To obtain additional datasets with lower degree of distension, we ran simulations using the same pressure waveform, 215 but with an amplitude scaled to pulse pressures of 20 and 4 mmhg or arterial distensions of 4% and 1%. The fluid-structure interface was modeled as a no-slip boundary. The flow solver Fluent uses a finite volume method, with PISO pressure-velocity coupling and first order time accuracy. First order pressure discretization and second 220 order upwind for momentum were applied. The fluid mesh consisted of triangular prisms and was adapted to the position of the fluid-structure interface with 9
10 a spring analogy. Abaqus is a finite element structural solver which uses Hilber- Hughes-Taylor 14 implicit time integration and takes into account the geometric nonlinearities due to large deformations. The structural domain was composed of quadratic continuum hexahedrons (20 nodes) and numerical damping of high- frequency errors was increased (α=-0.3) to eliminate spurious oscillations due to the different time discretizations in Fluent and Abaqus. Hexahedral elements were used to allow layered modeling of the vessel wall. A non-conforming mesh existed on the interface requiring appropriate interpolation of the transfer variables. The cardiac 230 cycle of 1s was divided into timesteps of 5 ms and 2 cycles were computed to obtain results independent of transient effects. The Womersley number was 4.12; the peak Reynolds number was 845 (1 %-case). The coupling algorithm was executed on one core, the flow solver on six cores and the structural solver on six cores of a dedicated machine with two Intel Xeon 5355 quad-core processors (2.66GHz). 235 B. Simulating ultrasound The RF-signals from the vessel wall and blood were simulated using the Field II software created by Jensen et al 4, 5. This simulation software allows modeling arbitrary ultrasound transducers and realistic image scan sequencing. The approach is limited to linear wave propagation and is based on the spatial impulse response 240 estimation as described by Tupholme 15 and Stepanishen 16. Using linear system theory, the ultrasound field is determined based on the ultrasonic excitation pulse, the temporal impulse responses of the transmitting and receiving transducers, and the spatial impulse response at a given point. For further details on the software background, we refer to 4, 5. Field II models tissue as a collection of random point 245 scatterers. The required scatterer density is related to the imaging system resolution, with 10 scatterers per resolution cell assuring Gaussian distributed RF-signals 17. The 10
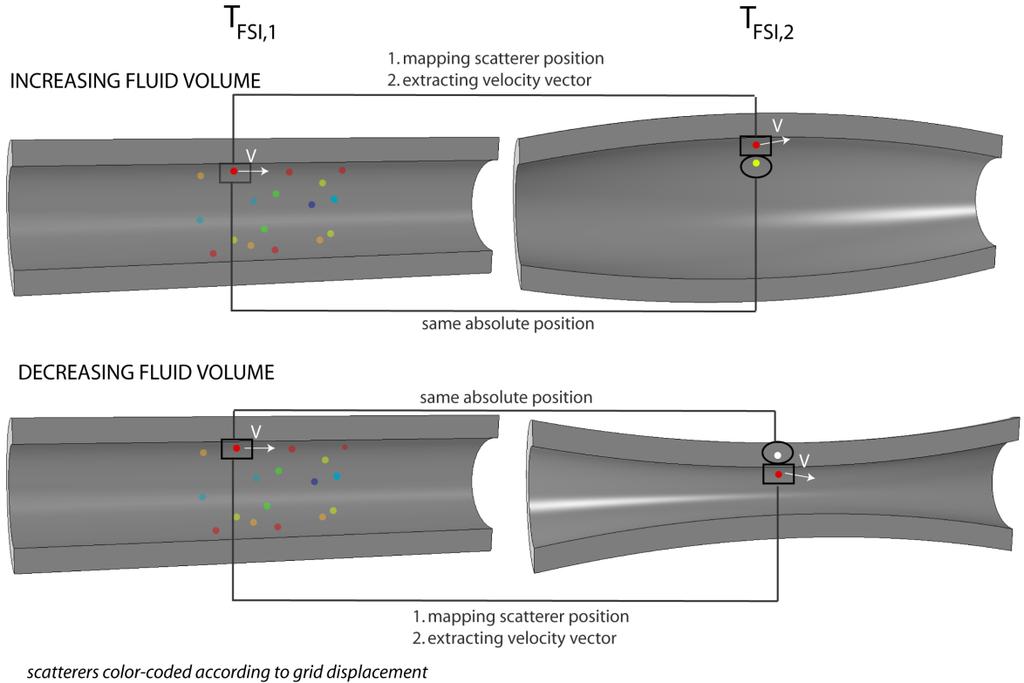
11 scattering strength is modeled using a normal distribution of scattering amplitudes with mean and standard deviation varying according to the tissue properties. To appropriately mimic specular reflections, scatterers with high mean amplitude are 250 positioned in a regular fashion at the tissue transitions. Dynamic objects are achieved by moving the point scatterers during simulation. Each ultrasound beam is simulated individually, and it is therefore possible to update the position of moving scatterers between beam acquisitions. B1. Integrating FSI and ultrasound: creating a fluid scatterer phantom 255 In 3, we described a method to generate scatterers during Field II simulations based on CFD-calculations with rigid walls. 3D spatial interpolation was performed to transform the CFD velocity vectors to the random scatterer cloud, and temporal interpolation of the CFD velocities was required due to the large disparity in the ultrasound and CFD timescales (63 μs versus 5 ms for the simulated color flow 260 imaging application). For distensible fluid geometries, straightforward linear temporal interpolation of the velocity fields is however not possible. This is illustrated in fig. 1-A, if one considers the position of the red point at time point T FSI,1 of the FSI-calculation and the same absolute position of this point at the next FSI timestep T FSI,2. In case of a decreasing 265 fluid volume, this point ends up outside the fluid volume at T FSI,2 (white point in fig.1- A). In case of increasing fluid volume, the point ends up further from the vessel wall at T FSI,2 compared to T FSI,1 (yellow point in fig.1-a). Hence, temporal interpolation between the same absolute positions at different FSI-timesteps is incorrect. Complex mathematical methods exist to derive velocity fields for changing fluid domains at 270 timesteps intermediate to the chosen FSI-timesteps. This, however, would be an 11
12 impractical approach due to high computational times 18, 19. We therefore followed an approach outlined below, which allowed us assessing scatterer velocities as illustrated in the flowchart of fig. 1-B. The scatterer displacement will be approximated by updating scatterer velocities for 275 each FSI-timestep. A first problem arises from the fact that when deriving scatterer velocities using the current situation at FSI-frame T FSI,1, the scatterer positions at subsequent ultrasound simulation timesteps will not follow the wall motion. This is illustrated for the red point in fig. 1-A, with corresponding velocity vector V at T FSI,1. For increasing volumes, the red scatterer would be propagated in a horizontal 280 manner according to the vector V, and a void would arise near the wall. In case of decreasing volumes, the red scatterer would end up outside the fluid volume due to its horizontal propagation. In order to follow the wall motion, the situation at the next FSI-timestep T FSI,2 should be considered when updating the scatterer velocity at T FSI,1. As illustrated in fig. 1-A, the red scatterer has a velocity vector V at T FSI,2 which 285 indicates the correct wall motion. The velocity vectors at T FSI,2 will therefore be applied for the ultrasound simulation timesteps T FSI,1 and <T FSI,2. Now we know when to extract the scatterer velocities, the question remains where to extract the scatterer velocity vector from the velocity field at T FSI,2. As was previously explained, absolute positions at different FSI-timesteps can not be compared. 290 Consequently, one cannot extract the velocity vector at T FSI,2 at the same location the scatterer finds oneself at T FSI,1. A suitable location can be found, keeping in mind the scatterer displacement between FSI-timesteps is influenced by both the flow and structural movement. If a flow scatterer were solely displaced due to the structural movement, one can assume that its relative position in the blood vessel is conserved. 295 To find the same relative location of a scatterer at T FSI,2, the scatterer location at 12
13 T FSI,1 is mapped onto its new location at T FSI,2 using the deformation of the fluid grid between T FSI,1 and T FSI,2. This is also illustrated in fig. 1-A. This is possible because of the ALE grid formulation and since remeshing is unnecessary due to the relatively small volume changes between FSI timesteps (typical for vascular FSI-applications). 300 For this purpose, the fluid grid deformation known in the nodal grid points is interpolated to the random points using the same Matlab procedure as described in 3. Once the mapped scatterer location at T FSI,2 is known, the velocity vector of the scatterer can be obtained with 3D spatial interpolation 3. Subsequently, the new scatterer position X t at t n n (T FSI,1 < t n T FSI,2 ) can be calculated as: 305 X t n X v X ) T t n 1 T FSI,2 ( T, mapped FSI,1 With X t n 1 the scatterer position at the previous timestep t n-1, T the timestep between t n-1 and t n, and v X ) the velocity vector at T FSI,2 at the location T FSI (, 2 TFSI,1, mapped found by mapping the scatterer position X T FSI, 1 complete overview of the procedure can be found in fig. 1-B. on the next FSI-timestep T FSI,2. A 310 B2. Integrating FSI and ultrasound: creating a structure phantom The structure phantom generation is less complex because of the Lagrangian grid formulation. The grid displacement corresponds with the material displacement and hence also with the scatterer displacement. However, the vessel wall needs more refined scatterer generation due to its complex composition, with flexibility of defining 315 different scattering properties in different vessel regions. Therefore, point scatterers are generated in each hexahedron of the structural mesh. This way, scattering 13
14 characteristics can be changed at very localized regions of the wall. In particular, the mesh was divided into 3 layers of hexahedrons, with scatterer properties easily modifiable for each layer. This represents to some extent the intima, media and 320 adventitia of an artery, although we assumed equal thickness of each layer, while this is not the case in vivo. For each hexahedron of the mesh, a surrounding box was used to randomly generate scatterers, with points outside the bounding box being deleted, as illustrated in fig. 2-A. Displacement vectors were obtained by subtracting the grid position of T FSI,1 from T FSI,2 and assigning them to the scatterers by weighted 325 averaging. Besides these random scatterers, the vessel wall also causes specular reflections at the transition regions between different tissue types (i.e. tissue/vessel wall and vessel wall/blood). Specular reflections can not be simulated in Field II but can be mimicked by positioning scatterers in a regular fashion at the wet and dry boundary of the structure, as illustrated in fig. 2-A. More specifically, for each 330 hexahedron in the intima or adventitia layer, the side adjacent to a different tissue type was determined and scatterers were placed at fixed distances. These mimicked specular reflections had a higher intensity than the scattering from the random tissue and blood scatterers. An overview of the different scattering properties attributed to the different tissues can be found in table C. Ultrasonic imaging setup Ultrasound applications for both flow and vessel wall imaging were investigated to validate and apply the new simulation tools. Wall shear stress imaging as described by 9, 20 and distension measurements 2 were chosen since distensible vessel phantoms are important for their analysis. For both applications, a linear array 340 transducer with appropriate centre frequency and excitation was implemented. Each transducer element was divided into four smaller rectangular mathematical elements 14
15 so that the backscattered signal from each point scatterer was simulated with sufficient accuracy. The focal depth position was set at 2 cm, and a dynamic focus and expanding aperture was used on receive to retain constant imaging properties 345 throughout depth. To reduce beam sidelobes, apodization was applied (=amplitude weighting of the receiving transducer elements). A complete overview of the simulation parameters can be found in table 1. Both methods were based on ultrasonic velocity estimation of respectively blood and tissue as described below. C1. Vessel wall imaging application: measurement of vessel distension 350 When measuring vessel distension, ultrasound signals are emitted perpendicular to the vessel wall. Vessel wall motion was tracked by integrating wall velocities: z[t+ t]=z[t]+v[t] t, with z[t] the position in the vessel wall, v[t] as estimated by ultrasound (modified autocorrelation approach 2 ), and t the velocity resolution corresponding to the packet size times the pulse repetition period (3 1/1000). Only 355 the RF-data of the arterial wall were processed for this application, hence neglecting a potential effect of the flow motion on the wall velocity estimator. Compared to the flow imaging application, an imaging setup with much higher resolution was required (i.e. shorter pulselength and higher frequency). The 12L linear array probe (GE Medical Systems, Milwaukee, WI, USA), as used in the applied distension software 2, 360 7, was modeled with a 1.5 period sinusoidal pulse excitation of 8 MHz centre frequency. Due to the lower velocity range of tissue compared to blood, a lower PRF of 1 khz was applied. Details of the ultrasound set-up are provided in Table 1. C2. Flow imaging application: measurement of wall shear rate For this application, the tube phantom was angled 70 degrees with respect to the 365 ultrasound beam (=axial) direction, which is of the same order of magnitude as when 15
16 measuring carotid blood flow in vivo. Velocity profiles in the axial direction were obtained using the autocorrelation algorithm described for ultrasound applications by Kasai et al 21, as most often used in color flow imaging. An ensemble of ultrasonic pulses is fired along the arterial cross-section and the phase-shift between the 370 backscattered ultrasonic waves was estimated. The axial velocity v z was calculated ^ cprf Im( R(1)) according to: v z arctan( ), with PRF (=pulse repetition frequency) the ^ 4 f0 Re( R(1)) frequency of emitting ultrasound beams, f 0 the centre frequency of the ultrasound ^ pulse and R (1) the estimated autocorrelation function at lag 1. The Doppler signal from blood is completely defined by the autocorrelation function since it can be 375 described by a complex Gaussian proces, and hence R (1) can be approximated with N N-1 pairs of complex samples Z: 1 1 R ˆ(1) Z( i 1) Z *( i). N 1 i 1 Note that only the RF-signal from the blood was used to estimate flow velocities. Hence, no clutter filter was applied to the data. A 4-period sinusoidal excitation pulse with 5 MHz centre frequency was chosen. Velocity profiles halfway the tube were 380 obtained using a packet of 64 (=N) pulses emitted with a PRF of 8 khz, resulting in 120 frames for the complete cardiac cycle. As described by 20, the two-dimensional distribution of angle-corrected velocities was smoothed by a 2D median filter (2 pulselengths in depth and 3 cardiac frames) to remove occasional extreme velocity values. A sliding window averaging filter was used to remove further fluctuations. In 385 the results, all displayed velocities are angle-corrected velocities and thus represent velocities along the axis of the tube. 16
17 Results For all three simulated cases, converged FSI simulations of two cardiac cycles were 390 obtained within 12 hr. These FSI-datasets provided reference data on the deformation of the vessel wall and on the flow field and derived wall shear rate. RFdata of the complete cardiac cycle were obtained from the ultrasound simulations within 1.7 hr and 16 hr. for respectively the fluid and structural part on 3.4 GHz Intel Pentium IV processors. 395 A.Vessel wall imaging application: measurement of vessel distension RF ultrasound data for the wall were generated from the FSI-US coupling procedure, and are displayed as an M-Mode image in fig. 3-A. Using the distension software of Rabben et al 2, the motion of the anterior and posterior intima-lumen transitions was tracked ( inner wall tracking), as shown in fig. 3-A. Subtracting these tracking curves 400 yielded the vessel diameter distension waveform, as displayed for the 4% arterial distension in fig.3-b (gray curve). An excellent match with the distension curve directly derived from the FSI simulations (black curve) was achieved (for all three cases). For the three simulated degrees of distension, the distension waveform obtained from the FSI-US coupling procedure is shown for the inner and outer wall 405 tracking in Fig. 3-C & D. In fig. 4, we further analyzed arterial distension using the circumferential strain D/D, which is frequently used in clinical practice as a measure of arterial distensibility. Using the simulated RF-data, the circumferential strain D/D was computed at several depths within the wall for all three distension degrees, as indicated by the 410 dashed lines in fig. 4. Assuming an incompressible material and neglecting deformation along the vessel axis, the theoretical D/D- curves were also computed 17
18 and indicated by the solid lines. While the circumferential strain D/D obtained from theoretical calculation as well as FSI computations resulted in a 1/D 2 -relationship, this was not the case for the wall tracking based on the FSI-US coupling procedure. 415 Interestingly, there was a very good match between theory and ultrasound wall tracking based on the FSI-US data of the inner and outer wall tracking. However, tracking based on points within the vessel wall resulted in an S-shaped relationship between D/D and depth in the arterial wall. B.Flow imaging application: measurement of wall shear rate 420 Fig. 5 shows the two-dimensional velocity (angle-corrected values) and derived shear rate distribution in depth and time, obtained from the FSI-US coupling procedure for the three simulated cases. Since mass flow inlet boundary conditions were applied, smaller distensions resulted in higher velocities and shear rate profiles. For all cases, FSI-US shear rate reaches its maximum value at a certain distance from the wall. Fig shows in more detail the correspondence between the ground truth information (velocity profile and shear rate obtained from the FSI data) and the simulated ultrasound measurements, in case of the largest distension and for two different cardiac frames (as indicated on the velocity curve imposed at the tube inlet). FSI-US derived maximal shear rate is systematically lower than the reference value derived 430 from the FSI simulations, with the largest discrepancy appearing near peak systole. This is also demonstrated in the upper panels of fig. 7 showing the maximal shear rate curve throughout the cardiac cycle for the three simulated cases. The lower panels of fig. 7 reveal the position of the maximal shear rate in the cardiac cycle as obtained from the FSI-US data, compared to the actual wall position. There was no 435 clear relation between the location of maximal shear rate and the actual position of the arterial wall. However, one can notice that the position of the ultrasound-derived 18
19 maximal shear rate shows an asymmetrical trend compared to the vessel centre: maximal shear rate is measured closer to the posterior wall than to the anterior wall for all distension degrees (see also figure 7). For the anterior wall, the average 440 distance between the position of maximal shear rate and the wall was 0.747±0.119, 0.815±0.185 and 0.810±0.138 mm for the 1%, 4% and 9% distension case, respectively. For the posterior wall, values were 0.626±0.119, 0.647±0.138 and 0.689±0.155 mm. Despite the fact that the maximal shear rate obtained from FSI-US is lower than the 445 maximal FSI values, it is clear from fig. 7 that both values show similar patterns throughout the cardiac cycle and that they are correlated. To assess whether this correlation is the same for the three simulated cases, the shear rate values obtained from FSI-US simulations are plotted versus the FSI ground truth values in figure 8. Both curves were aligned in time (using the peak as reference) to account for the 450 temporal filtering effect resulting from the averaging and smoothing operations on the FSI-US velocity curves. Ultrasound significantly underestimated the actual wall shear rate for all three distension degrees but the same linear trend was observed for the different cases (y=0.44x+65 1/s). It is clear that the underestimation by ultrasound augments for increasing shear rate values. For an FSI reference value of 200 1/s, the 455 underestimation is about 25%, increasing to about 50% for a reference value of 800 1/s. 19
20 460 Discussion The work presented in this study is an extension of our previously described method of coupling CFD and Field II ultrasound simulations, allowing us retrieving RF-signals from complex flow fields with flexible control of flow and imaging parameters 3. Using this tool, different uni- and multidimensional flow imaging methods were evaluated in 465 the presence of complex flow 6. However, this simulation tool was based on flow simulations assuming rigid walls, neither did it allow us to derive RF-data from the vessel wall itself. Therefore, we extended our approach and coupled the Field II ultrasound simulation software with flow and tissue data obtained from FSIsimulations, which take into account the complex interaction between fluid and 470 arterial wall mechanics when solving the flow and structural equations. As for the CFD-US simulation environment, RF-signals were simulated with the Field II ultrasound software where tissue is represented by point scatterers. Scatterer positions were derived from the fluid velocity and structural displacement fields as computed by an in-house FSI-code ( Tango ) which allows to couple Fluent with 475 Abaqus. To validate the coupling procedure (in particular the computation of the fluid and structure scatterer phantom) and to demonstrate the potential of the multiphysics model, we simulated the flow in a deforming straight 3D tube with dimensions and fluid characteristics representative for blood flow in the common carotid artery. Three different degrees of arterial distension were modeled and the 480 potential of the simulation tool was demonstrated with ultrasonic distension and wall shear rate measurements. Integration of biomechanics and ultrasonic analysis is not novel, but in most studies either the biomechanical part has been simplified (using analytical equations or in- 20
21 vivo measurements for the flow and/or mechanical behaviour ), either the 485 ultrasound physics model has been compromised 25. The work showing the closest agreement with ours was recently published by Balocco et al 26, who proposed a simulation model where the Field II simulation software is integrated with fluidstructure interaction as computed by COMSOL multiphysics. The simulated RF-lines were further processed to produce B-mode, M-mode images, and Doppler blood 490 velocity estimations. Our study extends on our previous CFD-based model, and we elaborate on the scatterer phantom creation and in particular the difficulties related to the interpolation in time and space of scatterer positions in a deforming geometry, which is a non-trivial problem. As for the fluid-structure interaction simulations, we used an in-house code (Tango) which allows to (strongly) couple any black-box CFD 495 and structural solver (in our case Fluent with Abaqus). The described methodology is therefore generically applicable. We further applied our simulation tool to ultrasonic measurements of hemodynamic (wall shear rate) and mechanical (vessel distension) indices of arterial function. These techniques are commonly applied in pre-clinical vascular research, but there is still a lack of clarity concerning the accuracy (shear 500 rate) and the link with intrinsic mechanical properties (vessel distension) hampering their use on a larger scale in clinical studies. Multiphysics models as presented here and by Balocco et al. will allow us to ultimately reveal the effectiveness and reliability of these imaging modalities. Although a validation of our model in a strict sense is not straightforward, our results 505 clearly indicate that our approach provides RF-data leading to realistic ultrasound images (as we also previously demonstrated for the CFD-US simulations 27 ). For the vessel wall imaging, the distension curve as obtained by tracking Abaqus nodes from the FSI-simulation was compared to the ultrasonic wall tracking result at a similar 21
22 depth in the vessel wall (fig. 3). This was shown in fig.3-b for the 4%-distension case 510 with a quasi perfect match between input and output of the FSI-US coupling procedure, and a similar level of agreement was obtained for the two other cases. The fluid phantom used for the FSI-US integration resulted in velocity profiles showing a clear resemblance with the Fluent solution (fig.6), and demonstrating typical deviations from the actual velocity profile (especially near the wall) as can be 515 expected from ultrasound measurements. Data are also in good quantitative as well as qualitative agreement with in vivo data reported by Hoeks et al. and Brands et al 9, 20. We subsequently focused on two applications of clinically relevant vascular imaging methods, one involving the arterial wall and one involving the blood flow. A 520 commonly applied measure for arterial distensibility is D/D (= circumferential strain in case of planar deformation). Ultrasonic wall tracking algorithms have been developed to track vessel wall motion based on integrating estimated tissue velocities 2. The RF wall tracking based on our FSI-simulations demonstrated that D/D is very sensitive to measurement location (cfr. fig. 4), with a decreasing trend in 525 D/D from inner to outer wall, confirming results from previous in-vivo studies 7. Although we expected a 1/D 2 dependency on theoretical grounds, we rather obtained an S-curve of D/D, which was flattened in the neighborhood of tissue transitions. This curve flattening can be explained by the strong (specular) reflections present near the vessel wall boundaries, which blur the velocity measurement in its 530 immediate neighborhood. Indeed, when repeating the ultrasound simulations without specular reflections, the theoretical 1/D 2 dependency was obtained (data not shown). Hence, deducing deformation trends and material properties of the studied vessel wall tissue based solely on wall tracking measurements within the arterial wall may 22
23 lead to flawed interpretations. This might particularly be the case in the presence of 535 arterial calcifications, causing sharp echographic interfaces in the arterial wall. Considering the flow field application, simulation of wall shear rate assessment prevailed excellent agreement with the findings of Brands et al 9, 20, who demonstrated that the maximum of ultrasound-derived wall shear rate was obtained at a certain distance from the wall. We could not observe a relation in the location of 540 maximal shear rate and vessel distension, but maximal shear rate location was closer to the posterior than anterior wall, when calculating the average distance between the vessel wall and maximal shear rate location. The observed distances were in the same order as can be derived from the data shown in Brands et al 9 (± 833μm when deriving this from their reported figures). The (small) difference between FSI-US 545 velocity measurements at the anterior and posterior wall is related to the ultrasound physics (e.g. point spread function of the ultrasound system is asymmetrical in the depth direction with higher intensities below than above the imaged point) and not to the numerical FSI calculations, which show axial symmetry in the results. 550 Brands et al tested their wall shear rate measurements in-vivo and in-vitro. For 30 invivo carotid examinations, they found a low variance on the reproducibility of the wall shear rate measurement (5%) 9. The in-vitro study entailed validation with laser Doppler anemometry (LDA) in a flow model of a distensible tube. However, a larger discrepancy of 11 % was reported between both methods 9. Note that LDA has a similar limitation as ultrasound in the sense that it does not allow measurement of 555 flow velocities near a moving wall. Hence, this in-vitro validation does not act as a real reference value for the actual shear rate. It is here that our FSI-US model has an added value. In Figure 8, we have plotted the maximal shear rates as estimated by ultrasound versus the FSI ground truth values. Interestingly, a similar linear relation 23
24 was revealed for all distension degrees, suggesting that the underestimation by 560 ultrasound could be compensated for (at least for the simulated setting). It is important to stress that in our analysis, we compare the peak values of the FSI-US and the FSI shear rate, and these do not occur at the same locations. When considering their relationship at the same positions in depth, a better quantitative agreement is obtained especially near the posterior wall. This is illustrated in fig.6: 565 when comparing the FSI-value at the same location as where the ultrasound-derived value reaches its peak (indicated by the ellipse), the numerical values of shear rate are close. This is in line with the experimental validation results of Brands et al 9, who compared ultrasound- and LDA-derived values at the same measuring position Finally, it is worth mentioning that in pulsatile flow conditions, the maximal shear rate 570 not necessarily occurs at the position of the wall itself even for the simple case of a straight tube (as illustrated by Figure 6). Note, however, that further optimization of the simulation of shear rate imaging is necessary before drawing hard conclusions with respect to real-life in vivo applications. In particular, the ultrasound signal generated by the wall should be 575 taken into account as well as an extensive study of the influence on the applied clutter filter, which was neglected in this study. Also, the settings applied during processing of the ultrasound data (e.g. temporal and spatial filtering) are crucial for the estimates of velocity and even more for the obtained values of the wall shear rate. As such, the simulations should be well matched with the settings used for the in-vivo 580 imaging. Further, the simulated cases here represent blood flow in straight arterial segments, with a fully developed symmetrical inflow velocity profile. It can be anticipated that in bended arteries and in the vicinity of complex bifurcations (such as the carotid artery), the flow profile will be far more complex. In these conditions, the 24
25 correspondence between ultrasound-based estimates of wall shear rate and their 585 actual values will, without any doubt, be far more complex. Although the multiphysics model as presented in this study represents a major improvement over our existing model, limitations are still present, both at the biomechanical and acoustical level. Concerning the FSI-simulations, different distension degrees could have been modeled by applying stiffer material properties. 590 However, since we were only interested in wall movement and not wall stresses, we only scaled the pressure wave. More realistic material behavior including anisotropic and hyperelastic material properties could have been modeled (at the expense of higher computational times). The influence of the surrounding tissue on the vessel wall movement, residual stresses and effects of longitudinal pre-stretch of the 595 structure could be taken into account in future work. Further, the boundary conditions to solve the fluid problem could be refined by applying a physiologically realistic vascular impedance as outlet boundary condition, inducing more realistic wave propagation phenomena in the tube. The Field II method is also based on some assumptions: nonlinear propagation of 600 ultrasound waves and multiple scattering are not included, with the latter one limiting the accuracy of distension measurements in-vivo. The Field II-approach also ignores the shape of the scatterers (disc shaped red blood cells). We did not include frequency dependent scattering or noise in our simulations. Furthermore, the tissue echogenic properties are simulated as a combination of random scatters in the wall 605 and mimicked specular reflections along the inner and outer boundary of the wall. Although this results in realistically looking RF spectra, further fine-tuning and optimization towards RF-spectra of actual tissue may be mandatory, especially when simulating more complex arterial tissues with the inclusion of vessel inhomogeneities 25
26 and plaque. In particular, the fibrous structure of the vessel wall which leads to 610 scattering correlation in the fiber direction could be included in the phantom modeling. It should also be stressed that the distension data are solely based on RF-signals from the wall, while the shear rate application relied only on RF-signals from the flow. The shown applications should therefore mainly be considered as a demonstration of the potential of the simulation tool in developing vascular imaging tools, rather than a 615 thorough validation of each of these applications. It is, for that matter, most likely that the imaging and signal processing setups can be further optimized for each specific application. In summary, we demonstrated a simulation environment to validate and develop 620 ultrasonic vascular imaging applications. An elaborate technique to integrate fluidstructure interaction (FSI) and the Field II ultrasound simulation software was presented. This multiphysics ultrasound simulation environment was applied to two ultrasound imaging applications where distensible ultrasound phantoms are indispensable for their analysis: wall distension and wall shear rate measurement, applied to the case of a straight 3D tube subjected to three levels of distension. The 625 RF wall tracking algorithm was able to quasi perfectly track the motion of the inner and outer vessel wall. As anticipated, distension measurements showed a high sensitivity to measurement location in the wall but the simulations also revealed that strong specular reflections from tissue transitions potentially cloud correct measurements within the media of the vascular wall. Further, the flow imaging 630 application revealed that maximal shear rate was measured at a certain distance from the vessel wall as previously demonstrated in vivo by Brands et al 9, 20 and that the location where measured shear rate is maximal, is closer to the posterior than to anterior wall. For the three simulated cases, a similar linear trend between ultrasound 26
27 estimated shear rate and the FSI-ground truth was found, suggesting that the 635 underestimated ultrasound values could be corrected for. Based on the above observations, we conclude that our method to couple fluid-structure interaction and ultrasound simulations provides realistic radio-frequent signals from both the tissue and the blood pool which can be processed into ultrasound-derived medical images and measurements. Further research will focus on applications for the ultrasonic 640 investigation of the carotid bifurcation
28 ACKNOWLEDGMENTS We like to thank Stein-Inge Rabben for his valuable input on his distension software. 660 Abigail Swillens is supported by a grant of the Special Fund for Scientific Research of the Ghent University (BOF). Joris Degroote is supported by a PhD fellowship of the Research Foundation - Flanders (FWO). The authors obtained funding from the FWO (Krediet aan Navorsers N)
29 TABLES Table 1: Simulation setup for respectively the flow (F) and wall (W) application Ultrasound set-up parameters for the shear rate and wall distension application Blood flow Wall distension f 0 =centre frequency 5 MHz 8 MHz # elements Pitch 246μm 203 μm Height 6 mm 3.25 mm Focus 2 cm 2 cm Dynamic receive focusing Yes Yes Expanding aperture Yes Yes Excitation Sinusoidal Sinusoidal Pulseperiods PRF max 8000 Hz 8000 Hz PRF 8000 Hz 1000 Hz Packetsize 64 3 Assigned scatterer properties Mean amplitude STD Inner wall (~specular reflections) Outer wall (~specular reflections) Wall Blood
30 675 FIGURE LEGENDS Figure 1: Panel A: Illustration of the principles behind the creation of the fluid scatterer phantom. In case of distensible fluid geometries, absolute positions can not be compared between two time steps and hence linear interpolation of the velocity fields is not straightforward. Instead, the velocity field at the future timestep T 2,FSI is 680 used to derive the scatterer displacement. Scatterers are mapped in space to the next timestep using the fluid grid displacement and hence the same relative position of the scatterer in the vessel is obtained. Once the future position of the concerned scatterer is determined, the velocity vector is extracted. Using these future velocity vectors, the scatterers will follow the vessel wall motion. This is illustrated in case of 685 an increasing and decreasing fluid volume. In the latter case, the same absolute position of the red point at T FSI,1 is a point outside the fluid volume. In the former case the red point ends up too far from the vessel wall, indicating the need for mapping scatterer positions conserving the relative position in the vessel wall. Panel B: A flowchart of the creation of the fluid phantom 690 Figure 2: Illustration of the principles behind the creation of the structure scatterer phantom. The vessel wall is divided in several layers using hexahedral elements, allowing flexibility in changing scattering properties according to the concerned vessel layer. Due to the complex composition of the vessel wall (potentially including calcifications etc ), scatterers were created in the individual hexahedrons. A random 695 uniform spatial distribution was obtained by creating them in a bounding box and deleting scatterers outside the considered hexahedron. Besides these random scatterers, specular reflections created by tissue transition regions were mimicked by placing scatterers at fixed distances at the wet and dry side of the structure. 30
31 Figure 3: M-mode images were created based on RF-data obtained from the FSI-US 700 coupling procedure, for the three simulated degrees of distension. These were further used for tracking the vessel wall motion using a modified autocorrelation approach 2. Panel A shows an RF M-mode image for the 4% distension case. Inner and outer wall tracking are shown for all cases in panels C and D. Panel B shows the comparison between the ultrasound wall tracking and the ground truth obtained from 705 tracking Abaqus nodes. Figure 4: The circumferential strain D/D for all distension degrees obtained with the FSI-US coupling procedure (dashed lines) and compared to the theoretical relationship (solid lines). Figure 5: The two-dimensional velocity and shear rate distribution in depth and time 710 for all degrees of distension. Figure 6: The velocity and shear rate profiles obtained from the FSI-US coupling procedure (gray) are compared to the FSI ground truth (black) at 2 cardiac frames, as indicated on the velocity curve imposed at the tube inlet. The ellipse indicates the posterior wall has a better agreement of FSI-US and FSI shear rates in space, 715 compared to the anterior wall. Figure 7: The upper panels show, for the 3 degrees of distension, the maximal shear rate throughout the cardiac cycle as derived from the FSI-data and from the FSI-US simulations. The lower panels show the position of the maximal shear rate compared to the actual wall position. The average distance of the maximal shear rate to the wall 720 position is given for the anterior and posterior side. 31
32 Figure 8: Correlation between the maximal shear rate as estimated by ultrasound and the FSI ground truth values for all distension degrees. For the three simulated cases, a similar linear trend is found (y = 0.44 x /s). 32

33 FIGURES Figure 1 A B 33

34 Figure 2 34

35 Figure 3 35
36 Figure 4 36

37 Figure 5 37
Isogeometric Analysis of Fluid-Structure Interaction
 Isogeometric Analysis of Fluid-Structure Interaction Y. Bazilevs, V.M. Calo, T.J.R. Hughes Institute for Computational Engineering and Sciences, The University of Texas at Austin, USA e-mail: {bazily,victor,hughes}@ices.utexas.edu
Offshore Platform Fluid Structure Interaction (FSI) Simulation
 Simulation") Offshore Platform Fluid Structure Interaction (FSI) Simulation Ali Marzaban, CD-adapco Murthy Lakshmiraju, CD-adapco Nigel Richardson, CD-adapco Mike Henneke, CD-adapco Guangyu Wu, Chevron Pedro M. Vargas,
Offshore Platform Fluid Structure Interaction (FSI) Simulation Ali Marzaban, CD-adapco Murthy Lakshmiraju, CD-adapco Nigel Richardson, CD-adapco Mike Henneke, CD-adapco Guangyu Wu, Chevron Pedro M. Vargas,
Problem description. The FCBI-C element is used in the fluid part of the model.
 Problem description This tutorial illustrates the use of ADINA for analyzing the fluid-structure interaction (FSI) behavior of a flexible splitter behind a 2D cylinder and the surrounding fluid in a channel.
CFD MODELING FOR PNEUMATIC CONVEYING
 CFD MODELING FOR PNEUMATIC CONVEYING Arvind Kumar 1, D.R. Kaushal 2, Navneet Kumar 3 1 Associate Professor YMCAUST, Faridabad 2 Associate Professor, IIT, Delhi 3 Research Scholar IIT, Delhi e-mail: arvindeem@yahoo.co.in
CPM Specifications Document Healthy Vertebral:
 CPM Specifications Document Healthy Vertebral: OSMSC 0078_0000, 0079_0000, 0166_000, 0167_0000 May 1, 2013 Version 1 Open Source Medical Software Corporation 2013 Open Source Medical Software Corporation.
Hydro-elastic analysis of a propeller using CFD and FEM co-simulation
 Fifth International Symposium on Marine Propulsors smp 17, Espoo, Finland, June 2017 Hydro-elastic analysis of a propeller using CFD and FEM co-simulation Vesa Nieminen 1 1 VTT Technical Research Centre
CHAPTER 1. Introduction
 ME 475: Computer-Aided Design of Structures 1-1 CHAPTER 1 Introduction 1.1 Analysis versus Design 1.2 Basic Steps in Analysis 1.3 What is the Finite Element Method? 1.4 Geometrical Representation, Discretization
ULTRASONIC TESTING AND FLAW CHARACTERIZATION. Alex KARPELSON Kinectrics Inc., Toronto, Canada
 ULTRASONIC TESTING AND FLAW CHARACTERIZATION Alex KARPELSON Kinectrics Inc., Toronto, Canada 1. Introduction Ultrasonic Testing (UT) is a commonly used inspection method. Various techniques are employed
Example 24 Spring-back
 Example 24 Spring-back Summary The spring-back simulation of sheet metal bent into a hat-shape is studied. The problem is one of the famous tests from the Numisheet 93. As spring-back is generally a quasi-static
2-D Tank Sloshing Using the Coupled Eulerian- LaGrangian (CEL) Capability of Abaqus/Explicit
 Capability of Abaqus/Explicit") 2-D Tank Sloshing Using the Coupled Eulerian- LaGrangian (CEL) Capability of Abaqus/Explicit Jeff D. Tippmann, Sharat C. Prasad 2, and Parthiv N. Shah ATA Engineering, Inc. San Diego, CA 923 2 Dassault
2-D Tank Sloshing Using the Coupled Eulerian- LaGrangian (CEL) Capability of Abaqus/Explicit Jeff D. Tippmann, Sharat C. Prasad 2, and Parthiv N. Shah ATA Engineering, Inc. San Diego, CA 923 2 Dassault
Development and validation of a short-lag spatial coherence theory for photoacoustic imaging
 Development and validation of a short-lag spatial coherence theory for photoacoustic imaging Michelle T. Graham 1 and Muyinatu A. Lediju Bell 1,2 1 Department of Electrical and Computer Engineering, Johns
Development of an Integrated Computational Simulation Method for Fluid Driven Structure Movement and Acoustics
 Development of an Integrated Computational Simulation Method for Fluid Driven Structure Movement and Acoustics I. Pantle Fachgebiet Strömungsmaschinen Karlsruher Institut für Technologie KIT Motivation
Challenge Problem 5 - The Solution Dynamic Characteristics of a Truss Structure
 Challenge Problem 5 - The Solution Dynamic Characteristics of a Truss Structure In the final year of his engineering degree course a student was introduced to finite element analysis and conducted an assessment
CFD simulations of blood flow through abdominal part of aorta
 CFD simulations of blood flow through abdominal part of aorta Andrzej Polanczyk, Aleksandra Piechota Faculty of Process and Enviromental Engineering, Technical University of Lodz, Wolczanska 13 90-94 Lodz,
Certificate in Clinician Performed Ultrasound (CCPU)
") Certificate in Clinician Performed Ultrasound (CCPU) Syllabus Physics Tutorial Physics Tutorial Purpose: Training: Assessments: This unit is designed to cover the theoretical and practical curriculum for
Certificate in Clinician Performed Ultrasound (CCPU) Syllabus Physics Tutorial Physics Tutorial Purpose: Training: Assessments: This unit is designed to cover the theoretical and practical curriculum for
Microwell Mixing with Surface Tension
 Microwell Mixing with Surface Tension Nick Cox Supervised by Professor Bruce Finlayson University of Washington Department of Chemical Engineering June 6, 2007 Abstract For many applications in the pharmaceutical
UMASIS, an analysis and visualization tool for developing and optimizing ultrasonic inspection techniques
 17th World Conference on Nondestructive Testing, 25-28 Oct 2008, Shanghai, China UMASIS, an analysis and visualization tool for developing and optimizing ultrasonic inspection techniques Abstract Joost
Analysis Comparison between CFD and FEA of an Idealized Concept V- Hull Floor Configuration in Two Dimensions
 2010 NDIA GROUND VEHICLE SYSTEMS ENGINEERING AND TECHNOLOGY SYMPOSIUM MODELING & SIMULATION, TESTING AND VALIDATION (MSTV) MINI-SYMPOSIUM AUGUST 17-19 DEARBORN, MICHIGAN Analysis Comparison between CFD
1.2 Numerical Solutions of Flow Problems
 1.2 Numerical Solutions of Flow Problems DIFFERENTIAL EQUATIONS OF MOTION FOR A SIMPLIFIED FLOW PROBLEM Continuity equation for incompressible flow: 0 Momentum (Navier-Stokes) equations for a Newtonian
Ultrasonic Multi-Skip Tomography for Pipe Inspection
 18 th World Conference on Non destructive Testing, 16-2 April 212, Durban, South Africa Ultrasonic Multi-Skip Tomography for Pipe Inspection Arno VOLKER 1, Rik VOS 1 Alan HUNTER 1 1 TNO, Stieltjesweg 1,
This tutorial illustrates how to set up and solve a problem involving solidification. This tutorial will demonstrate how to do the following:
 Tutorial 22. Modeling Solidification Introduction This tutorial illustrates how to set up and solve a problem involving solidification. This tutorial will demonstrate how to do the following: Define a
Lab 9: FLUENT: Transient Natural Convection Between Concentric Cylinders
 Lab 9: FLUENT: Transient Natural Convection Between Concentric Cylinders Objective: The objective of this laboratory is to introduce how to use FLUENT to solve both transient and natural convection problems.
Coupled Analysis of FSI
 Coupled Analysis of FSI Qin Yin Fan Oct. 11, 2008 Important Key Words Fluid Structure Interface = FSI Computational Fluid Dynamics = CFD Pressure Displacement Analysis = PDA Thermal Stress Analysis = TSA
Introduction to ANSYS CFX
 Workshop 03 Fluid flow around the NACA0012 Airfoil 16.0 Release Introduction to ANSYS CFX 2015 ANSYS, Inc. March 13, 2015 1 Release 16.0 Workshop Description: The flow simulated is an external aerodynamics
SDC. Engineering Analysis with COSMOSWorks. Paul M. Kurowski Ph.D., P.Eng. SolidWorks 2003 / COSMOSWorks 2003
 Engineering Analysis with COSMOSWorks SolidWorks 2003 / COSMOSWorks 2003 Paul M. Kurowski Ph.D., P.Eng. SDC PUBLICATIONS Design Generator, Inc. Schroff Development Corporation www.schroff.com www.schroff-europe.com
CFD modelling of thickened tailings Final project report
 26.11.2018 RESEM Remote sensing supporting surveillance and operation of mines CFD modelling of thickened tailings Final project report Lic.Sc.(Tech.) Reeta Tolonen and Docent Esa Muurinen University of
COMPUTATIONAL FLUID DYNAMICS ANALYSIS OF ORIFICE PLATE METERING SITUATIONS UNDER ABNORMAL CONFIGURATIONS
 COMPUTATIONAL FLUID DYNAMICS ANALYSIS OF ORIFICE PLATE METERING SITUATIONS UNDER ABNORMAL CONFIGURATIONS Dr W. Malalasekera Version 3.0 August 2013 1 COMPUTATIONAL FLUID DYNAMICS ANALYSIS OF ORIFICE PLATE
Modeling the Acoustic Scattering from Axially Symmetric Fluid, Elastic, and Poroelastic Objects due to Nonsymmetric Forcing Using COMSOL Multiphysics
 Modeling the Acoustic Scattering from Axially Symmetric Fluid, Elastic, and Poroelastic Objects due to Nonsymmetric Forcing Using COMSOL Multiphysics Anthony L. Bonomo *1 and Marcia J. Isakson 1 1 Applied
Solved with COMSOL Multiphysics 4.2
 Peristaltic Pump Solved with COMSOL Multiphysics 4.2 Introduction In a peristaltic pump, rotating rollers squeeze a flexible tube. As the pushed-down rollers move along the tube, fluids in the tube follow
Turbulent Premixed Combustion with Flamelet Generated Manifolds in COMSOL Multiphysics
 Turbulent Premixed Combustion with Flamelet Generated Manifolds in COMSOL Multiphysics Rob J.M Bastiaans* Eindhoven University of Technology *Corresponding author: PO box 512, 5600 MB, Eindhoven, r.j.m.bastiaans@tue.nl
Finite Element Modeling and Multiphysics Simulation of Air Coupled Ultrasonic with Time Domain Analysis
 More Info at Open Access Database www.ndt.net/?id=15194 Finite Element Modeling and Multiphysics Simulation of Air Coupled Ultrasonic with Time Domain Analysis Bikash Ghose 1, a, Krishnan Balasubramaniam
MODELING OF A MICRO-GRIPPER COMPLIANT JOINT USING COMSOL MULTIPHYSICS SIMULATION
 MODELING OF A MICRO-GRIPPER COMPLIANT JOINT USING COMSOL MULTIPHYSICS SIMULATION Mihăiţă Nicolae ARDELEANU, Veronica DESPA, Ioan Alexandru IVAN Valahia University from Targoviste E-mail: mihai.ardeleanu@valahia.ro,
Guidelines for proper use of Plate elements
 Guidelines for proper use of Plate elements In structural analysis using finite element method, the analysis model is created by dividing the entire structure into finite elements. This procedure is known
CHAPTER 4. Numerical Models. descriptions of the boundary conditions, element types, validation, and the force
 CHAPTER 4 Numerical Models This chapter presents the development of numerical models for sandwich beams/plates subjected to four-point bending and the hydromat test system. Detailed descriptions of the
2008 International ANSYS Conference
 2008 International ANSYS Conference FEM AND FSI SIMULATIONS OF IMPACT LOADS ON GRP SUBSEA COMPOSITE COVERS Kjetil Rognlien, MSc Technical Consultant EDR AS, Norway 2008 ANSYS, Inc. All rights reserved.
Driven Cavity Example
 BMAppendixI.qxd 11/14/12 6:55 PM Page I-1 I CFD Driven Cavity Example I.1 Problem One of the classic benchmarks in CFD is the driven cavity problem. Consider steady, incompressible, viscous flow in a square
NUMERICAL STUDY OF BLOOD FLOW IN A VESSEL WITH INCREASING DEGREE OF STENOSIS USING DYNAMIC MESHES
 XIII CONGRESO INTERNACIONAL DE INGENIERÍA DE PROYECTOS Badajoz, 8-10 de julio de 2009 NUMERICAL STUDY OF BLOOD FLOW IN A VESSEL WITH INCREASING DEGREE OF STENOSIS USING DYNAMIC MESHES Ana Cristina Ferreira,
Fluid Structure Interaction - Moving Wall in Still Water
 Fluid Structure Interaction - Moving Wall in Still Water Outline 1 Problem description 2 Methodology 2.1 Modelling 2.2 Analysis 3 Finite Element Model 3.1 Project settings 3.2 Units 3.3 Geometry Definition
Simulating Sinkage & Trim for Planing Boat Hulls. A Fluent Dynamic Mesh 6DOF Tutorial
 Simulating Sinkage & Trim for Planing Boat Hulls A Fluent Dynamic Mesh 6DOF Tutorial 1 Introduction Workshop Description This workshop describes how to perform a transient 2DOF simulation of a planing
SIMULATING ARBITRARY-GEOMETRY ULTRASOUND TRANSDUCERS USING TRIANGLES
 Jørgen Arendt Jensen 1 Paper presented at the IEEE International Ultrasonics Symposium, San Antonio, Texas, 1996: SIMULATING ARBITRARY-GEOMETRY ULTRASOUND TRANSDUCERS USING TRIANGLES Jørgen Arendt Jensen,
Multiphase flow metrology in oil and gas production: Case study of multiphase flow in horizontal tube
 Multiphase flow metrology in oil and gas production: Case study of multiphase flow in horizontal tube Deliverable 5.1.2 of Work Package WP5 (Creating Impact) Authors: Stanislav Knotek Czech Metrology Institute
Analysis of fluid-solid coupling vibration characteristics of probe based on ANSYS Workbench
 Analysis of fluid-solid coupling vibration characteristics of probe based on ANSYS Workbench He Wang 1, a, Changzheng Zhao 1, b and Hongzhi Chen 1, c 1 Shandong University of Science and Technology, Qingdao
Quantifying Three-Dimensional Deformations of Migrating Fibroblasts
 45 Chapter 4 Quantifying Three-Dimensional Deformations of Migrating Fibroblasts This chapter presents the full-field displacements and tractions of 3T3 fibroblast cells during migration on polyacrylamide
LS-DYNA 980 : Recent Developments, Application Areas and Validation Process of the Incompressible fluid solver (ICFD) in LS-DYNA.
 in LS-DYNA.") 12 th International LS-DYNA Users Conference FSI/ALE(1) LS-DYNA 980 : Recent Developments, Application Areas and Validation Process of the Incompressible fluid solver (ICFD) in LS-DYNA Part 1 Facundo Del
12 th International LS-DYNA Users Conference FSI/ALE(1) LS-DYNA 980 : Recent Developments, Application Areas and Validation Process of the Incompressible fluid solver (ICFD) in LS-DYNA Part 1 Facundo Del
Parametric Study of Sloshing Effects in the Primary System of an Isolated LFR Marti Jeltsov, Walter Villanueva, Pavel Kudinov
 1 Parametric Study of Sloshing Effects in the Primary System of an Isolated LFR 19.06.2013 Marti Jeltsov, Walter Villanueva, Pavel Kudinov Division of Nuclear Power Safety Royal Institute of Technology
CFD Analysis of 2-D Unsteady Flow Past a Square Cylinder at an Angle of Incidence
 CFD Analysis of 2-D Unsteady Flow Past a Square Cylinder at an Angle of Incidence Kavya H.P, Banjara Kotresha 2, Kishan Naik 3 Dept. of Studies in Mechanical Engineering, University BDT College of Engineering,
Application of Finite Volume Method for Structural Analysis
 Application of Finite Volume Method for Structural Analysis Saeed-Reza Sabbagh-Yazdi and Milad Bayatlou Associate Professor, Civil Engineering Department of KNToosi University of Technology, PostGraduate
CFD Modeling of a Radiator Axial Fan for Air Flow Distribution
 CFD Modeling of a Radiator Axial Fan for Air Flow Distribution S. Jain, and Y. Deshpande Abstract The fluid mechanics principle is used extensively in designing axial flow fans and their associated equipment.
3D Finite Element Software for Cracks. Version 3.2. Benchmarks and Validation
 3D Finite Element Software for Cracks Version 3.2 Benchmarks and Validation October 217 1965 57 th Court North, Suite 1 Boulder, CO 831 Main: (33) 415-1475 www.questintegrity.com http://www.questintegrity.com/software-products/feacrack
Tutorial. BOSfluids. Water hammer (part 3) Dynamic Analysis using Caesar II
 Dynamic Analysis using Caesar II") BOSfluids Tutorial Water hammer (part 3) Dynamic Analysis using Caesar II The Water hammer tutorial is a 3 part tutorial describing the phenomena of water hammer in a piping system and how BOSfluids can
BOSfluids Tutorial Water hammer (part 3) Dynamic Analysis using Caesar II The Water hammer tutorial is a 3 part tutorial describing the phenomena of water hammer in a piping system and how BOSfluids can
Advanced Image Reconstruction Methods for Photoacoustic Tomography
 Advanced Image Reconstruction Methods for Photoacoustic Tomography Mark A. Anastasio, Kun Wang, and Robert Schoonover Department of Biomedical Engineering Washington University in St. Louis 1 Outline Photoacoustic/thermoacoustic
Mutltiphysics for Ironcad Demonstration Models (Rev. 1.1)
") Centrifuge Model The centrifuge model demonstrates how to perform a rotational spinning centrifugal load analysis. It also demonstrates how to group different parts with/without the intended initial bonding
Centrifuge Model The centrifuge model demonstrates how to perform a rotational spinning centrifugal load analysis. It also demonstrates how to group different parts with/without the intended initial bonding
A fast breast nonlinear elastography reconstruction technique using the Veronda-Westman model
 A fast breast nonlinear elastography reconstruction technique using the Veronda-Westman model Mohammadhosein Amooshahi a and Abbas Samani abc a Department of Electrical & Computer Engineering, University
Simulation of NDT Inspection in 3D Elastic Waveguide Involving Arbitrary Defect
 19 th World Conference on Non-Destructive Testing 2016 Simulation of NDT Inspection in 3D Elastic Waveguide Involving Arbitrary Defect Vahan BARONIAN 1, Karim JEZZINE 2 1 CEA LIST, Gif-sur-Yvette, France
Implementation and Comparison of Four Different Boundary Detection Algorithms for Quantitative Ultrasonic Measurements of the Human Carotid Artery
 Implementation and Comparison of Four Different Boundary Detection Algorithms for Quantitative Ultrasonic Measurements of the Human Carotid Artery Masters Thesis By Ghassan Hamarneh Rafeef Abu-Gharbieh
Module 1: Introduction to Finite Element Analysis. Lecture 4: Steps in Finite Element Analysis
 25 Module 1: Introduction to Finite Element Analysis Lecture 4: Steps in Finite Element Analysis 1.4.1 Loading Conditions There are multiple loading conditions which may be applied to a system. The load
Co-Simulation von Flownex und ANSYS CFX am Beispiel einer Verdrängermaschine
 Co-Simulation von Flownex und ANSYS CFX am Beispiel einer Verdrängermaschine Benoit Bosc-Bierne, Dr. Andreas Spille-Kohoff, Farai Hetze CFX Berlin Software GmbH, Berlin Contents Positive displacement compressors
Acoustic Field Comparison of High Intensity Focused Ultrasound by using Experimental Characterization and Finite Element Simulation
 Acoustic Field Comparison of High Intensity Focused Ultrasound by using Experimental Characterization and Finite Element Simulation J. L. Teja, A. Vera, and L. Leija Department of Electrical Engineering,
Simulation of Flow Development in a Pipe
 Tutorial 4. Simulation of Flow Development in a Pipe Introduction The purpose of this tutorial is to illustrate the setup and solution of a 3D turbulent fluid flow in a pipe. The pipe networks are common
Plane Wave Imaging Using Phased Array Arno Volker 1
 11th European Conference on Non-Destructive Testing (ECNDT 2014), October 6-10, 2014, Prague, Czech Republic More Info at Open Access Database www.ndt.net/?id=16409 Plane Wave Imaging Using Phased Array
EXPERIMENTAL VALIDATION OF STAR-CCM+ FOR LIQUID CONTAINER SLOSH DYNAMICS
 EXPERIMENTAL VALIDATION OF STAR-CCM+ FOR LIQUID CONTAINER SLOSH DYNAMICS Brandon Marsell a.i. solutions, Launch Services Program, Kennedy Space Center, FL 1 Agenda Introduction Problem Background Experiment
An Automated Image-based Method for Multi-Leaf Collimator Positioning Verification in Intensity Modulated Radiation Therapy
 An Automated Image-based Method for Multi-Leaf Collimator Positioning Verification in Intensity Modulated Radiation Therapy Chenyang Xu 1, Siemens Corporate Research, Inc., Princeton, NJ, USA Xiaolei Huang,
Chapter 3 Analysis of Original Steel Post
 Chapter 3. Analysis of original steel post 35 Chapter 3 Analysis of Original Steel Post This type of post is a real functioning structure. It is in service throughout the rail network of Spain as part
CFD Analysis of a Fully Developed Turbulent Flow in a Pipe with a Constriction and an Obstacle
 CFD Analysis of a Fully Developed Turbulent Flow in a Pipe with a Constriction and an Obstacle C, Diyoke Mechanical Engineering Department Enugu State University of Science & Tech. Enugu, Nigeria U, Ngwaka
The Level Set Method THE LEVEL SET METHOD THE LEVEL SET METHOD 203
 The Level Set Method Fluid flow with moving interfaces or boundaries occur in a number of different applications, such as fluid-structure interaction, multiphase flows, and flexible membranes moving in
Calculate a solution using the pressure-based coupled solver.
 Tutorial 19. Modeling Cavitation Introduction This tutorial examines the pressure-driven cavitating flow of water through a sharpedged orifice. This is a typical configuration in fuel injectors, and brings
Verification of Laminar and Validation of Turbulent Pipe Flows
 1 Verification of Laminar and Validation of Turbulent Pipe Flows 1. Purpose ME:5160 Intermediate Mechanics of Fluids CFD LAB 1 (ANSYS 18.1; Last Updated: Aug. 1, 2017) By Timur Dogan, Michael Conger, Dong-Hwan
Tutorial 2. Modeling Periodic Flow and Heat Transfer
 Tutorial 2. Modeling Periodic Flow and Heat Transfer Introduction: Many industrial applications, such as steam generation in a boiler or air cooling in the coil of an air conditioner, can be modeled as
ULTRASONIC WAVE PROPAGATION THROUGH NOZZLES AND PIPES WITH
 ULTRASONIC WAVE PROPAGATION THROUGH NOZZLES AND PIPES WITH CLADDINGS AROUND THEIR INNER WALLS INTRODUCTION A. Minachi and R. B. Thompson Center for NDE Iowa State University Ames, Iowa 5001 J The inner
Modelling Flat Spring Performance Using FEA
 Modelling Flat Spring Performance Using FEA Blessing O Fatola, Patrick Keogh and Ben Hicks Department of Mechanical Engineering, University of Corresponding author bf223@bath.ac.uk Abstract. This paper
Chapter 5 Modeling and Simulation of Mechanism
 Chapter 5 Modeling and Simulation of Mechanism In the present study, KED analysis of four bar planar mechanism using MATLAB program and ANSYS software has been carried out. The analysis has also been carried
Strömningslära Fluid Dynamics. Computer laboratories using COMSOL v4.4
 UMEÅ UNIVERSITY Department of Physics Claude Dion Olexii Iukhymenko May 15, 2015 Strömningslära Fluid Dynamics (5FY144) Computer laboratories using COMSOL v4.4!! Report requirements Computer labs must
Predicting the mechanical behaviour of large composite rocket motor cases
 High Performance Structures and Materials III 73 Predicting the mechanical behaviour of large composite rocket motor cases N. Couroneau DGA/CAEPE, St Médard en Jalles, France Abstract A method to develop
THE EFFECTS OF THE PLANFORM SHAPE ON DRAG POLAR CURVES OF WINGS: FLUID-STRUCTURE INTERACTION ANALYSES RESULTS
 March 18-20, 2013 THE EFFECTS OF THE PLANFORM SHAPE ON DRAG POLAR CURVES OF WINGS: FLUID-STRUCTURE INTERACTION ANALYSES RESULTS Authors: M.R. Chiarelli, M. Ciabattari, M. Cagnoni, G. Lombardi Speaker:
SIMULATION OF AN IMPLANTED PIFA FOR A CARDIAC PACEMAKER WITH EFIELD FDTD AND HYBRID FDTD-FEM
 1 SIMULATION OF AN IMPLANTED PIFA FOR A CARDIAC PACEMAKER WITH EFIELD FDTD AND HYBRID FDTD- Introduction Medical Implanted Communication Service (MICS) has received a lot of attention recently. The MICS
COMSOL BASED 2-D FEM MODEL FOR ULTRASONIC GUIDED WAVE PROPAGATION IN SYMMETRICALLY DELAMINATED UNIDIRECTIONAL MULTI- LAYERED COMPOSITE STRUCTURE
 Proceedings of the National Seminar & Exhibition on Non-Destructive Evaluation NDE 2011, December 8-10, 2011 COMSOL BASED 2-D FEM MODEL FOR ULTRASONIC GUIDED WAVE PROPAGATION IN SYMMETRICALLY DELAMINATED
True Advancements for Longitudinal Weld Pipe Inspection in PA
 NDT in Canada 2016 & 6th International CANDU In-Service Inspection Workshop, Nov 15-17, 2016, Burlington, ON (Canada) www.ndt.net/app.ndtcanada2016 True Advancements for Longitudinal Weld Pipe Inspection
GE Healthcare. Agile Ultrasound. The Next Revolution in Ultrasound Imaging
 Agile Ultrasound The Next Revolution in Ultrasound Imaging Abstract Diagnostic use of ultrasound has greatly expanded over the past couple of decades because it offers many advantages as an imaging modality.
Coupling of STAR-CCM+ to Other Theoretical or Numerical Solutions. Milovan Perić
 Coupling of STAR-CCM+ to Other Theoretical or Numerical Solutions Milovan Perić Contents The need to couple STAR-CCM+ with other theoretical or numerical solutions Coupling approaches: surface and volume
OPTIMIZATION OF STIFFENED LAMINATED COMPOSITE CYLINDRICAL PANELS IN THE BUCKLING AND POSTBUCKLING ANALYSIS.
 OPTIMIZATION OF STIFFENED LAMINATED COMPOSITE CYLINDRICAL PANELS IN THE BUCKLING AND POSTBUCKLING ANALYSIS. A. Korjakin, A.Ivahskov, A. Kovalev Stiffened plates and curved panels are widely used as primary
2: Static analysis of a plate
 2: Static analysis of a plate Topics covered Project description Using SolidWorks Simulation interface Linear static analysis with solid elements Finding reaction forces Controlling discretization errors
Aerodynamic Study of a Realistic Car W. TOUGERON
 Aerodynamic Study of a Realistic Car W. TOUGERON Tougeron CFD Engineer 2016 Abstract This document presents an aerodynamic CFD study of a realistic car geometry. The aim is to demonstrate the efficiency
Quantitative IntraVascular UltraSound (QCU)
") Quantitative IntraVascular UltraSound (QCU) Authors: Jouke Dijkstra, Ph.D. and Johan H.C. Reiber, Ph.D., Leiden University Medical Center, Dept of Radiology, Leiden, The Netherlands Introduction: For decades,
Quantitative IntraVascular UltraSound (QCU) Authors: Jouke Dijkstra, Ph.D. and Johan H.C. Reiber, Ph.D., Leiden University Medical Center, Dept of Radiology, Leiden, The Netherlands Introduction: For decades,
Computer Life (CPL) ISSN: Finite Element Analysis of Bearing Box on SolidWorks
 ISSN: Finite Element Analysis of Bearing Box on SolidWorks") Computer Life (CPL) ISSN: 1819-4818 Delivering Quality Science to the World Finite Element Analysis of Bearing Box on SolidWorks Chenling Zheng 1, a, Hang Li 1, b and Jianyong Li 1, c 1 Shandong University
Computer Life (CPL) ISSN: 1819-4818 Delivering Quality Science to the World Finite Element Analysis of Bearing Box on SolidWorks Chenling Zheng 1, a, Hang Li 1, b and Jianyong Li 1, c 1 Shandong University
Aurélien Thinat Stéphane Cordier 1, François Cany
 SimHydro 2012:New trends in simulation - Hydroinformatics and 3D modeling, 12-14 September 2012, Nice Aurélien Thinat, Stéphane Cordier, François Cany Application of OpenFOAM to the study of wave loads
Non-Newtonian Transitional Flow in an Eccentric Annulus
 Tutorial 8. Non-Newtonian Transitional Flow in an Eccentric Annulus Introduction The purpose of this tutorial is to illustrate the setup and solution of a 3D, turbulent flow of a non-newtonian fluid. Turbulent
Advanced ANSYS FLUENT Acoustics
 Workshop Modeling Flow-Induced (Aeroacoustic) Noise 14.5 Release Advanced ANSYS FLUENT Acoustics 2011 ANSYS, Inc. November 7, 2012 1 Introduction This tutorial demonstrates how to model 2D turbulent flow
Design Optimization of a Weather Radar Antenna using Finite Element Analysis (FEA) and Computational Fluid Dynamics (CFD)
 and Computational Fluid Dynamics (CFD)") Design Optimization of a Weather Radar Antenna using Finite Element Analysis (FEA) and Computational Fluid Dynamics (CFD) Fernando Prevedello Regis Ataídes Nícolas Spogis Wagner Ortega Guedes Fabiano Armellini
Design Optimization of a Weather Radar Antenna using Finite Element Analysis (FEA) and Computational Fluid Dynamics (CFD) Fernando Prevedello Regis Ataídes Nícolas Spogis Wagner Ortega Guedes Fabiano Armellini
Numerical Investigation of Non-Newtonian Laminar Flow in Curved Tube with Insert
 Numerical Investigation of Non-Newtonian Laminar Flow in Curved Tube with Insert A. Kadyyrov 1 1 Research center for power engineering problems Federal government budgetary institution of science Kazan
Laser speckle based background oriented schlieren measurements in a fire backlayering front
 Laser speckle based background oriented schlieren measurements in a fire backlayering front Philipp Bühlmann 1*, Alexander H. Meier 1, Martin Ehrensperger 1, Thomas Rösgen 1 1: ETH Zürich, Institute of
A nodal based evolutionary structural optimisation algorithm
 Computer Aided Optimum Design in Engineering IX 55 A dal based evolutionary structural optimisation algorithm Y.-M. Chen 1, A. J. Keane 2 & C. Hsiao 1 1 ational Space Program Office (SPO), Taiwan 2 Computational
Using a Single Rotating Reference Frame
 Tutorial 9. Using a Single Rotating Reference Frame Introduction This tutorial considers the flow within a 2D, axisymmetric, co-rotating disk cavity system. Understanding the behavior of such flows is
Workshop 15. Single Pass Rolling of a Thick Plate
 Introduction Workshop 15 Single Pass Rolling of a Thick Plate Rolling is a basic manufacturing technique used to transform preformed shapes into a form suitable for further processing. The rolling process
Modeling Submerged Structures Loaded by Underwater Explosions with ABAQUS/Explicit
 Modeling Submerged Structures Loaded by Underwater Explosions with ABAQUS/Explicit David B. Woyak ABAQUS Solutions Northeast, LLC Abstract: Finite element analysis can be used to predict the transient
Impact of 3D Laser Data Resolution and Accuracy on Pipeline Dents Strain Analysis
 More Info at Open Access Database www.ndt.net/?id=15137 Impact of 3D Laser Data Resolution and Accuracy on Pipeline Dents Strain Analysis Jean-Simon Fraser, Pierre-Hugues Allard Creaform, 5825 rue St-Georges,
Step Change in Design: Exploring Sixty Stent Design Variations Overnight
 Step Change in Design: Exploring Sixty Stent Design Variations Overnight Frank Harewood, Ronan Thornton Medtronic Ireland (Galway) Parkmore Business Park West, Ballybrit, Galway, Ireland frank.harewood@medtronic.com
Settlement of a circular silo foundation
 Engineering manual No. 22 Updated: 02/2018 Settlement of a circular silo foundation Program: FEM File: Demo_manual_22.gmk The objective of this manual is to describe the solution to a circular silo foundation
ULTRASONIC INSPECT ABILITY MODELS FOR JET ENGINE FORGINGS
 ULTRASONIC INSPECT ABILITY MODELS FOR JET ENGINE FORGINGS INTRODUCTION T. A. Gray Center for Nondestructive Evaluation Iowa State University Ames, IA 50011 Ultrasonic inspections of axially symmetric forgings,
Acknowledgements. Prof. Dan Negrut Prof. Darryl Thelen Prof. Michael Zinn. SBEL Colleagues: Hammad Mazar, Toby Heyn, Manoj Kumar
 Philipp Hahn Acknowledgements Prof. Dan Negrut Prof. Darryl Thelen Prof. Michael Zinn SBEL Colleagues: Hammad Mazar, Toby Heyn, Manoj Kumar 2 Outline Motivation Lumped Mass Model Model properties Simulation
NOISE PROPAGATION FROM VIBRATING STRUCTURES
 NOISE PROPAGATION FROM VIBRATING STRUCTURES Abstract R. Helfrich, M. Spriegel (INTES GmbH, Germany) Noise and noise exposure are becoming more important in product development due to environmental legislation.