Many Patterns & Many Methods
|
|
|
- Tyrone Preston
- 5 years ago
- Views:
Transcription


1 Many Patterns & Many Methods New methods for visualising & utilising multiple analysis techniques in polymorph and salt screening systems 2009 Gordon Barr, Chris Gilmore & Gordon Cunningham WestCHEM, Chemistry Department, University of Glasgow

2 This document was presented at PPXRD - Pharmaceutical Powder X-ray Diffraction Symposium Sponsored by The International Centre for Diffraction Data This presentation is provided by the International Centre for Diffraction Data in cooperation with the authors and presenters of the PPXRD symposia for the express purpose of educating the scientific community. All copyrights for the presentation are retained by the original authors. The ICDD has received permission from the authors to post this material on our website and make the material available for viewing. Usage is restricted for the purposes of education and scientific research. PPXRD Website ICDD Website -
3 The Problem High throughput screening experiments can generate hundreds of PXRD patterns a day Problems with: Data quality. Sample quality. Data quantity. Need for automation, and speed. How do you deal with hundreds of samples from a single technique (e.g. XRPD), let alone more than one at once?
4 How to cluster powder patterns? Compare pairs of patterns using full-profile parametric and non-parametric statistics Match every data point forget about the peaks! Use correlation coefficients: Pearson correlation coefficient (parametric). Spearman correlation coefficient (non-parametric). Correlation coefficient +1.0 Correlation coefficient -1.0

5 How to cluster powder patterns? Match two patterns: -> Get a correlation coefficient Match n patterns: Pattern A matches Pattern B with a correlation of: > Get a correlation between every pair of patterns -> can build a n x n correlation matrix
6 Correlations and Distances Have a correlation matrix Convert correlations to distances: Correlation = 1.0 distance = 0.0 Correlation = -1.0 distance = 1.0 Correlation = 0.0 distance = 0.5 Take the distance matrix and perform: Cluster analysis, Principal components analysis, Metric multidimensional scaling, Fuzzy clustering, Minimum spanning trees etc. To find interesting patterns and to visualize the data.
7 Methodology n XRPD Patterns Optional Preprocessing Full profile matching all patterns against all patterns nxn Correlation Matrix nxn Distance Matrix PCA Principal Components Analysis MMDS Metric Multi- Dimensional Scaling Clustering via Dendrograms Estimate number of clusters Identify possible mixtures Identify Most Representative Patterns for each cluster Cluster visualisation tools Colour-coded Cell Display
.")
8 Example: Doxazosin Also indexed as: Cardura XL, Cardura Doxazosin is a member of the alpha blocker family of drugs used to lower blood pressure in people with hypertension. Doxazosin is also used to treat symptoms of benign prostatic hyperplasia (BPH). Study performed using 21 patterns of 5 polymorphic forms of Doxazosin Cut Level

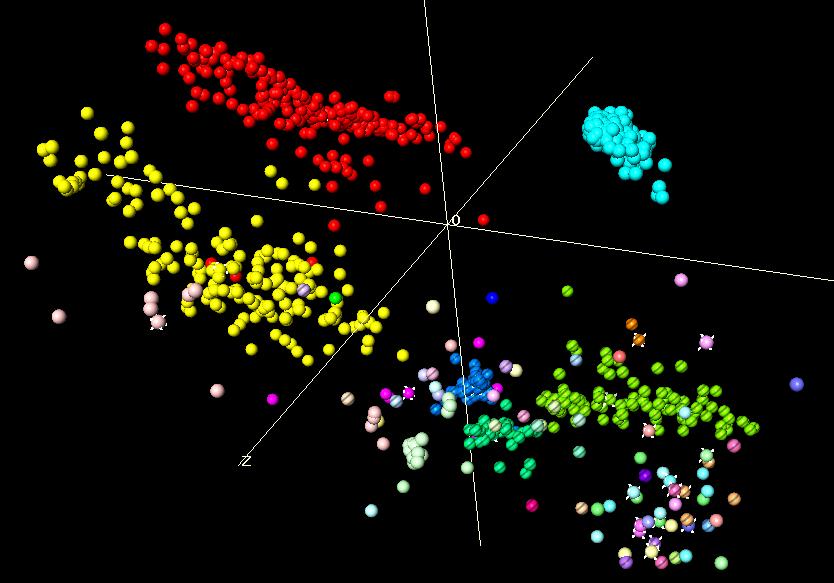
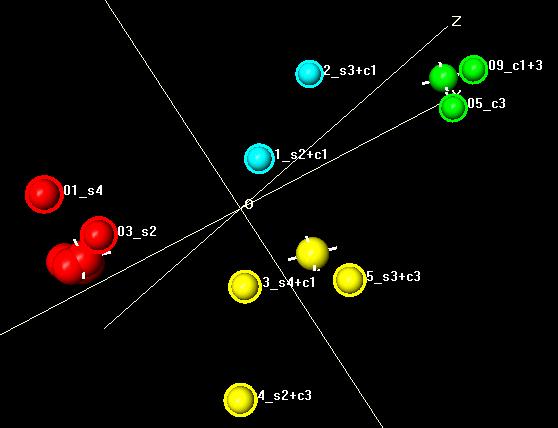
9 Metric multidimensional scaling (MMDS)


10 Example: Carbamazepine <- No background subtraction <- Normal background subtraction Strict background subtraction ->

11 A1 H1 A2 H2 A3 H3 A4 H4 A5 H5 A6 H6 A7 H7 Alpha Beta 30 % alpha, 70 % beta Gamma-Beta mixture DMSO Dioxane 1-4 Form II Dioxane Data collection by Leo Woning, Bruker-AXS

12 2000 Pattern Dendrogram


13 Raman data works too! I'd cast my eye over the spectra and have done a spectral comparison of the data by eye. I INDEPENDENTLY came up with five different spectral groups. So bottom line is PolySNAP using background subtraction routines gave EXACTLY the same result as me doing a spectral comparison by eye..thought you all should know that IMHO this is a significant step forward. Don Clark, Pfizer Global R&D

14 Raman Data Differences Different background types Much smaller differences between patterns Cosmic spike problems XRPD Form A Form B Raman

15 Raman Example 3 form pharma
16 Different Data Types Doesn t have to be PXRD or Raman data: IR DSC Other Profile Data Numeric Data XRF
17 Multiple datasets Combined XRPD + Raman instruments now available Applying multiple techniques to the same samples helps give additional information to work with How would we actually combine results from two (or more) such different techniques?
18 Methodology n Full profile matching nxn nxn XRD results XRPD Patterns all patterns against all patterns Correlation Matrix Distance Matrix Combined results Combine nxn Distance Matrix n Full profile matching nxn nxn Raman Patterns all patterns against all patterns Correlation Matrix Distance Matrix Raman results
19 Combining Datasets Manual weighting: Give a single weight to each dataset as a whole Combine datasets on that basis e.g. Powder 0.8, Raman 0.2 Dynamic weighting: Automatically calculate optimal weighting for each entry in each dataset
20 Dynamic Weighting Each data set has a 2-D distance matrix d D k is square (nxn) distance matrix for dataset k e.g. we have Raman and XRPD data on 20 samples, so k = 2, n=20. We want a Group Average Matrix G to optimally describe our data Specify diagonal weight matrices W k which can vary over the k datasets
21 Dynamic Weighting We want to minimise (1) Where (a double-centering operation on D), and Solve (1) to get best values for G and W
22 Example Bryne, D.V., O'Sullivan, Dijksterhuis, G.B., Bredie, W.L.P. & Martens, M. (2001) Food Quality Pref. 12, Attempt to develop a sensory vocabulary to describe the flavours of warmed up meat patties (!) The data were assessed by 8 assessors ( = no. of data types) judging 6 products ( = no. of data sets for each type) using 20 attributes ( = no. of points in each data set). So you have 8 D matrices. The group average G in 2 dimensions gives:

23 Example A, B...F are the six patties. It can be seen that D and E are judged to be very similar but there is a big difference in the others.
24 Example: Combining Four Techniques Dataset of Sulphathiazol, Carbamazepine + Mixtures 16 samples each had data from: 1. PXRD (collected on a Bruker C2 GADDS) 2. DSC (collected on a TA instruments Q100) 3. IR (collected on a JASCO FT/IR 4100) 4. Raman (collected on a Renishaw invia Reflex) Combinations: PXRD+Raman PXRD+Raman+DSC PXRD+Raman+DSC+IR. etc. [up to 15 sets of results!]

25 Side by side: Dendrograms

26 Side by side: 3D MMDS

27 Side by side: 3D MMDS

28 Combined Data: All Four
29 Live Demo Multiple Datasets
30 Combined Conclusions Full Profile Matching + Cluster analysis methods do very well in distinguishing forms automatically using either Raman or PXRD data individually Combined results using Dynamic Weighting seem to do better than either PXRD or Raman individually Use of combined data helps highlight any inconsistencies in separate analyses Such inconsistencies would not be obvious with only one data source Outliers can then be examined manually in detail Seeing similar clustering from multiple original data sources increases confidence in the overall results

31 Pre-screening large datasets Full analysis as shown limited to up to 2,000 patterns per data set. What if you ve got more? Is this new sample something seen before, or new? Pre-screening allows a single sample pattern to be compared to large in-house database of existing patterns. Compare e.g. >66,000 samples to new unknown in ~20 mins Return the best 50 matches, then visualise using dendrograms, 3D Plots etc as before

32 Salt Screening Mode Salt Screening: not interested in samples consisting of One of our starting materials Mixture of multiple starting materials Given a library of starting materials to compare the new samples to: Just highlight what s new and interesting


33 How do I do this? PolySNAP Matlab or other stats packages dsnap -Cluster & visualise 3D fragment geometry similarities from the Cambridge Structural Database H H O H 3 C 2 C 4 OH 6 R 1 1 R 2 5
34 Acknowledgements Many thanks to. Arnt Kern & Karsten Knorr, Bruker AXS Chris Frampton & Susie Buttar, Pharmorphix For more information, please contact us: Web:
NEW POSSIBILITIES FOR X-RAY DIFFRACTOMETRY. Bernd Hasse Incoatec, Geesthacht, Germany
 NEW POSSIBILITIES FOR X-RAY DIFFRACTOMETRY Bernd Hasse Incoatec, Geesthacht, Germany This document was presented at PPXRD - Pharmaceutical Powder X-ray Diffraction Symposium Sponsored by The International
COMPARISON BETWEEN CONVENTIONAL AND TWO-DIMENSIONAL XRD
 Copyright JCPDS - International Centre for Diffraction Data 2003, Advances in X-ray Analysis, Volume 46. 37 COMPARISON BETWEEN CONVENTIONAL AND TWO-DIMENSIONAL XRD Bob B. He, Uwe Preckwinkel, and Kingsley
Polygonal Graphic Representations Applied to Semi-Quantitative Analysis for 3 and 4 Elements in XRF. Marcia Garcia and Rodolfo Figueroa
 788 Polygonal Graphic Representations Applied to Semi-Quantitative Analysis for 3 and 4 Elements in XRF Marcia Garcia and Rodolfo Figueroa X-ray Fluorescence Laboratory, Department of Physics Sciences,
SIeve+ will identify patterns of various X-ray powder diffraction (XRPD) data files:
 data files:") SIeve+ Introduction SIeve+ is a Plug-In module integrated in the PDF-4 products. SIeve+ is licensed separately at an additional cost except for the PDF-4/Organics database. SIeve+ will activate for a free
SIeve+ Introduction SIeve+ is a Plug-In module integrated in the PDF-4 products. SIeve+ is licensed separately at an additional cost except for the PDF-4/Organics database. SIeve+ will activate for a free
DI TRANSFORM. The regressive analyses. identify relationships
 July 2, 2015 DI TRANSFORM MVstats TM Algorithm Overview Summary The DI Transform Multivariate Statistics (MVstats TM ) package includes five algorithm options that operate on most types of geologic, geophysical,
How to Analyze Materials
 INTERNATIONAL CENTRE FOR DIFFRACTION DATA How to Analyze Materials A PRACTICAL GUIDE FOR POWDER DIFFRACTION To All Readers This is a practical guide. We assume that the reader has access to a laboratory
ANOMALOUS SCATTERING FROM SINGLE CRYSTAL SUBSTRATE
 177 ANOMALOUS SCATTERING FROM SINGLE CRYSTAL SUBSTRATE L. K. Bekessy, N. A. Raftery, and S. Russell Faculty of Science, Queensland University of Technology, GPO Box 2434, Brisbane, Queensland, Australia
Parametric. Practices. Patrick Cunningham. CAE Associates Inc. and ANSYS Inc. Proprietary 2012 CAE Associates Inc. and ANSYS Inc. All rights reserved.
 Parametric Modeling Best Practices Patrick Cunningham July, 2012 CAE Associates Inc. and ANSYS Inc. Proprietary 2012 CAE Associates Inc. and ANSYS Inc. All rights reserved. E-Learning Webinar Series This
Chemometrics. Description of Pirouette Algorithms. Technical Note. Abstract
 19-1214 Chemometrics Technical Note Description of Pirouette Algorithms Abstract This discussion introduces the three analysis realms available in Pirouette and briefly describes each of the algorithms
Raman Spectra of Chondrocytes in Cartilage: hyperspec s chondro data set
 Raman Spectra of Chondrocytes in Cartilage: hyperspec s chondro data set Claudia Beleites CENMAT and DI3, University of Trieste Spectroscopy Imaging, IPHT Jena e.v. February 13,
Clustering and Visualisation of Data
 Clustering and Visualisation of Data Hiroshi Shimodaira January-March 28 Cluster analysis aims to partition a data set into meaningful or useful groups, based on distances between data points. In some
LECTURE 16. Dr. Teresa D. Golden University of North Texas Department of Chemistry
 LECTURE 16 Dr. Teresa D. Golden University of North Texas Department of Chemistry A. Evaluation of Data Quality An ICDD study found that 50% of x-ray labs overestimated the accuracy of their data by an
Dimension reduction : PCA and Clustering
 Dimension reduction : PCA and Clustering By Hanne Jarmer Slides by Christopher Workman Center for Biological Sequence Analysis DTU The DNA Array Analysis Pipeline Array design Probe design Question Experimental
10701 Machine Learning. Clustering
 171 Machine Learning Clustering What is Clustering? Organizing data into clusters such that there is high intra-cluster similarity low inter-cluster similarity Informally, finding natural groupings among
Solving Systems of Equations Using Matrices With the TI-83 or TI-84
 Solving Systems of Equations Using Matrices With the TI-83 or TI-84 Dimensions of a matrix: The dimensions of a matrix are the number of rows by the number of columns in the matrix. rows x columns *rows
Principal Component Analysis
 Copyright 2004, Casa Software Ltd. All Rights Reserved. 1 of 16 Principal Component Analysis Introduction XPS is a technique that provides chemical information about a sample that sets it apart from other
AUTOMATED RIETVELD-ANALYSIS OF LARGE NUMBERS OF DATASETS
 Copyright(c)JCPDS-International Centre for Diffraction Data 2001,Advances in X-ray Analysis,Vol.44 91 AUTOMATED RIETVELD-ANALYSIS OF LARGE NUMBERS OF DATASETS Sven Vogel, Hans-Georg Priesmeyer Institut
Network Traffic Measurements and Analysis
 DEIB - Politecnico di Milano Fall, 2017 Introduction Often, we have only a set of features x = x 1, x 2,, x n, but no associated response y. Therefore we are not interested in prediction nor classification,
Matrices 4: use of MATLAB
 Matrices 4: use of MATLAB Anthony Rossiter http://controleducation.group.shef.ac.uk/indexwebbook.html http://www.shef.ac.uk/acse Department of Automatic Control and Systems Engineering Introduction The
Data Science and Statistics in Research: unlocking the power of your data Session 3.4: Clustering
 Data Science and Statistics in Research: unlocking the power of your data Session 3.4: Clustering 1/ 1 OUTLINE 2/ 1 Overview 3/ 1 CLUSTERING Clustering is a statistical technique which creates groupings
Unsupervised learning in Vision
 Chapter 7 Unsupervised learning in Vision The fields of Computer Vision and Machine Learning complement each other in a very natural way: the aim of the former is to extract useful information from visual
Cluster Analysis and Visualization. Workshop on Statistics and Machine Learning 2004/2/6
 Cluster Analysis and Visualization Workshop on Statistics and Machine Learning 2004/2/6 Outlines Introduction Stages in Clustering Clustering Analysis and Visualization One/two-dimensional Data Histogram,
Distances, Clustering! Rafael Irizarry!
 Distances, Clustering! Rafael Irizarry! Heatmaps! Distance! Clustering organizes things that are close into groups! What does it mean for two genes to be close?! What does it mean for two samples to
An introduction to plotting data
 An introduction to plotting data Eric D. Black California Institute of Technology February 25, 2014 1 Introduction Plotting data is one of the essential skills every scientist must have. We use it on a
A Simple 2-D Microfluorescence
 A Simple 2-D Microfluorescence Unit By J.Carsello Department of Materials Science and Engineering, The Robert R. McCormick School of Engineering and Applied Sciences, Northwestern University, Evanston,
Vectors of movement, a new approach to cluster multidimensional big data on mobility
 Vectors of movement, a new approach to cluster multidimensional big data on mobility Rafał Kucharski Achille Fonzone, Arkadiusz Drabicki, Guido Cantelmo Politechnika Krakowska, Poland Oct 2018, TU Delft
Year 8 End of Year Exams Revision List
 Year 8 End of Year Exams Revision List All students will expected to be confident with the appropriate year 7 learning objectives as follows Target 1-3 must be confident with year 7 target 1-3 Target 2-4
Predict Outcomes and Reveal Relationships in Categorical Data
 PASW Categories 18 Specifications Predict Outcomes and Reveal Relationships in Categorical Data Unleash the full potential of your data through predictive analysis, statistical learning, perceptual mapping,
Statistical Pattern Recognition
 Statistical Pattern Recognition Features and Feature Selection Hamid R. Rabiee Jafar Muhammadi Spring 2014 http://ce.sharif.edu/courses/92-93/2/ce725-2/ Agenda Features and Patterns The Curse of Size and
Using OPUS to Process Evolved Gas Data (8/12/15 edits highlighted)
") Using OPUS to Process Evolved Gas Data (8/12/15 edits highlighted) Once FTIR data has been acquired for the gases evolved during your DSC/TGA run, you will process using the OPUS software package. Select
Using OPUS to Process Evolved Gas Data (8/12/15 edits highlighted) Once FTIR data has been acquired for the gases evolved during your DSC/TGA run, you will process using the OPUS software package. Select
Hyperspectral Chemical Imaging: principles and Chemometrics.
 Hyperspectral Chemical Imaging: principles and Chemometrics aoife.gowen@ucd.ie University College Dublin University College Dublin 1,596 PhD students 6,17 international students 8,54 graduate students
Spectral Classification
 Spectral Classification Spectral Classification Supervised versus Unsupervised Classification n Unsupervised Classes are determined by the computer. Also referred to as clustering n Supervised Classes
The Power and Sample Size Application
 Chapter 72 The Power and Sample Size Application Contents Overview: PSS Application.................................. 6148 SAS Power and Sample Size............................... 6148 Getting Started:
CS 229: Machine Learning Final Report Identifying Driving Behavior from Data
 CS 9: Machine Learning Final Report Identifying Driving Behavior from Data Robert F. Karol Project Suggester: Danny Goodman from MetroMile December 3th 3 Problem Description For my project, I am looking
Release by the International Centre for Diffraction Data (ICDD) of New Powder Data Mining Tools: the PDF-4/Full File and PDF-4/Organics Databases
 of New Powder Data Mining Tools: the PDF-4/Full File and PDF-4/Organics Databases") Release by the International Centre for Diffraction Data (ICDD) of New Powder Data Mining Tools: the PDF-4/Full File and PDF-4/Organics Databases Brian O Connor*, Camden Hubbard #, Tim Fawcett and John
Release by the International Centre for Diffraction Data (ICDD) of New Powder Data Mining Tools: the PDF-4/Full File and PDF-4/Organics Databases Brian O Connor*, Camden Hubbard #, Tim Fawcett and John
Maths for Signals and Systems Linear Algebra in Engineering. Some problems by Gilbert Strang
 Maths for Signals and Systems Linear Algebra in Engineering Some problems by Gilbert Strang Problems. Consider u, v, w to be non-zero vectors in R 7. These vectors span a vector space. What are the possible
Fundamentals of Rietveld Refinement III. Refinement of a Mixture
 Fundamentals of Rietveld Refinement III. Refinement of a Mixture An Introduction to Rietveld Refinement using PANalytical X Pert HighScore Plus v3.0e Scott A Speakman, Ph.D. MIT Center for Materials Science
2. Use elementary row operations to rewrite the augmented matrix in a simpler form (i.e., one whose solutions are easy to find).
.") Section. Gaussian Elimination Our main focus in this section is on a detailed discussion of a method for solving systems of equations. In the last section, we saw that the general procedure for solving
Section. Gaussian Elimination Our main focus in this section is on a detailed discussion of a method for solving systems of equations. In the last section, we saw that the general procedure for solving
Technical Computing with MATLAB
 Technical Computing with MATLAB University Of Bath Seminar th 19 th November 2010 Adrienne James (Application Engineering) 1 Agenda Introduction to MATLAB Importing, visualising and analysing data from
CSE 6242 A / CS 4803 DVA. Feb 12, Dimension Reduction. Guest Lecturer: Jaegul Choo
 CSE 6242 A / CS 4803 DVA Feb 12, 2013 Dimension Reduction Guest Lecturer: Jaegul Choo CSE 6242 A / CS 4803 DVA Feb 12, 2013 Dimension Reduction Guest Lecturer: Jaegul Choo Data is Too Big To Do Something..
8 th Grade Mathematics Unpacked Content For the new Common Core standards that will be effective in all North Carolina schools in the
 8 th Grade Mathematics Unpacked Content For the new Common Core standards that will be effective in all North Carolina schools in the 2012-13. This document is designed to help North Carolina educators
Progenesis QI for proteomics User Guide. Analysis workflow guidelines for DDA data
 Progenesis QI for proteomics User Guide Analysis workflow guidelines for DDA data Contents Introduction... 3 How to use this document... 3 How can I analyse my own runs using Progenesis QI for proteomics?...
Learning a Manifold as an Atlas Supplementary Material
 Learning a Manifold as an Atlas Supplementary Material Nikolaos Pitelis Chris Russell School of EECS, Queen Mary, University of London [nikolaos.pitelis,chrisr,lourdes]@eecs.qmul.ac.uk Lourdes Agapito
Metabolomic Data Analysis with MetaboAnalyst
 Metabolomic Data Analysis with MetaboAnalyst User ID: guest6522519400069885256 April 14, 2009 1 Data Processing and Normalization 1.1 Reading and Processing the Raw Data MetaboAnalyst accepts a variety
Progenesis LC-MS Tutorial Including Data File Import, Alignment, Filtering, Progenesis Stats and Protein ID
 Progenesis LC-MS Tutorial Including Data File Import, Alignment, Filtering, Progenesis Stats and Protein ID 1 Introduction This tutorial takes you through a complete analysis of 9 LC-MS runs (3 replicate
Importing data in a database with levels
 BioNumerics Tutorial: Importing data in a database with levels 1 Aim In this tutorial you will learn how to import data in a BioNumerics database with levels and how to replicate and summarize level-specific
Survey of Math: Excel Spreadsheet Guide (for Excel 2016) Page 1 of 9
 Page 1 of 9") Survey of Math: Excel Spreadsheet Guide (for Excel 2016) Page 1 of 9 Contents 1 Introduction to Using Excel Spreadsheets 2 1.1 A Serious Note About Data Security.................................... 2 1.2
Survey of Math: Excel Spreadsheet Guide (for Excel 2016) Page 1 of 9 Contents 1 Introduction to Using Excel Spreadsheets 2 1.1 A Serious Note About Data Security.................................... 2 1.2
Automated Crystal Structure Identification from X-ray Diffraction Patterns
 Automated Crystal Structure Identification from X-ray Diffraction Patterns Rohit Prasanna (rohitpr) and Luca Bertoluzzi (bertoluz) CS229: Final Report 1 Introduction X-ray diffraction is a commonly used
Visual Analytics Tools for the Global Change Assessment Model. Michael Steptoe, Ross Maciejewski, & Robert Link Arizona State University
 Visual Analytics Tools for the Global Change Assessment Model Michael Steptoe, Ross Maciejewski, & Robert Link Arizona State University GCAM Simulation When exploring the impact of various conditions or
Data Analysis Guidelines
 Data Analysis Guidelines DESCRIPTIVE STATISTICS Standard Deviation Standard deviation is a calculated value that describes the variation (or spread) of values in a data set. It is calculated using a formula
9/29/13. Outline Data mining tasks. Clustering algorithms. Applications of clustering in biology
 9/9/ I9 Introduction to Bioinformatics, Clustering algorithms Yuzhen Ye (yye@indiana.edu) School of Informatics & Computing, IUB Outline Data mining tasks Predictive tasks vs descriptive tasks Example
Scaling Techniques in Political Science
 Scaling Techniques in Political Science Eric Guntermann March 14th, 2014 Eric Guntermann Scaling Techniques in Political Science March 14th, 2014 1 / 19 What you need R RStudio R code file Datasets You
Graphical Analysis of Data using Microsoft Excel [2016 Version]
![Graphical Analysis of Data using Microsoft Excel [2016 Version]](/thumbs/72/67574169.jpg "Graphical Analysis of Data using Microsoft Excel [2016 Version]") Graphical Analysis of Data using Microsoft Excel [2016 Version] Introduction In several upcoming labs, a primary goal will be to determine the mathematical relationship between two variable physical parameters.
Graphical Analysis of Data using Microsoft Excel [2016 Version] Introduction In several upcoming labs, a primary goal will be to determine the mathematical relationship between two variable physical parameters.
STATS306B STATS306B. Clustering. Jonathan Taylor Department of Statistics Stanford University. June 3, 2010
 STATS306B Jonathan Taylor Department of Statistics Stanford University June 3, 2010 Spring 2010 Outline K-means, K-medoids, EM algorithm choosing number of clusters: Gap test hierarchical clustering spectral
Statistical Package for the Social Sciences INTRODUCTION TO SPSS SPSS for Windows Version 16.0: Its first version in 1968 In 1975.
 Statistical Package for the Social Sciences INTRODUCTION TO SPSS SPSS for Windows Version 16.0: Its first version in 1968 In 1975. SPSS Statistics were designed INTRODUCTION TO SPSS Objective About the
Week 7 Picturing Network. Vahe and Bethany
 Week 7 Picturing Network Vahe and Bethany Freeman (2005) - Graphic Techniques for Exploring Social Network Data The two main goals of analyzing social network data are identification of cohesive groups
Statistical Pattern Recognition
 Statistical Pattern Recognition Features and Feature Selection Hamid R. Rabiee Jafar Muhammadi Spring 2013 http://ce.sharif.edu/courses/91-92/2/ce725-1/ Agenda Features and Patterns The Curse of Size and
Final Exam Assigned: 11/21/02 Due: 12/05/02 at 2:30pm
 6.801/6.866 Machine Vision Final Exam Assigned: 11/21/02 Due: 12/05/02 at 2:30pm Problem 1 Line Fitting through Segmentation (Matlab) a) Write a Matlab function to generate noisy line segment data with
Understanding Clustering Supervising the unsupervised
 Understanding Clustering Supervising the unsupervised Janu Verma IBM T.J. Watson Research Center, New York http://jverma.github.io/ jverma@us.ibm.com @januverma Clustering Grouping together similar data
SYDE Winter 2011 Introduction to Pattern Recognition. Clustering
 SYDE 372 - Winter 2011 Introduction to Pattern Recognition Clustering Alexander Wong Department of Systems Design Engineering University of Waterloo Outline 1 2 3 4 5 All the approaches we have learned
VIDAEXPERT: DATA ANALYSIS Here is the Statistics button.
 Here is the Statistics button. After creating dataset you can analyze it in different ways. First, you can calculate statistics. Open Statistics dialog, Common tabsheet, click Calculate. Min, Max: minimal
CIS 520, Machine Learning, Fall 2015: Assignment 7 Due: Mon, Nov 16, :59pm, PDF to Canvas [100 points]
![CIS 520, Machine Learning, Fall 2015: Assignment 7 Due: Mon, Nov 16, :59pm, PDF to Canvas [100 points]](/thumbs/89/100746783.jpg "CIS 520, Machine Learning, Fall 2015: Assignment 7 Due: Mon, Nov 16, :59pm, PDF to Canvas [100 points]") CIS 520, Machine Learning, Fall 2015: Assignment 7 Due: Mon, Nov 16, 2015. 11:59pm, PDF to Canvas [100 points] Instructions. Please write up your responses to the following problems clearly and concisely.
CIS 520, Machine Learning, Fall 2015: Assignment 7 Due: Mon, Nov 16, 2015. 11:59pm, PDF to Canvas [100 points] Instructions. Please write up your responses to the following problems clearly and concisely.
Data Preprocessing. Javier Béjar AMLT /2017 CS - MAI. (CS - MAI) Data Preprocessing AMLT / / 71 BY: $\
 Data Preprocessing AMLT / / 71 BY: $\") Data Preprocessing S - MAI AMLT - 2016/2017 (S - MAI) Data Preprocessing AMLT - 2016/2017 1 / 71 Outline 1 Introduction Data Representation 2 Data Preprocessing Outliers Missing Values Normalization Discretization
Data Preprocessing S - MAI AMLT - 2016/2017 (S - MAI) Data Preprocessing AMLT - 2016/2017 1 / 71 Outline 1 Introduction Data Representation 2 Data Preprocessing Outliers Missing Values Normalization Discretization
Tools for Monitoring and Controlling Uniformity of Solid Dosage Forms
 Tools for Monitoring and Controlling Uniformity of Solid Dosage Forms Martin Warman Scientific Fellow, Vertex Pharmaceuticals, Inc Controlling process variation does not start with measurement technology..
8 th Grade Pre Algebra Pacing Guide 1 st Nine Weeks
 8 th Grade Pre Algebra Pacing Guide 1 st Nine Weeks MS Objective CCSS Standard I Can Statements Included in MS Framework + Included in Phase 1 infusion Included in Phase 2 infusion 1a. Define, classify,
Data Clustering. Danushka Bollegala
 Data Clustering Danushka Bollegala Outline Why cluster data? Clustering as unsupervised learning Clustering algorithms k-means, k-medoids agglomerative clustering Brown s clustering Spectral clustering
Exploratory Data Analysis using Self-Organizing Maps. Madhumanti Ray
 Exploratory Data Analysis using Self-Organizing Maps Madhumanti Ray Content Introduction Data Analysis methods Self-Organizing Maps Conclusion Visualization of high-dimensional data items Exploratory data
Lecture 16: High-dimensional regression, non-linear regression
 Lecture 16: High-dimensional regression, non-linear regression Reading: Sections 6.4, 7.1 STATS 202: Data mining and analysis November 3, 2017 1 / 17 High-dimensional regression Most of the methods we
Cluster Analysis. Mu-Chun Su. Department of Computer Science and Information Engineering National Central University 2003/3/11 1
 Cluster Analysis Mu-Chun Su Department of Computer Science and Information Engineering National Central University 2003/3/11 1 Introduction Cluster analysis is the formal study of algorithms and methods
COMBINED METHOD TO VISUALISE AND REDUCE DIMENSIONALITY OF THE FINANCIAL DATA SETS
 COMBINED METHOD TO VISUALISE AND REDUCE DIMENSIONALITY OF THE FINANCIAL DATA SETS Toomas Kirt Supervisor: Leo Võhandu Tallinn Technical University Toomas.Kirt@mail.ee Abstract: Key words: For the visualisation
( ) =cov X Y = W PRINCIPAL COMPONENT ANALYSIS. Eigenvectors of the covariance matrix are the principal components
 =cov X Y = W PRINCIPAL COMPONENT ANALYSIS. Eigenvectors of the covariance matrix are the principal components") Review Lecture 14 ! PRINCIPAL COMPONENT ANALYSIS Eigenvectors of the covariance matrix are the principal components 1. =cov X Top K principal components are the eigenvectors with K largest eigenvalues
Review Lecture 14 ! PRINCIPAL COMPONENT ANALYSIS Eigenvectors of the covariance matrix are the principal components 1. =cov X Top K principal components are the eigenvectors with K largest eigenvalues
Assessing the homo- or heterogeneity of noisy experimental data. Kay Diederichs Konstanz, 01/06/2017
 Assessing the homo- or heterogeneity of noisy experimental data Kay Diederichs Konstanz, 01/06/2017 What is the problem? Why do an experiment? because we want to find out a property (or several) of an
Statistical Pattern Recognition
 Statistical Pattern Recognition Features and Feature Selection Hamid R. Rabiee Jafar Muhammadi Spring 2012 http://ce.sharif.edu/courses/90-91/2/ce725-1/ Agenda Features and Patterns The Curse of Size and
Key Stage 3 Curriculum
 Key Stage 3 Curriculum Learning Area: Maths Learning Area Coordinator: Ms S J Pankhurst What will I study? SUBJECT YEAR 7 Autumn 1 Autumn 2 Spring 1 Spring 2 Summer 1 Summer 2 Focus Counting and comparing
Recognition, SVD, and PCA
 Recognition, SVD, and PCA Recognition Suppose you want to find a face in an image One possibility: look for something that looks sort of like a face (oval, dark band near top, dark band near bottom) Another
HW4 VINH NGUYEN. Q1 (6 points). Chapter 8 Exercise 20
. Chapter 8 Exercise 20") HW4 VINH NGUYEN Q1 (6 points). Chapter 8 Exercise 20 a. For each figure, could you use single link to find the patterns represented by the nose, eyes and mouth? Explain? First, a single link is a MIN version
HW4 VINH NGUYEN Q1 (6 points). Chapter 8 Exercise 20 a. For each figure, could you use single link to find the patterns represented by the nose, eyes and mouth? Explain? First, a single link is a MIN version
Machine Learning : supervised versus unsupervised
 Machine Learning : supervised versus unsupervised Neural Networks: supervised learning makes use of a known property of the data: the digit as classified by a human the ground truth needs a training set,
Raman Spectra of Chondrocytes in Cartilage: hyperspec s chondro data set
 Raman Spectra of Chondrocytes in Cartilage: hyperspec s chondro data set Claudia Beleites DIA Raman Spectroscopy Group, University of Trieste/Italy (2 28) Spectroscopy Imaging,
Customizable information fields (or entries) linked to each database level may be replicated and summarized to upstream and downstream levels.
 linked to each database level may be replicated and summarized to upstream and downstream levels.") Manage. Analyze. Discover. NEW FEATURES BioNumerics Seven comes with several fundamental improvements and a plethora of new analysis possibilities with a strong focus on user friendliness. Among the most
Manage. Analyze. Discover. NEW FEATURES BioNumerics Seven comes with several fundamental improvements and a plethora of new analysis possibilities with a strong focus on user friendliness. Among the most
Stage 7 Checklists Have you reached this Standard?
 Stage 7 Checklists Have you reached this Standard? Main Criteria for the whole year. J K L Use positive integer powers and associated real roots Apply the four operations with decimal numbers Write a quantity
The latest trend of hybrid instrumentation
 Multivariate Data Processing of Spectral Images: The Ugly, the Bad, and the True The results of various multivariate data-processing methods of Raman maps recorded with a dispersive Raman microscope are
Clustering CS 550: Machine Learning
 Clustering CS 550: Machine Learning This slide set mainly uses the slides given in the following links: http://www-users.cs.umn.edu/~kumar/dmbook/ch8.pdf http://www-users.cs.umn.edu/~kumar/dmbook/dmslides/chap8_basic_cluster_analysis.pdf
Data preprocessing Functional Programming and Intelligent Algorithms
 Data preprocessing Functional Programming and Intelligent Algorithms Que Tran Høgskolen i Ålesund 20th March 2017 1 Why data preprocessing? Real-world data tend to be dirty incomplete: lacking attribute
Package SC3. September 29, 2018
 Type Package Title Single-Cell Consensus Clustering Version 1.8.0 Author Vladimir Kiselev Package SC3 September 29, 2018 Maintainer Vladimir Kiselev A tool for unsupervised
Using Excel for Graphical Analysis of Data
 Using Excel for Graphical Analysis of Data Introduction In several upcoming labs, a primary goal will be to determine the mathematical relationship between two variable physical parameters. Graphs are
Clustering. Informal goal. General types of clustering. Applications: Clustering in information search and analysis. Example applications in search
 Informal goal Clustering Given set of objects and measure of similarity between them, group similar objects together What mean by similar? What is good grouping? Computation time / quality tradeoff 1 2
Step-by-Step Guide to Relatedness and Association Mapping Contents
 Step-by-Step Guide to Relatedness and Association Mapping Contents OBJECTIVES... 2 INTRODUCTION... 2 RELATEDNESS MEASURES... 2 POPULATION STRUCTURE... 6 Q-K ASSOCIATION ANALYSIS... 10 K MATRIX COMPRESSION...
AN IMPROVED HYBRIDIZED K- MEANS CLUSTERING ALGORITHM (IHKMCA) FOR HIGHDIMENSIONAL DATASET & IT S PERFORMANCE ANALYSIS
 FOR HIGHDIMENSIONAL DATASET & IT S PERFORMANCE ANALYSIS") AN IMPROVED HYBRIDIZED K- MEANS CLUSTERING ALGORITHM (IHKMCA) FOR HIGHDIMENSIONAL DATASET & IT S PERFORMANCE ANALYSIS H.S Behera Department of Computer Science and Engineering, Veer Surendra Sai University
AN IMPROVED HYBRIDIZED K- MEANS CLUSTERING ALGORITHM (IHKMCA) FOR HIGHDIMENSIONAL DATASET & IT S PERFORMANCE ANALYSIS H.S Behera Department of Computer Science and Engineering, Veer Surendra Sai University
ADAPTIVE GRAPH CUTS WITH TISSUE PRIORS FOR BRAIN MRI SEGMENTATION
 ADAPTIVE GRAPH CUTS WITH TISSUE PRIORS FOR BRAIN MRI SEGMENTATION Abstract: MIP Project Report Spring 2013 Gaurav Mittal 201232644 This is a detailed report about the course project, which was to implement
Data Preprocessing. Javier Béjar. URL - Spring 2018 CS - MAI 1/78 BY: $\
 Data Preprocessing Javier Béjar BY: $\ URL - Spring 2018 C CS - MAI 1/78 Introduction Data representation Unstructured datasets: Examples described by a flat set of attributes: attribute-value matrix Structured
SAS/STAT 13.1 User s Guide. The Power and Sample Size Application
 SAS/STAT 13.1 User s Guide The Power and Sample Size Application This document is an individual chapter from SAS/STAT 13.1 User s Guide. The correct bibliographic citation for the complete manual is as
Visual Analytics. Visualizing multivariate data:
 Visual Analytics 1 Visualizing multivariate data: High density time-series plots Scatterplot matrices Parallel coordinate plots Temporal and spectral correlation plots Box plots Wavelets Radar and /or
WITec Suite FIVE. Project FIVE Control FIVE Project FIVE+
 Project FIVE Control FIVE Project FIVE+ For further information about WITec Suite please contact us: by phone: +49 (0) 731 140700 by email: info@witec.de WITec Suite FIVE Data Acquisition, Evaluation and
MATH 423 Linear Algebra II Lecture 17: Reduced row echelon form (continued). Determinant of a matrix.
. Determinant of a matrix.") MATH 423 Linear Algebra II Lecture 17: Reduced row echelon form (continued). Determinant of a matrix. Row echelon form A matrix is said to be in the row echelon form if the leading entries shift to the
MATH 423 Linear Algebra II Lecture 17: Reduced row echelon form (continued). Determinant of a matrix. Row echelon form A matrix is said to be in the row echelon form if the leading entries shift to the
Mathematics Expectations Page 1 Grade 06
 Mathematics Expectations Page 1 Grade 06 Problem Solving Mathematical Process Expectations 6m1 develop, select, and apply problem-solving strategies as they pose and solve problems and conduct investigations,
ECLT 5810 Clustering
 ECLT 5810 Clustering What is Cluster Analysis? Cluster: a collection of data objects Similar to one another within the same cluster Dissimilar to the objects in other clusters Cluster analysis Grouping
COSC160: Detection and Classification. Jeremy Bolton, PhD Assistant Teaching Professor
 COSC160: Detection and Classification Jeremy Bolton, PhD Assistant Teaching Professor Outline I. Problem I. Strategies II. Features for training III. Using spatial information? IV. Reducing dimensionality
MATH (CRN 13695) Lab 1: Basics for Linear Algebra and Matlab
 Lab 1: Basics for Linear Algebra and Matlab") MATH 495.3 (CRN 13695) Lab 1: Basics for Linear Algebra and Matlab Below is a screen similar to what you should see when you open Matlab. The command window is the large box to the right containing the
MATH 495.3 (CRN 13695) Lab 1: Basics for Linear Algebra and Matlab Below is a screen similar to what you should see when you open Matlab. The command window is the large box to the right containing the
Version 2.4 of Idiogrid
 Version 2.4 of Idiogrid Structural and Visual Modifications 1. Tab delimited grids in Grid Data window. The most immediately obvious change to this newest version of Idiogrid will be the tab sheets that
Step Change in Design: Exploring Sixty Stent Design Variations Overnight
 Step Change in Design: Exploring Sixty Stent Design Variations Overnight Frank Harewood, Ronan Thornton Medtronic Ireland (Galway) Parkmore Business Park West, Ballybrit, Galway, Ireland frank.harewood@medtronic.com