Algebra 1 Interactive Chalkboard Copyright by The McGraw-Hill Companies, Inc. Send all inquiries to:
|
|
|
- Cecily Byrd
- 5 years ago
- Views:
Transcription
1 Algebra 1 Interactive Chalkboard Copyright by The McGraw-Hill Companies, Inc. Send all inquiries to: GLENCOE DIVISION Glencoe/McGraw-Hill 8787 Orion Place Columbus, Ohio 43240

2
3 Lesson 4-1 The Coordinate Plane Lesson 4-2 Transformations on the Coordinate Plane Lesson 4-3 Relations Lesson 4-4 Equations as Relations Lesson 4-5 Graphing Linear Equations Lesson 4-6 Functions Lesson 4-7 Arithmetic Sequences Lesson 4-8 Writing Equations from Patterns
4 Example 1 Name an Ordered Pair Example 2 Identify Quadrants Example 3 Graph Points Example 4 Use a Coordinate System
.")
5 Write the ordered pair for point B. Follow along a horizontal line to find the x-coordinate on the x-axis. The x-coordinate is 3. Follow along a vertical line through the point to find the y-coordinate on the y-axis. The y-coordinate is 2. Answer: The ordered pair for point B is (3, 2). This can also be written as B(3, 2).

6 Write the ordered pair for point C. Answer: ( 4, 1)


7 Write ordered pairs for points A, B, C, and D. Name the quadrant in which each point is located. Use a table to help find the coordinates of each point.
8 Point x-coordinate y-coordinate Ordered Pair Quadrant A 2 2 ( 2, 2) II B 0 2 (0, 2) None C 4 2 (4, 2) IV D 5 4 ( 5, 4) III Answer: A( 2, 2); II B(0, 2); none C(4, 2); IV D( 5, 4); III


9 Write ordered pairs for points Q, R, S, and T. Name the quadrant in which each point is located. Answer: Q( 1, 3); II R(4, 1); I S(2, 4); IV T( 3, 0); none


10 Plot A(3, 1) on the coordinate plane. Start at the origin. Move right 3 units since the x-coordinate is 3. Move up 1 unit since the y-coordinate is 1. Draw a dot and label it A.
11 Plot B( 2, 0) on the coordinate plane. Start at the origin. Move left 2 units. Since the y-coordinate is 0, the point will be located on the x-axis. Draw a dot and label it B.
12 Plot C(2, 5) on the coordinate plane. Start at the origin. Move right 2 units and down 5 units. Draw a dot and label it C.

 c.")
13 Plot each point on the coordinate plane. a. H(3, 5) b. J(0, 4) c. K(6, 2) Answer:
14 Geography Use the map in Example 4 on page 194 of your textbook to name the city at about (33, 80 ). Locate the latitude line at 33. Follow the line until it intersects with the longitude line at 80. Answer: The city is Charleston.
15 Geography Use the map in Example 4 on page 194 of your textbook to estimate the latitude and longitude of Las Vegas. Locate Las Vegas on the map. It is close to 35 latitude and at 115 longitude. Answer: There are 5 between each line, so a good estimate is 37 for the latitude and 115 for the longitude.
16 Use the map on page 194 to answer the following questions. a. Name the city at (35, 107 ). Answer: Albuquerque b. Estimate the latitude and longitude of Columbus. Answer: (40, 83 )
17
18 Example 1 Identify Transformations Example 2 Reflection Example 3 Translation Example 4 Dilation Example 5 Rotation

19 Identify the transformation as a reflection, translation, dilation, or rotation. Answer: The figure has been increased in size. This is a dilation.
20 Identify the transformation as a reflection, translation, dilation, or rotation. Answer: The figure has been shifted horizontally to the right. This is a translation.

21 Identify the transformation as a reflection, translation, dilation, or rotation. Answer: The figure has been turned around a point. This is a rotation.

22 Identify the transformation as a reflection, translation, dilation, or rotation. Answer: The figure has been flipped over a line. This is a reflection.


23 Identify each transformation as a reflection, translation, dilation, or rotation. a. b. Answer: rotation Answer: reflection c. d. Answer: dilation Answer: translation
24 A trapezoid has vertices W( 1, 4), X(4, 4), Y(4, 1) and Z( 3, 1). Trapezoid WXYZ is reflected over the y-axis. Find the coordinates of the vertices of the image. To reflect the figure over the y-axis, multiply each x-coordinate by 1. (x, y) ( x, y) W( 1, 4) (1, 4) X(4, 4) ( 4, 4) Y(4, 1) ( 4, 1) Z( 3, 1) (3, 1) Answer: The coordinates of the vertices of the image are W (1, 4), X ( 4, 4), Y ( 4, 1), and Z (3, 1).

25 A trapezoid has vertices W( 1, 4), X(4, 4), Y(4, 1), and Z( 3, 1). Graph trapezoid WXYZ and its image W X Y Z. Graph each vertex of the trapezoid WXYZ. Connect the points. Answer: X W W X Graph each vertex of the reflected image W X Y Z. Connect the points. Y Z Z Y
26 A parallelogram has vertices A( 4, 7), B(2, 7), C(0, 4) and D( 2, 4). a. Parallelogram ABCD is reflected over the x-axis. Find the coordinates of the vertices of the image. Answer: A ( 4, 7), B (2, 7), C (0, 4), D ( 2, 4)

27 b. Graph parallelogram ABCD and its image A B C D. Answer:
28 Triangle ABC has vertices A( 2, 1), B(2, 4), and C(1, 1). Find the coordinates of the vertices of the image if it is translated 3 units to the right and 5 units down. To translate the triangle 3 units to the right, add 3 to the x-coordinate of each vertex. To translate the triangle 5 units down, add 5 to the y-coordinate of each vertex. Answer: The coordinates of the vertices of the image are A (1, 4), B (5, 1), and C (4, 4).

29 Graph triangle ABC and its image. Answer: The preimage is. B The translated image is A C B A C
. a. Find the coordinates of the vertices of the image if it is translated 5 units to the left and 2 units up.")
30 Triangle JKL has vertices J(2, 3), K(4, 0), and L(6, 3). a. Find the coordinates of the vertices of the image if it is translated 5 units to the left and 2 units up. Answer: J ( 3, 1), K ( 1, 2), L (1, 1) b. Graph triangle JKL and its image. Answer:
31 A trapezoid has vertices E( 1, 2), F(2, 1), G(2, 1), and H( 1, 2). Find the coordinates of the dilated trapezoid E F G H if the scale factor is 2. To dilate the figure, multiply the coordinates of each vertex by 2.
32 Answer: The coordinates of the vertices of the image are E ( 2, 4), F (4, 2), G (4, 2), and H ( 2, 4).
33 Graph the preimage and its image. Answer: The preimage is trapezoid EFGH. The image is trapezoid E F G H. Notice that the image has sides that are twice the length of the sides of the original figure. E H E H F G F G
34 A trapezoid has vertices E( 4, 7), F(2, 7), G(0, 4), and H( 2, 4). a. Find the coordinates of the dilated trapezoid E F G H if the scale factor is Answer:

35 b. Graph the preimage and its image. Answer:
36 Triangle ABC has vertices A(1, 3), B(3, 1), and C(5, 2). Find the coordinates of the image of ABC after it is rotated 180 about the origin. To find the coordinates of the image of ABC after a 180 rotation, multiply both coordinates of each point by 1. Answer: The coordinates of the vertices of the image are A ( 1, 3), B ( 3, 1), and C ( 5, 2).


37 Graph the preimage and its image. Answer: The preimage is. C A B The translated image is B A C
. a.")

38 Triangle RST has vertices R(4, 0), S(2, 3), and T(6, 3). a. Find the coordinates of the image of RST after it is rotated 90 counterclockwise about the origin. Answer: R (0, 4), S (3, 2), T (3, 6) b. Graph the preimage and the image. Answer:
39
40 Example 1 Represent a Relation Example 2 Use a Relation Example 3 Inverse Relation
41 Express the relation {(4, 3), ( 2, 1), ( 3, 2), (2, 4), (0, 4)} as a table, a graph and a mapping. Table List the set of x-coordinates in the first column and the corresponding y-coordinates in the second column. x y


42 Graph Graph each ordered pair on a coordinate plane.

43 Mapping List the x values in set X and the y values in set Y. Draw an arrow from each x value in X to the corresponding y value in Y.
44 Determine the domain and range. Answer: The domain for this relation is { 3, 2, 0, 2, 4}. The range is { 4, 1, 2, 3}.
} as a table, a graph, and a mapping.")

45 a. Express the relation {(3, 2), (4, 6), (5, 2), ( 1, 3)} as a table, a graph, and a mapping. Answer: x y b. Determine the domain and range. Answer: D = { 1, 3, 4, 5}; R = { 2, 2, 3, 6}
46 Opinion Polls The table shows the percent of people satisfied with the way things were going in the U.S. at the time of the survey. Year Percent Satisfied Determine the domain and range of the relation. Answer: The domain is {1992, 1995, 1998, 2001}. The range is {21, 32, 51, 60}.


47 Graph the data. The values of the x-axis need to go from 1992 to It is not practical to begin the scale at 0. Begin at 1992 and extend to 2001 to include all of the data. The units can be 1 unit per grid square. The values on the y-axis need to go from 21 to 60. In this case it is possible to begin the scale at 0. Begin at 0 and extend to 70. You can use units of 10.
48 What conclusions might you make from the graph of the data? Answer: Americans became more satisfied with the country from , but the percentage dropped from
49 Endangered Species The table shows the approximate world population of the Indian Rhinoceros from 1982 to Indian Rhinoceros Population Year Population a. Determine the domain and range of the relation. Answer: D = {1982, 1986, 1990, 1994, 1998} R = {1000, 1700, 1900, 2100}

50 b. Graph the data. Answer:
51 c. What conclusions might you make from the graph of the data? Answer: The population of the Indian rhinoceros has been increasing since 1982.

52 Express the relation shown in the mapping as a set of ordered pairs. Then write the inverse of the relation. Relation Notice that both 7 and 0 in the domain are paired with 2 in the range. Answer: {(5, 1), (7, 2), (4, 9), (0, 2)} Inverse Exchange X and Y in each ordered pair to write the inverse relation. Answer: {(1, 5), (2, 7), ( 9, 4), (2, 0)}

53 Express the relation shown in the mapping as a set of ordered pairs. Then write the inverse of the relation. Answer: Relation: {(3, 2), ( 4, 1), (5, 2)} Inverse: {(2, 3), (1, 4), (2, 5)}

54
55 Example 1 Solve Using a Replacement Set Example 2 Solve Using a Given Domain Example 3 Solve and Graph the Solution Set Example 4 Solve for a Dependent Variable
56 Find the solution set for given the replacement set {( 5, 0), ( 3, 2), (2, 13), (4, 19)}. Make a table. Substitute each ordered pair into the equation. x y True or False? false true true true
57 The ordered pairs ( 3, 2), (2, 13) and (4, 19) result in true statements. Answer: The solution set is {( 3, 2), (2, 13), (4, 19)}.
58 Find the solution set for given the replacement set {(3, 1), (6, 8), (1, 5), ( 1, 1)}. Answer: {(1, 5), ( 1, 1)}
59 Solve if the domain is { 2, 0, 3, 5, 8}. Make a table. The values of c come from the domain. Substitute each value of c into the equation to determine the values of d in the range. c 8 c d (c, d) 2 8 ( 2) 10 ( 2, 10) (0, 8) (3, 5) (5, 3) (8, 0) Answer: The solution set is {( 2, 10), (0, 8), (3, 5), (5, 3), (8, 0)}.
60 Solve if the domain is { 1, 0, 2, 5}. Answer: {( 1, 6), (0, 4), (2, 0), (5, 6)}
61 Solve if the domain is {0, 1, 2, 3}. Graph the solution set. First solve the equation for y in terms of x. This makes creating a table of values easier. Original equation Subtract 9x from each side. Simplify. Divide each side by 3. Simplify.

 3 5 3(3) 4 (3, 4) Answer: The solution set is {(0, 5), (1, 2),")
62 Substitute each value of x from the domain to determine the corresponding values of y in the range. x 5 3x y (x, y) 0 5 3(0) 5 (0, 5) 1 5 3(1) 2 (1, 2) 2 5 3(2) 1 (2, 1) 3 5 3(3) 4 (3, 4) Answer: The solution set is {(0, 5), (1, 2), (2, 1), (3, 4)}. Graph the ordered pairs.

, (1, 1),")
63 Solve if the domain is {0, 1, 2, 3}. Graph the solution set. Answer: {(0, 4), (1, 1), (2, 2), (3, 5)}
64 Travel In 2002, 12 countries in Europe made the switch to a single currency, the euro. Suppose the exchange rate between U.S. dollars and euros is one dollar = 1.11 euros. The equation can be used to convert U.S. dollars to euros. If a traveler is going to spend the following amounts per day while in Europe, find the equivalent U.S. dollars for the amounts given in euros (EUR) Graph the ordered pairs. Hotel Food 90 EUR 50 EUR Transportation 30 EUR Gifts 20 EUR
65 Explore In the equation, D represents U.S. dollars and E represents the euro. However, we are given values in euros and want to find values in dollars. Solve the equation for D since the values for D depend on the given values of E. Original equation Divide each side by Plan Simplify and round to the nearest hundredth. The values of E, {90, 50, 30, 20}, are the domain. Use the equation to find the values for range.
66 Solve Make a table of values. Substitute each value of E from the domain to determine the corresponding values of D. Round to the nearest dollar. E 0.90E D (E, D) (90) $81 (90, 81) (50) $45 (50, 45) (30) $27 (30, 27) (20) $18 (20, 18)


67 Graph the ordered pairs. Answer: Notice that the values for the independent variable E are graphed along the horizontal axis, and the values for the dependent variable D are graphed along the vertical axis.
68 The equivalent amounts in U.S. dollars for the given amounts in euros is shown in the table. Expense Euros Dollars Hotel Food Transportation Gifts Examine Look at the values in the range. The cost in dollars is lower than the cost in euros. Do the results make sense?
69 Travel The exchange rate between U.S. dollars and Swiss francs is one dollar = 1.68 Swiss francs. The equation can be used to convert U.S. dollars to Swiss francs F. If a traveler is going to spend the following amounts per day while he is in Switzerland, find the equivalent U.S. dollars for the amounts given. Graph the ordered pairs. Answer: Hotel 80 francs $48 Food 45 francs $27 Transportation 35 francs $21 Gifts 15 francs $9


70
71
72 Example 1 Identify Linear Equations Example 2 Graph by Making a Table Example 3 Use the Graph of a Linear Equation Example 4 Graph Using Intercepts
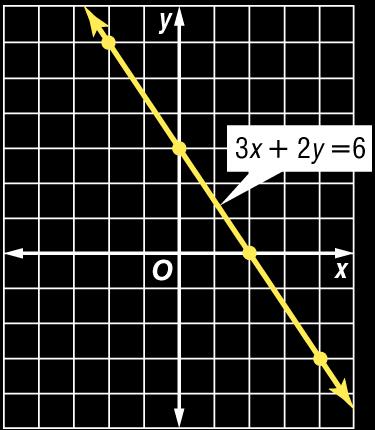
73 Determine whether is a linear equation. If so, write the equation in standard form. First rewrite the equation so that the variables are on the same side of the equation. Original equation Subtract z from each side. Simplify. Since has 3 different variables, it cannot be written in the form Answer: This is not a linear equation.
74 Determine whether is a linear equation. If so, write the equation in standard form. Rewrite the equation so that both variables are on the same side. Original equation Subtract y from each side. Simplify.
75 To write the equation with integer coefficients, multiply each term by 4. Original equation Multiply each side of the equation by 4. Simplify. The equation is now in standard form where Answer: This is a linear equation.
76 Determine whether is a linear equation. If so, write the equation in standard form. Since the GCF of 3, 6, and 27 is not 1, the equation is not written in standard form. Divide each side by the GCF. Original equation Factor the GCF. Divide each side by 3. Simplify. Answer: The equation is now in standard form where
77 Determine whether is a linear equation. If so, write the equation in standard form. To write the equation with integer coefficients, multiply each term by 4. Original equation Multiply each side of the equation by 4. Simplify.
78 Answer: The equation can be written as Therefore, it is a linear equation in standard form where
79 Determine whether each equation is a linear equation. If so, write the equation in standard form. a. Answer: linear equation; b. Answer: not a linear equation c. Answer: linear equation; d. Answer: linear equation;
80 Graph In order to find values for y more easily, solve the equation for y. Original equation Add x to each side. Simplify.
81 Multiply each side by 2. Simplify. Select five values for the domain and make a table. Then graph the ordered pairs. x y (x, y) ( 3, 4) ( 1, 0) (0, 2) (2, 6) (3, 8)


82 Answer: When you graph the ordered pairs, a pattern begins to form. The domain of is the set of all real numbers, so there are an infinite number of solutions of the equation. Draw a line through the points. This line represents all the solutions of.
83 Answer:.
 0 2.5(0) 0 (0, 0) 4 2.5(4) 10 (4, 10) 8 2.5(8) 20 (8, 20) 12 2.")
84 Shiangtai walks his dog 2.5 miles around the lake every day. Graph where m represents the number of miles walked and d represents the number of days walking. Select five values for d and make a table. Graph the ordered pairs and connect them to draw a line. d 2.5d t (d, t) 0 2.5(0) 0 (0, 0) 4 2.5(4) 10 (4, 10) 8 2.5(8) 20 (8, 20) (12) 30 (12, 30) (16) 40 (16, 40)
85 Suppose Shiangtai wanted to walk 50 miles, how many days would it take him? Since any point on the line is a solution of the equation, use the graph to estimate the value of the x-coordinate in the ordered pair that contains 50 as the y-coordinate. Answer: The ordered pair (20, 50) appears to be on the line so it should take Shiangtai 20 days to walk 50 miles. Check this solution algebraically by substituting (20, 50) into the original equation.


86 Lily rides her bike 3.5 miles every day. a. Graph the equation where m represents the number of miles Lily rides and d represents the number of days she rides. Answer: b. Suppose Lily wanted to ride 28 miles, how many days would it take her? Answer: 8 days
87 Determine the x-intercept and the y-intercept of Then graph the equation. To find the x-intercept, let. Original equation Replace y with 0. Divide each side by 4. To find the y-intercept, let. Original equation Replace x with 0. Divide each side by 1.
88 Answer: The x-intercept is 1, so the graph intersects the x-axis at (1, 0). The y-intercept is 4, so the graph intersects the y-axis at (0, 4). Plot these points. Then draw a line that connects them.

89 Determine the x-intercept and the y-intercept of. Then graph the equation. Answer: x-intercept (5, 0); y-intercept (0, 2)
90
91 Example 1 Identify Functions Example 2 Equations as Functions Example 3 Function Values Example 4 Nonlinear Function Values Example 5 Nonstandard Function Notation

92 Determine whether the relation is a function. Explain. Answer: This is a function because the mapping shows each element of the domain paired with exactly one member of the range.
93 Determine whether the relation is a function. Explain. x y Answer: This table represents a function because the table shows each element of the domain paired with exactly one element of the range.
94 Determine whether {( 5, 2), ( 2, 5), (0, 7), (0, 9)} is a function. Explain. Answer: This relation is not a function because the element 0 in the domain is paired with both 7 and 9 in the range.
95 Determine whether each relation is a function. Explain. a. Answer: This mapping represents a function since, for each element of the domain, there is only one corresponding element in the range.
96 b. X 3 1 Y 2 2 Answer: This relation is not a function because the element 3 in the domain is paired with both 2 and 1 in the range c. {(3, 0), (1, 2), (4, 0), (5, 1)} Answer: This is a function because the mapping shows each element of the domain paired with exactly one member of the range.


97 Determine whether Graph the equation. Since the graph is in the form the graph of the equation will be a line. Place your pencil at the left of the graph to represent a vertical line. Slowly move the pencil to the right across the graph. At this vertical line passes through more than one point on the graph. is a function. Answer: The graph does not pass the vertical line test. Thus, the line does not represent a function.


98 Determine whether is a function. Answer: yes
99 If find. Replace x with 4. Multiply. Subtract. Answer:
100 If find. Replace x with 5. Multiply. Subtract. Answer:
101 If find. Replace x with 2 x. Distributive Property Simplify. Answer:
102 If a. find each value. Answer: 11 b. Answer: 11 c. Answer:
103 If, find. Multiply. Simplify. Answer: Replace m with 3.
104 If, find. Replace m with 6z. Simplify. Answer:
105 If, find. Answer: Evaluate k(y) by replacing m with y. Multiply the value of k(y) by 4. Simplify.
106 If a. find each value. Answer: 8 b. Answer: c. Answer:
107 Multiple-Choice Test Item If A 69x. B 70x. C 79x. D 81x. Read the Test Item The symbol Solve the Test Item Replace x with 5. Answer: A is just a different notation for f(x). Think:. Replace x with 5. Simplify.
108 Multiple-Choice Test Item If A 35x. B 30x. C 20x. D 19x. Answer: C
109
110 Example 1 Identify Arithmetic Sequences Example 2 Extend a Sequence Example 3 Find a Specific Term Example 4 Write an Equation for a Sequence
111 Determine whether 15, 13, 11, 9,... is arithmetic. Justify your answer Answer: This is an arithmetic sequence because the difference between terms is constant.
112 Determine whether is arithmetic. Justify your answer. Answer: This is not an arithmetic sequence because the difference between terms is not constant.
113 Determine whether each sequence is arithmetic. Justify your answer. a. 2, 4, 8, 10, 12,... Answer: This is not an arithmetic sequence because the difference between terms is not constant. b. Answer: This is an arithmetic sequence because the difference between terms is constant.
114 Find the next three terms of the arithmetic sequence. 8, 11, 14, 17,... Find the common difference by subtracting successive terms The common difference is 3. Add 3 to the last term of the sequence to get the next term in the sequence. Continue adding 3 until the next three terms are found Answer: The next three terms are 20, 23, 26.
115 Find the next three terms of the arithmetic sequence. 5, 12, 19, 26,... Answer: 33, 40, 47
116 Find the 9th term of the arithmetic sequence. 7, 11, 15, 19,... In this sequence, the first term, a 1, is 7. You want to find the 9th term, Find the common difference The common difference is 4.
117 Use the formula for the nth term of an arithmetic sequence. Formula for the nth term Simplify. Answer: The 9th term in the sequence is 39.
118 Find the 12th term in the arithmetic sequence. 12, 17, 22, 27,... Answer: 67
119 Consider the arithmetic sequence 8, 1, 10, 19,... Write an equation for the nth term of the sequence. In this sequence, the first term, a 1, is 8. Find the common difference The common difference is 9. Use the formula for the nth term to write an equation. Formula for nth term Distributive Property Simplify.
120 Answer: An equation for the nth term in this sequence is. Check.. and so on.
121 Find the 12th term of the sequence. Replace n with 12 in the equation written in part a. Equation for the nth term Replace n with 12. Answer: Simplify.
 2 1 (2, 1) 3 10 (3, 10) 4 19 (4,")

122 Graph the first five terms of the sequence. n 1 8 (1, 8) 2 1 (2, 1) 3 10 (3, 10) 4 19 (4, 19) 5 28 (5, 28) Answer: Notice the points fall on a line. The graph of an arithmetic sequence is linear.

123 Consider the arithmetic sequence 3, 0, 3, 6,... a. Write an equation for the nth term of the sequence. Answer: b. Find the 18th term in the sequence. Answer: 48 c. Graph the first five terms in the sequence. Answer:
124
125 Example 1 Extend a Pattern Example 2 Patterns in a Sequence Example 3 Write an Equation from Data Example 4 Write an Equation with a Constant


126 Study the pattern below. Draw the next three figures in the pattern. The pattern consists of triangles with one-third shaded. The section that is shaded is rotated in a counterclockwise direction. The next three figures are shown. Answer:
127 Study the pattern below. Draw the 17th triangle in the pattern. The pattern repeats every third design. Therefore, designs 3, 6, 9, 12, 15, and so on will all be the same. Since 15 is the greatest number less than 17 that is a multiple of 3, the 17th triangle in the pattern will be the same as the second triangle. Answer:


128 Study the pattern below. a. Draw the next three figures in the pattern. Answer: C. Draw the 19th square in the pattern. Answer:
129 Find the next three terms in the sequence 3, 1, 3, 9,... Study the pattern in the sequence You can use inductive reasoning to find the next term in the sequence. Notice the pattern 2, 4, 6,... The difference between each term increases by two in each successive term. To find the next three terms in the sequence, continue adding two to each successive difference. Add 8, 10, and 12.
130 Answer: The next three terms are 17, 27, and 39.
131 Find the next three terms in the sequence. 1, 4, 10, 19,... Answer: 31, 46, 64


132 The table shows the number of miles driven for each hour of driving. Hours Miles Graph the data. What conclusion can you make about the relationship between the number of hours driving, h and the numbers of miles driven, m? Answer: The graph shows a linear relationship between the number of hours driving and the number of miles driven.
133 Write an equation to describe this relationship. Look at the relationship between the domain and the range to find a pattern that can be described as an equation Hours Miles
134 Hours Miles Since this is a linear relationship, the ratio of the range values to the domain values is constant. The difference of the values for h is 1, and the difference of the values for m is 50. This suggests that m = 50h. Check to see if this equation is correct by substituting values of h into the equation.
135 Check The equation checks. Answer: Since this relation is also a function, we can write the equation as where f(h) represents the number of miles driven.
136 The table below shows the number of miles walked for each hour of walking. Hours Miles a. Graph the data. What conclusion can you make about the relationship between the number of miles and the time spent walking?


137 Answer: The graph shows a linear relationship between the number of miles walked m and the time spent walking h.
138 b. Write an equation to describe the relationship. Answer:


139 Write an equation in function notation for the relation graphed below. Make a table of ordered pairs for several points on the graph x y
140 The difference in the x values is 1, and the difference in the y values is 3. The difference in y values is three times the difference of the x values. This suggests that Check this equation. Check If, then or 3. But the y value for is 1. This is a difference of 2. Try some other values in the domain to see if the same difference occurs. x x y y is always 2 less than 3x.
141 This pattern suggests that 2 should be subtracted from one side of the equation in order to correctly describe the relation. Check Answer: correctly describes this relation. Since the relation is also a function, we can write the equation in function notation as.

142 Write an equation in function notation for the relation graphed below. Answer:
143


144 Explore online information about the information introduced in this chapter. Click on the Connect button to launch your browser and go to the Algebra 1 Web site. At this site, you will find extra examples for each lesson in the Student Edition of your textbook. When you finish exploring, exit the browser program to return to this presentation. If you experience difficulty connecting to the Web site, manually launch your Web browser and go to
145 Click the mouse button or press the Space Bar to display the answers.

146

147 Click the mouse button or press the Space Bar to display the answers.
148

149 Click the mouse button or press the Space Bar to display the answers.
150

151 Click the mouse button or press the Space Bar to display the answers.

152
153 Click the mouse button or press the Space Bar to display the answers.

154

155 Click the mouse button or press the Space Bar to display the answers.

156
157 Click the mouse button or press the Space Bar to display the answers.

158
159 Click the mouse button or press the Space Bar to display the answers.

160
161 End of Custom Shows WARNING! Do Not Remove This slide is intentionally blank and is set to auto-advance to end custom shows and return to the main presentation.
162
Maintaining Mathematical Proficiency
 NBHCA SUMMER WORK FOR ALGEBRA 1 HONORS AND GEOMETRY HONORS Name 1 Add or subtract. 1. 1 3. 0 1 3. 5 4. 4 7 5. Find two pairs of integers whose sum is 6. 6. In a city, the record monthly high temperature
Review for Mastery Using Graphs and Tables to Solve Linear Systems
 3-1 Using Graphs and Tables to Solve Linear Systems A linear system of equations is a set of two or more linear equations. To solve a linear system, find all the ordered pairs (x, y) that make both equations
CCM6+/7+ - Unit 13 - Page 1 UNIT 13. Transformations CCM6+/7+ Name: Math Teacher: Projected Test Date:
 CCM6+/7+ - Unit 13 - Page 1 UNIT 13 Transformations CCM6+/7+ Name: Math Teacher: Projected Test Date: Main Idea Pages Unit 9 Vocabulary 2 Translations 3 10 Rotations 11 17 Reflections 18 22 Transformations
Let s review some things we learned earlier about the information we can gather from the graph of a quadratic.
 Section 6: Quadratic Equations and Functions Part 2 Section 6 Topic 1 Observations from a Graph of a Quadratic Function Let s review some things we learned earlier about the information we can gather from
Is there a different way to get the same result? Did we give enough information? How can we describe the position? CPM Materials modified by Mr.
 Common Core Standard: 8.G.3 Is there a different way to get the same result? Did we give enough information? How can we describe the position? CPM Materials modified by Mr. Deyo Title: IM8 Ch. 6.2.1 What
Chapter 5. Transforming Shapes
 Chapter 5 Transforming Shapes It is difficult to walk through daily life without being able to see geometric transformations in your surroundings. Notice how the leaves of plants, for example, are almost
Math 2 Coordinate Geometry Part 1 Slope & Transformations
 Math 2 Coordinate Geometry Part 1 Slope & Transformations 1 MATH 1 REVIEW: THE NUMBER LINE A number line is a visual representation of all real numbers. Each of the images below are examples of number
Algebra Area of Parallelograms
 Lesson 10.1 Reteach Algebra Area of Parallelograms The formula for the area of a parallelogram is the product of the base and height. The formula for the area of a square is the square of one of its sides.
4-1. Classifying Triangles. Lesson 4-1. What You ll Learn. Active Vocabulary
 4-1 Classifying Triangles What You ll Learn Scan Lesson 4-1. Predict two things that you expect to learn based on the headings and the Key Concept box. 1. Active Vocabulary 2. New Vocabulary Label the
Illinois Math Assessment Framework, Grade 7. correlated to
 Illinois Math Assessment Framework, Grade 7 correlated to Grade 7 correlated to Chapter 1 Variables, Expressions, and Integers (pp. 1 61) Lesson 1.1 (pp. 5 9) Expressions and Variables Evaluate and write
Focus Questions How does the new shape compare to the old shape? How do the coordinates of the new shape compare to the coordinates of the old shape?
 Learning Target: Extend their techniques for using integer expressions to record movement on a number line to using expressions to represent movement on the coordinate graph. Practice identifying whether
Unit 14: Transformations (Geometry) Date Topic Page
 Date Topic Page") Unit 14: Transformations (Geometry) Date Topic Page image pre-image transformation translation image pre-image reflection clockwise counterclockwise origin rotate 180 degrees rotate 270 degrees rotate
Unit 14: Transformations (Geometry) Date Topic Page image pre-image transformation translation image pre-image reflection clockwise counterclockwise origin rotate 180 degrees rotate 270 degrees rotate
4-7 Study Guide and Intervention Congruence Transformations
 4-7 Study Guide and Intervention Congruence Transformations Identify Congruence Transformations A congruence transformation is a transformation where the original figure, or preimage, and the transformed
New Jersey Core Curriculum Content Standards for Mathematics Grade 7 Alignment to Acellus
 New Jersey Core Curriculum Content Standards for Mathematics http://www.nj.gov/education/aps/cccs/math/ Standard 4.1.7: Number And Numerical Operations A. Number Sense 1. Extend understanding of the number
Chapter 2: Transformations. Chapter 2 Transformations Page 1
 Chapter 2: Transformations Chapter 2 Transformations Page 1 Unit 2: Vocabulary 1) transformation 2) pre-image 3) image 4) map(ping) 5) rigid motion (isometry) 6) orientation 7) line reflection 8) line
Minnesota Academic Standards for Mathematics 2007
 An Alignment of Minnesota for Mathematics 2007 to the Pearson Integrated High School Mathematics 2014 to Pearson Integrated High School Mathematics Common Core Table of Contents Chapter 1... 1 Chapter
Name: 1) Which of the following properties of an object are not preserved under a rotation? A) orientation B) none of these C) shape D) size
 Which of the following properties of an object are not preserved under a rotation? A) orientation B) none of these C) shape D) size") Name: 1) Which of the following properties of an object are not preserved under a rotation? A) orientation B) none of these C) shape D) size 2) Under a certain transformation, A B C is the image of ABC.
Name: 1) Which of the following properties of an object are not preserved under a rotation? A) orientation B) none of these C) shape D) size 2) Under a certain transformation, A B C is the image of ABC.
Name Class Date. Using Graphs to Relate Two Quantities
 4-1 Reteaching Using Graphs to Relate Two Quantities An important life skill is to be able to a read graph. When looking at a graph, you should check the title, the labels on the axes, and the general
Transformations Worksheet. How many units and in which direction were the x-coordinates of parallelogram ABCD moved? C. D.
 Name: Date: 1. Parallelogram ABCD was translated to parallelogram A B C D. 2. A shape is shown below. Which shows this shape transformed by a flip? A. B. How many units and in which direction were the
Math 3 Coordinate Geometry part 1 Unit November 3, 2016
 Reviewing the basics The number line A number line is a visual representation of all real numbers. Each of the images below are examples of number lines. The top left one includes only positive whole numbers,
PITSCO Math Individualized Prescriptive Lessons (IPLs)
") Orientation Integers 10-10 Orientation I 20-10 Speaking Math Define common math vocabulary. Explore the four basic operations and their solutions. Form equations and expressions. 20-20 Place Value Define
Orientation Integers 10-10 Orientation I 20-10 Speaking Math Define common math vocabulary. Explore the four basic operations and their solutions. Form equations and expressions. 20-20 Place Value Define
Math Geometry FAIM 2015 Form 1-A [ ]
![Math Geometry FAIM 2015 Form 1-A [ ]](/thumbs/80/81205175.jpg "Math Geometry FAIM 2015 Form 1-A [ ]") Math Geometry FAIM 2015 Form 1-A [1530458] Student Class Date Instructions Use your Response Document to answer question 13. 1. Given: Trapezoid EFGH with vertices as shown in the diagram below. Trapezoid
Math Geometry FAIM 2015 Form 1-A [1530458] Student Class Date Instructions Use your Response Document to answer question 13. 1. Given: Trapezoid EFGH with vertices as shown in the diagram below. Trapezoid
3.1. 3x 4y = 12 3(0) 4y = 12. 3x 4y = 12 3x 4(0) = y = x 0 = 12. 4y = 12 y = 3. 3x = 12 x = 4. The Rectangular Coordinate System
 4y = 12. 3x 4y = 12 3x 4(0) = y = x 0 = 12. 4y = 12 y = 3. 3x = 12 x = 4. The Rectangular Coordinate System") 3. The Rectangular Coordinate System Interpret a line graph. Objectives Interpret a line graph. Plot ordered pairs. 3 Find ordered pairs that satisfy a given equation. 4 Graph lines. 5 Find x- and y-intercepts.
3. The Rectangular Coordinate System Interpret a line graph. Objectives Interpret a line graph. Plot ordered pairs. 3 Find ordered pairs that satisfy a given equation. 4 Graph lines. 5 Find x- and y-intercepts.
Unit 6 Quadratic Functions
 Unit 6 Quadratic Functions 12.1 & 12.2 Introduction to Quadratic Functions What is A Quadratic Function? How do I tell if a Function is Quadratic? From a Graph The shape of a quadratic function is called
Name: Unit 7 Beaumont Middle School 8th Grade, Introduction to Algebra
 Unit 7 Beaumont Middle School 8th Grade, 2015-2016 Introduction to Algebra Name: I can recognize and create reflections on a coordinate grid. I can recognize and create translations on a coordinate grid.
3.1 Start Thinking. 3.1 Warm Up. 3.1 Cumulative Review Warm Up. Consider the equation y x.
 3.1 Start Thinking Consider the equation y x. Are there any values of x that you cannot substitute into the equation? If so, what are they? Are there any values of y that you cannot obtain as an answer?
Unit 0: Extending Algebra 1 Concepts
 1 What is a Function? Unit 0: Extending Algebra 1 Concepts Definition: ---Function Notation--- Example: f(x) = x 2 1 Mapping Diagram Use the Vertical Line Test Interval Notation A convenient and compact
Unit 1 Transformations in the Coordinate Plane
 Unit 1 Transformations in the Coordinate Plane Table of Contents Title Page # Formula Sheet...2 Lesson 1 1: Introduction to Transformations and Rotations 3 Lesson 1 2: Reflections and Translations..9 Lesson
Carnegie Learning Math Series Course 1, A Florida Standards Program. Chapter 1: Factors, Multiples, Primes, and Composites
 . Factors and Multiples Carnegie Learning Math Series Course, Chapter : Factors, Multiples, Primes, and Composites This chapter reviews factors, multiples, primes, composites, and divisibility rules. List
Guided Problem Solving
 -1 Guided Problem Solving GPS Student Page 57, Exercises 1 1: Match each rule with the correct translation. A. (x, y) (x, y 1 ) I. P(, 1) P (3, ) B. (x, y) (x 1 3, y) II. Q(3, 0) Q (3, ) C. (x, y) (x 1,
Unit 7. Transformations
 Unit 7 Transformations 1 A transformation moves or changes a figure in some way to produce a new figure called an. Another name for the original figure is the. Recall that a translation moves every point
Coordinate Graphing Quadrants and Reading Ordered Pairs. TeacherTwins 2015
 Coordinate Graphing Quadrants and Reading Ordered Pairs TeacherTwins 2015 Warm Up Graph the integers on a number line. 1. 2. 3. 4. 5. -5, - 2, 5, 2 0, -3, 7, -2-4, 1, -6, 8-1, 4, -7, 0 6, -8, 5, -4 Warm
Number and Operation Standard #1. Divide multi- digit numbers; solve real- world and mathematical problems using arithmetic.
 Number and Operation Standard #1 MN Math Standards Vertical Alignment for Grade 5 Demonstrate mastery of multiplication and division basic facts; multiply multi- digit numbers; solve real- world and mathematical
6.1.3 How can I describe it?
 Name: Date: Per: A# 6.1.3 How can I describe it? Describing Transformations In Lesson 6.1.2, you used words and coordinate points to describe how a triangle moved on a graph. These expressions described
Section 1.2: Points and Lines
 Section 1.2: Points and Lines Objective: Graph points and lines using x and y coordinates. Often, to get an idea of the behavior of an equation we will make a picture that represents the solutions to the
Butterflies, Pinwheels, and Wallpaper
 Butterflies, Pinwheels, and Wallpaper Investigation #3: Transforming Coordinates Investigation #4: Dilations and Similar Figures Name Butterflies, Pinwheels and Wallpaper Investigation #3 Transforming
Course Number 432/433 Title Algebra II (A & B) H Grade # of Days 120
 H Grade # of Days 120") Whitman-Hanson Regional High School provides all students with a high- quality education in order to develop reflective, concerned citizens and contributing members of the global community. Course Number
Whitman-Hanson Regional High School provides all students with a high- quality education in order to develop reflective, concerned citizens and contributing members of the global community. Course Number
Prep 8 Year: Pre-Algebra Textbook: Larson, Boswell, Kanold & Stiff. Pre-Algebra. Common Core Edition Holt McDougal, 2012.
 Prep 8 Year: Pre-Algebra Textbook: Larson, Boswell, Kanold & Stiff. Pre-Algebra. Common Core Edition Holt McDougal, 2012. Course Description: The students entering prep year have differing ranges of exposure
Integrated Math 1 Module 7 Honors Connecting Algebra and Geometry Ready, Set, Go! Homework Solutions
 1 Integrated Math 1 Module 7 Honors Connecting Algebra and Geometry Ready, Set, Go! Homework Solutions Adapted from The Mathematics Vision Project: Scott Hendrickson, Joleigh Honey, Barbara Kuehl, Travis
STANDARDS OF LEARNING CONTENT REVIEW NOTES ALGEBRA I. 2 nd Nine Weeks,
 STANDARDS OF LEARNING CONTENT REVIEW NOTES ALGEBRA I 2 nd Nine Weeks, 2016-2017 1 OVERVIEW Algebra I Content Review Notes are designed by the High School Mathematics Steering Committee as a resource for
Lesson 20: Exploiting the Connection to Cartesian Coordinates
 : Exploiting the Connection to Cartesian Coordinates Student Outcomes Students interpret complex multiplication as the corresponding function of two real variables. Students calculate the amount of rotation
Interactive Math Glossary Terms and Definitions
 Terms and Definitions Absolute Value the magnitude of a number, or the distance from 0 on a real number line Addend any number or quantity being added addend + addend = sum Additive Property of Area the
SKILL: What we want students to DO. Students will be able to: (pp. 1 61)
") TIME FRAME [By Date/Week/ Month] STANDARD OR BENCHMARK CURRICULUM End Product of Learning, What You Teach CONTENT: What we want students to KNOW. SKILL: What we want students to DO. INSTRUCTION Means to
TIME FRAME [By Date/Week/ Month] STANDARD OR BENCHMARK CURRICULUM End Product of Learning, What You Teach CONTENT: What we want students to KNOW. SKILL: What we want students to DO. INSTRUCTION Means to
Shape & Space Part C: Transformations
 Name: Homeroom: Shape & Space Part C: Transformations Student Learning Expectations Outcomes: I can describe and analyze position and motion of objects and shapes by Checking for Understanding identifying
ALGEBRA 1 NOTES. Quarter 3. Name: Block
 2016-2017 ALGEBRA 1 NOTES Quarter 3 Name: Block Table of Contents Unit 8 Exponent Rules Exponent Rules for Multiplication page 4 Negative and Zero Exponents page 8 Exponent Rules Involving Quotients page
Section 3.1 Graphing Using the Rectangular Coordinate System
 Objectives Section 3.1 Graphing Using the Rectangular Coordinate System n Construct a rectangular coordinate system n Plot ordered pairs and determine the coordinates of a point n Graph paired data n Read
Student Name: Teacher: Date: Miami-Dade County Public Schools. Test: 9_12 Mathematics Geometry Exam 2
 Student Name: Teacher: Date: District: Miami-Dade County Public Schools Test: 9_12 Mathematics Geometry Exam 2 Description: GEO Topic 5: Quadrilaterals and Coordinate Geometry Form: 201 1. If the quadrilateral
Name: Unit 3 Beaumont Middle School 8th Grade, Introduction to Algebra
 Unit 3 Beaumont Middle School 8th Grade, 2016-2017 Introduction to Algebra Name: I can identify a function, the domain and range. I can identify a linear relationship from a situation, table, graph and
Glossary Common Core Curriculum Maps Math/Grade 6 Grade 8
 Glossary Common Core Curriculum Maps Math/Grade 6 Grade 8 Grade 6 Grade 8 absolute value Distance of a number (x) from zero on a number line. Because absolute value represents distance, the absolute value
Name: Date: Period: Mrs. K. Williams ID: A
 Name: Date: Period: Mrs. K. Williams ID: A Review Assignment: Chapters 1-7 CHAPTER 1- solve each equation. 6. 1. 12x 7 67 x = 2. 6 m 12 18 m = 3. 5.4x 13 121 7. x = 4. 22.8 2p 44.4 5. p = CHAPTER 2- Determine
Lesson 8 Practice Problems
 Name: Date: Lesson 8 Skills Practice 1. Plot and label the points. A. (8, 2) B. (0, 0) C. (0, 5) D. (10, 10) E. ( 4, 4) F. ( 9, 1) G. ( 5, 0) H. (2, 8) 2. Give the coordinates of each of the points shown
Why can you be sure that the second number in the ordered pairs for this data is always greater than or equal to the first?
 Algebra II A Guided Notes Name 2-1 Guided Notes Period Relations and Functions Learning Matrix Goal #1: I can identify x & y intercepts in a graph or a set of ordered pairs. Learning Matrix Goal #2: I
MAT 003 Brian Killough s Instructor Notes Saint Leo University
 MAT 003 Brian Killough s Instructor Notes Saint Leo University Success in online courses requires self-motivation and discipline. It is anticipated that students will read the textbook and complete sample
Simi imilar Shapes lar Shapes Nesting Squares Poly lyhedr hedra and E a and Euler ler s Form s Formula ula
 TABLE OF CONTENTS Introduction......................................................... 5 Teacher s Notes....................................................... 6 NCTM Standards Alignment Chart......................................
NFC ACADEMY MATH 600 COURSE OVERVIEW
 NFC ACADEMY MATH 600 COURSE OVERVIEW Math 600 is a full-year elementary math course focusing on number skills and numerical literacy, with an introduction to rational numbers and the skills needed for
MATHLINKS: GRADE 6 CORRELATION OF STUDENT PACKETS TO THE RESOURCE GUIDE
 MATHLINKS: GRADE 6 CORRELATION OF STUDENT PACKETS TO THE RESOURCE GUIDE Referenced here is the vocabulary, explanations, and examples from the Resource Guide that support the learning of the goals in each
Math 2 Final Exam Study Guide. Translate down 2 units (x, y-2)
") Math 2 Final Exam Study Guide Name: Unit 2 Transformations Translation translate Slide Moving your original point to the left (-) or right (+) changes the. Moving your original point up (+) or down (-)
Math 2 Final Exam Study Guide Name: Unit 2 Transformations Translation translate Slide Moving your original point to the left (-) or right (+) changes the. Moving your original point up (+) or down (-)
Geometry Semester Exam Review Packet
 Geometry Semester Exam Review Packet Name: Chapter 1 1. Decide which transformation was used on each pair of shapes below. Some may have undergone more than one transformation, but try to name a single
round decimals to the nearest decimal place and order negative numbers in context
 6 Numbers and the number system understand and use proportionality use the equivalence of fractions, decimals and percentages to compare proportions use understanding of place value to multiply and divide
TN READY PRACTICE TEST DATE PERIOD Q4 TEST #1 PART 1 NO CALCULATOR
 NAME TN READY PRACTICE TEST DATE PERIOD Q4 TEST #1 PART 1 NO CALCULATOR 1. Between which two consecutive rational numbers is each irrational number? Choose two consecutive rational numbers for each irrational
CCGPS UNIT 5 Semester 2 COORDINATE ALGEBRA Page 1 of 38. Transformations in the Coordinate Plane
 CCGPS UNIT 5 Semester 2 COORDINATE ALGEBRA Page 1 of 38 Transformations in the Coordinate Plane Name: Date: MCC9-12.G.CO.1 Know precise definitions of angle, circle, perpendicular line, parallel line,
Prentice Hall Mathematics Course Correlated to: Archdiocese of Chicago (Illinois) Mathematics Curriculum Frameworks (2004) Grades 6-12
 Mathematics Curriculum Frameworks (2004) Grades 6-12") Archdiocese of Chicago (Illinois) Mathematics Curriculum Frameworks (2004) Grades 6-12 Goal Outcome Outcome Statement Priority Code Chapter Topic 6 6.01 6.06.01 - Represent place values from millionths
Archdiocese of Chicago (Illinois) Mathematics Curriculum Frameworks (2004) Grades 6-12 Goal Outcome Outcome Statement Priority Code Chapter Topic 6 6.01 6.06.01 - Represent place values from millionths
Comparing and Modeling with Functions
 Name Date Class 13 Comparing and Modeling with Functions Quiz 1. Which of the following data sets is best described by a linear model? A {(5, 1), (4, 2), (3, 4), (2, 8)} B {(5, 1), (4, 1), (3, 3), (2,
Grade 7 Math Curriculum Map Erin Murphy
 Topic 1 Algebraic Expressions and Integers 2 Weeks Summative Topic Test: SWBAT use rules to add and subtract integers, Evaluate algebraic expressions, use the order of operations, identify numerical and
Unit 12 Special Functions
 Algebra Notes Special Functions Unit 1 Unit 1 Special Functions PREREQUISITE SKILLS: students should be able to describe a relation and a function students should be able to identify the domain and range
6th Grade Math Learning Targets. Grade 6 Algebra
 6th Grade Math Learning Targets Grade 6 Algebra 6.A.1.1. Students are able to use order of operations, excluding nested parentheses and exponents, to simplify whole number expressions. Application I can
Name Homework Packet Week #12
 1. All problems with answers or work are examples. Lesson 4.4 Complete the table for each given sequence then graph each sequence on the coordinate plane. Term Number (n) Value of Term ( ) 1 2 3 4 5 6
10 steps to (Edexcel) Certificate Success! A PiXL 10-session Booster Resource aimed at E/F/G Borderline candidates
 Certificate Success! A PiXL 10-session Booster Resource aimed at E/F/G Borderline candidates") 10 steps to (Edexcel) Certificate Success! A PiXL 10-session Booster Resource aimed at E/F/G Borderline candidates PiXL Maths Associates Page 1 Contents Session 1 Basic Arithmetic & BODMAS 1.1 Write a
10 steps to (Edexcel) Certificate Success! A PiXL 10-session Booster Resource aimed at E/F/G Borderline candidates PiXL Maths Associates Page 1 Contents Session 1 Basic Arithmetic & BODMAS 1.1 Write a
Unit 1. Name. Basics of Geometry Part 1. 2 Section 1: Introduction to Geometry Points, Lines and Planes
 Name Period Date Points, lines, and planes are the building blocks of geometry. What is geometry? Unit 1 Basics of Geometry Part 1 Geometry means, and it involves the properties of points, lines, planes
Gateway Regional School District VERTICAL ALIGNMENT OF MATHEMATICS STANDARDS Grades 5-8
 NUMBER SENSE & OPERATIONS 5.N.7 Compare and order whole numbers, positive fractions, positive mixed numbers, positive decimals, and percents. Fractions 1/2, 1/3, 1/4, 1/5, 1/10 and equivalent decimals
Grade 4 ISTEP+ T1 #1-2 ISTEP+ T1 # Identify, describe and draw parallelograms, rhombuses, and ISTEP+ T1 #5-6
 Unit 1 Naming and Constructing Geometric Figures 1 a B Use a compass and straightedge to construct geometric figures. 4.4.1 Identify, describe, and draw rays, right angles, acute angles, obtuse ISTEP+
Montana City School GRADE 5
 Montana City School GRADE 5 Montana Standard 1: Students engage in the mathematical processes of problem solving and reasoning, estimation, communication, connections and applications, and using appropriate
Hands-On Standards Deluxe Grades: 7, 8 States: California Content Standards
 Hands-On Standards Deluxe Grades: 7, 8 States: Hands-On Standards Deluxe Edition Kit, Grades 5-6: Algebra Summary: This resource guide meets 5 and 6 math curriculum standards by matching activities to
Students will understand 1. that numerical expressions can be written and evaluated using whole number exponents
 Grade 6 Expressions and Equations Essential Questions: How do you use patterns to understand mathematics and model situations? What is algebra? How are the horizontal and vertical axes related? How do
Functions. Copyright Cengage Learning. All rights reserved.
 Functions Copyright Cengage Learning. All rights reserved. 2.2 Graphs Of Functions Copyright Cengage Learning. All rights reserved. Objectives Graphing Functions by Plotting Points Graphing Functions with
Lesson 20: Every Line is a Graph of a Linear Equation
 Student Outcomes Students know that any non vertical line is the graph of a linear equation in the form of, where is a constant. Students write the equation that represents the graph of a line. Lesson
Unit #3: Quadratic Functions Lesson #13: The Almighty Parabola. Day #1
 Algebra I Unit #3: Quadratic Functions Lesson #13: The Almighty Parabola Name Period Date Day #1 There are some important features about the graphs of quadratic functions we are going to explore over the
Algebra II. Working with Rational Expressions. Slide 1 / 179 Slide 2 / 179. Slide 4 / 179. Slide 3 / 179. Slide 6 / 179.
 Slide 1 / 179 Slide 2 / 179 Algebra II Rational Expressions & Equations 2015-08-15 www.njctl.org Slide 3 / 179 Slide 4 / 179 Table of Contents Working with Rational Expressions Joint and Inverse Variation
12.4 Rotations. Learning Objectives. Review Queue. Defining Rotations Rotations
 12.4. Rotations www.ck12.org 12.4 Rotations Learning Objectives Find the image of a figure in a rotation in a coordinate plane. Recognize that a rotation is an isometry. Review Queue 1. Reflect XY Z with
Lesson 8: Graphs and Graphing Linear Equations
 A critical skill required for the study of algebra is the ability to construct and interpret graphs. In this lesson we will learn how the Cartesian plane is used for constructing graphs and plotting data.
Unit 2: Transformations. 2. Which of the following best shows a reflection (flip) of the shaded shape across the dashed line?
 of the shaded shape across the dashed line?") Name: Date: 1. Which of the following best represents only a translation (slide) up? 2. Which of the following best shows a reflection (flip) of the shaded shape across the dashed line? D. D. page 1 3.
Name: Date: 1. Which of the following best represents only a translation (slide) up? 2. Which of the following best shows a reflection (flip) of the shaded shape across the dashed line? D. D. page 1 3.
H Geo Final Review Packet Multiple Choice Identify the choice that best completes the statement or answers the question.
 H Geo Final Review Packet Multiple Choice Identif the choice that best completes the statement or answers the question. 1. Which angle measures approximatel 7?.. In the figure below, what is the name of
Geometry R. Unit 12 Coordinate Geometry. Day Classwork Day Homework Wednesday 3/7 Thursday 3/8 Friday 3/9
 Geometry R Unit 12 Coordinate Geometry Day Classwork Day Homework Wednesday 3/7 Thursday 3/8 Friday 3/9 Unit 11 Test Review Equations of Lines 1 HW 12.1 Perimeter and Area of Triangles in the Coordinate
MCAS/DCCAS Mathematics Correlation Chart Grade 6
 MCAS/DCCAS Mathematics Correlation Chart Grade 6 MCAS Finish Line Mathematics Grade 6 MCAS Standard DCCAS Standard DCCAS Standard Description Unit 1: Number Sense Lesson 1: Whole Number and Decimal Place
Unit 4 Guided Notes Part 2 Geometry
 Unit 4 Guided Notes Part 2 Geometry Name: Important Vocabulary: Transformation: A change in,, or of a geometric figure. Rigid transformation: A transformation that preserves measures and of segments. Transformation
Algebra II. Slide 1 / 179. Slide 2 / 179. Slide 3 / 179. Rational Expressions & Equations. Table of Contents
 Slide 1 / 179 Slide 2 / 179 Algebra II Rational Expressions & Equations 2015-08-15 www.njctl.org Table of Contents Slide 3 / 179 Working with Rational Expressions Joint and Inverse Variation Simplifying
Reflections and Translations
 Name: ate: 1. Parallelogram ABC was translated to parallelogram A B C. 2. Alyssa made the design shown below. How many units and in which direction were the x-coordinates of parallelogram ABC moved? A.
Contents. PART 1 Unit 1: Number Sense. Unit 2: Patterns and Algebra. Unit 3: Number Sense
 Contents PART 1 Unit 1: Number Sense NS7-1 Place Value 1 NS7-2 Order of Operations 3 NS7-3 Equations 6 NS7-4 Properties of Operations 8 NS7-5 Multiplication and Division with 0 and 1 12 NS7-6 The Area
Middle School Math Course 3 Correlation of the ALEKS course Middle School Math 3 to the Illinois Assessment Framework for Grade 8
 Middle School Math Course 3 Correlation of the ALEKS course Middle School Math 3 to the Illinois Assessment Framework for Grade 8 State Goal 6: Number Sense 6.8.01: 6.8.02: 6.8.03: 6.8.04: 6.8.05: = ALEKS
Unit 1 NOTES Honors Math 2 1
 Unit 1 NOTES Honors Math 2 1 Day 1: Introduction to Transformations and Translations Warm-Up: Prerequisite Skill: Graphing Lines Graph the following lines. 1) x = 2 2) y = 4 3) y = x (Hint: this is y =
2.2 Graphs Of Functions. Copyright Cengage Learning. All rights reserved.
 2.2 Graphs Of Functions Copyright Cengage Learning. All rights reserved. Objectives Graphing Functions by Plotting Points Graphing Functions with a Graphing Calculator Graphing Piecewise Defined Functions
7 th GRADE PLANNER Mathematics. Lesson Plan # QTR. 3 QTR. 1 QTR. 2 QTR 4. Objective
 Standard : Number and Computation Benchmark : Number Sense M7-..K The student knows, explains, and uses equivalent representations for rational numbers and simple algebraic expressions including integers,
Marking Period 3. Marking Period 1. Marking Period 4. Marking Period 2. DEPARTMENT: Mathematics COURSE: Math 8. Week. Week. Week.
 DEPARTMENT: Mathematics COURSE: Math 8 Week Marking Period 1 Week Marking Period 3 1 Transformations & Similar Shapes 21 Functions & Algebra 2 Transformations & Similar Shapes 22 Functions & Algebra 3
Instructional. Essential Standards. Materials. Envision Topic 1 1-1; 1-2; 1-3; 1-4. Envision Topic 2 2-2; 2-3. Envision Topic 2 2-4; 2-5; 2-6
 Time Frame Period 1 Dates: Sept.4 Oct.26 Big Idea/Topic Essential Standards NS1.1 Estimate, round, and manipulate very large and very small numbers. Materials Envision Topic 1 1-1; 1-2; 1-3; 1-4 Envision
Mathematics 12 Pre-Calculus WNCP
 Mathematics 1 Pre-Calculus WNCP Page 1 Page Page 3-8 Page 9-1 General Information Record Chart Sample Guided Outlines Sample Unit Test Pages Textbook This course uses the textbook Pre-Calculus 1 ISBN 978007073870
Math A Regents Exam 0103 Page 1
 Math A Regents Exam 0103 Page 1 1. 010301a, P.I. A.S.6 The accompanying diagram shows a box-andwhisker plot of student test scores on last year's Mathematics A midterm examination. 4. 010304a, P.I. 7.N.3
Scope and Sequence for the New Jersey Core Curriculum Content Standards
 Scope and Sequence for the New Jersey Core Curriculum Content Standards The following chart provides an overview of where within Prentice Hall Course 3 Mathematics each of the Cumulative Progress Indicators
First Trimester Second Trimester Third Trimester
 STANDARD 1 Number Sense: Develop number sense and use numbers and number relationships in problem-solving situations and communicate the reasoning used in solving these problems. (Aligned to Everyday Mathematics
Vertical Line Test a relationship is a function, if NO vertical line intersects the graph more than once
 Algebra 2 Chapter 2 Domain input values, X (x, y) Range output values, Y (x, y) Function For each input, there is exactly one output Example: Vertical Line Test a relationship is a function, if NO vertical
Transform both equations in each system of equations so that each coefficient is an integer.
 Algebra 1 (2nd Semester Exam Review) Name 1. Write each expression in rational exponent form. a. b. 2. Write each expression in radical form. a. b. What is the simplified form of each expression? 3. 4.