2.6: Solving Systems of Linear Inequalities
|
|
|
- Amberly Woods
- 5 years ago
- Views:
Transcription


 Check (4, 10) 9x")
 10 23 YES 36")
 + 0.")


")
 + 1-1 > -(2) + 2-1")


1 Quick Review 2.6: Solving Systems of Linear Inequalities = - What is the difference between an equation and <,> an inequality? Which one is shaded? Inequality - When is the line solid?, - When is the line dashed (dotted)? <, > - How do you figure out where to shade? Pick a point to plug in. Graph this inequality: y > x 2 m = 1 b = -2 Check if it s a solution 1. (4, 10) Check (4, 10) 9x y 23 5x + 0.2y 20 9(4) YES x y 23 5x + 0.2y 20 5(4) + 0.2(10) Graphing Systems of Linear Inequalities Graph each system 3. y < 2 4. y > x 2 x -1 y - ½ x (2, -1) y 4x + 1 y > -x + 2 NO Check (2, -1) y 4x + 1 y > -x (2) > -(2) > Graphing Systems of Linear Inequalities Graph each system 5. y > 2x 5 6. y -x + 2 3x + 4y < 12 2x + 4y < 4 Writing Systems of Linear Inequalities Equation Write the inequalities for each system y 4 3 y x 2 1 y x 2 4 y 2 x 4


2 STARTER 2.6


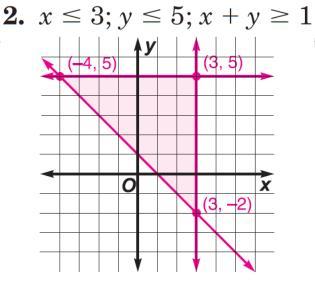
3 Practice 2.6, #6 Practice 2.6, #7 The graph of a linear inequality in two variables is a half-plane. The boundary line of the half-plane is dashed if the inequality is < or > and solid if the inequality is or. Two or more linear inequalities form a system of linear inequalities or simply a system of inequalities. A solution of a system of a system of linear inequalities is an ordered pair that is a solution of each inequality in the system. The graph of a system of linear inequalities is the graph of all solutions of the system. PRACTICE 2.6 A Triangular Solution Region Graph the system of linear inequalities. y < 2 Inequality 1 x 1 Inequality 2 y > x 2 Inequality 3 SOLUTION Graph all three inequalities in the same coordinate plane. The graph of the system is the overlap, or the intersection, of the three half-planes shown. CHECK You can see from the graph that the point (2, 1) is a solution of the system. To check this, substitute the point into each inequality. 1 < > 2 2
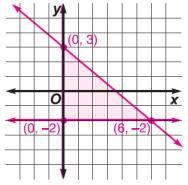
4 A Triangular Solution Region Graph the system of linear inequalities. The point (0, 3) is not in the graph of the system. Notice (0, 3) is not a solution of inequality 1. This point is not a solution of the system. When graphing a system of inequalities, it is helpful to find each corner point (or vertex). For instance, this graph has three corner points: ( 1, 2), ( 1, 3), and (4, 2). y < 2 Inequality 1 x 1 Inequality 2 y > x 2 Inequality 3 Solution Region Between Parallel Lines Write a system of inequalities that defines the shaded region shown. SOLUTION The graph of one inequality is the half-plane below the line y = 3. The graph of the other inequality is the half-plane above the line y = 1. The shaded region of the graph is the horizontal band that lies between the two horizontal lines, y = 3 and y = 1, but not on the lines. The system of linear inequalities at the right defines the shaded region. y < 3 Inequality 1 y > 1 Inequality 2 x 0 x 0 y 0 The graph of the first inequality is the half-plane on and to the right of the y-axis. The graph of the first inequality is the half-plane on and to the right of the y-axis. The graph of the second inequality is the half-plane on and above of the x-axis. y 2 y 2 1 y 2 x + 3. The graph of the third inequality is the half-plane on and below the horizontal line y = 2. The graph of the third inequality is the half-plane on and below the horizontal line y = 2. The graph of the fourth inequality is the half-plane on and below the line y = 1 2 x + 3.
 is not a vertex of the solution region even though two boundary lines meet at that point.")
5 The region that lies in all four half-planes is a quadrilateral with vertices at (0, 2), (0, 0), (6, 0), and (2, 2). Verbal Model Number of medium-throws 3 Number of long-throws 1 Note that (0, 3) is not a vertex of the solution region even though two boundary lines meet at that point. Number of mediumthrows Price of a mediumthrow + Number of longthrows Price of a longthrow 10,000 Labels Number of medium-throws = x Number of long-throws = y (no units) (no units) Algebraic Model x 3 Inequality 1 Price of a medium-throw = 1000 (dollars) y 1 Inequality 2 Price of a long-throw = 3500 (dollars) 1000x y 10,000 Inequality 3 The graph of the system of inequalities is shown. Any point in the shaded region of the graph is a solution to the system. A fraction of a spotlight cannot be ordered, so only ordered pairs of integers in the shaded region will correctly answer the problem. Will an order of 4 medium-throw spotlights and 1 long-throw spotlight be delivered free? The point (4, 1) is outside the solution region, so an order of 4 medium-throw spotlights and 1 long-throw spotlight would not be delivered free.
6.5. SYSTEMS OF INEQUALITIES
 6.5. SYSTEMS OF INEQUALITIES What You Should Learn Sketch the graphs of inequalities in two variables. Solve systems of inequalities. Use systems of inequalities in two variables to model and solve real-life
Review for Mastery Using Graphs and Tables to Solve Linear Systems
 3-1 Using Graphs and Tables to Solve Linear Systems A linear system of equations is a set of two or more linear equations. To solve a linear system, find all the ordered pairs (x, y) that make both equations
LINEAR PROGRAMMING: A GEOMETRIC APPROACH. Copyright Cengage Learning. All rights reserved.
 3 LINEAR PROGRAMMING: A GEOMETRIC APPROACH Copyright Cengage Learning. All rights reserved. 3.1 Graphing Systems of Linear Inequalities in Two Variables Copyright Cengage Learning. All rights reserved.
Algebra Unit 2: Linear Functions Notes. Slope Notes. 4 Types of Slope. Slope from a Formula
 Undefined Slope Notes Types of Slope Zero Slope Slope can be described in several ways: Steepness of a line Rate of change rate of increase or decrease Rise Run Change (difference) in y over change (difference)
Mathematics for Business and Economics - I. Chapter7 Linear Inequality Systems and Linear Programming (Lecture11)
") Mathematics for Business and Economics - I Chapter7 Linear Inequality Systems and Linear Programming (Lecture11) A linear inequality in two variables is an inequality that can be written in the form Ax
Mathematics for Business and Economics - I Chapter7 Linear Inequality Systems and Linear Programming (Lecture11) A linear inequality in two variables is an inequality that can be written in the form Ax
Systems of Equations and Inequalities. Copyright Cengage Learning. All rights reserved.
 5 Systems of Equations and Inequalities Copyright Cengage Learning. All rights reserved. 5.5 Systems of Inequalities Copyright Cengage Learning. All rights reserved. Objectives Graphing an Inequality Systems
ax + by = 0. x = c. y = d.
 Review of Lines: Section.: Linear Inequalities in Two Variables The equation of a line is given by: ax + by = c. for some given numbers a, b and c. For example x + y = 6 gives the equation of a line. A
Graphing Linear Equations
 Graphing Linear Equations A.REI.10 Understand that the graph of an equation in two variables is the set of all its solutions plotted in the coordinate plane. What am I learning today? How to graph a linear
Graphing Linear Inequalities
 Graphing Linear Inequalities Basic Mathematics Review 837 Linear inequalities pla an important role in applied mathematics. The are used in an area of mathematics called linear programming which was developed
6.7. Graph Linear Inequalities in Two Variables. Warm Up Lesson Presentation Lesson Quiz
 6.7 Graph Linear Inequalities in Two Variables Warm Up Lesson Presentation Lesson Quiz 6.7 Warm-Up Tell whether the ordered pair is a solution of the equation. 1. x + 2y = 4; (2, 1) no 2. 4x + 3y = 22;
Math 1313 Prerequisites/Test 1 Review
 Math 1313 Prerequisites/Test 1 Review Test 1 (Prerequisite Test) is the only exam that can be done from ANYWHERE online. Two attempts. See Online Assignments in your CASA account. Note the deadline too.
Because the inequality involves, graph the boundary using a solid line. Choose (0, 0) as a test point.
 as a test point.") Graph each inequality. 12. y < x 3 y < x 3 Because the inequality involves
Graph each inequality. 12. y < x 3 y < x 3 Because the inequality involves
Section 4.5 Linear Inequalities in Two Variables
 Section 4.5 Linear Inequalities in Two Variables Department of Mathematics Grossmont College February 25, 203 4.5 Linear Inequalities in Two Variables Learning Objectives: Graph linear inequalities in
Section 18-1: Graphical Representation of Linear Equations and Functions
 Section 18-1: Graphical Representation of Linear Equations and Functions Prepare a table of solutions and locate the solutions on a coordinate system: f(x) = 2x 5 Learning Outcome 2 Write x + 3 = 5 as
Algebra I Notes Linear Equations and Inequalities in Two Variables Unit 04c
 Big Idea: Describe the similarities and differences between equations and inequalities including solutions and graphs. Skill: graph linear equations and find possible solutions to those equations using
Name: Date: Study Guide: Systems of Equations and Inequalities
 Name: Date: Study Guide: Systems of Equations and Inequalities Systems of Equations Linear systems consist of two or more linear equations in the same variables. A solution to the linear system of equations
Algebra I Notes Unit Six: Graphing Linear Equations and Inequalities in Two Variables, Absolute Value Functions
 Sllabus Objective.4 The student will graph linear equations and find possible solutions to those equations using coordinate geometr. Coordinate Plane a plane formed b two real number lines (axes) that
Section 2.0: Getting Started
 Solving Linear Equations: Graphically Tabular/Numerical Solution Algebraically Section 2.0: Getting Started Example #1 on page 128. Solve the equation 3x 9 = 3 graphically. Intersection X=4 Y=3 We are
Systems of Inequalities and Linear Programming 5.7 Properties of Matrices 5.8 Matrix Inverses
 5 5 Systems and Matrices Systems and Matrices 5.6 Systems of Inequalities and Linear Programming 5.7 Properties of Matrices 5.8 Matrix Inverses Sections 5.6 5.8 2008 Pearson Addison-Wesley. All rights
Sect Linear Inequalities in Two Variables
 Sect 9. - Linear Inequalities in Two Variables Concept # Graphing a Linear Inequalit in Two Variables Definition Let a, b, and c be real numbers where a and b are not both zero. Then an inequalit that
Chapter 3 Linear Programming: A Geometric Approach
 Chapter 3 Linear Programming: A Geometric Approach Section 3.1 Graphing Systems of Linear Inequalities in Two Variables y 4x + 3y = 12 4 3 4 x 3 y 12 x y 0 x y = 0 2 1 P(, ) 12 12 7 7 1 1 2 3 x We ve seen
7.6 Solve Linear Systems of
 7.6 Solve Linear Sstems of Linear Inequalities Goal p Solve sstems of linear inequalities in two variables. Your Notes VOCABULARY Sstem of linear inequalities Solution of a sstem of linear inequalities
Vertical Line Test a relationship is a function, if NO vertical line intersects the graph more than once
 Algebra 2 Chapter 2 Domain input values, X (x, y) Range output values, Y (x, y) Function For each input, there is exactly one output Example: Vertical Line Test a relationship is a function, if NO vertical
Intro. To Graphing Linear Equations
 Intro. To Graphing Linear Equations The Coordinate Plane A. The coordinate plane has 4 quadrants. B. Each point in the coordinate plain has an x-coordinate (the abscissa) and a y-coordinate (the ordinate).
UNIT 4 NOTES. 4-1 and 4-2 Coordinate Plane
 UNIT 4 NOTES 4-1 and 4-2 Coordinate Plane y Ordered pairs on a graph have several names. (X coordinate, Y coordinate) (Domain, Range) (Input,Output) Plot these points and label them: a. (3,-4) b. (-5,2)
INEQUALITIES Graphing Linear Inequalities Common Core Standard
 F Inequalities, Lesson 4, Graphing Linear Inequalities (r. 2018) INEQUALITIES Graphing Linear Inequalities Common Core Standard A-REI.12 Graph the solutions to a linear inequality in two variables as a
Sketching Straight Lines (Linear Relationships)
") Sketching Straight Lines (Linear Relationships) The slope of the line is m = y x = y 2 y 1 = rise run. Horizontal lines have the form y = b and have slope m = 0. Vertical lines have the form x = a and
Sketching Straight Lines (Linear Relationships) The slope of the line is m = y x = y 2 y 1 = rise run. Horizontal lines have the form y = b and have slope m = 0. Vertical lines have the form x = a and
Section Graphs and Lines
 Section 1.1 - Graphs and Lines The first chapter of this text is a review of College Algebra skills that you will need as you move through the course. This is a review, so you should have some familiarity
Graphing Equations Case 1: The graph of x = a, where a is a constant, is a vertical line. Examples a) Graph: x = x
 Graph: x = x") 06 CHAPTER Algebra. GRAPHING EQUATIONS AND INEQUALITIES Tetbook Reference Section 6. &6. CLAST OBJECTIVE Identif regions of the coordinate plane that correspond to specific conditions and vice-versa Graphing
06 CHAPTER Algebra. GRAPHING EQUATIONS AND INEQUALITIES Tetbook Reference Section 6. &6. CLAST OBJECTIVE Identif regions of the coordinate plane that correspond to specific conditions and vice-versa Graphing
9.1 Linear Inequalities in Two Variables Date: 2. Decide whether to use a solid line or dotted line:
 9.1 Linear Inequalities in Two Variables Date: Key Ideas: Example Solve the inequality by graphing 3y 2x 6. steps 1. Rearrange the inequality so it s in mx ± b form. Don t forget to flip the inequality
MATH SPEAK - TO BE UNDERSTOOD AND MEMORIZED DETERMINING THE INTERSECTIONS USING THE GRAPHING CALCULATOR
 FOM 11 T15 INTERSECTIONS & OPTIMIZATION PROBLEMS - 1 1 MATH SPEAK - TO BE UNDERSTOOD AND MEMORIZED 1) INTERSECTION = a set of coordinates of the point on the grid where two or more graphed lines touch
Activity One: Getting started with linear programming. This problem is based on a problem in the Algebra II Indicators for Goal 1.
 Linear Programming Goals: 1. Describe graphically, algebraically, and verbally real-world phenomena as functions; identify the independent and dependent variables (3.01) 2. Translate among graphic, algebraic,
Algebra II Notes Unit Two: Linear Equations and Functions
 Syllabus Objectives:.1 The student will differentiate between a relation and a function.. The student will identify the domain and range of a relation or function.. The student will derive a function rule
Concept: Solving Inequalities Name:
 Concept: Solving Inequalities Name: You should have completed Equations Section 7 Part A: Solving Inequalities before beginning this handout. COMPUTER COMPONENT Instructions: In follow the Content Menu
+ Solving Linear Inequalities. Mr. Smith IM3
 + Solving Linear Inequalities Mr. Smith IM3 + Inequality Symbols < > Less than Greater than Less than or equal to Greater than or equal to Not equal to + Linear Inequality n Inequality with one variable
Classwork/Homework. Midterm Review. 1) 9 more than the product of a number and 12 2) 5 less than a number squared is twelve.
 9 more than the product of a number and 12 2) 5 less than a number squared is twelve.") Name: Classwork/Homework Midterm Review Verbal Expressions *Translate the words to math * *The word THAN changes the order of the terms *Square Root, Cube Root 3 *Squared x 2, Cubed x 3 *Quantity use parentheses!
Name: Classwork/Homework Midterm Review Verbal Expressions *Translate the words to math * *The word THAN changes the order of the terms *Square Root, Cube Root 3 *Squared x 2, Cubed x 3 *Quantity use parentheses!
Graphing Method. Graph of x + y < > y 10. x
 Graphing Method Eample: Graph the inequalities on the same plane: + < 6 and 2 - > 4. Before we graph them simultaneousl, let s look at them separatel. 10-10 10 Graph of + < 6. ---> -10 Graphing Method
Graphing Linear Inequalities in Two Variables.
 Many applications of mathematics involve systems of inequalities rather than systems of equations. We will discuss solving (graphing) a single linear inequality in two variables and a system of linear
Question 2: How do you solve a linear programming problem with a graph?
 Question : How do you solve a linear programming problem with a graph? Now that we have several linear programming problems, let s look at how we can solve them using the graph of the system of inequalities.
Chapter 3 Practice Test
 1. Complete parts a c for each quadratic function. a. Find the y-intercept, the equation of the axis of symmetry, and the x-coordinate of the vertex. b. Make a table of values that includes the vertex.
Slide 1 / 96. Linear Relations and Functions
 Slide 1 / 96 Linear Relations and Functions Slide 2 / 96 Scatter Plots Table of Contents Step, Absolute Value, Piecewise, Identity, and Constant Functions Graphing Inequalities Slide 3 / 96 Scatter Plots
Year 10 Term 2 Homework
 Yimin Math Centre Year 10 Term 2 Homework Student Name: Grade: Date: Score: Table of contents 5 Year 10 Term 2 Week 5 Homework 1 5.1 Graphs in the number plane................................ 1 5.1.1 The
Chapter 1. Linear Equations and Straight Lines. 2 of 71. Copyright 2014, 2010, 2007 Pearson Education, Inc.
 Chapter 1 Linear Equations and Straight Lines 2 of 71 Outline 1.1 Coordinate Systems and Graphs 1.4 The Slope of a Straight Line 1.3 The Intersection Point of a Pair of Lines 1.2 Linear Inequalities 1.5
Mathematics Scope & Sequence Algebra I
 Mathematics Scope & Sequence 2016-17 Algebra I Revised: June 20, 2016 First Grading Period (24 ) Readiness Standard(s) Solving Equations and Inequalities A.5A solve linear equations in one variable, including
Unit 2A: Systems of Equations and Inequalities
 Unit A: Systems of Equations and Inequalities In this unit, you will learn how to do the following: Learning Target #1: Creating and Solving Systems of Equations Identify the solution to a system from
Finite Math - J-term Homework. Section Inverse of a Square Matrix
 Section.5-77, 78, 79, 80 Finite Math - J-term 017 Lecture Notes - 1/19/017 Homework Section.6-9, 1, 1, 15, 17, 18, 1, 6, 9, 3, 37, 39, 1,, 5, 6, 55 Section 5.1-9, 11, 1, 13, 1, 17, 9, 30 Section.5 - Inverse
Math 2 Coordinate Geometry Part 3 Inequalities & Quadratics
 Math 2 Coordinate Geometry Part 3 Inequalities & Quadratics 1 DISTANCE BETWEEN TWO POINTS - REVIEW To find the distance between two points, use the Pythagorean theorem. The difference between x 1 and x
Appendix F: Systems of Inequalities
 Appendi F: Sstems of Inequalities F. Solving Sstems of Inequalities The Graph of an Inequalit What ou should learn The statements < and ⱖ are inequalities in two variables. An ordered pair 共a, b兲 is a
Graphing Linear Functions - Review 1. = 6 2. = = = Sketch the graph of each line
 FOM 11 Graphing Linear Functions - Review Sketch the graph of each line 1. =. = +1 3. 3 =1. +7= 5. a) Graph the linear function that goes through (, 3) and is perpendicular to = 11 b) What is the equation
We have already studied equations of the line. There are several forms:
 Chapter 13-Coordinate Geometry extended. 13.1 Graphing equations We have already studied equations of the line. There are several forms: slope-intercept y = mx + b point-slope y - y1=m(x - x1) standard
notes13.1inclass May 01, 2015
 Chapter 13-Coordinate Geometry extended. 13.1 Graphing equations We have already studied equations of the line. There are several forms: slope-intercept y = mx + b point-slope y - y1=m(x - x1) standard
Partial Fraction Decomposition
 Section 7. Partial Fractions 53 Partial Fraction Decomposition Algebraic techniques for determining the constants in the numerators of partial fractions are demonstrated in the eamples that follow. Note
Quadratic Equations Group Acitivity 3 Business Project Week #5
 MLC at Boise State 013 Quadratic Equations Group Acitivity 3 Business Project Week #5 In this activity we are going to further explore quadratic equations. We are going to analyze different parts of the
Concept: Solving Inequalities Name:
 Concept: Solving Inequalities Name: You should have completed Equations Section 7 Part A: Solving Inequalities before beginning this handout. COMPUTER COMPONENT Instructions: In follow the Content Menu
7.5. Systems of Inequalities. The Graph of an Inequality. What you should learn. Why you should learn it
 0_0705.qd /5/05 9:5 AM Page 5 Section 7.5 7.5 Sstems of Inequalities 5 Sstems of Inequalities What ou should learn Sketch the graphs of inequalities in two variables. Solve sstems of inequalities. Use
UNIT 6 MODELLING DECISION PROBLEMS (LP)
") UNIT 6 MODELLING DECISION This unit: PROBLEMS (LP) Introduces the linear programming (LP) technique to solve decision problems 1 INTRODUCTION TO LINEAR PROGRAMMING A Linear Programming model seeks to maximize
UNIT 6 MODELLING DECISION This unit: PROBLEMS (LP) Introduces the linear programming (LP) technique to solve decision problems 1 INTRODUCTION TO LINEAR PROGRAMMING A Linear Programming model seeks to maximize
Example 1: Give the coordinates of the points on the graph.
 Ordered Pairs Often, to get an idea of the behavior of an equation, we will make a picture that represents the solutions to the equation. A graph gives us that picture. The rectangular coordinate plane,
ALGEBRA II SUMMER SKILLS PACK WELCOME TO ALGEBRA II!
 ALGEBRA II SUMMER SKILLS PACK WELCOME TO ALGEBRA II! Let's fine-tune those algebra skills! This packet contains procedures, sample problems, and solutions on fundamental concepts that should be mastered
Linear Inequalities: Rays and Half-Planes
 Math Objectives Students will relate inequalities in one variable (on a number line) to inequalities in two variables (on the coordinate plane), Students will also identify possible solutions to inequalities
Math 7 Glossary Terms
 Math 7 Glossary Terms Absolute Value Absolute value is the distance, or number of units, a number is from zero. Distance is always a positive value; therefore, absolute value is always a positive value.
We have already studied equations of the line. There are several forms:
 Chapter 13-Coordinate Geometry extended. 13.1 Graphing equations We have already studied equations of the line. There are several forms: slope-intercept y = mx + b point-slope y - y1=m(x - x1) standard
3.1 Graphing Linear Inequalities
 3.1 Graphing Linear Inequalities I. Inequalities A. Introduction Many mathematical descriptions of real situations are best expressed as inequalities rather than equations. For example, a firm might be
Unit 0: Extending Algebra 1 Concepts
 1 What is a Function? Unit 0: Extending Algebra 1 Concepts Definition: ---Function Notation--- Example: f(x) = x 2 1 Mapping Diagram Use the Vertical Line Test Interval Notation A convenient and compact
Algebra I Notes Linear Functions & Inequalities Part I Unit 5 UNIT 5 LINEAR FUNCTIONS AND LINEAR INEQUALITIES IN TWO VARIABLES
 UNIT LINEAR FUNCTIONS AND LINEAR INEQUALITIES IN TWO VARIABLES PREREQUISITE SKILLS: students must know how to graph points on the coordinate plane students must understand ratios, rates and unit rate VOCABULARY:
Honors Algebra 2 Function Transformations Discovery
 Honors Algebra Function Transformations Discovery Name: Date: Parent Polynomial Graphs Using an input-output table, make a rough sketch and compare the graphs of the following functions. f x x. f x x.
Hot X: Algebra Exposed
 Hot X: Algebra Exposed Solution Guide for Chapter 10 Here are the solutions for the Doing the Math exercises in Hot X: Algebra Exposed! DTM from p.137-138 2. To see if the point is on the line, let s plug
CLASSROOM INVESTIGATION:
 MHS CLASSROOM INVESTIGATION: LINEAR PROGRAMMING LEARNING GOALS By completing this lesson you will: Practice establishing systems of inequalities Review graphing half-planes Investigate using a polygon
Mini-Lecture 3.1 Graphing Equations
 Copyright 0 Pearson Education, Inc. Mini-Lecture. Graphing Equations. Plot ordered pairs.. Determine whether an ordered pair of numbers is a solution to an equation in two variables.. Graph linear equations.
Precalculus Notes: Unit 7 Systems of Equations and Matrices
 Date: 7.1, 7. Solving Systems of Equations: Graphing, Substitution, Elimination Syllabus Objectives: 8.1 The student will solve a given system of equations or system of inequalities. Solution of a System
Notes Lesson 3 4. Positive. Coordinate. lines in the plane can be written in standard form. Horizontal
 A, B, C are Notes Lesson 3 4 Standard Form of an Equation: Integers Ax + By = C Sometimes it is preferred that A is Positive All lines in the plane can be written in standard form. Oblique Coordinate Horizontal
6th Grade Report Card Mathematics Skills: Students Will Know/ Students Will Be Able To...
 6th Grade Report Card Mathematics Skills: Students Will Know/ Students Will Be Able To... Report Card Skill: Use ratio reasoning to solve problems a ratio compares two related quantities ratios can be
0,0 is referred to as the end point.
 1 2 3 4 5 6 7 8 9 10 11 12 13 14 15 16 17 18 19 20 21 22 23 24 25 26 27 28 29 Chapter 2: Radical Functions 2.1 Radical Functions and Transformations (Day 1) For the function y x, the radicand, x, must
Math: Question 10
 1 of 1 9/22/2016 7:55 PM Math: Question 10 A carpenter has $60 with which to buy supplies. The carpenter needs to buy both nails and screws. Nails cost $12.99 per box, and screws cost $14.99 per box. If
Key Concept Euler s Formula
 11-1 Space Figures and Cross Sections Objectives To recognize polyhedrons and their parts To visualize cross sections of space figures Common Core State Standards G-GMD.B.4 Identify the shapes of two-dimensional
Unit 12 Special Functions
 Algebra Notes Special Functions Unit 1 Unit 1 Special Functions PREREQUISITE SKILLS: students should be able to describe a relation and a function students should be able to identify the domain and range
Appendix 14C: TIMSS 2015 Eighth Grade Mathematics Item Descriptions Developed During the TIMSS 2015 Benchmarking
 Appendix 14C: TIMSS 2015 Eighth Grade Mathematics Item Descriptions Developed During the TIMSS 2015 Benchmarking Items at Low International Benchmark (400) Number M04_01 M07_01 Recognizes a 7-digit number
Section 3.1 Graphing Using the Rectangular Coordinate System
 Objectives Section 3.1 Graphing Using the Rectangular Coordinate System n Construct a rectangular coordinate system n Plot ordered pairs and determine the coordinates of a point n Graph paired data n Read
Lesson 21: Solution Sets to Inequalities with Two Variables
 Student Outcomes Students recognize and identify solutions to two variable inequalities. They represent the solution set graphically. They create two variable inequalities to represent a situation. Students
Salisbury Township School District Planned Course of Study 6 th Grade Math Salisbury Inspire, Think, Learn, Grow Together!
 Topic/Unit: The Number System Big Ideas/Enduring Understandings: Multiplication and division have an inverse relationship that is used in dividing fractions. Previous understanding of numbers can be extended
Course Number 432/433 Title Algebra II (A & B) H Grade # of Days 120
 H Grade # of Days 120") Whitman-Hanson Regional High School provides all students with a high- quality education in order to develop reflective, concerned citizens and contributing members of the global community. Course Number
Whitman-Hanson Regional High School provides all students with a high- quality education in order to develop reflective, concerned citizens and contributing members of the global community. Course Number
Unit Title Key Concepts Vocabulary CCS
 Unit Title Key Concepts Vocabulary CCS Unit 1 Writing and Evaluating s Unit 2 Writing and Solving Equations s and Equations Write numerical expressions Evaluate numerical expressions Write algebraic expressions
DAY 77 GRAPHING SYSTEM OF INEQUALITIES
 DAY 77 GRAPHING SYSTEM OF INEQUALITIES PROBLEM Libby is making a window frame for etched glass. The frame will be for a window that is square on the bottom with an isosceles triangle on top. The perimeter
Middle School Math Course 3
 Middle School Math Course 3 Correlation of the ALEKS course Middle School Math Course 3 to the Texas Essential Knowledge and Skills (TEKS) for Mathematics Grade 8 (2012) (1) Mathematical process standards.
Solve the following system of equations. " 2x + 4y = 8 # $ x 3y = 1. 1 cont d. You try:
 1 Solve the following system of equations. " 2x + 4y = 8 # $ x 3y = 1 Method 1: Substitution 1. Solve for x in the second equation. 1 cont d Method 3: Eliminate y 1. Multiply first equation by 3 and second
Linear Programming: A Geometric Approach
 Chapter 3 Linear Programming: A Geometric Approach 3.1 Graphing Systems of Linear Inequalities in Two Variables The general form for a line is ax + by + c =0. The general form for a linear inequality is
NFC ACADEMY MATH 600 COURSE OVERVIEW
 NFC ACADEMY MATH 600 COURSE OVERVIEW Math 600 is a full-year elementary math course focusing on number skills and numerical literacy, with an introduction to rational numbers and the skills needed for
4.1 Ordered Pairs and Graphs. Copyright Cengage Learning. All rights reserved.
 4.1 Ordered Pairs and Graphs Copyright Cengage Learning. All rights reserved. 1 What You Will Learn Plot points on a rectangular coordinate system Determine whether ordered pairs are solutions of equations
Students will understand 1. that numerical expressions can be written and evaluated using whole number exponents
 Grade 6 Expressions and Equations Essential Questions: How do you use patterns to understand mathematics and model situations? What is algebra? How are the horizontal and vertical axes related? How do
Lecture 14. Resource Allocation involving Continuous Variables (Linear Programming) 1.040/1.401/ESD.018 Project Management.
 1.040/1.401/ESD.018 Project Management.") 1.040/1.401/ESD.018 Project Management Lecture 14 Resource Allocation involving Continuous Variables (Linear Programming) April 2, 2007 Samuel Labi and Fred Moavenzadeh Massachusetts Institute of Technology
1.040/1.401/ESD.018 Project Management Lecture 14 Resource Allocation involving Continuous Variables (Linear Programming) April 2, 2007 Samuel Labi and Fred Moavenzadeh Massachusetts Institute of Technology
Chapter 4 Linear Programming
 Chapter Objectives Check off these skills when you feel that you have mastered them. From its associated chart, write the constraints of a linear programming problem as linear inequalities. List two implied
3, 10,( 2, 4) Name. CP Algebra II Midterm Review Packet Unit 1: Linear Equations and Inequalities. Solve each equation. 3.
 Name. CP Algebra II Midterm Review Packet Unit 1: Linear Equations and Inequalities. Solve each equation. 3.") Name CP Algebra II Midterm Review Packet 018-019 Unit 1: Linear Equations and Inequalities Solve each equation. 1. x. x 4( x 5) 6x. 8x 5(x 1) 5 4. ( k ) k 4 5. x 4 x 6 6. V lhw for h 7. x y b for x z Find
Name CP Algebra II Midterm Review Packet 018-019 Unit 1: Linear Equations and Inequalities Solve each equation. 1. x. x 4( x 5) 6x. 8x 5(x 1) 5 4. ( k ) k 4 5. x 4 x 6 6. V lhw for h 7. x y b for x z Find
Mathematics RIT Score:
 Mathematics RIT Score: 201-210 Number Sense and Operations Whole Numbers Understand the concept of division using pictorial representation Use front-end estimation strategy for multiplication and division
STANDARDS OF LEARNING CONTENT REVIEW NOTES ALGEBRA I. 2 nd Nine Weeks,
 STANDARDS OF LEARNING CONTENT REVIEW NOTES ALGEBRA I 2 nd Nine Weeks, 2016-2017 1 OVERVIEW Algebra I Content Review Notes are designed by the High School Mathematics Steering Committee as a resource for
Geometry R. Unit 12 Coordinate Geometry. Day Classwork Day Homework Wednesday 3/7 Thursday 3/8 Friday 3/9
 Geometry R Unit 12 Coordinate Geometry Day Classwork Day Homework Wednesday 3/7 Thursday 3/8 Friday 3/9 Unit 11 Test Review Equations of Lines 1 HW 12.1 Perimeter and Area of Triangles in the Coordinate
MAT 003 Brian Killough s Instructor Notes Saint Leo University
 MAT 003 Brian Killough s Instructor Notes Saint Leo University Success in online courses requires self-motivation and discipline. It is anticipated that students will read the textbook and complete sample
UNIT 1: NUMBER LINES, INTERVALS, AND SETS
 ALGEBRA II CURRICULUM OUTLINE 2011-2012 OVERVIEW: 1. Numbers, Lines, Intervals and Sets 2. Algebraic Manipulation: Rational Expressions and Exponents 3. Radicals and Radical Equations 4. Function Basics
3.1 INTRODUCTION TO THE FAMILY OF QUADRATIC FUNCTIONS
 3.1 INTRODUCTION TO THE FAMILY OF QUADRATIC FUNCTIONS Finding the Zeros of a Quadratic Function Examples 1 and and more Find the zeros of f(x) = x x 6. Solution by Factoring f(x) = x x 6 = (x 3)(x + )
Algebra II Notes Linear Relations and Functions Unit 02. Special Functions
 Algebra II Notes Linear Relations and Functions Unit 0 Big Idea Special Functions This lesson examines three special functions; piecewise function usuall written with two or more algebraic expressions,
2.1 Solutions to Exercises
 Last edited 9/6/17.1 Solutions to Exercises 1. P(t) = 1700t + 45,000. D(t) = t + 10 5. Timmy will have the amount A(n) given by the linear equation A(n) = 40 n. 7. From the equation, we see that the slope
A triangle that has three acute angles Example:
 1. acute angle : An angle that measures less than a right angle (90 ). 2. acute triangle : A triangle that has three acute angles 3. angle : A figure formed by two rays that meet at a common endpoint 4.