Math.1330 Section 5.2 Graphs of the Sine and Cosine Functions
|
|
|
- Bertha Copeland
- 5 years ago
- Views:
Transcription
1 Math.10 Section 5. Graphs of the Sine and Cosine Functions In this section, we will graph the basic sine function and the basic cosine function and then graph other sine and cosine functions using transformations. Much of what we will do in graphing these problems will be the same as earlier graphing using transformations. Definition: A non-constant function f is said to be periodic if there is a number p > 0 such that f( x+ p) = f( x) for all x in the domain of f. The smallest such number p is called the period of f. The graphs of periodic functions display patterns that repeat themselves at regular intervals. For a periodic function f, the period of the graph is the length of the interval needed to draw one complete cycle of the graph. For a basic sine or cosine function, the period is. Definition: For a periodic function f with maximum value M and minimum value m. M m The amplitude of the function is:. In other words the amplitude is half the height. Example 1: State the period and amplitude of the periodic function. a) b) 1
2 Graph of the Sine Function We ll start with the graph of the basic sine function, f ( x) = sin( x). The domain of this function is (, ) and the range is [-1, 1]. We typically graph just one complete period of the graph, that is on the interval [, ] We ll make a table of values: 0. x 0 Sinx Using these ordered pairs, we can sketch a graph of the function into a smooth curve:

3 Drawing all of these points is rather tedious. We ll ask you to learn the shape of the graph and just graph five basic points, the x and y intercepts and the maximum and the minimum. Period: Amplitude: 1 x-intercepts: 0,, y-intercept: (0,0) Big picture: f ( x) = sin( x) Domain: (, ) Range: [ 1,1] Period: Amplitude: 1 x-intercepts: kkkk y-intercept: (0,0)
4 Graph of the Cosine Function Now we ll repeat the process for the basic cosine function f ( x) = cos( x). The domain of this function is (, ) and the range is [-1, 1]. Again, we typically graph just one complete period of the graph, that is on the interval [, ] 0. Here is the table of values for f ( x) = cos( x) : x 0 cosx Using these ordered pairs, we can sketch a graph of the function into a smooth curve: 4
 Big picture: f ( x) = cos( x) Domain: (, ) Range: [ 1,1] Period: Amplitude: 1 x-intercepts: kkkk/, k is odd")
5 For the basic cosine graph, you ll need to remember the basic shape and graph the x and y intercepts as well as the maximum and minimum points. Period: Amplitude: 1 x-intercepts:, y-intercept: (0,1) Big picture: f ( x) = cos( x) Domain: (, ) Range: [ 1,1] Period: Amplitude: 1 x-intercepts: kkkk/, k is odd y-intercept: (0,1) 5
6 Now we ll turn our attention to transformations of the basic sine and cosine functions. These functions will be of the form f ( x) = Asin( Bx C) + D or g( x) = Acos( Bx C) + D. We can stretch or shrink sine and cosine functions, both vertically and horizontally. We can reflect them about the x axis, the y axis or both axes, and we can translate the graphs either vertically, horizontally or both. So, we ll see how the values for A, B, C and D affect the graph of the sine or cosine function. Graphing The amplitude of the graph of is A. f ( x) = Asin( Bx C) + D or g( x) = Acos( Bx C) + D If A > 1, this will stretch the graph vertically. 0 < A < 1, this will shrink the graph vertically If A < 0, the graph will be a reflection about the x axis. 6


7 The period of the function is:. B If BB > 1, this will shrink the graph horizontally by a factor of 1/B. If 0 < BB < 1, this will stretch the graph horizontally by a factor of 1/B. 7


8 Vertical Shift: Shift the original graph D units UP if DD > 0, D units DOWN if D < 0. 8
 = sin( x C) or f ( x) = cos( x")


9 Horizontal Shift: If the function is of the form f ( x) = sin( x C) or f ( x) = cos( x C), then shift the original graph C units to RIGHT if CC > 0 and C units to LEFT if C < 0. Phase shift: The function will be shifted CC BB units to the right if CC BB > 0 and it will be shifted CC units to the left if CC < 0. The number CC is called the phase shift. BB BB BB 9
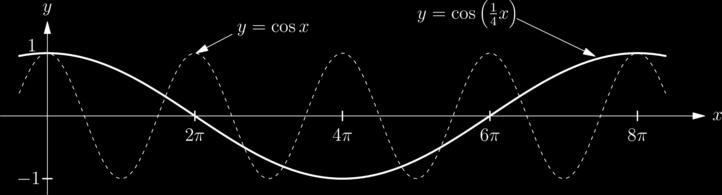
10 Example : Write down the transformations needed to graph: a) f( x) = sin(4 x) Period: Amplitude: Transformations: b) ff(xx) = cos 1 xx 1 Period: Amplitude: Transformations: 10
11 c) ff(x) = 4 cos(x ) + 1 Period: Amplitude: Transformations: 11

12 d) f( x) = 5sin ( 4x+ ) Period: Amplitude: Transformations: 1
13 x e) f( x) = 5sin 1 8 Period: Amplitude: Transformations: 1
14 It can be helpful to identify the starting and ending points for one period of the graph of a function that has a phase shift. To do this, solve the equations Bx C = 0 and Bx C =. = ; For example, for the function f( x) 5cos( x ) starting point: x = 0 x= ending point: xx = xx = xx = 14
15 Now, we will graph some functions. You will need to identify the transformations required to change a basic sine or cosine function to the desired one. You must know the five key points on a basic sine function and the five key points on a basic cosine function. Using the information about the amplitude, reflections, vertical and horizontal stretching or shrinking and vertical and horizontal translations, you will be able to correctly plot the translated key points and sketch the desired function. Example 4: Sketch over one period: f ( x) = 4sin( x). State the range of this function. x f (x) = 4sin( x) 0 15
16 Example 5: Sketch over one period: ff(xx) = cos(xx) + 1. State the range of this function. x f (x) = cos( x)
17 Example 6: Sketch over one period: ff(xx) = sin (xx). State the range of this function. x 0 f (x) = sin(x) 4 17
18 Example 7: Sketch over one period: ff(xx) = 4 cos xx 1. State the range. x 0 f (x) = 4cos(x/)
19 Example 8: Sketch over one period: ff(xx) = cos xx. 19
20 Example 9: Consider the graph: Write an equation of the form f ( x) = Asin( Bx C) + D and an equation of the form f ( x) = Acos( Bx C) + D which could be used to represent the graph. Note: these answers are not unique! Example 10: Consider the graph: Write an equation of the form f ( x) = Asin( Bx C) + D and an equation of the form f ( x) = Acos( Bx C) + D which could be used to represent the graph. Note: these answers are not unique! 0
21 Example 11: Determine the function of the form ff(xx) = AAAAAAAA(BBBB) given by the graph: Example 1: Determine the function of the form ff(xx) = AAAAAAAA(BBBB CC) + DD given by the graph below: 1
22 Modeling Using Sinusoidal Functions Sine and cosine functions model many real-world situations. Physical phenomenon such as tides, temperatures and amount of sunlight are all things that repeat themselves, are easily modeled by sine and cosine functions (collectively, they are called sinusoidal functions ). Here are some other situations that can be modeled by a sinusoidal function: Suppose you are on a Ferris wheel at a carnival. Your height (as you are sitting in your seat) varies sinusoidally. Suppose you are pushing your child as s/he sits in a swing. Your child s height varies sinusoidally. The motion of a swinging pendulum varies sinusoidally. Stock prices sometimes vary sinusoidally. We ll work a couple of examples involving sinusoidal variation. Recall: Given the functions ff(xx) = AAAAAAAA(BBBB CC) + DD or ff(xx) = AAAAAAAA(BBBB CC) + DD; The period is: BB The amplitude is: A The vertical shift is: D (up if positive) The horizontal shift is CC BB (to the right if positive) Example 1: Determine the equation of the sine function which has amplitude is 5, the phase shift is 4 to the left, the vertical shift is down, and the period is.
23 Example : The function PP(tt) = ssssss( tt) models the blood pressure (in millimeters of mercury) for a person; t represents seconds. What is the period of this function? What is the amplitude? What is the maximum blood pressure? What is the minimum blood pressure? Example : The number of hours of daylight in Boston is given by ff(xx) = sin (xx 79) + 1 where xx is the number of days after January What is the: a. amplitude? b. period? c. maximum value of f(x)? d. minimum value of f(x)?
24 Example 4: Assume that you are aboard a research submarine doing submerged training exercises in the Pacific Ocean. At time t = 0 you start porpoising (alternately deeper and then shallower). At time t = 4 min you are at your deepest, y = 1000 m. At time t = 9 min you next reach your shallowest, y = 00 m. Assume that y varies sinusoidally with time. Find an equation expressing y as a function of t. Example 5: A signal buoy in the Gulf of Mexico bobs up and down with the height h of its transmitter (in feet) above sea level modeled by h(t) = Asin(Bt) + 5. During a small squall its height varies from 1 ft to 9 ft and there are 4 seconds from one 9-ft height to the next. What are the values of the constants A and B? 4
Section Graphs of the Sine and Cosine Functions
 Section 5. - Graphs of the Sine and Cosine Functions In this section, we will graph the basic sine function and the basic cosine function and then graph other sine and cosine functions using transformations.
Section Graphs of the Sine and Cosine Functions
 Section 5. - Graphs of the Sine and Cosine Functions In this section, we will graph the basic sine function and the basic cosine function and then graph other sine and cosine functions using transformations.
Section 7.6 Graphs of the Sine and Cosine Functions
 Section 7.6 Graphs of the Sine and Cosine Functions We are going to learn how to graph the sine and cosine functions on the xy-plane. Just like with any other function, it is easy to do by plotting points.
Section 5.4: Modeling with Circular Functions
 Section 5.4: Modeling with Circular Functions Circular Motion Example A ferris wheel with radius 25 feet is rotating at a rate of 3 revolutions per minute, When t = 0, a chair starts at its lowest point
Basic Graphs of the Sine and Cosine Functions
 Chapter 4: Graphs of the Circular Functions 1 TRIG-Fall 2011-Jordan Trigonometry, 9 th edition, Lial/Hornsby/Schneider, Pearson, 2009 Section 4.1 Graphs of the Sine and Cosine Functions Basic Graphs of
You are not expected to transform y = tan(x) or solve problems that involve the tangent function.
 or solve problems that involve the tangent function.") In this unit, we will develop the graphs for y = sin(x), y = cos(x), and later y = tan(x), and identify the characteristic features of each. Transformations of y = sin(x) and y = cos(x) are performed and
In this unit, we will develop the graphs for y = sin(x), y = cos(x), and later y = tan(x), and identify the characteristic features of each. Transformations of y = sin(x) and y = cos(x) are performed and
Unit 4 Graphs of Trigonometric Functions - Classwork
 Unit Graphs of Trigonometric Functions - Classwork For each of the angles below, calculate the values of sin x and cos x ( decimal places) on the chart and graph the points on the graph below. x 0 o 30
Unit 4 Graphs of Trigonometric Functions - Classwork
 Unit Graphs of Trigonometric Functions - Classwork For each of the angles below, calculate the values of sin x and cos x decimal places) on the chart and graph the points on the graph below. x 0 o 30 o
5.1 Angles & Their Measures. Measurement of angle is amount of rotation from initial side to terminal side. radians = 60 degrees
 .1 Angles & Their Measures An angle is determined by rotating array at its endpoint. Starting side is initial ending side is terminal Endpoint of ray is the vertex of angle. Origin = vertex Standard Position:
Translation of graphs (2) The exponential function and trigonometric function
 The exponential function and trigonometric function") Lesson 35 Translation of graphs (2) The exponential function and trigonometric function Learning Outcomes and Assessment Standards Learning Outcome 2: Functions and Algebra Assessment Standard Generate
Lesson 35 Translation of graphs (2) The exponential function and trigonometric function Learning Outcomes and Assessment Standards Learning Outcome 2: Functions and Algebra Assessment Standard Generate
Unit 4 Graphs of Trigonometric Functions - Classwork
 Unit Graphs of Trigonometric Functions - Classwork For each of the angles below, calculate the values of sin x and cos x (2 decimal places) on the chart and graph the points on the graph below. x 0 o 30
Module 4 Graphs of the Circular Functions
 MAC 1114 Module 4 Graphs of the Circular Functions Learning Objectives Upon completing this module, you should be able to: 1. Recognize periodic functions. 2. Determine the amplitude and period, when given
This is called the horizontal displacement of also known as the phase shift.
 sin (x) GRAPHS OF TRIGONOMETRIC FUNCTIONS Definitions A function f is said to be periodic if there is a positive number p such that f(x + p) = f(x) for all values of x. The smallest positive number p for
Check In before class starts:
 Name: Date: Lesson 5-3: Graphing Trigonometric Functions Learning Goal: How do I use the critical values of the Sine and Cosine curve to graph vertical shift and vertical stretch? Check In before class
Vertical and Horizontal Translations
 SECTION 4.3 Vertical and Horizontal Translations Copyright Cengage Learning. All rights reserved. Learning Objectives 1 2 3 4 Find the vertical translation of a sine or cosine function. Find the horizontal
Math 1330 Test 3 Review Sections , 5.1a, ; Know all formulas, properties, graphs, etc!
 Math 1330 Test 3 Review Sections 4.1 4.3, 5.1a, 5. 5.4; Know all formulas, properties, graphs, etc! 1. Similar to a Free Response! Triangle ABC has right angle C, with AB = 9 and AC = 4. a. Draw and label
Lesson 5.2: Transformations of Sinusoidal Functions (Sine and Cosine)
") Lesson 5.2: Transformations of Sinusoidal Functions (Sine and Cosine) Reflections Horizontal Translation (c) Vertical Translation (d) Remember: vertical stretch horizontal stretch 1 Part A: Reflections
Lesson 5.2: Transformations of Sinusoidal Functions (Sine and Cosine) Reflections Horizontal Translation (c) Vertical Translation (d) Remember: vertical stretch horizontal stretch 1 Part A: Reflections
Section 5.3 Graphs of the Cosecant and Secant Functions 1
 Section 5.3 Graphs of the Cosecant, Secant, Tangent, and Cotangent Functions The Cosecant Graph RECALL: 1 csc x so where sin x 0, csc x has an asymptote. sin x To graph y Acsc( Bx C) D, first graph THE
Notice there are vertical asymptotes whenever y = sin x = 0 (such as x = 0).
.") 1 of 7 10/1/2004 6.4 GRAPHS OF THE OTHER CIRCULAR 6.4 GRAPHS OF THE OTHER CIRCULAR Graphs of the Cosecant and Secant Functions Graphs of the Tangent and Cotangent Functions Addition of Ordinates Graphs
1 of 7 10/1/2004 6.4 GRAPHS OF THE OTHER CIRCULAR 6.4 GRAPHS OF THE OTHER CIRCULAR Graphs of the Cosecant and Secant Functions Graphs of the Tangent and Cotangent Functions Addition of Ordinates Graphs
Unit 3 Trig II. 3.1 Trig and Periodic Functions
 Unit 3 Trig II AFM Mrs. Valentine Obj.: I will be able to use a unit circle to find values of sine, cosine, and tangent. I will be able to find the domain and range of sine and cosine. I will understand
Section 4.4: Parabolas
 Objective: Graph parabolas using the vertex, x-intercepts, and y-intercept. Just as the graph of a linear equation y mx b can be drawn, the graph of a quadratic equation y ax bx c can be drawn. The graph
Trigonometric Graphs Dr. Laura J. Pyzdrowski
 1 Names: About this Laboratory In this laboratory, we will examine trigonometric functions and their graphs. Upon completion of the lab, you should be able to quickly sketch such functions and determine
SECTION 4.5: GRAPHS OF SINE AND COSINE FUNCTIONS
 SECTION 4.5: GRAPHS OF SINE AND COSINE FUNCTIONS 4.33 PART A : GRAPH f ( θ ) = sinθ Note: We will use θ and f ( θ) for now, because we would like to reserve x and y for discussions regarding the Unit Circle.
1. GRAPHS OF THE SINE AND COSINE FUNCTIONS
 GRAPHS OF THE CIRCULAR FUNCTIONS 1. GRAPHS OF THE SINE AND COSINE FUNCTIONS PERIODIC FUNCTION A period function is a function f such that f ( x) f ( x np) for every real numer x in the domain of f every
Angle Measure 1. Use the relationship π rad = 180 to express the following angle measures in radian measure. a) 180 b) 135 c) 270 d) 258
 180 b) 135 c) 270 d) 258") Chapter 4 Prerequisite Skills BLM 4-1.. Angle Measure 1. Use the relationship π rad = 180 to express the following angle measures in radian measure. a) 180 b) 135 c) 70 d) 58. Use the relationship 1 =!
Chapter 4 Prerequisite Skills BLM 4-1.. Angle Measure 1. Use the relationship π rad = 180 to express the following angle measures in radian measure. a) 180 b) 135 c) 70 d) 58. Use the relationship 1 =!
Warm-Up Exercises. Find the x-intercept and y-intercept 1. 3x 5y = 15 ANSWER 5; y = 2x + 7 ANSWER ; 7
 Warm-Up Exercises Find the x-intercept and y-intercept 1. 3x 5y = 15 ANSWER 5; 3 2. y = 2x + 7 7 2 ANSWER ; 7 Chapter 1.1 Graph Quadratic Functions in Standard Form A quadratic function is a function that
Math 1330 Final Exam Review Covers all material covered in class this semester.
 Math 1330 Final Exam Review Covers all material covered in class this semester. 1. Give an equation that could represent each graph. A. Recall: For other types of polynomials: End Behavior An even-degree
AP Calculus Summer Review Packet
 AP Calculus Summer Review Packet Name: Date began: Completed: **A Formula Sheet has been stapled to the back for your convenience!** Email anytime with questions: danna.seigle@henry.k1.ga.us Complex Fractions
MHF4U. Advanced Functions Grade 12 University Mitchell District High School. Unit 5 Trig Functions & Equations 5 Video Lessons
 MHF4U Advanced Functions Grade 12 University Mitchell District High School Unit 5 Trig Functions & Equations 5 Video Lessons Allow no more than 12 class days for this unit! This includes time for review
Chapter 5. An Introduction to Trigonometric Functions 1-1
 Chapter 5 An Introduction to Trigonometric Functions Copyright (c) The McGraw-Hill Companies, Inc. Permission required for reproduction or display. 1-1 5.1 A half line or all points extended from a single
Unit 3 Trigonometry. 3.4 Graph and analyze the trigonometric functions sine, cosine, and tangent to solve problems.
 1 General Outcome: Develop trigonometric reasoning. Specific Outcomes: Unit 3 Trigonometry 3.1 Demonstrate an understanding of angles in standard position, expressed in degrees and radians. 3. Develop
5.6 Translations and Combinations of Transformations
 5.6 Translations and Combinations of Transformations The highest tides in the world are found in the Ba of Fund. Tides in one area of the ba cause the water level to rise to 6 m above average sea level
Unit 7: Trigonometry Part 1
 100 Unit 7: Trigonometry Part 1 Right Triangle Trigonometry Hypotenuse a) Sine sin( α ) = d) Cosecant csc( α ) = α Adjacent Opposite b) Cosine cos( α ) = e) Secant sec( α ) = c) Tangent f) Cotangent tan(
Lesson 5: Investigating Quadratic Functions in the Standard Form, ff(xx) = aaxx 2 + bbxx + cc
 = aaxx 2 + bbxx + cc") : Investigating Quadratic Functions in the Standard Form, ff(xx) = aaxx 22 + bbxx + cc Opening Exercise 1. Marshall had the equation y = (x 2) 2 + 4 and knew that he could easily find the vertex. Sarah
: Investigating Quadratic Functions in the Standard Form, ff(xx) = aaxx 22 + bbxx + cc Opening Exercise 1. Marshall had the equation y = (x 2) 2 + 4 and knew that he could easily find the vertex. Sarah
Batman. Part 1 and 2. Sam wants to recreate the Batman symbol using graphs. Describe fully the brown, orange and blue graphs.
 Batman Part 1 and 2 Sam wants to recreate the Batman symbol using graphs. Describe fully the brown, orange and blue graphs. Sketch and describe the following graphs teal: y = sinx 14 starting at x = -15
Multi-step transformations
 October 6, 2016 Transformations (section 1.6) Day 4 page 1 Multi-step transformations Objective: Apply transformations involving multiple steps or multiple substitutions. Upcoming: We will have a test
x,,, (All real numbers except where there are
 Section 5.3 Graphs of other Trigonometric Functions Tangent and Cotangent Functions sin( x) Tangent function: f( x) tan( x) ; cos( x) 3 5 Vertical asymptotes: when cos( x ) 0, that is x,,, Domain: 3 5
Quadratic Functions (Section 2-1)
") Quadratic Functions (Section 2-1) Section 2.1, Definition of Polynomial Function f(x) = a is the constant function f(x) = mx + b where m 0 is a linear function f(x) = ax 2 + bx + c with a 0 is a quadratic
Quadratic Functions (Section 2-1) Section 2.1, Definition of Polynomial Function f(x) = a is the constant function f(x) = mx + b where m 0 is a linear function f(x) = ax 2 + bx + c with a 0 is a quadratic
2. Periodic functions have a repeating pattern called a cycle. Some examples from real-life that have repeating patterns might include:
 GRADE 2 APPLIED SINUSOIDAL FUNCTIONS CLASS NOTES Introduction. To date we have studied several functions : Function linear General Equation y = mx + b Graph; Diagram Usage; Occurence quadratic y =ax 2
FUNCTIONS AND MODELS
 1 FUNCTIONS AND MODELS FUNCTIONS AND MODELS 1.3 New Functions from Old Functions In this section, we will learn: How to obtain new functions from old functions and how to combine pairs of functions. NEW
8.4 Graphs of Sine and Cosine Functions Additional Material to Assist in Graphing Trig Functions
 8.4 Graphs of Sine and Cosine Functions Additional Material to Assist in Graphing Trig Functions One of the things that will help a great deal in learning to graph the trig functions is an understanding
3.1 INTRODUCTION TO THE FAMILY OF QUADRATIC FUNCTIONS
 3.1 INTRODUCTION TO THE FAMILY OF QUADRATIC FUNCTIONS Finding the Zeros of a Quadratic Function Examples 1 and and more Find the zeros of f(x) = x x 6. Solution by Factoring f(x) = x x 6 = (x 3)(x + )
Chapter 4. Trigonometric Functions. 4.6 Graphs of Other. Copyright 2014, 2010, 2007 Pearson Education, Inc.
 Chapter 4 Trigonometric Functions 4.6 Graphs of Other Trigonometric Functions Copyright 2014, 2010, 2007 Pearson Education, Inc. 1 Objectives: Understand the graph of y = tan x. Graph variations of y =
Chapter 5.4: Sinusoids
 Chapter 5.4: Sinusoids If we take our circular functions and unwrap them, we can begin to look at the graphs of each trig function s ratios as a function of the angle in radians. We will begin by looking
Chapter Review, page 581
 = 360 = 360 = 80 Horizontal translation = 60 to the right d 4 The range of this graph is {y 6 y, y R}, and its amplitude is. The is 80 and the horizontal translation is 60 to the right. The equation of
Final Exam Review Algebra Semester 1
 Final Exam Review Algebra 015-016 Semester 1 Name: Module 1 Find the inverse of each function. 1. f x 10 4x. g x 15x 10 Use compositions to check if the two functions are inverses. 3. s x 7 x and t(x)
Graphical Methods Booklet
 Graphical Methods Booklet This document outlines the topic of work and the requirements of students working at New Zealand Curriculum level 7. Parabola, vertex form y = x 2 Vertex (0,0) Axis of symmetry
Module 2, Section 2 Graphs of Trigonometric Functions
 Principles of Mathematics Section, Introduction 5 Module, Section Graphs of Trigonometric Functions Introduction You have studied trigonometric ratios since Grade 9 Mathematics. In this module ou will
Graphs of Exponential
 Graphs of Exponential Functions By: OpenStaxCollege As we discussed in the previous section, exponential functions are used for many realworld applications such as finance, forensics, computer science,
5.2. The Sine Function and the Cosine Function. Investigate A
 5.2 The Sine Function and the Cosine Function What do an oceanographer, a stock analyst, an audio engineer, and a musician playing electronic instruments have in common? They all deal with periodic patterns.
Section 7.1. Standard position- the vertex of the ray is at the origin and the initial side lies along the positive x-axis.
 1 Section 7.1 I. Definitions Angle Formed by rotating a ray about its endpoint. Initial side Starting point of the ray. Terminal side- Position of the ray after rotation. Vertex of the angle- endpoint
( ) = 1 4. (Section 4.6: Graphs of Other Trig Functions) Example. Use the Frame Method to graph one cycle of the graph of
 = 1 4. (Section 4.6: Graphs of Other Trig Functions) Example. Use the Frame Method to graph one cycle of the graph of") (Section 4.6: Graphs of Other Trig Functions) 4.63 Example Use the Frame Method to graph one cycle of the graph of y = 2 tan 2 5 x 3. (There are infinitely many possible cycles.) Solution Fortunately,
(Section 4.6: Graphs of Other Trig Functions) 4.63 Example Use the Frame Method to graph one cycle of the graph of y = 2 tan 2 5 x 3. (There are infinitely many possible cycles.) Solution Fortunately,
6.4 Vertex Form of a Quadratic Function
 6.4 Vertex Form of a Quadratic Function Recall from 6.1 and 6.2: Standard Form The standard form of a quadratic is: f(x) = ax 2 + bx + c or y = ax 2 + bx + c where a, b, and c are real numbers and a 0.
4.8. Solving Problems with Trigonometry. Copyright 2011 Pearson, Inc.
 4.8 Solving Problems with Trigonometry Copyright 2011 Pearson, Inc. What you ll learn about More Right Triangle Problems Simple Harmonic Motion and why These problems illustrate some of the better- known
Graphs of the Circular Functions. Copyright 2017, 2013, 2009 Pearson Education, Inc.
 4 Graphs of the Circular Functions Copyright 2017, 2013, 2009 Pearson Education, Inc. 1 4.3 Graphs of the Tangent and Cotangent Functions Graph of the Tangent Function Graph of the Cotangent Function Techniques
Unit 1 Quadratic Functions
 Unit 1 Quadratic Functions This unit extends the study of quadratic functions to include in-depth analysis of general quadratic functions in both the standard form f ( x) = ax + bx + c and in the vertex
Review of Trigonometry
 Worksheet 8 Properties of Trigonometric Functions Section Review of Trigonometry This section reviews some of the material covered in Worksheets 8, and The reader should be familiar with the trig ratios,
Slide 2 / 222. Algebra II. Quadratic Functions
 Slide 1 / 222 Slide 2 / 222 Algebra II Quadratic Functions 2014-10-14 www.njctl.org Slide 3 / 222 Table of Contents Key Terms Explain Characteristics of Quadratic Functions Combining Transformations (review)
Curriculum Correlation
 Curriculum Correlation Ontario Grade 11(MCF3M) Curriculum Correlation Quadratic Functions Chapter/Lesson/Feature Overall Expectations Expand and simplify quadratic expressions, solve quadratic equations,
MATH 111 QUADRATICS WORKSHEET. Solution. We can put f(x) into vertex form by completing the square:
 into vertex form by completing the square:") MATH 111 QUADRATICS WORKSHEET BLAKE FARMAN UNIVERSITY OF SOUTH CAROLINA Name: Let f(x) = 3x 2 + 6x + 9. Use this function to answer questions Problems 1-3. 1. Write f(x) in vertex form. Solution. We can
MATH 111 QUADRATICS WORKSHEET BLAKE FARMAN UNIVERSITY OF SOUTH CAROLINA Name: Let f(x) = 3x 2 + 6x + 9. Use this function to answer questions Problems 1-3. 1. Write f(x) in vertex form. Solution. We can
4/29/13. Obj: SWBAT graph periodic functions. Education is Power!
 4/9/ Education is Power! Obj: SWBAT graph periodic functions. Bell Ringer: Complete Ferris Wheel assignment HW Requests: -6 Worksheet, Odds # s pg 94 #- Homework: Read pg 79-8, 86-94 Announcements: Dignity
2 Unit Bridging Course Day 10
 1 / 31 Unit Bridging Course Day 10 Circular Functions III The cosine function, identities and derivatives Clinton Boys / 31 The cosine function The cosine function, abbreviated to cos, is very similar
5. The angle of elevation of the top of a tower from a point 120maway from the. What are the x-coordinates of the maxima of this function?
 Exams,Math 141,Pre-Calculus, Dr. Bart 1. Let f(x) = 4x+6. Find the inverse of f algebraically. 5x 2. Suppose f(x) =x 2.We obtain g(x) fromf(x) by translating to the left by 2 translating up by 3 reecting
1) A rational function is a quotient of polynomial functions:
 A rational function is a quotient of polynomial functions:") Math 165 - Sections 4.4 and 4.5 Rational Functions 1) A rational function is a quotient of polynomial functions: 2) Explain how you find the domain of a rational function: a) Write a rational function
Math 165 - Sections 4.4 and 4.5 Rational Functions 1) A rational function is a quotient of polynomial functions: 2) Explain how you find the domain of a rational function: a) Write a rational function
Section 1.5 Transformation of Functions
 Section 1.5 Transformation of Functions 61 Section 1.5 Transformation of Functions Often when given a problem, we try to model the scenario using mathematics in the form of words, tables, graphs and equations
Graphing Trig Functions - Sine & Cosine
 Graphing Trig Functions - Sine & Cosine Up to this point, we have learned how the trigonometric ratios have been defined in right triangles using SOHCAHTOA as a memory aid. We then used that information
Unit 2: Functions and Graphs
 AMHS Precalculus - Unit 16 Unit : Functions and Graphs Functions A function is a rule that assigns each element in the domain to exactly one element in the range. The domain is the set of all possible
Walt Whitman High School SUMMER REVIEW PACKET. For students entering AP CALCULUS BC
 Walt Whitman High School SUMMER REVIEW PACKET For students entering AP CALCULUS BC Name: 1. This packet is to be handed in to your Calculus teacher on the first day of the school year.. All work must be
Section 1.5 Transformation of Functions
 6 Chapter 1 Section 1.5 Transformation of Functions Often when given a problem, we try to model the scenario using mathematics in the form of words, tables, graphs and equations in order to explain or
Name Trigonometric Functions 4.2H
 TE-31 Name Trigonometric Functions 4.H Ready, Set, Go! Ready Topic: Even and odd functions The graphs of even and odd functions make it easy to identify the type of function. Even functions have a line
Math 144 Activity #4 Connecting the unit circle to the graphs of the trig functions
 144 p 1 Math 144 Activity #4 Connecting the unit circle to the graphs of the trig functions Graphing the sine function We are going to begin this activity with graphing the sine function ( y = sin x).
Graphing Trigonometric Functions: Day 1
 Graphing Trigonometric Functions: Day 1 Pre-Calculus 1. Graph the six parent trigonometric functions.. Apply scale changes to the six parent trigonometric functions. Complete the worksheet Exploration:
Blue 21 Extend and Succeed Brain Growth Senior Phase. Trigonometry. Graphs and Equations
 Blue 21 Extend and Succeed Brain Growth Senior Phase Trigonometry Graphs and Equations Trig Graphs O1 Trig ratios of angles of all sizes 1. Given the diagram above, find sin 130, cos 130 and tan 130 correct
Chapter 4/5 Part 1- Trigonometry in Radians
 Chapter 4/5 Part - Trigonometry in Radians Lesson Package MHF4U Chapter 4/5 Part Outline Unit Goal: By the end of this unit, you will be able to demonstrate an understanding of meaning and application
UNIT 3 EXPRESSIONS AND EQUATIONS Lesson 3: Creating Quadratic Equations in Two or More Variables
 Guided Practice Example 1 Find the y-intercept and vertex of the function f(x) = 2x 2 + x + 3. Determine whether the vertex is a minimum or maximum point on the graph. 1. Determine the y-intercept. The
MULTIPLE CHOICE. Choose the one alternative that best completes the statement or answers the question.
 Exam Name MULTIPLE CHOICE. Choose the one alternative that best completes the statement or answers the question. Convert the angle to decimal degrees and round to the nearest hundredth of a degree. 1)
Quadratic Functions In Standard Form In Factored Form In Vertex Form Transforming Graphs. Math Background
 Graphing In Standard Form In Factored Form In Vertex Form Transforming Graphs Math Background Previousl, ou Identified and graphed linear functions Applied transformations to parent functions Graphed quadratic
Date Lesson Text TOPIC Homework. Getting Started Pg. 314 # 1-7. Radian Measure and Special Angles Sine and Cosine CAST
 UNIT 5 TRIGONOMETRIC FUNCTIONS Date Lesson Text TOPIC Homework Oct. 0 5.0 (50).0 Getting Started Pg. # - 7 Nov. 5. (5). Radian Measure Angular Velocit Pg. 0 # ( 9)doso,,, a Nov. 5 Nov. 5. (5) 5. (5)..
The Sine and Cosine Functions
 Lesson -5 Lesson -5 The Sine and Cosine Functions Vocabular BIG IDEA The values of cos and sin determine functions with equations = sin and = cos whose domain is the set of all real numbers. From the eact
Obtaining Information from a Function s Graph.
 Obtaining Information from a Function s Graph Summary about using closed dots, open dots, and arrows on the graphs 1 A closed dot indicate that the graph does not extend beyond this point and the point
Section 1.6 & 1.7 Parent Functions and Transformations
 Math 150 c Lynch 1 of 8 Section 1.6 & 1.7 Parent Functions and Transformations Piecewise Functions Example 1. Graph the following piecewise functions. 2x + 3 if x < 0 (a) f(x) = x if x 0 1 2 (b) f(x) =
GUIDED NOTES 3.5 TRANSFORMATIONS OF FUNCTIONS
 GUIDED NOTES 3.5 TRANSFORMATIONS OF FUNCTIONS LEARNING OBJECTIVES In this section, you will: Graph functions using vertical and horizontal shifts. Graph functions using reflections about the x-axis and
Math 2 Spring Unit 5 Bundle Transformational Graphing and Inverse Variation
 Math 2 Spring 2017 Unit 5 Bundle Transformational Graphing and Inverse Variation 1 Contents Transformations of Functions Day 1... 3 Transformations with Functions Day 1 HW... 10 Transformations with Functions
Graphs and transformations, Mixed Exercise 4
 Graphs and transformations, Mixed Exercise 4 a y = x (x ) 0 = x (x ) So x = 0 or x = The curve crosses the x-axis at (, 0) and touches it at (0, 0). y = x x = x( x) As a = is negative, the graph has a
Modelling Periodic Phenomena
 5.7 Modelling Periodic Phenomena In section 5.1, ou worked with this table that gies the fraction of the moon that is isible at midnight as the new millennium began. You drew a scatter plot and the cure
3. parallel: (b) and (c); perpendicular (a) and (b), (a) and (c)
 and (c); perpendicular (a) and (b), (a) and (c)") SECTION 1.1 1. Plot the points (0, 4), ( 2, 3), (1.5, 1), and ( 3, 0.5) in the Cartesian plane. 2. Simplify the expression 13 7 2. 3. Use the 3 lines whose equations are given. Which are parallel? Which
SECTION 1.1 1. Plot the points (0, 4), ( 2, 3), (1.5, 1), and ( 3, 0.5) in the Cartesian plane. 2. Simplify the expression 13 7 2. 3. Use the 3 lines whose equations are given. Which are parallel? Which
Quadratic Functions CHAPTER. 1.1 Lots and Projectiles Introduction to Quadratic Functions p. 31
 CHAPTER Quadratic Functions Arches are used to support the weight of walls and ceilings in buildings. Arches were first used in architecture by the Mesopotamians over 4000 years ago. Later, the Romans
Contents 10. Graphs of Trigonometric Functions
 Contents 10. Graphs of Trigonometric Functions 2 10.2 Sine and Cosine Curves: Horizontal and Vertical Displacement...... 2 Example 10.15............................... 2 10.3 Composite Sine and Cosine
Math 1113 Notes - Functions Revisited
 Math 1113 Notes - Functions Revisited Philippe B. Laval Kennesaw State University February 14, 2005 Abstract This handout contains more material on functions. It continues the material which was presented
Lesson 3: Investigating the Parts of a Parabola
 Opening Exercise 1. Use the graph at the right to fill in the Answer column of the chart below. (You ll fill in the last column in Exercise 9.) Question Answer Bring in the Math! A. What is the shape of
10.2 Calculus with Parametric Curves
 CHAPTER 1. PARAMETRIC AND POLAR 1 1.2 Calculus with Parametric Curves Example 1. Return to the parametric equations in Example 2 from the previous section: x t +sin() y t + cos() (a) Find the cartesian
Foundations of Math II
 Foundations of Math II Unit 6b: Toolkit Functions Academics High School Mathematics 6.6 Warm Up: Review Graphing Linear, Exponential, and Quadratic Functions 2 6.6 Lesson Handout: Linear, Exponential,
Unit 6 Quadratic Functions
 Unit 6 Quadratic Functions 12.1 & 12.2 Introduction to Quadratic Functions What is A Quadratic Function? How do I tell if a Function is Quadratic? From a Graph The shape of a quadratic function is called
5.1 Introduction to the Graphs of Polynomials
 Math 3201 5.1 Introduction to the Graphs of Polynomials In Math 1201/2201, we examined three types of polynomial functions: Constant Function - horizontal line such as y = 2 Linear Function - sloped line,
Packet Unit 5 Trigonometry Honors Math 2 17
 Packet Unit 5 Trigonometry Honors Math 2 17 Homework Day 12 Part 1 Cumulative Review of this unit Show ALL work for the following problems! Use separate paper, if needed. 1) If AC = 34, AB = 16, find sin
Fall 2015 Trigonometry: Week 7
 Fall 2015 Trigonometry: Week 7 Today s Topics/Activities: 1. More Practice Solving Equations 2. More Practice Graphing and Unsolving (by framing) 3. Ungraphing From Data Points 4. Ungraphing From Stories
Unit 3, Lesson 3.1 Creating and Graphing Equations Using Standard Form
 Unit 3, Lesson 3.1 Creating and Graphing Equations Using Standard Form Imagine the path of a basketball as it leaves a player s hand and swooshes through the net. Or, imagine the path of an Olympic diver
transformation: alters the equation and any combination of the location, shape, and orientation of the graph
 Chapter 1: Function Transformations Section 1.1: Horizontal and Vertical Translations transformation: alters the equation and any combination of the location, shape, and orientation of the graph mapping:
MATH STUDENT BOOK. 12th Grade Unit 4
 MATH STUDENT BOOK th Grade Unit Unit GRAPHING AND INVERSE FUNCTIONS MATH 0 GRAPHING AND INVERSE FUNCTIONS INTRODUCTION. GRAPHING 5 GRAPHING AND AMPLITUDE 5 PERIOD AND FREQUENCY VERTICAL AND HORIZONTAL