Harris: Quantitative Chemical Analysis, Eight Edition CHAPTER 05: QUALITY ASSURANCE AND CALIBRATION METHODS
|
|
|
- Aubrey Lambert
- 6 years ago
- Views:
Transcription

1 Harris: Quantitative Chemical Analysis, Eight Edition CHAPTER 05: QUALITY ASSURANCE AND CALIBRATION METHODS
2 5-0. International Measurement Evaluation Program Sample: Pb in river water (blind sample) : Certified level = 62.3 ± 1.3nM Panel a : 181 Laboratories. : 18 labs. à more than 50 % above the certified level 4 labs. à more than 50 % below the certified level Panel b : 9 different National Measurement Institutes : all results were close to the certified range
3 Panel a: 181 Labs. using recognized analytical procedures 18 labs. à more than 50 % above the certified level 4 labs. à more than 50 % below the certified level Certified range : 62.3 ± 1.3nM
4 Panal b: 9 different National Measurement Institutes Certified range : 62.3 ± 1.3nM
5 5-0. International Measurement Evaluation Program Sample : Pb in river water (blind sample) : Certified level = 62.3 ± 1.3nM Panel a : 181 laboratories : 18 labs. à more than 50 % above the certified level 4 labs. à more than 50 % below the certified level Panel b : 9 different National Measurement Institutes : all results were close to the certified range Periodic blind check sample is required to demonstrate continuing reliability
6 5-2 Method validation Detection Limit ( = lower limit of detection) - The smallest quantity of analyte that is significantly different from the blank.
7 Fig. 5-2 Curves show distribution of measurements expected for a blank and a sample whose concentration at the detection limit.
8 5-2 Method validation From Fig We assume that the standard deviation of the signal from samples near the detection limit is similar to the standard deviation from blanks
9 Why is it ~1 % at 3s? * d.f. (n=6), t= 3.7 * d.f. (n= infinite), t =2.5 Curves in Fig 5-2 are student s t distribution for 6 degrees of freedom. They are broader than the corresponding Gaussian distributions.
10
11 From Fig Method validation - A procedure that produces a detection limit with ~99 % chance of being greater than the blank. (= only ~1% of measurements for a blank are expected to exceed the detection limit.) -
12 5-2 Method validation From Fig. 5-2 If a sample contains analyte at the detection limit, there is a 50 % chance of concluding that analyte is absent because its signal is below the detection limit (false negative).
13 A procedure that produces a detection limit with ~99 % chance of being greater than the blank 1. After estimating the detection limit from previous experience with the method, prepare a sample whose concentration is ~ 1 to 5 times the detection limit. 2. Measure the signal from n replicate samples (n > 7). 3. Compute the standard deviation (s) of the n measurements. 4. Measure the signal from n blanks (containing no analyte) and find the mean value, y blank. 5. The minimum detectable signal, y dl, is defined as Signal detection limit: y dl = y blank + 3 S (5-3) *3s : 99.7 %
14 A procedure that produces a detection limit with ~99 % chance of being greater than the blank 5. The minimum detectable signal, y dl, is defined as Signal detection limit: y dl = y blank + 3 S (5-3) 6. The corrected signal, y sample - y blank = m x sample concentration (5-4) y sample m : signal observed for the sample : slope of the linear calibration curve (à next slide) 7. The detection limit is obtained by substitute y dl in 5-3 for y sample in 5-4. Because detection limit is the sample concentration which satisfies 5-3, y dl - y blank = 3 S (5-3) y sample - y blank = m x sample concentration Detection limit = 3 s / m
15 Signal vs. Concentration
16 5-3. Standard Addition Matrix : everything in the unknown, other than analyte Matrix effect : a change in the analytical signal caused by anything in the sample other than analyte. See next slide (Fig. 5-4)

17 Fig. 5-4 Calibration curves for perchlorate (ClO4 - ) in pure water and in groundwater - The matrix have unknown constituents that you could not incorporate into standard solutions to make a standard curve. - Hence, the method of standard addition is required
18 5-3. Standard Addition Standard Addition : Known quantities of analyte are added to the unknown. From the increase in signal, we can deduce how much analyte was in the original unknown. Assumption for standard addition : A linear response to analyte : The matrix would have the same effect on added analyte as it has on the original analyte in the unknown. When we add a small volume of concentrated standard e.g., the same substance as analyte, we don t change the concentration of matrix much.
19 5-3. Standard Addition - When we add a small volume of concentrated standard to an existing unknown, we do not change the concentration of the matrix very much - The standard (S) is the same substance as the analyte (X). I k([s] + [X] ) ([S] + [X] ) S + X f f f f = = (5 7) I k[x] [X] - X i I : emission intensity S : standard X : unknown concentration (analyte) V : volume i : initial f : final V = V 0 (initial volume of unknown sample) + V S (volume of standard added) i [X] f = [X] i (V 0 /V), [S] f = [S] i (V S /V) (5-8) - From 5-7 & 5-8, we can solve [X] i because everything else in eq.5-7 is known.
20 5-3. Standard Addition Two methods for standard addition 1) Variable total volume - It is useful when we measure a property of the analyte without consuming solution such as an electrical measurement with Ion-Selective Electrode. 2) Constant total volume - Every flask contains the same concentration of unknown and differing concentration of standard. - It is useful when the chemical analysis consumes solution such as atomic or mass spectroscopy. So we need separate flasks.

21 5-3. Standard Addition 1) Variable total volume - It is useful when we measure a property of the analyte without consuming solution such as an electrical measurement with Ion-Selective Electrode. - We add a small volumes of standard and measure the signal, We repeat this procedure several more times. - Standard additon should increase the analytical signal to between 1.5 and 3 times its original value. I k([s] + [X] ) ([S] + [X] ) S + X f f f f = = (5 7) I k[x] [X] - X i [X] f = [X] i (V 0 /V), [S] f = [S] i (V S /V) (5-8) i From equation 5-7 and 5-8, (5-9)


22 Fig. 5-5 Data for standard addition experiment with variable total volume (Ascorbic acid in orange juice)
23 A Graphic Procedure for Standard Addition : 1) Variable total volume * Standard addition should increase the analytical signal to between 1.5 and 3 times its original value. (e.g., B = 0.5A to 2A ).
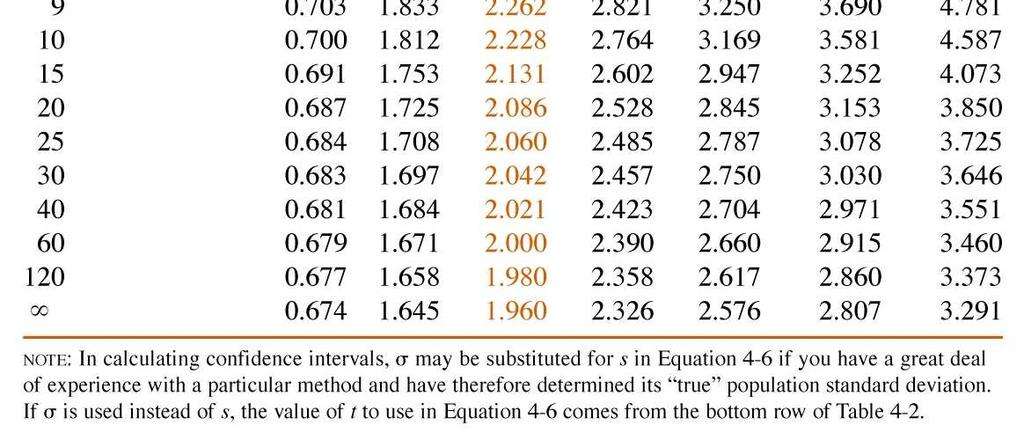
24 5-3. The uncertainty in the x-intercept Standard deviation of x - intercept = s y m 1 n + m 2 2 y å( xi - Sy : Standard deviation of y (Eq. 4-20) m : the absolute value of the slope of the least squares line (Eq. 4-16) n : the number of data points (= 9 for Fig. 5-6) y : the mean value of y for the 9 points x i : the individual values of x for the 9 points x : the mean value of x for the 9 points Uncertainty in the x-intercept : mm (for Fig. 5-6 ) Confidence interval = ± t (standard deviation of x-intercept) * degree of freedom = n - 2 x) 2
25 5-3. Standard Addition Two methods for standard addition 2) Constant total volume - Every flask contains the same concentration of unknown and differing concentration of standard. - It is useful when the chemical analysis consumes solution such as atomic or mass spectroscopy. So we need separate flasks.

26 2) graphical Procedure for multiple solutions with constant total volume
27 2) graphical Procedure for multiple solutions with constant total volume I S ([S] + [X] ) + X f f = (5 7) I [X] - X i I S+ X = = I X I X [X] ([S] i f [S] + [X] [X] f i + f ) I X [X] i [X] f Standard deviation of x - intercept = s y m 1 n + m 2 2 y å( xi - x) 2
28 5-4. Internal Standards Internal Standard : a known amount of compound, different from analyte, that is added to the unknown. : signal from analyte is compared with a signal from the internal standard to find out how much analyte is present - They are specially useful for analyses in which the quantity of sample analyzed or the instrument response varies slightly from run to run for reasons that are difficult to control. - i) When the small quantity (ul) of sample solution injected is not reproducible (chromatography). ii) When sample loss occurs during sample preparation steps prior to any manipulations.
29 Fig Chromatographic separation of unknown (X) and internal stnadard (S) Area of analyte signal (A x ) / concentration of analyte [X] = F (Area of standard signal (A s ) / concentration of standard [S]) F : response factor * To calculate F, we prepare a known mixture of standard and analyte to measure the relative response of the detector to the two species.
Validation of a Direct Analysis in Real Time Mass Spectrometry (DART-MS) Method for the Quantitation of Six Carbon Sugar in Saccharification Matrix
 Method for the Quantitation of Six Carbon Sugar in Saccharification Matrix") Validation of a Direct Analysis in Real Time Mass Spectrometry (DART-MS) Method for the Quantitation of Six Carbon Sugar in Saccharification Matrix Daudi Saang onyo, a,b Gary Selby b and Darrin L. Smith*
Validation of a Direct Analysis in Real Time Mass Spectrometry (DART-MS) Method for the Quantitation of Six Carbon Sugar in Saccharification Matrix Daudi Saang onyo, a,b Gary Selby b and Darrin L. Smith*
Error Analysis, Statistics and Graphing
 Error Analysis, Statistics and Graphing This semester, most of labs we require us to calculate a numerical answer based on the data we obtain. A hard question to answer in most cases is how good is your
Systematic errors Random errors
 Where are we in our discussion of error analysis? Let s revisit: 1 From Lecture 1: Quick Start, Replicate Errors: Measurements are affected by errors (uncertainty) There are two general categories of errors
Retention Time Locking with the MSD Productivity ChemStation. Technical Overview. Introduction. When Should I Lock My Methods?
 Retention Time Locking with the MSD Productivity ChemStation Technical Overview Introduction A retention time is the fundamental qualitative measurement of chromatography. Most peak identification is performed
Interactive Charts: A Powerful New Tool for Understanding Chromatography Data
 Interactive Charts: A Powerful New Tool for Understanding Chromatography Data Jay Lorch and Ryo Komatsuzaki; Thermo Fisher Scientific, Sunnyvale, CA, USA Abstract Most laboratories are constantly under
Chemical Polarimeter (Order Code CHEM-POL)
") Chemical Polarimeter (Order Code CHEM-POL) The Chemical Polarimeter is a device used for measuring the rotation of plane-polarized light caused by an optically active substance such as an organic, inorganic,
Chemical Polarimeter (Order Code CHEM-POL) The Chemical Polarimeter is a device used for measuring the rotation of plane-polarized light caused by an optically active substance such as an organic, inorganic,
Preliminary Lab Exercise Part 1 Calibration of Eppendorf Pipette
 Preliminary Lab Exercise Part 1 Calibration of Eppendorf Pipette Pipettes allow transfer of accurately known volume of solution from one container to another. Volumetric or transfer pipettes deliver a
To Plot a Graph in Origin. Example: Number of Counts from a Geiger- Müller Tube as a Function of Supply Voltage
 To Plot a Graph in Origin Example: Number of Counts from a Geiger- Müller Tube as a Function of Supply Voltage 1 Digression on Error Bars What entity do you use for the magnitude of the error bars? Standard
Unit 1 Area, Volume, and Density
 Name: Date: 9/11 Period: Unit 1 Area, Volume, and Density Essential Questions: What is the difference between Area and Volume? What are the ways of finding volume? How does density help us to identify
FAQs: Quality Systems Manual (QSM) Version 5.0
 Version 5.0") General FAQs: Quality Systems Manual (QSM) Version 5.0 1. Why was client changed to "customer" and "documents" to "records" throughout the QSM? The changes were due to ISO requirements, but in general
General FAQs: Quality Systems Manual (QSM) Version 5.0 1. Why was client changed to "customer" and "documents" to "records" throughout the QSM? The changes were due to ISO requirements, but in general
Chapter 5. Calibration methods: regression and correlation
 Chapter 5 Calibration methods: regression and correlation Introduction: instrumental analysis Instrumental methods versus wet methods (Titrimetry and gravimetry) Reasons for abundance of instrumental methods
Section ADDED NEW LANGUAGE
 Section 1.7.1 ADDED NEW LANGUAGE Calibrations may be performed at the instrument level (analytical step only) or the method level (analytical plus preparation steps). For certain methods, such as purge
Procedures for Group Quantitation
 Procedures for Group Quantitation Global Application Development Center Analytical & Measuring Instruments Division Shimadzu Corporation Group Quantitation In anionic surfactant analyses based on inspection
14.2 The Regression Equation
 14.2 The Regression Equation Tom Lewis Fall Term 2009 Tom Lewis () 14.2 The Regression Equation Fall Term 2009 1 / 12 Outline 1 Exact and inexact linear relationships 2 Fitting lines to data 3 Formulas
How do you roll? Fig. 1 - Capstone screen showing graph areas and menus
 How do you roll? Purpose: Observe and compare the motion of a cart rolling down hill versus a cart rolling up hill. Develop a mathematical model of the position versus time and velocity versus time for
Parallel or Perpendicular? How Can You Tell? Teacher Notes Page 1 of 6
 Teacher Notes How can a student be sure when lines are parallel or perpendicular to a given graph using the graphing calculator? The difficulty lies in matching a mechanical graph that is on a rectangular
Screening Design Selection
 Screening Design Selection Summary... 1 Data Input... 2 Analysis Summary... 5 Power Curve... 7 Calculations... 7 Summary The STATGRAPHICS experimental design section can create a wide variety of designs
Reading: Graphing Techniques Revised 1/12/11 GRAPHING TECHNIQUES
 GRAPHING TECHNIQUES Mathematical relationships between variables are determined by graphing experimental data. For example, the linear relationship between the concentration and the absorption of dilute
LIGHT: Two-slit Interference
 LIGHT: Two-slit Interference Objective: To study interference of light waves and verify the wave nature of light. Apparatus: Two red lasers (wavelength, λ = 633 nm); two orange lasers (λ = 612 nm); two
2.4. A LIBRARY OF PARENT FUNCTIONS
 2.4. A LIBRARY OF PARENT FUNCTIONS 1 What You Should Learn Identify and graph linear and squaring functions. Identify and graph cubic, square root, and reciprocal function. Identify and graph step and
Lab 3: Acceleration of Gravity
 Lab 3: Acceleration of Gravity The objective of this lab exercise is to measure a value for g, the acceleration due to gravity for an object in freefall. For Lab 1 and Lab 2 we used data, from a fictional
Z-TEST / Z-STATISTIC: used to test hypotheses about. µ when the population standard deviation is unknown
 Z-TEST / Z-STATISTIC: used to test hypotheses about µ when the population standard deviation is known and population distribution is normal or sample size is large T-TEST / T-STATISTIC: used to test hypotheses
Graphical Analysis of Data using Microsoft Excel [2016 Version]
![Graphical Analysis of Data using Microsoft Excel [2016 Version]](/thumbs/72/67574169.jpg "Graphical Analysis of Data using Microsoft Excel [2016 Version]") Graphical Analysis of Data using Microsoft Excel [2016 Version] Introduction In several upcoming labs, a primary goal will be to determine the mathematical relationship between two variable physical parameters.
Graphical Analysis of Data using Microsoft Excel [2016 Version] Introduction In several upcoming labs, a primary goal will be to determine the mathematical relationship between two variable physical parameters.
Data Objectives. The same process can be applied to determine how much simplification is appropriate when describing a geochemical system.
 Data Objectives Objectives you identify at the outset of an experiment or scientific study to help determine the nature, amount, and quality of the data you (or someone else) need to collect to answer
Math 182. Assignment #4: Least Squares
 Introduction Math 182 Assignment #4: Least Squares In any investigation that involves data collection and analysis, it is often the goal to create a mathematical function that fits the data. That is, a
We have seen that as n increases, the length of our confidence interval decreases, the confidence interval will be more narrow.
 {Confidence Intervals for Population Means} Now we will discuss a few loose ends. Before moving into our final discussion of confidence intervals for one population mean, let s review a few important results
Chemical Equilibrium CHAPTER 15. Chemistry: The Molecular Nature of Matter, 6 th edition By Jesperson, Brady, & Hyslop
 Chemical Equilibrium CHAPTER 15 Chemistry: The Molecular Nature of Matter, 6 th edition By Jesperson, Brady, & Hyslop CHAPTER 15 Chemical Equilibrium Learning Objectives: q Reversible Reactions and Equilibrium
UV-6 Series Double Beam UV/Vis Spectrophotometers
 UV-6 Series Double Beam UV/Vis Spectrophotometers Model UV-6100 UV-6100PC UV-6300 UV-6300PC avelength Range 190-1100nm 190-1100nm Spectral Bandwidth 1.8nm 1.8nm 1.0nm 1.0nm Optical System avelength Accuracy
Administrivia. Next Monday is Thanksgiving holiday. Tuesday and Wednesday the lab will be open for make-up labs. Lecture as usual on Thursday.
 Administrivia Next Monday is Thanksgiving holiday. Tuesday and Wednesday the lab will be open for make-up labs. Lecture as usual on Thursday. Lab notebooks will be due the week after Thanksgiving, when
0 Graphical Analysis Use of Excel
 Lab 0 Graphical Analysis Use of Excel What You Need To Know: This lab is to familiarize you with the graphing ability of excels. You will be plotting data set, curve fitting and using error bars on the
Present. John Phillips made a motion to approve the minutes from the September 29 meeting which was seconded by Lee Wolf. All were in favor.
 SUMMARY OF THE TNI ENVIRONMENTAL MEASUREMENT METHODS EXPERT COMMITTEE MEETING OCTOBER 7, 2011 The Committee held a conference call on Thursday, October 7, 2011, at 2:00 pm EDT. 1 Roll call Richard Burrows,
Equipment Overview: Safety:
 PerkinElmer Series 200 HPLC: Operating Procedure 12/2/11 R.C Equipment Overview: This document outlines the basic procedure for using the Sedex light scattering detector and the PE series 200 HPLC system
Using Excel for Graphical Analysis of Data
 Using Excel for Graphical Analysis of Data Introduction In several upcoming labs, a primary goal will be to determine the mathematical relationship between two variable physical parameters. Graphs are
LED MINISPECTROMETER LMS-R
 LED MINISPECTROMETER LMS-R TECHNICAL DESCRIPTION rev. 290518 CONTENTS General information 3 Device and applications overview 3 Main features 3 Device main view and operation principle 4-5 Package content
Skyline High Resolution Metabolomics (Draft)
") Skyline High Resolution Metabolomics (Draft) The Skyline Targeted Proteomics Environment provides informative visual displays of the raw mass spectrometer data you import into your Skyline documents. Originally
Skyline High Resolution Metabolomics (Draft) The Skyline Targeted Proteomics Environment provides informative visual displays of the raw mass spectrometer data you import into your Skyline documents. Originally
Tutorial 7: Automated Peak Picking in Skyline
 Tutorial 7: Automated Peak Picking in Skyline Skyline now supports the ability to create custom advanced peak picking and scoring models for both selected reaction monitoring (SRM) and data-independent
Four Types of Slope Positive Slope Negative Slope Zero Slope Undefined Slope Slope Dude will help us understand the 4 types of slope
 Four Types of Slope Positive Slope Negative Slope Zero Slope Undefined Slope Slope Dude will help us understand the 4 types of slope https://www.youtube.com/watch?v=avs6c6_kvxm Direct Variation
Data processing. Filters and normalisation. Mélanie Pétéra W4M Core Team 31/05/2017 v 1.0.0
 Data processing Filters and normalisation Mélanie Pétéra W4M Core Team 31/05/2017 v 1.0.0 Presentation map 1) Processing the data W4M table format for Galaxy 2) A generic tool to filter in Galaxy a) Generic
Four equations are necessary to evaluate these coefficients. Eqn
 1.2 Splines 11 A spline function is a piecewise defined function with certain smoothness conditions [Cheney]. A wide variety of functions is potentially possible; polynomial functions are almost exclusively
Everything you did not want to know about least squares and positional tolerance! (in one hour or less) Raymond J. Hintz, PLS, PhD University of Maine
 Raymond J. Hintz, PLS, PhD University of Maine") Everything you did not want to know about least squares and positional tolerance! (in one hour or less) Raymond J. Hintz, PLS, PhD University of Maine Least squares is used in varying degrees in -Conventional
Everything you did not want to know about least squares and positional tolerance! (in one hour or less) Raymond J. Hintz, PLS, PhD University of Maine Least squares is used in varying degrees in -Conventional
CERTIFICATE OF ANALYSIS
 Attention:Marc St Germain Markham (DW) 600 Cochrane Dr Suite 500 Markham, ON Canada L3R 5K3 Your Project #: IMMACULATE CONCEPTION Your C.O.C. #: 563272-01-01 Report #: R4026130 Version: 1 - Final MAXXAM
Image Processing
 Image Processing 159.731 Canny Edge Detection Report Syed Irfanullah, Azeezullah 00297844 Danh Anh Huynh 02136047 1 Canny Edge Detection INTRODUCTION Edges Edges characterize boundaries and are therefore
UV / VIS SPECTROPHOTOMETER
 www.mapada.com.cn A Professional Manufacturer Shanghai Mapada Instruments Co., Ltd. Add: Building D-10, 261# Sanbang Rd., Songjiang Export Processing Zone,Shanghai, 201611 Tel: +86-21-5488 1172 +86-21-5488-0273
Supporting Information
 Supporting Information Electrospray Differential Mobility Hyphenated with Single Particle Inductively Coupled Plasma Mass Spectrometry for Characterization of Nanoparticles and Their Aggregates Jiaojie
Using Adjustable Slits to Reduce Interfering Element Effects
 Prodigy ICP Technical Note Using Adjustable Slits to Reduce Interfering Element Effects INTRODUCTION The Inductively Coupled Plasma (ICP) is one of the most widely used emission sources for routine trace
2 Ranking Task: complete this section and submit it to your instructor before you begin the lab.
 Experiment 2 Ranking Task: complete this section and submit it to your instructor before you begin the lab. The position vs. time graph below was made by a moving object. During certain times, the object
Voluntary State Curriculum Algebra II
 Algebra II Goal 1: Integration into Broader Knowledge The student will develop, analyze, communicate, and apply models to real-world situations using the language of mathematics and appropriate technology.
Lesson 76. Linear Regression, Scatterplots. Review: Shormann Algebra 2, Lessons 12, 24; Shormann Algebra 1, Lesson 94
 Lesson 76 Linear Regression, Scatterplots Review: Shormann Algebra 2, Lessons 12, 24; Shormann Algebra 1, Lesson 94 Tools required: A graphing calculator or some sort of spreadsheet program, like Excel
EURL proficiency test webtool guideline
 EURL proficiency test webtool guideline Version: 2019 01 Date: 11 01 2019 Init: MPOU MAJOR CHANGES COMPARED TO THE FORMER WEBTOOL: You cannot use Internet explorer. See below the list of browsers you can
Types of Edges. Why Edge Detection? Types of Edges. Edge Detection. Gradient. Edge Detection
 Why Edge Detection? How can an algorithm extract relevant information from an image that is enables the algorithm to recognize objects? The most important information for the interpretation of an image
ES-2 Lecture: Fitting models to data
 ES-2 Lecture: Fitting models to data Outline Motivation: why fit models to data? Special case (exact solution): # unknowns in model =# datapoints Typical case (approximate solution): # unknowns in model
How to Analyze Materials
 INTERNATIONAL CENTRE FOR DIFFRACTION DATA How to Analyze Materials A PRACTICAL GUIDE FOR POWDER DIFFRACTION To All Readers This is a practical guide. We assume that the reader has access to a laboratory
Physics 1020 Experiment 3. Acceleration of Falling Objects
 1 2 Part I: Introduction In this experiment you will study the motion of a falling ball which experiences constant acceleration. You will use a Motion Detector to measure the position of the ball as a
Condence Intervals about a Single Parameter:
 Chapter 9 Condence Intervals about a Single Parameter: 9.1 About a Population Mean, known Denition 9.1.1 A point estimate of a parameter is the value of a statistic that estimates the value of the parameter.
Pattern recognition systems Lab 3 Hough Transform for line detection
 Pattern recognition systems Lab 3 Hough Transform for line detection 1. Objectives The main objective of this laboratory session is to implement the Hough Transform for line detection from edge images.
Integrated Math 1. Integrated Math, Part 1
 Integrated Math 1 Course Description: This Integrated Math course will give students an understanding of the foundations of Algebra and Geometry. Students will build on an an understanding of variables,
W7 DATA ANALYSIS 2. Your graph should look something like that in Figure W7-2. It shows the expected bell shape of the Gaussian distribution.
 Drawing Simple Graphs W7 DATA ANALYSIS 2 In some experiments, large amounts of data may be recorded and manipulation is performed using computer software. Although sophisticated, specialist software exists
IB Chemistry IA Checklist Design (D)
") Taken from blogs.bethel.k12.or.us/aweyand/files/2010/11/ia-checklist.doc IB Chemistry IA Checklist Design (D) Aspect 1: Defining the problem and selecting variables Report has a title which clearly reflects
Taken from blogs.bethel.k12.or.us/aweyand/files/2010/11/ia-checklist.doc IB Chemistry IA Checklist Design (D) Aspect 1: Defining the problem and selecting variables Report has a title which clearly reflects
Fusion AE LC Method Validation Module. S-Matrix Corporation 1594 Myrtle Avenue Eureka, CA USA Phone: URL:
 Fusion AE LC Method Validation Module S-Matrix Corporation 1594 Myrtle Avenue Eureka, CA 95501 USA Phone: 707-441-0404 URL: www.smatrix.com Regulatory Statements and Expectations ICH Q2A The objective
packet-switched networks. For example, multimedia applications which process
 Chapter 1 Introduction There are applications which require distributed clock synchronization over packet-switched networks. For example, multimedia applications which process time-sensitive information
Software Engineering 2 A practical course in software engineering. Ekkart Kindler
 Software Engineering 2 A practical course in software engineering Quality Management Main Message Planning phase Definition phase Design phase Implem. phase Acceptance phase Mainten. phase 3 1. Overview
Introduction to Motion
 Date Partners Objectives: Introduction to Motion To investigate how motion appears on a position versus time graph To investigate how motion appears on a velocity versus time graph and the relationship
X-Ray fluorescence and Raman spectroscopy
 X-Ray fluorescence and Raman spectroscopy Advanced physics laboratory (nd part) 4CFU Catalini Letizia, De Angelis Giulia Vittoria, Piselli Verdiana Abstract In this paper we report about two different
INTRODUCTION TO LABVIEW
 INTRODUCTION TO LABVIEW 2nd Year Microprocessors Laboratory 2012-2013 INTRODUCTION For the first afternoon in the lab you will learn to program using LabVIEW. This handout is designed to give you an introduction
Lecture 8. Divided Differences,Least-Squares Approximations. Ceng375 Numerical Computations at December 9, 2010
 Lecture 8, Ceng375 Numerical Computations at December 9, 2010 Computer Engineering Department Çankaya University 8.1 Contents 1 2 3 8.2 : These provide a more efficient way to construct an interpolating
GPR Analyzer version 1.23 User s Manual
 GPR Analyzer version 1.23 User s Manual GPR Analyzer is a tool to quickly analyze multi- species microarrays, especially designed for use with the MIDTAL (Microarray Detection of Toxic ALgae) chip. It
Integrated Math I. IM1.1.3 Understand and use the distributive, associative, and commutative properties.
 Standard 1: Number Sense and Computation Students simplify and compare expressions. They use rational exponents and simplify square roots. IM1.1.1 Compare real number expressions. IM1.1.2 Simplify square
What s New in Empower 3
 What s New in Empower 3 Revision A Copyright Waters Corporation 2010 All rights reserved Copyright notice 2010 WATERS CORPORATION. PRINTED IN THE UNITED STATES OF AMERICA AND IN IRELAND. ALL RIGHTS RESERVED.
Section 2.3: Simple Linear Regression: Predictions and Inference
 Section 2.3: Simple Linear Regression: Predictions and Inference Jared S. Murray The University of Texas at Austin McCombs School of Business Suggested reading: OpenIntro Statistics, Chapter 7.4 1 Simple
LABQUEST 2 DATA LOGGER
 Page 29 LABQUEST 2 DATA LOGGER OBJECTIVES: 1. To introduce the fundamentals of the use of the LabQuest 2 data logger. 2. To illustrate the use of Logger Pro graphing software to graph and analyze data
Laboratory One Distance and Time
 Laboratory One Distance and Time Student Laboratory Description Distance and Time I. Background When an object is propelled upwards, its distance above the ground as a function of time is described by
Section 1.5. Finding Linear Equations
 Section 1.5 Finding Linear Equations Using Slope and a Point to Find an Equation of a Line Example Find an equation of a line that has slope m = 3 and contains the point (2, 5). Solution Substitute m =
v Prerequisite Tutorials Required Components Time
 v. 10.0 GMS 10.0 Tutorial MODFLOW Stochastic Modeling, Parameter Randomization Run MODFLOW in Stochastic (Monte Carlo) Mode by Randomly Varying Parameters Objectives Learn how to develop a stochastic (Monte
1
 In the following tutorial we will determine by fitting the standard instrumental broadening supposing that the LaB 6 NIST powder sample broadening is negligible. This can be achieved in the MAUD program
Dealing with Data in Excel 2013/2016
 Dealing with Data in Excel 2013/2016 Excel provides the ability to do computations and graphing of data. Here we provide the basics and some advanced capabilities available in Excel that are useful for
Notes 9 4 Finding Exponential Equations
 Notes 9 4 Finding Exponential Equations Dec 22 10:39 AM 1 y = ab x We need the initial condition (a) and the growth factor (b) Solving method #1 Need two points one of which is the y intercept. y intercept
Steps for LCMS-8040 Triple Quadrupole
 Steps for LCMS-8040 Triple Quadrupole June 2017 Version 2 A. Data Acquisition 1. Check lights on MS. There should be a total of three lights lit by LED. One of them is blinking. Power Blinking Gas Status
Automated Submission for Analysis Processing (ASAP) Operator s Guide Dionex Corporation
 Operator s Guide Dionex Corporation") Automated Submission for Analysis Processing (ASAP) Operator s Guide 2002 Dionex Corporation Document No. 031843 Revision 01 May 2002 2002 by Dionex Corporation All rights reserved worldwide. Printed in
Automated Submission for Analysis Processing (ASAP) Operator s Guide 2002 Dionex Corporation Document No. 031843 Revision 01 May 2002 2002 by Dionex Corporation All rights reserved worldwide. Printed in
v MODFLOW Stochastic Modeling, Parameter Randomization GMS 10.3 Tutorial
 v. 10.3 GMS 10.3 Tutorial MODFLOW Stochastic Modeling, Parameter Randomization Run MODFLOW in Stochastic (Monte Carlo) Mode by Randomly Varying Parameters Objectives Learn how to develop a stochastic (Monte
Getting low-resolution GC-MS data on the JEOL GCMate Introduction
 Getting low-resolution GC-MS data on the JEOL GCMate Introduction GC-MS is a technique that combines gas phase separation and mass-based detection/characterization of analytes. It s a very sensitive method
UNIT 1: NUMBER LINES, INTERVALS, AND SETS
 ALGEBRA II CURRICULUM OUTLINE 2011-2012 OVERVIEW: 1. Numbers, Lines, Intervals and Sets 2. Algebraic Manipulation: Rational Expressions and Exponents 3. Radicals and Radical Equations 4. Function Basics
Fundamentals of Operations Research. Prof. G. Srinivasan. Department of Management Studies. Indian Institute of Technology, Madras. Lecture No.
 Fundamentals of Operations Research Prof. G. Srinivasan Department of Management Studies Indian Institute of Technology, Madras Lecture No. # 13 Transportation Problem, Methods for Initial Basic Feasible
1.1 calculator viewing window find roots in your calculator 1.2 functions find domain and range (from a graph) may need to review interval notation
 may need to review interval notation") 1.1 calculator viewing window find roots in your calculator 1.2 functions find domain and range (from a graph) may need to review interval notation functions vertical line test function notation evaluate
1.1 calculator viewing window find roots in your calculator 1.2 functions find domain and range (from a graph) may need to review interval notation functions vertical line test function notation evaluate
STAT 113: Lab 9. Colin Reimer Dawson. Last revised November 10, 2015
 STAT 113: Lab 9 Colin Reimer Dawson Last revised November 10, 2015 We will do some of the following together. The exercises with a (*) should be done and turned in as part of HW9. Before we start, let
ITSx: Policy Analysis Using Interrupted Time Series
 ITSx: Policy Analysis Using Interrupted Time Series Week 5 Slides Michael Law, Ph.D. The University of British Columbia COURSE OVERVIEW Layout of the weeks 1. Introduction, setup, data sources 2. Single
Page 1 of 21. Friday, June 30, Mr. Eric Cureton THE EI GROUP, INC. 15 E SALEM AVENUE, SE SUITE 301 ROANOKE, VA TEL: FAX: (540)
") REI Consultants, Inc. PO Box 286 Beaver, WV 25813 TEL: (304) 255-2500 Website: www.reiclabs.com 3029-C Peters Creek Road Roanoke, VA 24019 TEL: 540.777.1276 1557 Commerce Road, Suite 201 Verona, VA 24482
REI Consultants, Inc. PO Box 286 Beaver, WV 25813 TEL: (304) 255-2500 Website: www.reiclabs.com 3029-C Peters Creek Road Roanoke, VA 24019 TEL: 540.777.1276 1557 Commerce Road, Suite 201 Verona, VA 24482
Stage terrain 3A Heissenstein. Electrical surveying
 Stage terrain 3A Heissenstein Electrical surveying Introduction The principle method for measuring the surface resistivity is always the same. An electric current is sent into the subsurface through two
Grade 8 Middle School Math Solution Table of Contents: Virginia State Standards Alignment
 NUMBER AND NUMBER SENSE 8.1 8.2 The students will compare and order real numbers. The student will describe the relationship between subsets of the real number system. 8.3 The student will estimate and
MS data processing. Filtering and correcting data. W4M Core Team. 22/09/2015 v 1.0.0
 MS data processing Filtering and correcting data W4M Core Team 22/09/2015 v 1.0.0 Presentation map 1) Processing the data W4M table format for Galaxy 2) Filters for mass spectrometry extracted data a)
The NGAL Test Application Note for Abbott Architect c8000
 The NGAL Test Application Note for Abbott Architect c8 General parameters Name: NGAL Assay number: *1 Assay version: 1 Assay type: Photometric Assay availability: Enabled Cal version: 1 Reaction definition
: Imaging Systems Laboratory II. Laboratory 2: Snell s Law, Dispersion and the Prism March 19 & 21, n 1 n 2
 05-3: Imaging Systems Laboratory II Laboratory : Snell s Law, Dispersion and the Prism March 9 &, 00 Abstract. This laboratory exercise will demonstrate two basic properties of the way light interacts
Curve fitting. Lab. Formulation. Truncation Error Round-off. Measurement. Good data. Not as good data. Least squares polynomials.
 Formulating models We can use information from data to formulate mathematical models These models rely on assumptions about the data or data not collected Different assumptions will lead to different models.
THIS IS NOT REPRESNTATIVE OF CURRENT CLASS MATERIAL. STOR 455 Midterm 1 September 28, 2010
 THIS IS NOT REPRESNTATIVE OF CURRENT CLASS MATERIAL STOR 455 Midterm September 8, INSTRUCTIONS: BOTH THE EXAM AND THE BUBBLE SHEET WILL BE COLLECTED. YOU MUST PRINT YOUR NAME AND SIGN THE HONOR PLEDGE
Agilent G6855AA MassHunter Personal
 Agilent G6855AA MassHunter Personal Forensic Toxicology Database Kit Quick Start Guide What is the MassHunter Personal Forensic Toxicology Database Kit? 1 Kit Content 2 Where to find more information 4
A4.8 Fitting relative potencies and the Schild equation
 A4.8 Fitting relative potencies and the Schild equation A4.8.1. Constraining fits to sets of curves It is often necessary to deal with more than one curve at a time. Typical examples are (1) sets of parallel
Thermo Scientific Spectronic 200 Visible Spectrophotometer. The perfect tool. for routine measurements
 Thermo Scientific Spectronic 200 Visible Spectrophotometer The perfect tool for routine measurements The Standard for Routine Measurements Thermo Scientific SPECTRONIC spectrophotometers have served as
IQC monitoring in laboratory networks
 IQC for Networked Analysers Background and instructions for use IQC monitoring in laboratory networks Modern Laboratories continue to produce large quantities of internal quality control data (IQC) despite
Agilent ChemStation for UV-visible Spectroscopy
 Agilent ChemStation for UV-visible Spectroscopy Understanding Your Advanced Software Agilent Technologies Notices Agilent Technologies, Inc. 2002, 2003-2008 No part of this manual may be reproduced in
Minnesota Academic Standards for Mathematics 2007
 An Alignment of Minnesota for Mathematics 2007 to the Pearson Integrated High School Mathematics 2014 to Pearson Integrated High School Mathematics Common Core Table of Contents Chapter 1... 1 Chapter
Chapters 5-6: Statistical Inference Methods
 Chapters 5-6: Statistical Inference Methods Chapter 5: Estimation (of population parameters) Ex. Based on GSS data, we re 95% confident that the population mean of the variable LONELY (no. of days in past