3. Multidimensional Information Visualization II Concepts for visualizing univariate to hypervariate data
|
|
|
- Eugene Nelson
- 6 years ago
- Views:
Transcription
1 3. Multidimensional Information Visualization II Concepts for visualizing univariate to hypervariate data Vorlesung Informationsvisualisierung Prof. Dr. Andreas Butz, WS 2009/10 Konzept und Basis für n: Thorsten Büring 1
2 Outline Reference model and data terminology Visualizing data with < 4 variables Visualizing multivariable data Geometric transformation Glyphs Pixel-based Downscaling of dimensions Case studies: support for exploring multidimensional data Rank-by-feature Dust & magnet Clutter reduction techniques Exploring Design Decisions - demo 2

 provide maximum of locality preservation, but are difficult to follow and thus to relate between")
3 Pixel-Based Techniques Idea: each data value is represented by one colored pixel Value ranges are mapped to a fixed color sequence of full color (hue) scale but monotonically decreasing brightness Data values belonging to one attribute are displayed in a separate view only one pixel per data value without need for a border But: users need to relate to different portions of the screen to perceive correlations Optimization Goal (OG) 1: arrangement of pixels in the subwindows should preserve the 1D ordering into 2D plane as best as possible Simple left-right or top-down arrangement do usually not provide useful results on a pixel-level Space-filling curves (Paneo-Hilbert and Morton) provide maximum of locality preservation, but are difficult to follow and thus to relate between the subwindows Recursive pattern Circle segments Paneo-Hilbert Morton 3

4 Recursive Pattern Keim et al Naturally ordered data set Prices of IBM stock, Dow Jones index, Gold, exchange rate US-Dollar September 1987-February daily measurements for each stock Recursive pattern visualization Lower-level patterns used as building blocks for higher level patterns Keim 2000 LP1 one day, LP2 one week, LP3 one month, LP4 one year 4
5 Recursive Pattern 8 horizontal bars correspond to 8 years Subdivisions between the bars represent 12 months within each year Example analysis results Gold price was very low in the sixth year IBM price fell quickly after the first 1 ½ month US-Dollar exchange rate was highest in the third year Keim et al

6 Keim et al

7 Query Dependent Arrangement Ordering of data objects based on relevance to a given query Most relevant data object is placed in the center of the screen OG 2: for the pixel arrangement in each subwindow the distance to the center should correspond to the ordering of the data objects Simple spiral arrangement fulfills OG 2, but local clustering properties (OG 1) are weak, i.e. low probability that two pixels close on the screen are also close in the 1D ordered sequence of the query result set Generalized spiral technique: enhance the clustering qualities of the spiral technique by using screen-filling curves locally Keim

8 Spiral vs. Generalized Spiral Keim1996 8
 belonging to one case Circle segment Each dimension corresponds to a segment of a circle")
9 Circle Segment Rethink the shape of subwindow Rectangular shape of subwindows makes efficient use of the screen For data sets with many dimensions, the pixels of one data object are rather far apart Makes it difficult to find patterns OP 3: minimize the average distance between the pixels (data values) belonging to one case Circle segment Each dimension corresponds to a segment of a circle Values of one dimension are drawn in a back and forth manner from the center of the circle to the outside 9


10 Circle Segment (CS) vs. Line Graphs 10 years of stock data for 7 stocks Line graph granularity is limited by the width of the screen CS: oldest data items in the middle of the circle, most recent ones are at the outside Easier to perceive patterns no overlap of data Keim et al. 1996b 10
11 Pixel-Based Techniques Advantages: Large data sets can be visualized Improved pattern detection due to non-overlap strategy Disadvantages Labeling Intuitiveness Mapping color to quantitative data? Open questions Drill-down to detail information?? 11
12 Downscaling of Dimensions Projecting n dimensions down to a lower dimensionality while retaining as much of the original information as possible Principal components analysis, Factor analysis, Multidimensional scaling Statistical approaches to reduce the number of dimensions by finding the data s main characteristics / patterns Good tutorial: principal_components.pdf Self-organizing maps (SOM) aka Kohonen map Reduce the dimensions of data by using self-organizing neural networks Produces usually a 2D map which mirrors the similarity of cases (similar cases are grouped together) Good tutorial: Problems: pruning of information; hard to interpret since display coordinates have no semantic meaning; SOM and MDS are iterative approaches (computationally hard, no unique result) 12

13 Downscaling of Dimensions Skupin
14 Rank-By-Feature Seo & Shneiderman 2004 Part of the Hierarchical Clustering Explorer (HCE) 3.0 ( Tabs: histogram and scatterplot ordering Implements systematic approach for data exploration (1) study 1D, study 2D, then find features (2) ranking guides insight, statistics confirm Tool provides low-dimensional projections as a histogram (1D) or scatterplot (2D) Users can select a feature detection criterion (e.g. test for normal distribution (1D), correlation coefficient (2D)) to rank projections The ranking facility is particularly helpful when the number of possible projections is too large to investigate: concentrate on the interesting ones 14
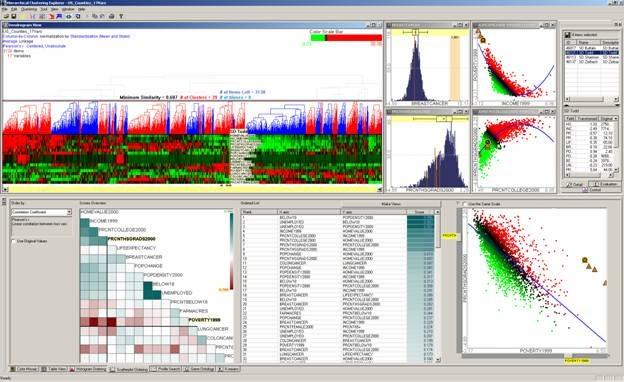
15 Rank-By-Feature 15
 C: numerical / statistical detail for each dimension (e.g. score, mean, standard deviation) D: display of histogram + boxplot (minimum, first quartile, median, third quartile, maximum) 16")
16 Rank-By-Feature Users start with 1D projections (histogram ordering) Four coordinated views A: selection of ranking criterion B: overview of scores for all dimensions (color coding: the brighter the color, the higher the score) C: numerical / statistical detail for each dimension (e.g. score, mean, standard deviation) D: display of histogram + boxplot (minimum, first quartile, median, third quartile, maximum) 16
17 Rank-By-Feature Some basic statistical terms Mean: Sum of all values divided by the number of values Median: Middle value of a distribution of values when ranked in order of magnitude Mode: Single most common value Variance: average squared deviation between the mean and the values Standard deviation: square root of the variance (translates the variance into the original units of measurement) Statistical tests supported by HCE for 1D ranking Normality of the distribution: distribution of items forms a symmetric, bellshaped curve Uniformity of the distribution: all of the values of a random variable occur with equal probability (results in a flat histogram) Number of potential outliers Number of unique values 17

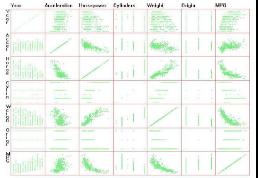
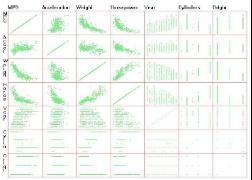
18 Rank-By-Feature Move on to 2D projections (scatterplot ordering) Identify pairwise relationships between dimensions B: prism provides overview of scores for dimension pairs; score is color coded D: scatterplot browser; multiple browsers are possible; Ranking creteria Correlation coefficient: direction and strength of linear relationship Least square error for simple linear / curvilinear regression: how well does the regression model fit Number of items in a user-defined region of interest & uniformity of scatterplot 18
19 Dust & Magnet Yi et al Data cases are represented as particles of iron dust Magnets represent the dimensions of the data set Users manipulate the magnets to move the dust Dust moves at different speed depending on its data values for the magnet dimensions 19

20 Dust & Magnet 20
21 Clutter Reduction Techniques Clutter: crowded and disordered visual entities that obscure the structure in visual displays Avoiding clutter is one of the main challenges in Information Visualization Techniques to reduce clutter Dimension reordering Sampling Constant-density visualization Point displacement Aggregation / Clustering (one mark represents more than one case, e.g. group day sales into months) Filtering (Dynamic queries, zooming) 21


22 Dimension Reordering Peng et al Automatically identify the views with the least amount of visual clutter Clutter definition and algorithms for different visualization techniques 22
23 Dimension Reordering 23
24 Sampling Reduce the density of visual representation by displaying a random subset of the data Random sampling preserves the distribution of data Overall trends (e.g. correlation) can still be detected at a reduced density Uniform sampling (Ellis & Dix 2004) Applying the same (manually or automatically defined) sampling factor to the entire data space Problem: areas with low density may become empty Non-uniform sampling (Bertini & Santucci 2004) Preserving relative density Model to compute where, how, and how much to sample to preserve image characteristics 24

25 Bertini & Santucci


26 Sampling Lens Ellis et al Magic Lens approach to apply random sampling to user-defined regions while maintaining the original data density in the context 26
27 Constant Information Density Woodruff et al Data objects in areas with high information density are represented by small-sized low-detail glyphs Objects in sparse-density areas are represented by larger, more detailed glyphs The number of information objects is kept constant as the user scales and moves the view 27

28 Constant Information Density 28

29 Point Displacement Items that would overlap other items are moved to adjacent free positions Position of the items and their distance should be preserved as much as possible Three algorithms for displacing pixels (e.g. adding abstract data to geographical maps) (Keim & Hermann 1998) Nearest-Neighbor Curve-based Gridfit Algorithms share the same procedure All data points which have a unique position are placed on the display New positions are determined for the remaining points Keim 2000: data with and without overlap 29
")

30 Point Displacement Nearest-Neighbor algorithm For all points which have not been set in the first step, place them on the nearest unoccupied position Fast to compute, but limited effectiveness for very dense displays (pixels may be placed very far from their original positions) Curve-based algorithm For all points which have not been set in the first step Compute the nearest unoccupied position on a given screen-filling curve Shift all points between the occupied pixel and the unoccupied position along the screen-filling curve Place the point on the newly available unoccupied pixel 30


31 Exploring Design Decisions download from 31
3. Multidimensional Information Visualization I Concepts for visualizing univariate to hypervariate data
 3. Multidimensional Information Visualization I Concepts for visualizing univariate to hypervariate data Vorlesung Informationsvisualisierung Prof. Dr. Andreas Butz, WS 2011/12 Konzept und Basis für n:
CS Information Visualization Sep. 2, 2015 John Stasko
 Multivariate Visual Representations 2 CS 7450 - Information Visualization Sep. 2, 2015 John Stasko Recap We examined a number of techniques for projecting >2 variables (modest number of dimensions) down
Glyphs. Presentation Overview. What is a Glyph!? Cont. What is a Glyph!? Glyph Fundamentals. Goal of Paper. Presented by Bertrand Low
 Presentation Overview Glyphs Presented by Bertrand Low A Taxonomy of Glyph Placement Strategies for Multidimensional Data Visualization Matthew O. Ward, Information Visualization Journal, Palmgrave,, Volume
CS Information Visualization Sep. 19, 2016 John Stasko
 Multivariate Visual Representations 2 CS 7450 - Information Visualization Sep. 19, 2016 John Stasko Learning Objectives Explain the concept of dense pixel/small glyph visualization techniques Describe
Vocabulary. 5-number summary Rule. Area principle. Bar chart. Boxplot. Categorical data condition. Categorical variable.
 5-number summary 68-95-99.7 Rule Area principle Bar chart Bimodal Boxplot Case Categorical data Categorical variable Center Changing center and spread Conditional distribution Context Contingency table
Designing Pixel-Oriented Visualization Techniques: Theory and Applications
 IEEE TRANSACTIONS ON VISUALIZATION AND COMPUTER GRAPHICS, VOL 6, NO 1, JANUARY-MARCH 2000 59 Designing Pixel-Oriented Visualization Techniques: Theory and Applications Daniel A Keim AbstractÐVisualization
Multiple Dimensional Visualization
 Multiple Dimensional Visualization Dimension 1 dimensional data Given price information of 200 or more houses, please find ways to visualization this dataset 2-Dimensional Dataset I also know the distances
6. Graphs and Networks visualizing relations
 6. Graphs and Networks visualizing relations Vorlesung Informationsvisualisierung Prof. Dr. Andreas Butz, WS 2011/12 Konzept und Basis für n: Thorsten Büring 1 Outline Graph overview Terminology Networks
5. Interaction with Visualizations Dynamic linking, brushing and filtering in Information Visualization displays
 5. Interaction with Visualizations Dynamic linking, brushing and filtering in Information Visualization displays Vorlesung Informationsvisualisierung Prof. Dr. Andreas Butz, WS 20011/12 Konzept und Basis
Background. Parallel Coordinates. Basics. Good Example
 Background Parallel Coordinates Shengying Li CSE591 Visual Analytics Professor Klaus Mueller March 20, 2007 Proposed in 80 s by Alfred Insellberg Good for multi-dimensional data exploration Widely used
Prepare a stem-and-leaf graph for the following data. In your final display, you should arrange the leaves for each stem in increasing order.
 Chapter 2 2.1 Descriptive Statistics A stem-and-leaf graph, also called a stemplot, allows for a nice overview of quantitative data without losing information on individual observations. It can be a good
Visual Encoding Design
 CSE 442 - Data Visualization Visual Encoding Design Jeffrey Heer University of Washington Review: Expressiveness & Effectiveness / APT Choosing Visual Encodings Assume k visual encodings and n data attributes.
Courtesy of Prof. Shixia University
 Courtesy of Prof. Shixia Liu @Tsinghua University Outline Introduction Classification of Techniques Table Scatter Plot Matrices Projections Parallel Coordinates Summary Motivation Real world data contain
Part I, Chapters 4 & 5. Data Tables and Data Analysis Statistics and Figures
 Part I, Chapters 4 & 5 Data Tables and Data Analysis Statistics and Figures Descriptive Statistics 1 Are data points clumped? (order variable / exp. variable) Concentrated around one value? Concentrated
1.3 Graphical Summaries of Data
 Arkansas Tech University MATH 3513: Applied Statistics I Dr. Marcel B. Finan 1.3 Graphical Summaries of Data In the previous section we discussed numerical summaries of either a sample or a data. In this
Acquisition Description Exploration Examination Understanding what data is collected. Characterizing properties of data.
 Summary Statistics Acquisition Description Exploration Examination what data is collected Characterizing properties of data. Exploring the data distribution(s). Identifying data quality problems. Selecting
Statistical Analysis of Metabolomics Data. Xiuxia Du Department of Bioinformatics & Genomics University of North Carolina at Charlotte
 Statistical Analysis of Metabolomics Data Xiuxia Du Department of Bioinformatics & Genomics University of North Carolina at Charlotte Outline Introduction Data pre-treatment 1. Normalization 2. Centering,
Data Preprocessing. S1 Teknik Informatika Fakultas Teknologi Informasi Universitas Kristen Maranatha
 Data Preprocessing S1 Teknik Informatika Fakultas Teknologi Informasi Universitas Kristen Maranatha 1 Why Data Preprocessing? Data in the real world is dirty incomplete: lacking attribute values, lacking
Data can be in the form of numbers, words, measurements, observations or even just descriptions of things.
 + What is Data? Data is a collection of facts. Data can be in the form of numbers, words, measurements, observations or even just descriptions of things. In most cases, data needs to be interpreted and
Data Mining and Analytics. Introduction
 Data Mining and Analytics Introduction Data Mining Data mining refers to extracting or mining knowledge from large amounts of data It is also termed as Knowledge Discovery from Data (KDD) Mostly, data
Information Visualization. Jing Yang Spring Multi-dimensional Visualization (1)
") Information Visualization Jing Yang Spring 2008 1 Multi-dimensional Visualization (1) 2 1 Multi-dimensional (Multivariate) Dataset 3 Data Item (Object, Record, Case) 4 2 Dimension (Variable, Attribute)
Information Visualization Jing Yang Spring 2008 1 Multi-dimensional Visualization (1) 2 1 Multi-dimensional (Multivariate) Dataset 3 Data Item (Object, Record, Case) 4 2 Dimension (Variable, Attribute)
Knowledge Discovery and Data Mining I
 Ludwig-Maximilians-Universität München Lehrstuhl für Datenbanksysteme und Data Mining Prof. Dr. Thomas Seidl Knowledge Discovery and Data Mining I Winter Semester 8/9 Agenda. Introduction. Basics. Data
Introduction to Geospatial Analysis
 Introduction to Geospatial Analysis Introduction to Geospatial Analysis 1 Descriptive Statistics Descriptive statistics. 2 What and Why? Descriptive Statistics Quantitative description of data Why? Allow
6. Graphs and Networks visualizing relations
 6. Graphs and Networks visualizing relations Vorlesung Informationsvisualisierung Prof. Dr. Andreas Butz, WS 2009/10 Konzept und Basis für n: Thorsten Büring 1 Outline Graph overview Terminology Networks
Table of Contents (As covered from textbook)
") Table of Contents (As covered from textbook) Ch 1 Data and Decisions Ch 2 Displaying and Describing Categorical Data Ch 3 Displaying and Describing Quantitative Data Ch 4 Correlation and Linear Regression
Table of Contents (As covered from textbook) Ch 1 Data and Decisions Ch 2 Displaying and Describing Categorical Data Ch 3 Displaying and Describing Quantitative Data Ch 4 Correlation and Linear Regression
Further Maths Notes. Common Mistakes. Read the bold words in the exam! Always check data entry. Write equations in terms of variables
 Further Maths Notes Common Mistakes Read the bold words in the exam! Always check data entry Remember to interpret data with the multipliers specified (e.g. in thousands) Write equations in terms of variables
Chapter 2 Describing, Exploring, and Comparing Data
 Slide 1 Chapter 2 Describing, Exploring, and Comparing Data Slide 2 2-1 Overview 2-2 Frequency Distributions 2-3 Visualizing Data 2-4 Measures of Center 2-5 Measures of Variation 2-6 Measures of Relative
Data Foundations. Topic Objectives. and list subcategories of each. its properties. before producing a visualization. subsetting
 CS 725/825 Information Visualization Fall 2013 Data Foundations Dr. Michele C. Weigle http://www.cs.odu.edu/~mweigle/cs725-f13/ Topic Objectives! Distinguish between ordinal and nominal values and list
STA 570 Spring Lecture 5 Tuesday, Feb 1
 STA 570 Spring 2011 Lecture 5 Tuesday, Feb 1 Descriptive Statistics Summarizing Univariate Data o Standard Deviation, Empirical Rule, IQR o Boxplots Summarizing Bivariate Data o Contingency Tables o Row
Cluster Analysis and Visualization. Workshop on Statistics and Machine Learning 2004/2/6
 Cluster Analysis and Visualization Workshop on Statistics and Machine Learning 2004/2/6 Outlines Introduction Stages in Clustering Clustering Analysis and Visualization One/two-dimensional Data Histogram,
ECLT 5810 Data Preprocessing. Prof. Wai Lam
 ECLT 5810 Data Preprocessing Prof. Wai Lam Why Data Preprocessing? Data in the real world is imperfect incomplete: lacking attribute values, lacking certain attributes of interest, or containing only aggregate
CHAPTER 4: CLUSTER ANALYSIS
 CHAPTER 4: CLUSTER ANALYSIS WHAT IS CLUSTER ANALYSIS? A cluster is a collection of data-objects similar to one another within the same group & dissimilar to the objects in other groups. Cluster analysis
Learner Expectations UNIT 1: GRAPICAL AND NUMERIC REPRESENTATIONS OF DATA. Sept. Fathom Lab: Distributions and Best Methods of Display
 CURRICULUM MAP TEMPLATE Priority Standards = Approximately 70% Supporting Standards = Approximately 20% Additional Standards = Approximately 10% HONORS PROBABILITY AND STATISTICS Essential Questions &
Evgeny Maksakov Advantages and disadvantages: Advantages and disadvantages: Advantages and disadvantages: Advantages and disadvantages:
 Today Problems with visualizing high dimensional data Problem Overview Direct Visualization Approaches High dimensionality Visual cluttering Clarity of representation Visualization is time consuming Dimensional
A Rank-by-Feature Framework for Unsupervised Multidimensional Data Exploration Using Low Dimensional Projections
 A Rank-by-Feature Framework for Unsupervised Multidimensional Data Exploration Using Low Dimensional Projections Jinwook Seo* and Ben Shneiderman Department of Computer Science & Human-Computer Interaction
An Experiment in Visual Clustering Using Star Glyph Displays
 An Experiment in Visual Clustering Using Star Glyph Displays by Hanna Kazhamiaka A Research Paper presented to the University of Waterloo in partial fulfillment of the requirements for the degree of Master
University of Florida CISE department Gator Engineering. Clustering Part 5
 Clustering Part 5 Dr. Sanjay Ranka Professor Computer and Information Science and Engineering University of Florida, Gainesville SNN Approach to Clustering Ordinary distance measures have problems Euclidean
Understanding Clustering Supervising the unsupervised
 Understanding Clustering Supervising the unsupervised Janu Verma IBM T.J. Watson Research Center, New York http://jverma.github.io/ jverma@us.ibm.com @januverma Clustering Grouping together similar data
Value and Relation Display for Interactive Exploration of High Dimensional Datasets
 Value and Relation Display for Interactive Exploration of High Dimensional Datasets Jing Yang, Anilkumar Patro, Shiping Huang, Nishant Mehta, Matthew O. Ward and Elke A. Rundensteiner Computer Science
SPSS QM II. SPSS Manual Quantitative methods II (7.5hp) SHORT INSTRUCTIONS BE CAREFUL
 SHORT INSTRUCTIONS BE CAREFUL") SPSS QM II SHORT INSTRUCTIONS This presentation contains only relatively short instructions on how to perform some statistical analyses in SPSS. Details around a certain function/analysis method not covered
SPSS QM II SHORT INSTRUCTIONS This presentation contains only relatively short instructions on how to perform some statistical analyses in SPSS. Details around a certain function/analysis method not covered
Create a bar graph that displays the data from the frequency table in Example 1. See the examples on p Does our graph look different?
 A frequency table is a table with two columns, one for the categories and another for the number of times each category occurs. See Example 1 on p. 247. Create a bar graph that displays the data from the
Slide Copyright 2005 Pearson Education, Inc. SEVENTH EDITION and EXPANDED SEVENTH EDITION. Chapter 13. Statistics Sampling Techniques
 SEVENTH EDITION and EXPANDED SEVENTH EDITION Slide - Chapter Statistics. Sampling Techniques Statistics Statistics is the art and science of gathering, analyzing, and making inferences from numerical information
CS 229 Final Project - Using machine learning to enhance a collaborative filtering recommendation system for Yelp
 CS 229 Final Project - Using machine learning to enhance a collaborative filtering recommendation system for Yelp Chris Guthrie Abstract In this paper I present my investigation of machine learning as
Interactive Visual Exploration
 Interactive Visual Exploration of High Dimensional Datasets Jing Yang Spring 2010 1 Challenges of High Dimensional Datasets High dimensional datasets are common: digital libraries, bioinformatics, simulations,
SELECTION OF A MULTIVARIATE CALIBRATION METHOD
 SELECTION OF A MULTIVARIATE CALIBRATION METHOD 0. Aim of this document Different types of multivariate calibration methods are available. The aim of this document is to help the user select the proper
Statistics 202: Data Mining. c Jonathan Taylor. Week 8 Based in part on slides from textbook, slides of Susan Holmes. December 2, / 1
 Week 8 Based in part on slides from textbook, slides of Susan Holmes December 2, 2012 1 / 1 Part I Clustering 2 / 1 Clustering Clustering Goal: Finding groups of objects such that the objects in a group
Preprocessing Short Lecture Notes cse352. Professor Anita Wasilewska
 Preprocessing Short Lecture Notes cse352 Professor Anita Wasilewska Data Preprocessing Why preprocess the data? Data cleaning Data integration and transformation Data reduction Discretization and concept
Data Mining. Part 2. Data Understanding and Preparation. 2.4 Data Transformation. Spring Instructor: Dr. Masoud Yaghini. Data Transformation
 Data Mining Part 2. Data Understanding and Preparation 2.4 Spring 2010 Instructor: Dr. Masoud Yaghini Outline Introduction Normalization Attribute Construction Aggregation Attribute Subset Selection Discretization
Glossary Common Core Curriculum Maps Math/Grade 6 Grade 8
 Glossary Common Core Curriculum Maps Math/Grade 6 Grade 8 Grade 6 Grade 8 absolute value Distance of a number (x) from zero on a number line. Because absolute value represents distance, the absolute value
UNIT 2 Data Preprocessing
 UNIT 2 Data Preprocessing Lecture Topic ********************************************** Lecture 13 Why preprocess the data? Lecture 14 Lecture 15 Lecture 16 Lecture 17 Data cleaning Data integration and
Clustering, Histograms, Sampling, MDS, and PCA
 Clustering, Histograms, Sampling, MDS, and PCA Class 11 1 Recall: The MRV Model 2 1 Recall: Simplification Simplification operators - today! Simplification operands Data space (structure level) Data item
Date Lesson TOPIC HOMEWORK. Displaying Data WS 6.1. Measures of Central Tendency WS 6.2. Common Distributions WS 6.6. Outliers WS 6.
 UNIT 6 ONE VARIABLE STATISTICS Date Lesson TOPIC HOMEWORK 6.1 3.3 6.2 3.4 Displaying Data WS 6.1 Measures of Central Tendency WS 6.2 6.3 6.4 3.5 6.5 3.5 Grouped Data Central Tendency Measures of Spread
Middle School Math Course 3
 Middle School Math Course 3 Correlation of the ALEKS course Middle School Math Course 3 to the Texas Essential Knowledge and Skills (TEKS) for Mathematics Grade 8 (2012) (1) Mathematical process standards.
Interaction. CS Information Visualization. Chris Plaue Some Content from John Stasko s CS7450 Spring 2006
 Interaction CS 7450 - Information Visualization Chris Plaue Some Content from John Stasko s CS7450 Spring 2006 Hello. What is this?! Hand back HW! InfoVis Music Video! Interaction Lecture remindme.mov
STA Module 2B Organizing Data and Comparing Distributions (Part II)
") STA 2023 Module 2B Organizing Data and Comparing Distributions (Part II) Learning Objectives Upon completing this module, you should be able to 1 Explain the purpose of a measure of center 2 Obtain and
STA 2023 Module 2B Organizing Data and Comparing Distributions (Part II) Learning Objectives Upon completing this module, you should be able to 1 Explain the purpose of a measure of center 2 Obtain and
STA Learning Objectives. Learning Objectives (cont.) Module 2B Organizing Data and Comparing Distributions (Part II)
 Module 2B Organizing Data and Comparing Distributions (Part II)") STA 2023 Module 2B Organizing Data and Comparing Distributions (Part II) Learning Objectives Upon completing this module, you should be able to 1 Explain the purpose of a measure of center 2 Obtain and
STA 2023 Module 2B Organizing Data and Comparing Distributions (Part II) Learning Objectives Upon completing this module, you should be able to 1 Explain the purpose of a measure of center 2 Obtain and
Preprocessing and Visualization. Jonathan Diehl
 RWTH Aachen University Chair of Computer Science VI Prof. Dr.-Ing. Hermann Ney Seminar Data Mining WS 2003/2004 Preprocessing and Visualization Jonathan Diehl January 19, 2004 onathan Diehl Preprocessing
2.1 Objectives. Math Chapter 2. Chapter 2. Variable. Categorical Variable EXPLORING DATA WITH GRAPHS AND NUMERICAL SUMMARIES
 EXPLORING DATA WITH GRAPHS AND NUMERICAL SUMMARIES Chapter 2 2.1 Objectives 2.1 What Are the Types of Data? www.managementscientist.org 1. Know the definitions of a. Variable b. Categorical versus quantitative
Exploratory Data Analysis using Self-Organizing Maps. Madhumanti Ray
 Exploratory Data Analysis using Self-Organizing Maps Madhumanti Ray Content Introduction Data Analysis methods Self-Organizing Maps Conclusion Visualization of high-dimensional data items Exploratory data
Learning and Inferring Depth from Monocular Images. Jiyan Pan April 1, 2009
 Learning and Inferring Depth from Monocular Images Jiyan Pan April 1, 2009 Traditional ways of inferring depth Binocular disparity Structure from motion Defocus Given a single monocular image, how to infer
Interactive Math Glossary Terms and Definitions
 Terms and Definitions Absolute Value the magnitude of a number, or the distance from 0 on a real number line Addend any number or quantity being added addend + addend = sum Additive Property of Area the
Machine Learning Methods in Visualisation for Big Data 2018
 Machine Learning Methods in Visualisation for Big Data 2018 Daniel Archambault1 Ian Nabney2 Jaakko Peltonen3 1 Swansea University 2 University of Bristol 3 University of Tampere, Aalto University Evaluating
Data Mining Chapter 3: Visualizing and Exploring Data Fall 2011 Ming Li Department of Computer Science and Technology Nanjing University
 Data Mining Chapter 3: Visualizing and Exploring Data Fall 2011 Ming Li Department of Computer Science and Technology Nanjing University Exploratory data analysis tasks Examine the data, in search of structures
Regression III: Advanced Methods
 Lecture 3: Distributions Regression III: Advanced Methods William G. Jacoby Michigan State University Goals of the lecture Examine data in graphical form Graphs for looking at univariate distributions
Week 7 Picturing Network. Vahe and Bethany
 Week 7 Picturing Network Vahe and Bethany Freeman (2005) - Graphic Techniques for Exploring Social Network Data The two main goals of analyzing social network data are identification of cohesive groups
Visual Analytics. Visualizing multivariate data:
 Visual Analytics 1 Visualizing multivariate data: High density time-series plots Scatterplot matrices Parallel coordinate plots Temporal and spectral correlation plots Box plots Wavelets Radar and /or
Middle School Math Course 2
 Middle School Math Course 2 Correlation of the ALEKS course Middle School Math Course 2 to the Indiana Academic Standards for Mathematics Grade 7 (2014) 1: NUMBER SENSE = ALEKS course topic that addresses
Visual Computing. Lecture 2 Visualization, Data, and Process
 Visual Computing Lecture 2 Visualization, Data, and Process Pipeline 1 High Level Visualization Process 1. 2. 3. 4. 5. Data Modeling Data Selection Data to Visual Mappings Scene Parameter Settings (View
Predictive Analytics: Demystifying Current and Emerging Methodologies. Tom Kolde, FCAS, MAAA Linda Brobeck, FCAS, MAAA
 Predictive Analytics: Demystifying Current and Emerging Methodologies Tom Kolde, FCAS, MAAA Linda Brobeck, FCAS, MAAA May 18, 2017 About the Presenters Tom Kolde, FCAS, MAAA Consulting Actuary Chicago,
Data Mining: Exploring Data
 Data Mining: Exploring Data Lecture Notes for Chapter 3 Introduction to Data Mining by Tan, Steinbach, Kumar But we start with a brief discussion of the Friedman article and the relationship between Data
Data Mining: Exploring Data. Lecture Notes for Chapter 3
 Data Mining: Exploring Data Lecture Notes for Chapter 3 1 What is data exploration? A preliminary exploration of the data to better understand its characteristics. Key motivations of data exploration include
SpringView: Cooperation of Radviz and Parallel Coordinates for View Optimization and Clutter Reduction
 SpringView: Cooperation of Radviz and Parallel Coordinates for View Optimization and Clutter Reduction Enrico Bertini, Luigi Dell Aquila, Giuseppe Santucci Dipartimento di Informatica e Sistemistica -
This research aims to present a new way of visualizing multi-dimensional data using generalized scatterplots by sensitivity coefficients to highlight
 This research aims to present a new way of visualizing multi-dimensional data using generalized scatterplots by sensitivity coefficients to highlight local variation of one variable with respect to another.
Parallel Coordinates ++
 Parallel Coordinates ++ CS 4460/7450 - Information Visualization Feb. 2, 2010 John Stasko Last Time Viewed a number of techniques for portraying low-dimensional data (about 3
AND NUMERICAL SUMMARIES. Chapter 2
 EXPLORING DATA WITH GRAPHS AND NUMERICAL SUMMARIES Chapter 2 2.1 What Are the Types of Data? 2.1 Objectives www.managementscientist.org 1. Know the definitions of a. Variable b. Categorical versus quantitative
Chapter 3 - Displaying and Summarizing Quantitative Data
 Chapter 3 - Displaying and Summarizing Quantitative Data 3.1 Graphs for Quantitative Data (LABEL GRAPHS) August 25, 2014 Histogram (p. 44) - Graph that uses bars to represent different frequencies or relative
Data Preprocessing. Why Data Preprocessing? MIT-652 Data Mining Applications. Chapter 3: Data Preprocessing. Multi-Dimensional Measure of Data Quality
 Why Data Preprocessing? Data in the real world is dirty incomplete: lacking attribute values, lacking certain attributes of interest, or containing only aggregate data e.g., occupation = noisy: containing
Advanced visualization techniques for Self-Organizing Maps with graph-based methods
 Advanced visualization techniques for Self-Organizing Maps with graph-based methods Georg Pölzlbauer 1, Andreas Rauber 1, and Michael Dittenbach 2 1 Department of Software Technology Vienna University
STA Rev. F Learning Objectives. Learning Objectives (Cont.) Module 3 Descriptive Measures
 Module 3 Descriptive Measures") STA 2023 Module 3 Descriptive Measures Learning Objectives Upon completing this module, you should be able to: 1. Explain the purpose of a measure of center. 2. Obtain and interpret the mean, median, and
STA 2023 Module 3 Descriptive Measures Learning Objectives Upon completing this module, you should be able to: 1. Explain the purpose of a measure of center. 2. Obtain and interpret the mean, median, and
Data Mining: Exploring Data. Lecture Notes for Chapter 3. Introduction to Data Mining
 Data Mining: Exploring Data Lecture Notes for Chapter 3 Introduction to Data Mining by Tan, Steinbach, Kumar What is data exploration? A preliminary exploration of the data to better understand its characteristics.
IAT 355 Visual Analytics. Data and Statistical Models. Lyn Bartram
 IAT 355 Visual Analytics Data and Statistical Models Lyn Bartram Exploring data Example: US Census People # of people in group Year # 1850 2000 (every decade) Age # 0 90+ Sex (Gender) # Male, female Marital
Averages and Variation
 Averages and Variation 3 Copyright Cengage Learning. All rights reserved. 3.1-1 Section 3.1 Measures of Central Tendency: Mode, Median, and Mean Copyright Cengage Learning. All rights reserved. 3.1-2 Focus
Multidimensional Visualization and Clustering
 Multidimensional Visualization and Clustering Presentation for Visual Analytics of Professor Klaus Mueller Xiaotian (Tim) Yin 04-26 26-20072007 Paper List HD-Eye: Visual Mining of High-Dimensional Data
CSE Data Visualization. Multidimensional Vis. Jeffrey Heer University of Washington
 CSE 512 - Data Visualization Multidimensional Vis Jeffrey Heer University of Washington Last Time: Exploratory Data Analysis Exposure, the effective laying open of the data to display the unanticipated,
Chapter 4: Analyzing Bivariate Data with Fathom
 Chapter 4: Analyzing Bivariate Data with Fathom Summary: Building from ideas introduced in Chapter 3, teachers continue to analyze automobile data using Fathom to look for relationships between two quantitative
Data Mining: Exploring Data. Lecture Notes for Data Exploration Chapter. Introduction to Data Mining
 Data Mining: Exploring Data Lecture Notes for Data Exploration Chapter Introduction to Data Mining by Tan, Steinbach, Karpatne, Kumar 02/03/2018 Introduction to Data Mining 1 What is data exploration?
Quality Metrics for Visual Analytics of High-Dimensional Data
 Quality Metrics for Visual Analytics of High-Dimensional Data Daniel A. Keim Data Analysis and Information Visualization Group University of Konstanz, Germany Workshop on Visual Analytics and Information
Fathom Dynamic Data TM Version 2 Specifications
 Data Sources Fathom Dynamic Data TM Version 2 Specifications Use data from one of the many sample documents that come with Fathom. Enter your own data by typing into a case table. Paste data from other
Chapter 2: Modeling Distributions of Data
 Chapter 2: Modeling Distributions of Data Section 2.2 The Practice of Statistics, 4 th edition - For AP* STARNES, YATES, MOORE Chapter 2 Modeling Distributions of Data 2.1 Describing Location in a Distribution
Chapter 3 Image Registration. Chapter 3 Image Registration
 Chapter 3 Image Registration Distributed Algorithms for Introduction (1) Definition: Image Registration Input: 2 images of the same scene but taken from different perspectives Goal: Identify transformation
Large Scale Information
 Large Scale Information Visualization Jing Yang Fall 2009 1 Relevant Information Course webpage: www.cs.uncc.edu/~jyang13 Schedule Grading policy Slides Assignments 2 1 Visualization Visualization - the
Perception Maneesh Agrawala CS : Visualization Fall 2013 Multidimensional Visualization
 Perception Maneesh Agrawala CS 294-10: Visualization Fall 2013 Multidimensional Visualization 1 Visual Encoding Variables Position Length Area Volume Value Texture Color Orientation Shape ~8 dimensions?
DSC 201: Data Analysis & Visualization
 DSC 201: Data Analysis & Visualization Exploratory Data Analysis Dr. David Koop What is Exploratory Data Analysis? "Detective work" to summarize and explore datasets Includes: - Data acquisition and input
Data Preprocessing. Slides by: Shree Jaswal
 Data Preprocessing Slides by: Shree Jaswal Topics to be covered Why Preprocessing? Data Cleaning; Data Integration; Data Reduction: Attribute subset selection, Histograms, Clustering and Sampling; Data
Chapter 7: Competitive learning, clustering, and self-organizing maps
 Chapter 7: Competitive learning, clustering, and self-organizing maps António R. C. Paiva EEL 6814 Spring 2008 Outline Competitive learning Clustering Self-Organizing Maps What is competition in neural
CS 521 Data Mining Techniques Instructor: Abdullah Mueen
 CS 521 Data Mining Techniques Instructor: Abdullah Mueen LECTURE 2: DATA TRANSFORMATION AND DIMENSIONALITY REDUCTION Chapter 3: Data Preprocessing Data Preprocessing: An Overview Data Quality Major Tasks
MATH 112 Section 7.2: Measuring Distribution, Center, and Spread
 MATH 112 Section 7.2: Measuring Distribution, Center, and Spread Prof. Jonathan Duncan Walla Walla College Fall Quarter, 2006 Outline 1 Measures of Center The Arithmetic Mean The Geometric Mean The Median
Table Of Contents: xix Foreword to Second Edition
 Data Mining : Concepts and Techniques Table Of Contents: Foreword xix Foreword to Second Edition xxi Preface xxiii Acknowledgments xxxi About the Authors xxxv Chapter 1 Introduction 1 (38) 1.1 Why Data
Chapter 2: Looking at Multivariate Data
 Chapter 2: Looking at Multivariate Data Multivariate data could be presented in tables, but graphical presentations are more effective at displaying patterns. We can see the patterns in one variable at
Chapter 2: Descriptive Statistics
 Chapter 2: Descriptive Statistics Student Learning Outcomes By the end of this chapter, you should be able to: Display data graphically and interpret graphs: stemplots, histograms and boxplots. Recognize,