Constructing Statistical Tolerance Limits for Non-Normal Data. Presented by Dr. Neil W. Polhemus
|
|
|
- Bridget Lynch
- 6 years ago
- Views:
Transcription


1 Constructing Statistical Tolerance Limits for Non-Normal Data Presented by Dr. Neil W. Polhemus
2 Statistical Tolerance Limits Consider a sample of n observations taken from a continuous population. {X 1, X 2,, X n } Statistical tolerance limits create an interval that bounds a specified percentage of the population at a given level of confidence. (such as 99% of the population with 95% confidence) These intervals are often used to demonstrate compliance with a set of requirements or specification limits.
3 Example: Medical Devices Consider the following measurements of the diameter of a sample n = 100 of medical devices: The specification limits are 2.0 ± 0.1
4 Assuming Normality If we could assume that the data are a random sample from a normal distribution, then a 95% statistical tolerance interval for 99% of the underlying population would be given by: x ± Ks K depends on the level of confidence 100(1-a)% and the percentage of the population P to be bound.
5 General Approach for Constructing Statistical Tolerance Limits Step 1: Test data for normality. If normal dist. is tenable, calculate normal tolerance limits. Step 2: If not normal, search for a normalizing transformation. If acceptable transformation is found, calculate normal tolerance limits for transformed data and invert the limits. Step 3: If transformation approach fails, try alternative distributions such lognormal, extreme value or Weibull. If a good fit is found, calculate tolerance limits using that distribution. Step 4: If all else fails, calculate nonparametric tolerance limits.
6 Step 1: Test for Normality
7 Tests for Normality Shapiro-Wilk test: recommended for sample sizes between 3 and Anderson-Darling test: recommended for sample sizes n > Chi-square test: recommended for heavily rounded data. NOTE: be sure to set up classes that match the rounding of the data.
8 Warning: Beware of rounded data

9 Warning: Beware of rounded data

10 Solution: bin the data Be sure classes match the rounding


11 Run chi-square test
12 Step 2: Search for normalizing transformation If X does not follow a normal distribution, it may be possible to find a power p such that X p is normally distributed. If so, normal tolerance limits may be constructed for X p and then inverted to create limits for X. The general method of Box and Cox may be used to find the best value of p.
13 Statlets - Power Transformations
14 Power plus Addend If a simple power transformation does not work, an addend can be estimated as well: X t = (X + ) p
15 Power plus Addend

16 Tolerance Limits
17 Step 3: Find an Alternative Distribution Statgraphics will calculate statistical tolerance limits for the following distributions: Normal Lognormal Weibull Cauchy Exponential 2-parameter exponential Gamma Laplace Largest extreme value Pareto Smallest extreme value

18 Distribution Fitting Comparison of alternative distributions
19 Fitted Distributions

20 Goodness-of-Fit To test goodness-of-fit for alternative distributions, Anderson-Darling test is popular. Be sure to use modified form of the test, which adjusts the test statistics and P-value to account for estimated parameters.
21 Tolerance Limits
22 Tolerance Limits

23 Step 4: Nonparametric Limits Can specify either the population percentage or the confidence level, but not both. Tolerance interval is [ X (d), X (n-d+1) ]
24 Nonparametric Limits


25 Sample Size Determination Nonparametric Limits How large a sample is needed so that the range [min, max] forms a tolerance interval?
26 Sample Size Determination Parametric Limits How large should n be when fitting a normal or some other distribution? Different approaches to the problem. 1. Choose n so that the probability of including P*% or more of the population in the tolerance interval is small, where P* > P. 2. Choose n so that the probability of the entire tolerance interval being within the specification limits is large.

27 Example: LEV Distribution
28 Requires n=120 Observations

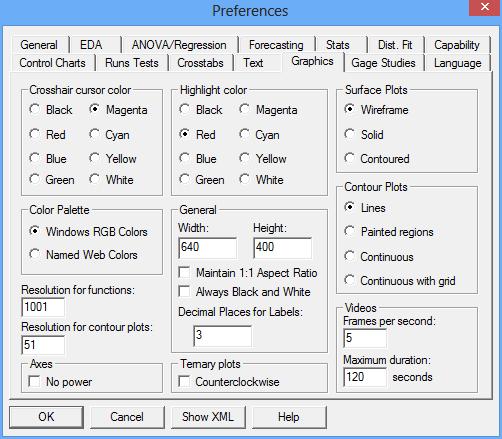
29 System Preferences
30 References Video, slides and sample data may be found at Hahn, G.J., Meeker, W.Q. and Escobar, L.A. (2017) Statistical Intervals: A Guide for Practitioners and Researchers, second edition. Wiley, New York.
StatsMate. User Guide
 StatsMate User Guide Overview StatsMate is an easy-to-use powerful statistical calculator. It has been featured by Apple on Apps For Learning Math in the App Stores around the world. StatsMate comes with
Minitab detailed
 Minitab 18.1 - detailed ------------------------------------- ADDITIVE contact sales: 06172-5905-30 or minitab@additive-net.de ADDITIVE contact Technik/ Support/ Installation: 06172-5905-20 or support@additive-net.de
Simulation Input Data Modeling
 Introduction to Modeling and Simulation Simulation Input Data Modeling OSMAN BALCI Professor Department of Computer Science Virginia Polytechnic Institute and State University (Virginia Tech) Blacksburg,
Statistical Techniques for Validation Sampling. Copyright GCI, Inc. 2016
 Statistical Techniques for Validation Sampling Tie Risk to Sampling Data Type Confidence Level Reliability and Risk Typical Performance Levels One-sided or two-sided spec Distribution (variables) Risk
What is Process Capability?
 6. Process or Product Monitoring and Control 6.1. Introduction 6.1.6. What is Process Capability? Process capability compares the output of an in-control process to the specification limits by using capability
BESTFIT, DISTRIBUTION FITTING SOFTWARE BY PALISADE CORPORATION
 Proceedings of the 1996 Winter Simulation Conference ed. J. M. Charnes, D. J. Morrice, D. T. Brunner, and J. J. S\vain BESTFIT, DISTRIBUTION FITTING SOFTWARE BY PALISADE CORPORATION Linda lankauskas Sam
CS CS 5623 Simulation Techniques
 CS 4633 - CS 5623 Simulation Techniques How to model data using matlab Instructor Dr. Turgay Korkmaz This tutorial along with matlab s statistical toolbox manual will be useful for HW 5. Data collection
For Additional Information...
 For Additional Information... The materials in this handbook were developed by Master Black Belts at General Electric Medical Systems to assist Black Belts and Green Belts in completing Minitab Analyses.
Package citools. October 20, 2018
 Type Package Package citools October 20, 2018 Title Confidence or Prediction Intervals, Quantiles, and Probabilities for Statistical Models Version 0.5.0 Maintainer John Haman Functions
Box-Cox Transformation
 Chapter 190 Box-Cox Transformation Introduction This procedure finds the appropriate Box-Cox power transformation (1964) for a single batch of data. It is used to modify the distributional shape of a set
Be#er%Accelerated%Tests%
 `` Be#er%Accelerated%Tests% Wayne%Nelson,%Sta5s5cal%Consultant% Wnconsult@aol.com,%%% (518)346C5138% ASTR%2015,%Sep%9%C%11,%Cambridge,%MA% 1% Copyright Wayne Nelson 2015 1 `PURPOSE DESCRIBE AVAILABLE STATISTICAL
Process Capability Calculations with Extremely Non-Normal Data
 Process Capability Calculations with Extremely Non-Normal Data copyright 2015 (all rights reserved), by: John N. Zorich Jr., MS, CQE Statistical Consultant & Trainer home office: Houston TX 408-203-8811
Accelerated Life Testing Module Accelerated Life Testing - Overview
 Accelerated Life Testing Module Accelerated Life Testing - Overview The Accelerated Life Testing (ALT) module of AWB provides the functionality to analyze accelerated failure data and predict reliability
Box-Cox Transformation for Simple Linear Regression
 Chapter 192 Box-Cox Transformation for Simple Linear Regression Introduction This procedure finds the appropriate Box-Cox power transformation (1964) for a dataset containing a pair of variables that are
Simultaneous Interval Regression for K-Nearest Neighbor
 Simultaneous Interval Regression for K-Nearest Neighbor Mohammad Ghasemi Hamed 1,2, Mathieu Serrurier 1, and Nicolas Durand 1,2 1 IRIT - Université Paul Sabatier 118 route de Narbonne 31062, Toulouse Cedex
Process Capability in the Six Sigma Environment
 GE Research & Development Center Process Capability in the Six Sigma Environment C.L. Stanard 2001CRD119, July 2001 Class 1 Technical Information Series Copyright 2001 General Electric Company. All rights
Possibilistic KNN regression using tolerance intervals
 Possibilistic KNN regression using tolerance intervals Mohammad Ghasemi Hamed, Mathieu Serrurier, Nicolas Durand To cite this version: Mohammad Ghasemi Hamed, Mathieu Serrurier, Nicolas Durand. Possibilistic
SigmaXL Feature List Summary, What s New in Versions 6.0, 6.1 & 6.2, Installation Notes, System Requirements and Getting Help
 SigmaXL Feature List Summary, What s New in Versions 6.0, 6.1 & 6.2, Installation Notes, System Requirements and Getting Help Copyright 2004-2013, SigmaXL Inc. SigmaXL Version 6.2 Feature List Summary
Multivariate Capability Analysis
 Multivariate Capability Analysis Summary... 1 Data Input... 3 Analysis Summary... 4 Capability Plot... 5 Capability Indices... 6 Capability Ellipse... 7 Correlation Matrix... 8 Tests for Normality... 8
A MATLAB-BASED OZTURK ALGORITHM IMPLEMENTATION
 AFRL-IF-RS-TM-2006-4 In-House Technical Memorandum May 2006 A MATLAB-BASED OZTURK ALGORITHM IMPLEMENTATION APPROVED FOR PUBLIC RELEASE; DISTRIBUTION UNLIMITED. AIR FORCE RESEARCH LABORATORY INFORMATION
SAS/ETS 14.2 User s Guide. The SEVERITY Procedure
 SAS/ETS 14.2 User s Guide The SEVERITY Procedure This document is an individual chapter from SAS/ETS 14.2 User s Guide. The correct bibliographic citation for this manual is as follows: SAS Institute Inc.
What s New in Oracle Crystal Ball? What s New in Version Browse to:
 What s New in Oracle Crystal Ball? Browse to: - What s new in version 11.1.1.0.00 - What s new in version 7.3 - What s new in version 7.2 - What s new in version 7.1 - What s new in version 7.0 - What
DfRSoft Overview. Design for Reliability Software. for complete DfR Engineering. DfRSoft. Thank You for your interest Dr.
 Overview Design for Reliability Software for complete DfR Engineering Thank You for your interest Dr. Alec Feinberg Author: Design for Reliability, Founder of DfRSoft Summary of Tools RELIABILITY SOFTWARE
MAT 110 WORKSHOP. Updated Fall 2018
 MAT 110 WORKSHOP Updated Fall 2018 UNIT 3: STATISTICS Introduction Choosing a Sample Simple Random Sample: a set of individuals from the population chosen in a way that every individual has an equal chance
LAMPIRAN. Tests of Normality. Kolmogorov-Smirnov a. Berat_Limfa KB KP P
 LAMPIRAN 1. Data Analisis Statistik 1.1 Berat Limpa U1 U2 U3 U4 U5 U6 Rata- SD Rata KB 0.53 0.17 0.18 0.2 0.18 0.13 0.23 0.15 KP 0.31 0.27 0.27 0.27 0.11 0.23 0.24 0.07 P1 0.23 0.21 0.12 0.2 0.24 0.23
APPROACHES TO THE PROCESS CAPABILITY ANALYSIS IN THE CASE OF NON- NORMALLY DISTRIBUTED PRODUCT QUALITY CHARACTERISTIC
 APPROACHES TO THE PROCESS CAPABILITY ANALYSIS IN THE CASE OF NON- NORMALLY DISTRIBUTED PRODUCT QUALITY CHARACTERISTIC Jiří PLURA, Milan ZEMEK, Pavel KLAPUT VŠB-Technical University of Ostrava, Faculty
Verification / Validation Tools
 Verification / Validation Tools B. Mascialino, A. Pfeiffer, M.G. Pia, A. Ribon, P. Viarengo 0 th Geant4 Workshop Bordeaux, November 8 th 2005 Goodness of Fit tests Goodness-of-Fit tests measure: the compatibility
Chapter 30 The RELIABILITY Procedure
 Chapter 30 The RELIABILITY Procedure Chapter Table of Contents OVERVIEW...923 GETTING STARTED...925 Analysis of Right-Censored Data from a Single Population...925 Weibull Analysis Comparing Groups of Data....928
Fathom Dynamic Data TM Version 2 Specifications
 Data Sources Fathom Dynamic Data TM Version 2 Specifications Use data from one of the many sample documents that come with Fathom. Enter your own data by typing into a case table. Paste data from other
Package benchden. February 19, 2015
 Package benchden February 19, 2015 Type Package Title 28 benchmark densities from Berlinet/Devroye (1994) Version 1.0.5 Date 2012-02-29 Author Thoralf Mildenberger, Henrike Weinert, Sebastian Tiemeyer
Minitab Training. Leading Innovation. 3 1 s. 6 2 s. Upper Specification Limit. Lower Specification Limit. Mean / Target. High Probability of Failure
 Lower Specification Limit Mean / Target Upper Specification Limit High Probability of Failure Minitab Training 1 3 1 s 3 1 s Much Lower Probability of Failure 1 6 2 s 6 2 s Learning Objectives Understand
By choosing to view this document, you agree to all provisions of the copyright laws protecting it.
 Copyright 2014 IEEE. Reprinted, with permission, from Huairui Guo, Edward Pohl and Athanasios Gerokostopoulos, Determining the Right Sample Size for Your Test: Theory and Application, 2014 Reliability
Overview. Frequency Distributions. Chapter 2 Summarizing & Graphing Data. Descriptive Statistics. Inferential Statistics. Frequency Distribution
 Chapter 2 Summarizing & Graphing Data Slide 1 Overview Descriptive Statistics Slide 2 A) Overview B) Frequency Distributions C) Visualizing Data summarize or describe the important characteristics of a
BestFit. Distribution Fitting for Windows. Version 4.5 September, Guide to Using
 Guide to Using BestFit Distribution Fitting for Windows Version 4.5 September, 2004 Palisade Corporation 31 Decker Road Newfield, NY USA 14867 (607) 277-8000 (607) 277-8001 (fax) http://www.palisade.com
Package visualizationtools
 Package visualizationtools April 12, 2011 Type Package Title Package contains a few functions to visualize statistical circumstances. Version 0.2 Date 2011-04-06 Author Thomas Roth Etienne Stockhausen
Building Models with Categorical Variables
 Building Models with Categorical Variables (Chapter 10 Software Project Estimation) Alain Abran (Tutorial Contribution: Dr. Monica Villavicencio) 1 Copyright 2015 Alain Abran Topics covered 1. Introduction
A Short Introduction to R
 A Short Introduction to R 1.1 The R initiative There are many commercial statistical softwares available. Well-known examples include SAS, SPSS, S-Plus, Minitab, Statgraphics, GLIM, and Genstat. Usually
Cpk: What is its Capability? By: Rick Haynes, Master Black Belt Smarter Solutions, Inc.
 C: What is its Capability? By: Rick Haynes, Master Black Belt Smarter Solutions, Inc. C is one of many capability metrics that are available. When capability metrics are used, organizations typically provide
Stat 302 Statistical Software and Its Applications SAS: Distributions
 Stat 302 Statistical Software and Its Applications SAS: Distributions Yen-Chi Chen Department of Statistics, University of Washington Autumn 2016 1 / 39 Distributions in R and SAS Distribution R SAS Beta
Choosing a reliability inspection plan for interval censored data
 Quality Engineering ISSN: 0898-2112 (Print) 1532-4222 (Online) Journal homepage: http://www.tandfonline.com/loi/lqen20 Choosing a reliability inspection plan for interval censored data Lu Lu & Christine
STATS PAD USER MANUAL
 STATS PAD USER MANUAL For Version 2.0 Manual Version 2.0 1 Table of Contents Basic Navigation! 3 Settings! 7 Entering Data! 7 Sharing Data! 8 Managing Files! 10 Running Tests! 11 Interpreting Output! 11
The ctest Package. January 3, 2000
 R objects documented: The ctest Package January 3, 2000 bartlett.test....................................... 1 binom.test........................................ 2 cor.test.........................................
SENSITIVITY OF OUTPUT PERFORMANCE MEASURES TO INPUT DISTRIBUTIONS IN QUEUEING NETWORK MODELING. Donald Gross Denise M.
 Proceedings of the 1998 Winter Simulation Conference D.J. Medeiros, E.F. Watson, J.S. Carson and M.S. Manivannan, eds. SENSITIVITY OF OUTPUT PERFORMANCE MEASURES TO INPUT DISTRIBUTIONS IN QUEUEING NETWORK
Fitting Classification and Regression Trees Using Statgraphics and R. Presented by Dr. Neil W. Polhemus
 Fitting Classification and Regression Trees Using Statgraphics and R Presented by Dr. Neil W. Polhemus Classification and Regression Trees Machine learning methods used to construct predictive models from
CREATING THE DISTRIBUTION ANALYSIS
 Chapter 12 Examining Distributions Chapter Table of Contents CREATING THE DISTRIBUTION ANALYSIS...176 BoxPlot...178 Histogram...180 Moments and Quantiles Tables...... 183 ADDING DENSITY ESTIMATES...184
Simplified Whisker Risk Model Extensions
 Simplified Whisker Risk Model Extensions 1. Extensions to Whisker Risk Model The whisker risk Monte Carlo model described in the prior SERDEP work (Ref. 1) was extended to incorporate the following: Parallel
Multivariate Normal Random Numbers
 Multivariate Normal Random Numbers Revised: 10/11/2017 Summary... 1 Data Input... 3 Analysis Options... 4 Analysis Summary... 5 Matrix Plot... 6 Save Results... 8 Calculations... 9 Summary This procedure
An Introduction to the Bootstrap
 An Introduction to the Bootstrap Bradley Efron Department of Statistics Stanford University and Robert J. Tibshirani Department of Preventative Medicine and Biostatistics and Department of Statistics,
STATISTICAL ANALYSIS PROGRAM FOR GENERATING MATERIAL ALLOWABLES
 STATISTICAL ANALYSIS PROGRAM FOR GENERATING MATERIAL ALLOWABLES Suresh Keshavanarayana Department of Aerospace Engineering Statistical Analysis Program For Generating Material Allowables Motivation and
G07EAF NAG Fortran Library Routine Document
 G07EAF NAG Fortran Library Routine Document Note. Before using this routine, please read the Users Note for your implementation to check the interpretation of bold italicised terms and other implementation-dependent
Chapter 2 Organizing and Graphing Data. 2.1 Organizing and Graphing Qualitative Data
 Chapter 2 Organizing and Graphing Data 2.1 Organizing and Graphing Qualitative Data 2.2 Organizing and Graphing Quantitative Data 2.3 Stem-and-leaf Displays 2.4 Dotplots 2.1 Organizing and Graphing Qualitative
Many of the following steps can be saved as default so when a new project is created, the settings need not be re-entered.
 Carlson SurvNET The heart and sole of any survey software package is in its data processing and adjustment program. SurvNET is a least squares adjustment program that allows you to perform a mathematically
ORGANIZING THE DATA IN A FREQUENCY TABLE
 ORGANIZING THE DATA IN A FREQUENCY TABLE Suppose the scores obtained by 5 students on a standardized test are as follows: 68, 55, 61, 55, 43, 59, 55, 58, 77, 6, 56, 53, 58, 7, 57, 62, 5, 69, 44, 63, 48,79,
More Summer Program t-shirts
 ICPSR Blalock Lectures, 2003 Bootstrap Resampling Robert Stine Lecture 2 Exploring the Bootstrap Questions from Lecture 1 Review of ideas, notes from Lecture 1 - sample-to-sample variation - resampling
SAS/QC 14.2 User s Guide. The RELIABILITY Procedure
 SAS/QC 14.2 User s Guide The RELIABILITY Procedure This document is an individual chapter from SAS/QC 14.2 User s Guide. The correct bibliographic citation for this manual is as follows: SAS Institute
Elementary Statistics. Organizing Raw Data
 Organizing Raw Data What is a Raw Data? Raw Data (sometimes called source data) is data that has not been processed for meaningful use. What is a Frequency Distribution Table? A Frequency Distribution
Minitab Study Card J ENNIFER L EWIS P RIESTLEY, PH.D.
 Minitab Study Card J ENNIFER L EWIS P RIESTLEY, PH.D. Introduction to Minitab The interface for Minitab is very user-friendly, with a spreadsheet orientation. When you first launch Minitab, you will see
GLM II. Basic Modeling Strategy CAS Ratemaking and Product Management Seminar by Paul Bailey. March 10, 2015
 GLM II Basic Modeling Strategy 2015 CAS Ratemaking and Product Management Seminar by Paul Bailey March 10, 2015 Building predictive models is a multi-step process Set project goals and review background
100 Myung Hwan Na log-hazard function. The discussion section of Abrahamowicz, et al.(1992) contains a good review of many of the papers on the use of
 contains a good review of many of the papers on the use of") J. KSIAM Vol.3, No.2, 99-106, 1999 SPLINE HAZARD RATE ESTIMATION USING CENSORED DATA Myung Hwan Na Abstract In this paper, the spline hazard rate model to the randomly censored data is introduced. The
J. KSIAM Vol.3, No.2, 99-106, 1999 SPLINE HAZARD RATE ESTIMATION USING CENSORED DATA Myung Hwan Na Abstract In this paper, the spline hazard rate model to the randomly censored data is introduced. The
MODELING THE COMMUNICATIONS CAPABILITIES OF THE INFANTRY SOLDIER
 MODELING THE COMMUNICATIONS CAPABILITIES OF THE INFANTRY SOLDIER ANDREW HALL JOHN SURDU FERNANDO MAYMI ASHOK DEB KRISTIN FREBERG Keywords: Wearable computer systems, Land Warrior, personal area network,
Concerns about Least Squares Estimation for the Three-Parameter Weibull Distribution: Case Study of Statistical Software
 Otterbein University Digital Commons @ Otterbein Mathematics Faculty Scholarship Mathematical Sciences 8-10-2015 Concerns about Least Squares Estimation for the Three-Parameter Weibull Distribution: Case
APPENDIX. Appendix 2. HE Staining Examination Result: Distribution of of BALB/c
 APPENDIX Appendix 2. HE Staining Examination Result: Distribution of of BALB/c mice nucleus liver cells changes in percents between control group and intervention groups. Descriptives Groups Statistic
Data Analysis and Solver Plugins for KSpread USER S MANUAL. Tomasz Maliszewski
 Data Analysis and Solver Plugins for KSpread USER S MANUAL Tomasz Maliszewski tmaliszewski@wp.pl Table of Content CHAPTER 1: INTRODUCTION... 3 1.1. ABOUT DATA ANALYSIS PLUGIN... 3 1.3. ABOUT SOLVER PLUGIN...
CALCULATION OF OPERATIONAL LOSSES WITH NON- PARAMETRIC APPROACH: DERAILMENT LOSSES
 2. Uluslar arası Raylı Sistemler Mühendisliği Sempozyumu (ISERSE 13), 9-11 Ekim 2013, Karabük, Türkiye CALCULATION OF OPERATIONAL LOSSES WITH NON- PARAMETRIC APPROACH: DERAILMENT LOSSES Zübeyde Öztürk
Parametric. Practices. Patrick Cunningham. CAE Associates Inc. and ANSYS Inc. Proprietary 2012 CAE Associates Inc. and ANSYS Inc. All rights reserved.
 Parametric Modeling Best Practices Patrick Cunningham July, 2012 CAE Associates Inc. and ANSYS Inc. Proprietary 2012 CAE Associates Inc. and ANSYS Inc. All rights reserved. E-Learning Webinar Series This
Screening Design Selection
 Screening Design Selection Summary... 1 Data Input... 2 Analysis Summary... 5 Power Curve... 7 Calculations... 7 Summary The STATGRAPHICS experimental design section can create a wide variety of designs
CSE 417T: Introduction to Machine Learning. Lecture 6: Bias-Variance Trade-off. Henry Chai 09/13/18
 CSE 417T: Introduction to Machine Learning Lecture 6: Bias-Variance Trade-off Henry Chai 09/13/18 Let! ", $ = the maximum number of dichotomies on " points s.t. no subset of $ points is shattered Recall
Process capability analysis
 6 Process capability analysis In general, process capability indices have been quite controversial. (Ryan, 2000, p. 186) Overview Capability indices are widely used in assessing how well processes perform
Minitab 18 Feature List
 Minitab 18 Feature List * New or Improved Assistant Measurement systems analysis * Capability analysis Graphical analysis Hypothesis tests Regression DOE Control charts * Graphics Scatterplots, matrix
Six Sigma Special Topics: Z-Shifts, Statistics & Non-Standard Data Analysis
 General Electric Corporate Research & Development Six Sigma Special Topics: Z-Shifts, Statistics & Non-Standard Data Analysis 1999 QPRC Poster Session GE Corporate Research & Development Center Schenectady,
Part One of this article (1) introduced the concept
 introduced the concept") Establishing Acceptance Limits for Uniformity of Dosage Units: Part Two Pramote Cholayudth The concept of sampling distribution of acceptance value (AV) was introduced in Part One of this article series.
Establishing Acceptance Limits for Uniformity of Dosage Units: Part Two Pramote Cholayudth The concept of sampling distribution of acceptance value (AV) was introduced in Part One of this article series.
Student Version 8 AVERILL M. LAW & ASSOCIATES
 ExpertFit Student Version 8 AVERILL M. LAW & ASSOCIATES 4729 East Sunrise Drive, # 462 Tucson, AZ 85718 Phone: 520-795-6265 E-mail: averill@simulation.ws Website: www.averill-law.com 1. Introduction ExpertFit
R commander an Introduction
 R commander an Introduction Natasha A. Karp nk3@sanger.ac.uk May 2010 Preface This material is intended as an introductory guide to data analysis with R commander. It was produced as part of an applied
Chapter 6: Simulation Using Spread-Sheets (Excel)
") Chapter 6: Simulation Using Spread-Sheets (Excel) Refer to Reading Assignments 1 Simulation Using Spread-Sheets (Excel) OBJECTIVES To be able to Generate random numbers within a spreadsheet environment.
Chapter 6: Simulation Using Spread-Sheets (Excel) Refer to Reading Assignments 1 Simulation Using Spread-Sheets (Excel) OBJECTIVES To be able to Generate random numbers within a spreadsheet environment.
Overview. Background. Locating quantitative trait loci (QTL)
") Overview Implementation of robust methods for locating quantitative trait loci in R Introduction to QTL mapping Andreas Baierl and Andreas Futschik Institute of Statistics and Decision Support Systems
Overview Implementation of robust methods for locating quantitative trait loci in R Introduction to QTL mapping Andreas Baierl and Andreas Futschik Institute of Statistics and Decision Support Systems
Fitting Grating Data
 Fitting Grating Data Sherpa Fitting Grating Data Sherpa Threads (CIAO 3.4) Fitting Grating Data 1 Table of Contents Fitting Grating Data Sherpa Getting Started Reading the Spectrum Files Building the Instrument
Package TBSSurvival. July 1, 2012
 Package TBSSurvival July 1, 2012 Version 1.0 Date 2012-06-30 Title TBS Model R package Author Adriano Polpo , Cassio de Campos , D. Sinha , Stuart
Study 4.3 # Class Notes: Prof. G. Battaly, Westchester Community College, NY
 Goals: 1. Understand critical numbers and how to find them. 2. Understand the difference between relative extrema and absolute extrema. 3. Understand how critical numbers relate to the relative extrema
THE UNIVERSITY OF BRITISH COLUMBIA FORESTRY 430 and 533. Time: 50 minutes 40 Marks FRST Marks FRST 533 (extra questions)
") THE UNIVERSITY OF BRITISH COLUMBIA FORESTRY 430 and 533 MIDTERM EXAMINATION: October 14, 2005 Instructor: Val LeMay Time: 50 minutes 40 Marks FRST 430 50 Marks FRST 533 (extra questions) This examination
THE UNIVERSITY OF BRITISH COLUMBIA FORESTRY 430 and 533 MIDTERM EXAMINATION: October 14, 2005 Instructor: Val LeMay Time: 50 minutes 40 Marks FRST 430 50 Marks FRST 533 (extra questions) This examination
R Introduction 1. J.M. Ponciano. August 17, Objects in Splus language include, and. x<-list(ncolors=2,colors=c("red","blue"))
)") R Introduction 1 J.M. Ponciano August 17, 2007 1 Objects and types Location, definition of, and permanence of data Objects in Splus language include, and. Objects are created by assignment statements:
R Introduction 1 J.M. Ponciano August 17, 2007 1 Objects and types Location, definition of, and permanence of data Objects in Splus language include, and. Objects are created by assignment statements:
Mean Tests & X 2 Parametric vs Nonparametric Errors Selection of a Statistical Test SW242
 Mean Tests & X 2 Parametric vs Nonparametric Errors Selection of a Statistical Test SW242 Creation & Description of a Data Set * 4 Levels of Measurement * Nominal, ordinal, interval, ratio * Variable Types
Statgraphics Centurion Version 17 Enhancements
 Statgraphics Centurion Version 17 Enhancements Version 17 of Statgraphics Centurion contains many significant enhancements to the program. These enhancements include: 1. 32 new statistical procedures.
Kyle M. Tarplee 1, Ryan Friese 1, Anthony A. Maciejewski 1, H.J. Siegel 1,2. Department of Electrical and Computer Engineering 2
 Efficient and Scalable Computation of the Energy and Makespan Pareto Front for Heterogeneous Computing Systems Kyle M. Tarplee 1, Ryan Friese 1, Anthony A. Maciejewski 1, H.J. Siegel 1,2 1 Department of
PARAMETRIC MODEL SELECTION TECHNIQUES
 PARAMETRIC MODEL SELECTION TECHNIQUES GARY L. BECK, STEVE FROM, PH.D. Abstract. Many parametric statistical models are available for modelling lifetime data. Given a data set of lifetimes, which may or
Bootstrap Confidence Intervals for Regression Error Characteristic Curves Evaluating the Prediction Error of Software Cost Estimation Models
 Bootstrap Confidence Intervals for Regression Error Characteristic Curves Evaluating the Prediction Error of Software Cost Estimation Models Nikolaos Mittas, Lefteris Angelis Department of Informatics,
Chapter 1. Using the Cluster Analysis. Background Information
 Chapter 1 Using the Cluster Analysis Background Information Cluster analysis is the name of a multivariate technique used to identify similar characteristics in a group of observations. In cluster analysis,
Unit 3 Functions of Several Variables
 Unit 3 Functions of Several Variables In this unit, we consider several simple examples of multi-variable functions, quadratic surfaces and projections, level curves and surfaces, partial derivatives of
Simulation Models for Manufacturing Systems
 MFE4008 Manufacturing Systems Modelling and Control Models for Manufacturing Systems Dr Ing. Conrad Pace 1 Manufacturing System Models Models as any other model aim to achieve a platform for analysis and
Chapter 5 INSET Statement. Chapter Table of Contents
 Chapter 5 INSET Statement Chapter Table of Contents OVERVIEW...191 GETTING STARTED...192 DisplayingSummaryStatisticsonaHistogram...192 Formatting Values and Customizing Labels..... 193 AddingaHeaderandPositioningtheInset...194
SPSS. (Statistical Packages for the Social Sciences)
") Inger Persson SPSS (Statistical Packages for the Social Sciences) SHORT INSTRUCTIONS This presentation contains only relatively short instructions on how to perform basic statistical calculations in SPSS.
Inger Persson SPSS (Statistical Packages for the Social Sciences) SHORT INSTRUCTIONS This presentation contains only relatively short instructions on how to perform basic statistical calculations in SPSS.
Excel 2010 with XLSTAT
 Excel 2010 with XLSTAT J E N N I F E R LE W I S PR I E S T L E Y, PH.D. Introduction to Excel 2010 with XLSTAT The layout for Excel 2010 is slightly different from the layout for Excel 2007. However, with
Statistics Worksheet 1 - Solutions
 Statistics Worksheet 1 - Solutions Math& 146 Descriptive Statistics (Chapter 2) Data Set 1 We look at the following data set, describing hypothetical observations of voltage of as et of 9V batteries. The
arxiv: v1 [cs.dc] 8 May 2018
![arxiv: v1 [cs.dc] 8 May 2018](/thumbs/78/78708972.jpg "arxiv: v1 [cs.dc] 8 May 2018") Parallel Computation of PDFs on Big Spatial Data Using Spark Ji Liu 1, Noel Moreno Lemus 2, Esther Pacitti 1, Fabio Porto 2, and Patrick Valduriez 1 1 Inria and LIRMM, Univ. of Montpelier, France 2 LNCC
Parallel Computation of PDFs on Big Spatial Data Using Spark Ji Liu 1, Noel Moreno Lemus 2, Esther Pacitti 1, Fabio Porto 2, and Patrick Valduriez 1 1 Inria and LIRMM, Univ. of Montpelier, France 2 LNCC
Set up of the data is similar to the Randomized Block Design situation. A. Chang 1. 1) Setting up the data sheet
 Setting up the data sheet") Repeated Measure Analysis (Univariate Mixed Effect Model Approach) (Treatment as the Fixed Effect and the Subject as the Random Effect) (This univariate approach can be used for randomized block design
Repeated Measure Analysis (Univariate Mixed Effect Model Approach) (Treatment as the Fixed Effect and the Subject as the Random Effect) (This univariate approach can be used for randomized block design
Advanced Operations Research Techniques IE316. Quiz 1 Review. Dr. Ted Ralphs
 Advanced Operations Research Techniques IE316 Quiz 1 Review Dr. Ted Ralphs IE316 Quiz 1 Review 1 Reading for The Quiz Material covered in detail in lecture. 1.1, 1.4, 2.1-2.6, 3.1-3.3, 3.5 Background material
Eksamen ERN4110, 6/ VEDLEGG SPSS utskrifter til oppgavene (Av plasshensyn kan utskriftene være noe redigert)
") Eksamen ERN4110, 6/9-2018 VEDLEGG SPSS utskrifter til oppgavene (Av plasshensyn kan utskriftene være noe redigert) 1 Oppgave 1 Datafila I SPSS: Variabelnavn Beskrivelse Kjønn Kjønn (1=Kvinne, 2=Mann) Studieinteresse
Eksamen ERN4110, 6/9-2018 VEDLEGG SPSS utskrifter til oppgavene (Av plasshensyn kan utskriftene være noe redigert) 1 Oppgave 1 Datafila I SPSS: Variabelnavn Beskrivelse Kjønn Kjønn (1=Kvinne, 2=Mann) Studieinteresse
Nonparametric Estimation of Distribution Function using Bezier Curve
 Communications for Statistical Applications and Methods 2014, Vol. 21, No. 1, 105 114 DOI: http://dx.doi.org/10.5351/csam.2014.21.1.105 ISSN 2287-7843 Nonparametric Estimation of Distribution Function
Uncertainty Analysis User's Manual
 Uncertainty Analysis User's Manual Symbolic Nuclear Analysis Package (SNAP) Version 1.2.2 - October 25 2012 Applied Programming Technology, Inc. 240 Market St., Suite 208 Bloomsburg PA 17815-1951 DAKOTA
Binary Search and Worst-Case Analysis
 Department of Computer Science and Engineering Chinese University of Hong Kong A significant part of computer science is devoted to understanding the power of the RAM model in solving specific problems.
Quantitative - One Population
 Quantitative - One Population The Quantitative One Population VISA procedures allow the user to perform descriptive and inferential procedures for problems involving one population with quantitative (interval)