MATLAB Examples. Interpolation and Curve Fitting. Hans-Petter Halvorsen
|
|
|
- Gordon Dawson
- 6 years ago
- Views:
Transcription
1 MATLAB Examples Interpolation and Curve Fitting Hans-Petter Halvorsen
2 Interpolation Interpolation is used to estimate data points between two known points. The most common interpolation technique is Linear Interpolation. Known points???
3 Interpolation Interpolation is used to estimate data points between two known points. The most common interpolation technique is Linear Interpolation. In MATLAB we can use the interp1() function. The default is linear interpolation, but there are other types available, such as: linear nearest spline cubic etc. Type help interp1 in order to read more about the different options.


4 Given the following Data Points: Interpolation x y (Logged Data from a given Process) x=0:5; y=[15, 10, 9, 6, 2, 0];? plot(x,y,'o') grid Problem: Assume we want to find the interpolated value for, e.g., x = 3.5
![x=0:5; y=[15, 10, 9, 6, 2, 0]; plot(x,y,'-o') grid on new_x=3.](/docs-images/76/74002822/images/5-1.jpg "5; new_y = interp1(x,y,new_x) Interpolation We can use one of")

5 x=0:5; y=[15, 10, 9, 6, 2, 0]; plot(x,y,'-o') grid on new_x=3.5; new_y = interp1(x,y,new_x) Interpolation We can use one of the built-in Interpolation functions in MATLAB: new_y = 4 MATLAB gives us the answer 4. From the plot we see this is a good guess:
6 Interpolation Given the following data: Temperature, T [ o C] Energy, u [KJ/kg] Plot u versus T. Find the interpolated data and plot it in the same graph. Test out different interpolation types (spline, cubic). What is the interpolated value for u= KJ/kg?
![clear clc T = [100, 150, 200, 250, 300, 400, 500]; u=[2506.7, 2582.8, 2658.1, 2733.](/docs-images/76/74002822/images/7-1.jpg "7, 2810.4, 2967.9, 3131.")
![6]; figure(1) plot(u,t, '-o') % Find interpolated value for u=2680.78 new_u=2680.](/docs-images/76/74002822/images/7-2.jpg "78; interp1(u, T, new_u) %Spline new_u = linspace(2500,3200,length(u)); new_t =")
7 clear clc T = [100, 150, 200, 250, 300, 400, 500]; u=[2506.7, , , , , , ]; figure(1) plot(u,t, '-o') % Find interpolated value for u= new_u= ; interp1(u, T, new_u) %Spline new_u = linspace(2500,3200,length(u)); new_t = interp1(u, T, new_u, 'spline'); figure(2) plot(u,t, new_u, new_t, '-o')

![400, 500]; u=[2506.](/docs-images/76/74002822/images/8-1.jpg "7, 2582.8, 2658.")

![6]; figure(1)](/docs-images/76/74002822/images/8-4.jpg "plot(u,t, 'o') or:")
8 T = [100, 150, 200, 250, 300, 400, 500]; u=[2506.7, , , , , , ]; figure(1) plot(u,t, 'o') or: plot(u,t, '-o')
 The interpolated value for u=2680.")
);")
 For spline / cubic we get almost the same.")
9 % Find interpolated value for u= new_u= ; interp1(u, T, new_u) The interpolated value for u= KJ/kg is: ans = i.e, for u = we get T = 215 %Spline new_u = linspace(2500,3200,length(u)); new_t = interp1(u, T, new_u, 'spline'); figure(2) plot(u,t, new_u, new_t, '-o') For spline / cubic we get almost the same. This is because the points listed above are quite linear in their nature.
10
11 Curve Fitting In the previous section we found interpolated points, i.e., we found values between the measured points using the interpolation technique. It would be more convenient to model the data as a mathematical function y = f(x). Then we can easily calculate any data we want based on this model. Data Mathematical Model
12 Curve Fitting MATLAB has built-in curve fitting functions that allows us to create empiric data model. It is important to have in mind that these models are good only in the region we have collected data. Here are some of the functions available in MATLAB used for curve fitting: - polyfit() - polyval() These techniques use a polynomial of degree N that fits the data Y best in a least-squares sense.
13 Regression Models Linear Regression: y(x) = ax + b Polynomial Regression: y x = a 5 x 6 + a 7 x a 687 x + a 6 1.order (linear): y(x) = ax + b 2.order: etc. y x = ax ; + bx + c
14 Given the following data: Linear Regression Temperature, T [ o C] Energy, u [KJ/kg] Plot u versus T. Find the linear regression model from the data y = ax + b Plot it in the same graph.
![T = [100, 150, 200, 250, 300, 400, 500]; u=[2506.7, 2582.8, 2658.1, 2733.7, 2810.4, 2967.9, 3131.6]; n=1; % 1.](/docs-images/76/74002822/images/15-2.jpg "order polynomial(linear regression) p=polyfit(u,t,n); a=p(1) b=p(2) x=u; ymodel=a*x+b; plot(u,t,'o',u,ymodel) a = 0.6415 y 0.64x 1.5 A 10 B b = -1.")
15 T = [100, 150, 200, 250, 300, 400, 500]; u=[2506.7, , , , , , ]; n=1; % 1.order polynomial(linear regression) p=polyfit(u,t,n); a=p(1) b=p(2) x=u; ymodel=a*x+b; plot(u,t,'o',u,ymodel) a = y 0.64x 1.5 A 10 B b = e+003 i.e, we get a polynomial p = [0.6, 1.5 A 10 B ]
16
17 Given the following data: Polynomial Regression x y In polynomial regression we will find the following model: y x = a 5 x 6 + a 7 x a 687 x + a 6 We will use the polyfit and polyval functions in MATLAB and compare the models using different orders of the polynomial. We will use subplots then add titles, etc.
![clear, clc x=[10, 20, 30, 40, 50, 60, 70, 80, 90, 100];](/docs-images/76/74002822/images/18-2.jpg "y=[23, 45, 60, 82, 111, 140, 167, 198, 200, 220]; for n=2:5")
 title(sprintf('model of order %d',")
18 clear, clc x=[10, 20, 30, 40, 50, 60, 70, 80, 90, 100]; y=[23, 45, 60, 82, 111, 140, 167, 198, 200, 220]; for n=2:5 p=polyfit(x,y,n); ymodel=polyval(p,x); end subplot(2,2,n-1) plot(x,y,'o',x,ymodel) title(sprintf('model of order %d', n));
19
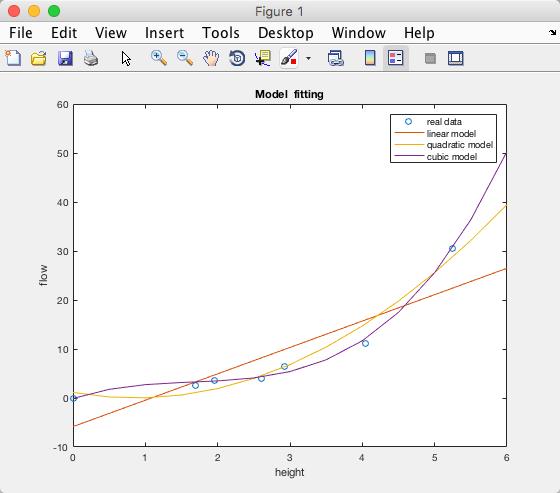
20 Model Fitting Given the following data: Height, h[ft] Flow, f[ft^3/s] We will create a 1. (linear), 2. (quadratic) and 3.order (cubic) model. Which gives the best model? We will plot the result in the same plot and compare them. We will add xlabel, ylabel, title and a legend to the plot and use different line styles so the user can easily see the difference.
![clear, clc % Real Data height = [0, 1.7, 1.95, 2.60, 2.92, 4.04, 5.24]; flow = [0, 2.6, 3.6, 4.03, 6.45, 11.22, 30.61]; new_height = 0:0.](/docs-images/76/74002822/images/21-2.jpg "5:6; % generating new height values used to test the model %linear------------------------- polyorder = 1; %linear p1 = polyfit(height, flow, polyorder) % 1.")
21 clear, clc % Real Data height = [0, 1.7, 1.95, 2.60, 2.92, 4.04, 5.24]; flow = [0, 2.6, 3.6, 4.03, 6.45, 11.22, 30.61]; new_height = 0:0.5:6; % generating new height values used to test the model %linear polyorder = 1; %linear p1 = polyfit(height, flow, polyorder) % 1.order model new_flow1 = polyval(p1,new_height); % We use the model to find new flow values %quadratic polyorder = 2; %quadratic p2 = polyfit(height, flow, polyorder) % 2.order model new_flow2 = polyval(p2,new_height); % We use the model to find new flow values %cubic polyorder = 3; %cubic p3 = polyfit(height, flow, polyorder) % 3.order model new_flow3 = polyval(p3,new_height); % We use the model to find new flow values %Plotting %We plot the original data together with the model found for comparison plot(height, flow, 'o', new_height, new_flow1, new_height, new_flow2, new_height, new_flow3) title('model fitting') xlabel('height') ylabel('flow') legend('real data', 'linear model', 'quadratic model', 'cubic model')
22 The result becomes: p1 = p2 = p3 = Where p1 is the linear model (1.order), p2 is the quadratic model (2.order) and p3 is the cubic model (3.order). This gives: 1. order model: 2. order model: 3. order model: p 7 = a 5 x + a 7 = 5.4x 5.8 p ; = a 5 x ; + a 7 x + a ; = 1.5x ; 2.6x p B = a 5 x B + a 7 x ; + a ; x + a B = 0.5x B 2.7x ; + 4.9x 0.1
23

24

25 Hans-Petter Halvorsen, M.Sc. University College of Southeast Norway Blog:
Introduction to MATLAB
 Quick Start Tutorial Introduction to MATLAB Hans-Petter Halvorsen, M.Sc. What is MATLAB? MATLAB is a tool for technical computing, computation and visualization in an integrated environment. MATLAB is
MATLAB Examples. Simulink. Hans-Petter Halvorsen, M.Sc.
 MATLAB Examples Simulink Hans-Petter Halvorsen, M.Sc. What is Simulink? Simulink is an add-on to MATLAB. You need to have MATLAB in order to use Simulink Simulink is used for Simulation of dynamic models
LabVIEW MathScript Quick Reference
 Telemark University College Department of Electrical Engineering, Information Technology and Cybernetics LabVIEW MathScript Quick Reference Hans-Petter Halvorsen, 2012.06.14 Faculty of Technology, Postboks
MATLAB Examples. Flow Control and Loops. Hans-Petter Halvorsen, M.Sc.
 MATLAB Examples Flow Control and Loops Hans-Petter Halvorsen, M.Sc. Flow Control and Loops in MATLAB Flow Control: if-elseif-else statement switch-case-otherwise statement Loops: for Loop while Loop The
Simulation in LabVIEW. Hans-Petter Halvorsen, M.Sc.
 Simulation in LabVIEW Hans-Petter Halvorsen, M.Sc. Software LabVIEW LabVIEW Control Design and Simulation Module This module is used for creating Control and Simulation applications with LabVIEW. Here
STIPlotDigitizer. User s Manual
 STIPlotDigitizer User s Manual Table of Contents What is STIPlotDigitizer?... 3 Installation Guide... 3 Initializing STIPlotDigitizer... 4 Project GroupBox... 4 Import Image GroupBox... 5 Exit Button...
Introduction to ERwin
 Introduction to ERwin Database Design & Modelling Hans-Petter Halvorsen, M.Sc. Software The following Editions can be downloaded for Free on Internet: CA ERwin Data Modeler Community Edition SQL Server
Matlab Tutorial 1: Working with variables, arrays, and plotting
 Matlab Tutorial 1: Working with variables, arrays, and plotting Setting up Matlab First of all, let's make sure we all have the same layout of the different windows in Matlab. Go to Home Layout Default.
QUADRATIC AND CUBIC GRAPHS
 NAME SCHOOL INDEX NUMBER DATE QUADRATIC AND CUBIC GRAPHS KCSE 1989 2012 Form 3 Mathematics Working Space 1. 1989 Q22 P1 (a) Using the grid provided below draw the graph of y = -2x 2 + x + 8 for values
MATLAB Modul 3. Introduction
 MATLAB Modul 3 Introduction to Computational Science: Modeling and Simulation for the Sciences, 2 nd Edition Angela B. Shiflet and George W. Shiflet Wofford College 2014 by Princeton University Press Introduction
Telemark University College Department of Electrical Engineering, Information Technology and Cybernetics. MathScript
 Telemark University College Department of Electrical Engineering, Information Technology and Cybernetics Solutions So You Think You Can HANS-PETTER HALVORSEN, 2011.09.07 MathScript Part I: Introduction
MATH 51: MATLAB HOMEWORK 3
 MATH 5: MATLAB HOMEWORK Experimental data generally suffers from imprecision, though frequently one can predict how data should behave by graphing results collected from experiments. For instance, suppose
Virtual Instruments with LabVIEW
 Telemark University College Department of Electrical Engineering, Information Technology and Cybernetics Virtual Instruments with LabVIEW HANS-PETTER HALVORSEN, 2011.01.04 Faculty of Technology, Postboks
INC151 Electrical Engineering Software Practice. MATLAB Graphics. Dr.Wanchak Lenwari :Control System and Instrumentation Engineering, KMUTT 1
 INC151 Electrical Engineering Software Practice MATLAB Graphics Dr.Wanchak Lenwari :Control System and Instrumentation Engineering, KMUTT 1 Graphical display is one of MATLAB s greatest strengths and most
Lecture 8. Divided Differences,Least-Squares Approximations. Ceng375 Numerical Computations at December 9, 2010
 Lecture 8, Ceng375 Numerical Computations at December 9, 2010 Computer Engineering Department Çankaya University 8.1 Contents 1 2 3 8.2 : These provide a more efficient way to construct an interpolating
University College of Southeast Norway. LM-900 Level Tank. Hans-Petter Halvorsen,
 University College of Southeast Norway LM-900 Level Tank Hans-Petter Halvorsen, 2016.10.26 http://home.hit.no/~hansha Table of Contents Table of Contents... ii 1 Introduction... 1 2 System Description...
Solutions. Discretization HANS-PETTER HALVORSEN,
 Telemark University College Department of Electrical Engineering, Information Technology and Cybernetics Solutions HANS-PETTER HALVORSEN, 2011.08.12 Discretization Faculty of Technology, Postboks 203,
Visual Studio Team Services
 Visual Studio Team Services Getting Started Hans-Petter Halvorsen, M.Sc. Visual Studio Team Services Visual Studio Team Services is a platform taking care of all aspects of the process of developing software
Introduction to Simulink
 University College of Southeast Norway Introduction to Simulink Hans-Petter Halvorsen, 2016.11.01 http://home.hit.no/~hansha Preface Simulink, developed by The MathWorks, is a commercial tool for modeling,
Using SQL Server in C#
 University College of Southeast Norway Using SQL Server in C# Hans-Petter Halvorsen, 2016.11.01 with Examples http://home.hit.no/~hansha Table of Contents 1. Introduction...
Multiple-Choice Test Spline Method Interpolation COMPLETE SOLUTION SET
 Multiple-Choice Test Spline Method Interpolation COMPLETE SOLUTION SET 1. The ollowing n data points, ( x ), ( x ),.. ( x, ) 1, y 1, y n y n quadratic spline interpolation the x-data needs to be (A) equally
Introduction to Matlab
 Technische Universität München WT 21/11 Institut für Informatik Prof Dr H-J Bungartz Dipl-Tech Math S Schraufstetter Benjamin Peherstorfer, MSc October 22nd, 21 Introduction to Matlab Engineering Informatics
Fitting to a set of data. Lecture on fitting
 Fitting to a set of data Lecture on fitting Linear regression Linear regression Residual is the amount difference between a real data point and a modeled data point Fitting a polynomial to data Could use
Dr. Iyad Jafar. Adapted from the publisher slides
 Computer Applications Lab Lab 6 Plotting Chapter 5 Sections 1,2,3,8 Dr. Iyad Jafar Adapted from the publisher slides Outline xy Plotting Functions Subplots Special Plot Types Three-Dimensional Plotting
AMS 27L LAB #2 Winter 2009
 AMS 27L LAB #2 Winter 2009 Plots and Matrix Algebra in MATLAB Objectives: 1. To practice basic display methods 2. To learn how to program loops 3. To learn how to write m-files 1 Vectors Matlab handles
Unit Testing. Quiz with Explainations. Hans-Petter Halvorsen, M.Sc.
 Unit Testing Quiz with Explainations Hans-Petter Halvorsen, M.Sc. Questions 1. What is Unit Testing? 2. List some Unit Test Framework 3. Who is creating the Unit Tests? 4. What kind of Requirements does
Introduction to Matlab
 Introduction to Matlab Enrique Muñoz Ballester Dipartimento di Informatica via Bramante 65, 26013 Crema (CR), Italy enrique.munoz@unimi.it Contact Email: enrique.munoz@unimi.it Office: Room BT-43 Industrial,
Core Mathematics 1 Transformations of Graphs
 Regent College Maths Department Core Mathematics 1 Transformations of Graphs Transformations of Graphs September 2011 C1 Note Knowledge of the effect of simple transformations on the graph of y f( x)
Contents. Implementing the QR factorization The algebraic eigenvalue problem. Applied Linear Algebra in Geoscience Using MATLAB
 Applied Linear Algebra in Geoscience Using MATLAB Contents Getting Started Creating Arrays Mathematical Operations with Arrays Using Script Files and Managing Data Two-Dimensional Plots Programming in
Create a Virtual Test Environment
 Create a Virtual Test Environment Step by Step Exercises Hans-Petter Halvorsen, M.Sc. Why Do We Need a Test Environment? Why cant we just use our own PC? Why Test Environment? It works on my PC says the
Warm-Up Exercises. Find the x-intercept and y-intercept 1. 3x 5y = 15 ANSWER 5; y = 2x + 7 ANSWER ; 7
 Warm-Up Exercises Find the x-intercept and y-intercept 1. 3x 5y = 15 ANSWER 5; 3 2. y = 2x + 7 7 2 ANSWER ; 7 Chapter 1.1 Graph Quadratic Functions in Standard Form A quadratic function is a function that
ChBE 354 Useful MATLAB Functions
 ChBE 354 Useful MATLAB Functions Assignment Statements a = 10 Stores 10 in a a = solve Hf HxL - f HzL, zl solves the equation for z and stores it in a a = single H143 ê 91L returns a single precision decimal
Curve Fitting the Calibration Data of a Thermistor Voltage Divider
 Curve Fitting the Calibration Data of a Thermistor Voltage Divider Gerald Recktenwald Portland State University Department of Mechanical Engineering gerry@me.pdx.edu March 5, 213 EAS 199B: Engineering
Computer Programming in MATLAB
 Computer Programming in MATLAB Prof. Dr. İrfan KAYMAZ Engineering Faculty Department of Mechanical Engineering Arrays in MATLAB; Vectors and Matrices Graphing Vector Generation Before graphing plots in
User-Defined Function
 ENGR 102-213 (Socolofsky) Week 11 Python scripts In the lecture this week, we are continuing to learn powerful things that can be done with userdefined functions. In several of the examples, we consider
Polynomial and Rational Functions. Copyright Cengage Learning. All rights reserved.
 2 Polynomial and Rational Functions Copyright Cengage Learning. All rights reserved. 2.1 Quadratic Functions Copyright Cengage Learning. All rights reserved. What You Should Learn Analyze graphs of quadratic
MATLAB Laboratory 09/23/10 Lecture. Chapters 5 and 9: Plotting
 MATLAB Laboratory 09/23/10 Lecture Chapters 5 and 9: Plotting Lisa A. Oberbroeckling Loyola University Maryland loberbroeckling@loyola.edu L. Oberbroeckling (Loyola University) MATLAB 09/23/10 Lecture
Polymath 6. Overview
 Polymath 6 Overview Main Polymath Menu LEQ: Linear Equations Solver. Enter (in matrix form) and solve a new system of simultaneous linear equations. NLE: Nonlinear Equations Solver. Enter and solve a new
Wireless DAQ using ZigBee
 Høgskolen i Telemark Telemark University College Department of Electrical Engineering, Information Technology and Cybernetics Wireless DAQ using ZigBee Cuong Nguyen, Hans- Petter Halvorsen 2013.10.29 Hardware
Homework #6 Brief Solutions 2012
 Homework #6 Brief Solutions %page 95 problem 4 data=[-,;-,;,;4,] data = - - 4 xk=data(:,);yk=data(:,);s=csfit(xk,yk,-,) %Using the program to find the coefficients S =.456 -.456 -.. -.5.9 -.5484. -.58.87.
Mechanical Engineering Department Second Year (2015)
") Lecture 7: Graphs Basic Plotting MATLAB has extensive facilities for displaying vectors and matrices as graphs, as well as annotating and printing these graphs. This section describes a few of the most
Lecture 7: Graphs Basic Plotting MATLAB has extensive facilities for displaying vectors and matrices as graphs, as well as annotating and printing these graphs. This section describes a few of the most
Software Architecture
 Software Architecture Quiz with Explainations Hans-Petter Halvorsen, M.Sc. Questions 1. Explain 3-layer Architecture 2. What is a Web Service? 3. What is SOA? 4. What is an API? 5. What is Client-Server
Prof. Manoochehr Shirzaei. RaTlab.asu.edu
 RaTlab.asu.edu Introduction To MATLAB Introduction To MATLAB This lecture is an introduction of the basic MATLAB commands. We learn; Functions Procedures for naming and saving the user generated files
University College of Southeast Norway. Web Services. with Examples. Hans-Petter Halvorsen,
 University College of Southeast Norway Web Services Hans-Petter Halvorsen, 2016.11.01 with Examples http://home.hit.no/~hansha Table of Contents 1. Introduction... 4 1.1. The Problem... 4 1.2. The Solution...
5.1 Introduction to the Graphs of Polynomials
 Math 3201 5.1 Introduction to the Graphs of Polynomials In Math 1201/2201, we examined three types of polynomial functions: Constant Function - horizontal line such as y = 2 Linear Function - sloped line,
Linear, Quadratic, Exponential, and Absolute Value Functions
 Linear, Quadratic, Exponential, and Absolute Value Functions Linear Quadratic Exponential Absolute Value Y = mx + b y = ax 2 + bx + c y = a b x y = x 1 What type of graph am I? 2 What can you tell me about
Sketching graphs of polynomials
 Sketching graphs of polynomials We want to draw the graphs of polynomial functions y = f(x). The degree of a polynomial in one variable x is the highest power of x that remains after terms have been collected.
Introduction to Matlab to Accompany Linear Algebra. Douglas Hundley Department of Mathematics and Statistics Whitman College
 Introduction to Matlab to Accompany Linear Algebra Douglas Hundley Department of Mathematics and Statistics Whitman College August 27, 2018 2 Contents 1 Getting Started 5 1.1 Before We Begin........................................
Examples, examples: Outline
 Examples, examples: Outline Overview of todays exercises Basic scripting Importing data Working with temporal data Working with missing data Interpolation in 1D Some time series analysis Linear regression
PERI INSTITUTE OF TECHNOLOGY DEPARTMENT OF ECE TWO DAYS NATIONAL LEVEL WORKSHOP ON COMMUNICATIONS & IMAGE PROCESSING "CIPM 2017" Matlab Fun - 2
 Table of Contents PERI INSTITUTE OF TECHNOLOGY DEPARTMENT OF ECE TWO DAYS NATIONAL LEVEL WORKSHOP ON COMMUNICATIONS & IMAGE PROCESSING "CIPM 2017" - 2 What? Matlab can be fun... 1 Plot the Sine Function...
Data Acquisition HANS-PETTER HALVORSEN,
 Telemark University College Department of Electrical Engineering, Information Technology and Cybernetics Data Acquisition HANS-PETTER HALVORSEN, 2011.10.14 Faculty of Technology, Postboks 203, Kjølnes
Plotting x-y (2D) and x, y, z (3D) graphs
 and x, y, z (3D) graphs") Tutorial : 5 Date : 9/08/2016 Plotting x-y (2D) and x, y, z (3D) graphs Aim To learn to produce simple 2-Dimensional x-y and 3-Dimensional (x, y, z) graphs using SCILAB. Exercises: 1. Generate a 2D plot
Tutorial : 5 Date : 9/08/2016 Plotting x-y (2D) and x, y, z (3D) graphs Aim To learn to produce simple 2-Dimensional x-y and 3-Dimensional (x, y, z) graphs using SCILAB. Exercises: 1. Generate a 2D plot
Friday, 11 January 13. Interpolation
 Interpolation Interpolation Interpolation is not a branch of mathematic but a collection of techniques useful for solving computer graphics problems Basically an interpolant is a way of changing one number
Numerical Methods 5633
 Numerical Methods 5633 Lecture 3 Marina Krstic Marinkovic mmarina@maths.tcd.ie School of Mathematics Trinity College Dublin Marina Krstic Marinkovic 1 / 15 5633-Numerical Methods Organisational Assignment
Introduction to MATLAB: Graphics
 Introduction to MATLAB: Graphics Eduardo Rossi University of Pavia erossi@eco.unipv.it September 2014 Rossi Introduction to MATLAB Financial Econometrics - 2014 1 / 14 2-D Plot The command plot provides
Cubic Splines By Dave Slomer
 Cubic Splines By Dave Slomer [Note: Before starting any example or exercise below, press g on the home screen to Clear a-z.] Curve fitting, the process of finding a function that passes through (or near)
Datalogging in LabVIEW
 Telemark University College Department of Electrical Engineering, Information Technology and Cybernetics Datalogging in LabVIEW HANS-PETTER HALVORSEN, 2011.01.04 Faculty of Technology, Postboks 203, Kjølnes
Database Views & Stored Procedures. Hans-Petter Halvorsen, M.Sc.
 Database Views & Stored Procedures Hans-Petter Halvorsen, M.Sc. SQL Server Hans-Petter Halvorsen, M.Sc. Microsoft SQL Server 3 1 2 Your SQL Server Your Tables Your Database 4 Write your Query here 5 The
UML. Quiz with Explainations. Hans-Petter Halvorsen, M.Sc.
 UML Quiz with Explainations Hans-Petter Halvorsen, M.Sc. Questions 1. What is UML? 2. What is an ER diagram? 3. Give example of some types of UML diagrams (in total we have 14 different types) 4. Give
PowerPoints organized by Dr. Michael R. Gustafson II, Duke University
 Part 1 Chapter 2 MATLAB Fundamentals PowerPoints organized by Dr. Michael R. Gustafson II, Duke University All images copyright The McGraw-Hill Companies, Inc. Permission required for reproduction or display.
Assignment 2. with (a) (10 pts) naive Gauss elimination, (b) (10 pts) Gauss with partial pivoting
 (10 pts) naive Gauss elimination, (b) (10 pts) Gauss with partial pivoting") Assignment (Be sure to observe the rules about handing in homework). Solve: with (a) ( pts) naive Gauss elimination, (b) ( pts) Gauss with partial pivoting *You need to show all of the steps manually.
Assignment (Be sure to observe the rules about handing in homework). Solve: with (a) ( pts) naive Gauss elimination, (b) ( pts) Gauss with partial pivoting *You need to show all of the steps manually.
UNIT 3 EXPRESSIONS AND EQUATIONS Lesson 3: Creating Quadratic Equations in Two or More Variables
 Guided Practice Example 1 Find the y-intercept and vertex of the function f(x) = 2x 2 + x + 3. Determine whether the vertex is a minimum or maximum point on the graph. 1. Determine the y-intercept. The
Lab 6: Graphical Methods
 Lab 6: Graphical Methods 6.1 Introduction EGR 53L - Fall 2009 Lab this week is going to introduce graphical solution and presentation techniques as well as surface plots. 6.2 Resources The additional resources
Team Assignment. Final Software Delivery. IA4412 Software Engineering
 IA4412 Software Engineering Team Assignment Final Software Delivery B. Lund. Lunch. Available: http://www.lunchstriper.no, http://www.dagbladet.no/tegneserie/lunch/ Hans-Petter Halvorsen, M.Sc. Level of
A Brief Introduction to MATLAB
 A Brief Introduction to MATLAB MATLAB (Matrix Laboratory) is an interactive software system for numerical computations and graphics. As the name suggests, MATLAB was first designed for matrix computations:
Computing Fundamentals Plotting
 Computing Fundamentals Plotting Salvatore Filippone salvatore.filippone@uniroma2.it 2014 2015 (salvatore.filippone@uniroma2.it) Plotting 2014 2015 1 / 14 Plot function The basic function to plot something
What is MATLAB? It is a high-level programming language. for numerical computations for symbolic computations for scientific visualizations
 What is MATLAB? It stands for MATrix LABoratory It is developed by The Mathworks, Inc (http://www.mathworks.com) It is an interactive, integrated, environment for numerical computations for symbolic computations
Introduction to Matlab
 Introduction to Matlab The purpose of this intro is to show some of Matlab s basic capabilities. Nir Gavish, 2.07 Contents Getting help Matlab development enviroment Variable definitions Mathematical operations
Software Implementation
 Software Implementation Quiz with Explainations Hans-Petter Halvorsen, M.Sc. Questions 1. List 10 different Programming Languages 2. What is an IDE? - Give some Examples 3. What is.net? 4. What is ASP.NET?
Armstrong Atlantic State University Engineering Studies MATLAB Marina 2D Plotting Primer
 Armstrong Atlantic State University Engineering Studies MATLAB Marina D Plotting Primer Prerequisites The D Plotting Primer assumes knowledge of the MATLAB IDE, MATLAB help, arithmetic operations, built
Student Exploration: Quadratics in Polynomial Form
 Name: Date: Student Exploration: Quadratics in Polynomial Form Vocabulary: axis of symmetry, parabola, quadratic function, vertex of a parabola Prior Knowledge Questions (Do these BEFORE using the Gizmo.)
Introduction to MATLAB
 58:110 Computer-Aided Engineering Spring 2005 Introduction to MATLAB Department of Mechanical and industrial engineering January 2005 Topics Introduction Running MATLAB and MATLAB Environment Getting help
Getting Started with MATLAB
 Getting Started with MATLAB Math 315, Fall 2003 Matlab is an interactive system for numerical computations. It is widely used in universities and industry, and has many advantages over languages such as
Fitting data with Matlab
 Fitting data with Matlab 1. Generate a delimited text file (from LabVIEW, a text editor, Excel, or another spreadsheet application) with the x values (time) in the first column and the y values (temperature)
Properties of Quadratic functions
 Name Today s Learning Goals: #1 How do we determine the axis of symmetry and vertex of a quadratic function? Properties of Quadratic functions Date 5-1 Properties of a Quadratic Function A quadratic equation
Plotting - Practice session
 Plotting - Practice session Alessandro Fanfarillo - Salvatore Filippone fanfarillo@ing.uniroma2.it May 28th, 2013 (fanfarillo@ing.uniroma2.it) Plotting May 28th, 2013 1 / 14 Plot function The basic function
Fine Guidance Sensor Instrument Report DATA SMOOTHING AND DOUBLE STAR DATA REDUCTION IN THE TRANSFER FUNCTION MODE DATA REDUCTION PACKAGE
 Fine Guidance Sensor Instrument Report DATA SMOOTHING AND DOUBLE STAR DATA REDUCTION IN THE TRANSFER FUNCTION MODE DATA REDUCTION PACKAGE S. T. Holfeltz, B. Bucciarelli, M. G. Lattanzi, and L. G. Ta I.
Learning from Data Linear Parameter Models
 Learning from Data Linear Parameter Models Copyright David Barber 200-2004. Course lecturer: Amos Storkey a.storkey@ed.ac.uk Course page : http://www.anc.ed.ac.uk/ amos/lfd/ 2 chirps per sec 26 24 22 20
State Estimation with Observers
 Telemark University College Department of Electrical Engineering, Information Technology and Cybernetics State Estimation with Observers HANS-PETTER HALVORSEN, 2012.08.20 Faculty of Technology, Postboks
Inlichtingenblad, matlab- en simulink handleiding en practicumopgaven IWS
 Inlichtingenblad, matlab- en simulink handleiding en practicumopgaven IWS 1 6 3 Matlab 3.1 Fundamentals Matlab. The name Matlab stands for matrix laboratory. Main principle. Matlab works with rectangular
Getting Started. Chapter 1. How to Get Matlab. 1.1 Before We Begin Matlab to Accompany Lay s Linear Algebra Text
 Chapter 1 Getting Started How to Get Matlab Matlab physically resides on each of the computers in the Olin Hall labs. See your instructor if you need an account on these machines. If you are going to go
MATLAB Fundamentals. Berlin Chen Department of Computer Science & Information Engineering National Taiwan Normal University
 MATLAB Fundamentals Berlin Chen Department of Computer Science & Information Engineering National Taiwan Normal University Reference: 1. Applied Numerical Methods with MATLAB for Engineers, Chapter 2 &
Chapter 2. MATLAB Fundamentals
 Chapter 2. MATLAB Fundamentals Choi Hae Jin Chapter Objectives q Learning how real and complex numbers are assigned to variables. q Learning how vectors and matrices are assigned values using simple assignment,
GRAPHICS AND VISUALISATION WITH MATLAB
 GRAPHICS AND VISUALISATION WITH MATLAB UNIVERSITY OF SHEFFIELD CiCS DEPARTMENT Des Ryan & Mike Griffiths September 2017 Topics 2D Graphics 3D Graphics Displaying Bit-Mapped Images Graphics with Matlab
Mid-Chapter Quiz: Lessons 2-1 through 2-3
 Graph and analyze each function. Describe its domain, range, intercepts, end behavior, continuity, and where the function is increasing or decreasing. 1. f (x) = 2x 3 2 16 1.5 6.75 1 2 0 0 1 2 1.5 6.75
Midterm Exam with solutions
 Midterm Exam with solutions CS227-Introduction to Scientific Computation November 8, 2011 1. The following is a transcript of a MATLAB session. >> x=1/62.5 x = 0.016000000000000 >> y=(1+x)-1 y = 0.016000000000000
MAT 275 Laboratory 1 Introduction to MATLAB
 MATLAB sessions: Laboratory 1 1 MAT 275 Laboratory 1 Introduction to MATLAB MATLAB is a computer software commonly used in both education and industry to solve a wide range of problems. This Laboratory
Test 3 review SHORT ANSWER. Write the word or phrase that best completes each statement or answers the question.
 Test 3 review SHORT ANSWER. Write the word or phrase that best completes each statement or answers the question. Approximate the coordinates of each turning point by graphing f(x) in the standard viewing
Interpolation. TANA09 Lecture 7. Error analysis for linear interpolation. Linear Interpolation. Suppose we have a table x x 1 x 2...
 TANA9 Lecture 7 Interpolation Suppose we have a table x x x... x n+ Interpolation Introduction. Polynomials. Error estimates. Runge s phenomena. Application - Equation solving. Spline functions and interpolation.
Chapter 12: Quadratic and Cubic Graphs
 Chapter 12: Quadratic and Cubic Graphs Section 12.1 Quadratic Graphs x 2 + 2 a 2 + 2a - 6 r r 2 x 2 5x + 8 2y 2 + 9y + 2 All the above equations contain a squared number. They are therefore called quadratic
Basic Graphs. Dmitry Adamskiy 16 November 2011
 Basic Graphs Dmitry Adamskiy adamskiy@cs.rhul.ac.uk 16 November 211 1 Plot Function plot(x,y): plots vector Y versus vector X X and Y must have the same size: X = [x1, x2 xn] and Y = [y1, y2,, yn] Broken
PART 1 PROGRAMMING WITH MATHLAB
 PART 1 PROGRAMMING WITH MATHLAB Presenter: Dr. Zalilah Sharer 2018 School of Chemical and Energy Engineering Universiti Teknologi Malaysia 23 September 2018 Programming with MATHLAB MATLAB Environment
Chapter 2. Polynomial and Rational Functions. 2.2 Quadratic Functions
 Chapter 2 Polynomial and Rational Functions 2.2 Quadratic Functions 1 /27 Chapter 2 Homework 2.2 p298 1, 5, 17, 31, 37, 41, 43, 45, 47, 49, 53, 55 2 /27 Chapter 2 Objectives Recognize characteristics of
This module aims to introduce Precalculus high school students to the basic capabilities of Matlab by using functions. Matlab will be used in
 This module aims to introduce Precalculus high school students to the basic capabilities of Matlab by using functions. Matlab will be used in subsequent modules to help to teach research related concepts
Handout 4 - Interpolation Examples
 Handout 4 - Interpolation Examples Middle East Technical University Example 1: Obtaining the n th Degree Newton s Interpolating Polynomial Passing through (n+1) Data Points Obtain the 4 th degree Newton
FF505/FY505 Computational Science. MATLAB Graphics. Marco Chiarandini
 FF505/FY505 Computational Science MATLAB Marco Chiarandini (marco@imada.sdu.dk) Department of Mathematics and Computer Science (IMADA) University of Southern Denmark Outline 1. 2D Plots 3D Plots 2 Outline
Math F302: Octave Miscellany September 28, e 1 x3 dx. Here s how to find a numerical approximation with Octave
 Definite Integrals Despite your training in Calculus, most definite integrals cannot be computed exactly, and must be approximated numerically. You learned a number of rules for doing this: the trapezoidal
PC-MATLAB PRIMER. This is intended as a guided tour through PCMATLAB. Type as you go and watch what happens.
 PC-MATLAB PRIMER This is intended as a guided tour through PCMATLAB. Type as you go and watch what happens. >> 2*3 ans = 6 PCMATLAB uses several lines for the answer, but I ve edited this to save space.
STAT 391 Handout 1 Making Plots with Matlab Mar 26, 2006
 STAT 39 Handout Making Plots with Matlab Mar 26, 26 c Marina Meilă & Lei Xu mmp@cs.washington.edu This is intended to help you mainly with the graphics in the homework. Matlab is a matrix oriented mathematics
Computational Approach to Materials Science and Engineering
 Computational Approach to Materials Science and Engineering Prita Pant and M. P. Gururajan October, 2012 Copyright c 2012, Prita Pant and M P Gururajan. Permission is granted to copy, distribute and/or