Statistical Methods for Data Mining
|
|
|
- Marcus Griffith
- 6 years ago
- Views:
Transcription
1 Statistical Methods for Data Mining Kuangnan Fang Xiamen University
2 Unsupervised Learning Unsupervised vs Supervised Learning: Most of this course focuses on supervised learning methods such as regression and classification. In that setting we observe both a set of features X 1,X 2,...,X p for each object, as well as a response or outcome variable Y. The goal is then to predict Y using X 1,X 2,...,X p. Here we instead focus on unsupervised learning, we where observe only the features X 1,X 2,...,X p. We are not interested in prediction, because we do not have an associated response variable Y. 1/52
3 The Goals of Unsupervised Learning The goal is to discover interesting things about the measurements: is there an informative way to visualize the data? Can we discover subgroups among the variables or among the observations? We discuss two methods: principal components analysis, a tool used for data visualization or data pre-processing before supervised techniques are applied, and clustering, a broad class of methods for discovering unknown subgroups in data. 2/52
4 The Challenge of Unsupervised Learning Unsupervised learning is more subjective than supervised learning, as there is no simple goal for the analysis, such as prediction of a response. But techniques for unsupervised learning are of growing importance in a number of fields: subgroups of breast cancer patients grouped by their gene expression measurements, groups of shoppers characterized by their browsing and purchase histories, movies grouped by the ratings assigned by movie viewers. 3/52
5 Another advantage It is often easier to obtain unlabeled data from a lab instrument or a computer than labeled data, which can require human intervention. For example it is di cult to automatically assess the overall sentiment of a movie review: is it favorable or not? 4/52
6 Principal Components Analysis PCA produces a low-dimensional representation of a dataset. It finds a sequence of linear combinations of the variables that have maximal variance, and are mutually uncorrelated. Apart from producing derived variables for use in supervised learning problems, PCA also serves as a tool for data visualization. 5/52
7 Principal Components Analysis: details The first principal component of a set of features X 1,X 2,...,X p is the normalized linear combination of the features Z 1 = 11 X X p1 X p that P has the largest variance. By normalized, we mean that p 2 j=1 j1 = 1. We refer to the elements 11,..., p1 as the loadings of the first principal component; together, the loadings make up the principal component loading vector, 1 =( p1) T. We constrain the loadings so that their sum of squares is equal to one, since otherwise setting these elements to be arbitrarily large in absolute value could result in an arbitrarily large variance. 6/52
8 PCA: example Ad Spending Population The population size (pop) and ad spending (ad) for 100 di erent cities are shown as purple circles. The green solid line indicates the first principal component direction, and the blue dashed line indicates the second principal component direction. 7/52
9 Computation of Principal Components Suppose we have a n p data set X. Since we are only interested in variance, we assume that each of the variables in X has been centered to have mean zero (that is, the column means of X are zero). We then look for the linear combination of the sample feature values of the form z i1 = 11 x i x i p1 x ip (1) for i = 1,...,n that has largest sample variance, subject to the constraint that P p 2 j=1 j1 = 1. Since each of the x ij has mean zero, then so does z i1 (for any values of j1). Hence the sample variance of the z i1 can be written as 1 P n n i=1 z2 i1. 8/52
10 Computation: continued Plugging in (1) the first principal component loading vector solves the optimization problem maximize 11,..., p1 1 n 0 nx i=1 j=1 j1x ij 1 A 2 subject to px j=1 2 j1 =1. This problem can be solved via a singular-value decomposition of the matrix X, a standard technique in linear algebra. We refer to Z 1 as the first principal component, with realized values z 11,...,z n1 9/52
11 Geometry of PCA The loading vector 1 with elements 11, 21,..., p1 defines a direction in feature space along which the data vary the most. If we project the n data points x 1,...,x n onto this direction, the projected values are the principal component scores z 11,...,z n1 themselves. 10 / 52
12 Further principal components The second principal component is the linear combination of X 1,...,X p that has maximal variance among all linear combinations that are uncorrelated with Z 1. The second principal component scores z 12,z 22,...,z n2 take the form z i2 = 12 x i x i p2 x ip, where 2 is the second principal component loading vector, with elements 12, 22,..., p2. 11 / 52
13 Further principal components: continued It turns out that constraining Z 2 to be uncorrelated with Z 1 is equivalent to constraining the direction 2 to be orthogonal (perpendicular) to the direction 1. And so on. The principal component directions 1, 2, 3,... are the ordered sequence of right singular vectors of the matrix X, and the variances of the components are 1 n times the squares of the singular values. There are at most min(n 1,p) principal components. 12 / 52
14 Illustration USAarrests data: For each of the fifty states in the United States, the data set contains the number of arrests per 100, 000 residents for each of three crimes: Assault, Murder, and Rape. We also record UrbanPop (the percent of the population in each state living in urban areas). The principal component score vectors have length n = 50, and the principal component loading vectors have length p = 4. PCA was performed after standardizing each variable to have mean zero and standard deviation one. 13 / 52
15 USAarrests data: PCA plot Second Principal Component UrbanPop Hawaii Rhode Massachusetts Island Utah California New Jersey Connecticut Washington Colorado New York Ohio Illinois Arizona Nevada Wisconsin Minnesota Pennsylvania Oregon Rape Texas Kansas Oklahoma Delaware Nebraska Missouri Iowa Indiana Michigan New Hampshire Florida Idaho Virginia New Mexico Maine Wyoming Maryland rth Dakota Montana Assault South Dakota Tennessee Kentucky Louisiana Arkansas Alabama Alaska Georgia VermontWest Virginia Murder South Carolina North Carolina Mississippi First Principal Component 14 / 52
16 Figure details The first two principal components for the USArrests data. The blue state names represent the scores for the first two principal components. The orange arrows indicate the first two principal component loading vectors (with axes on the top and right). For example, the loading for Rape on the first component is 0.54, and its loading on the second principal component 0.17 [the word Rape is centered at the point (0.54, 0.17)]. This figure is known as a biplot, because it displays both the principal component scores and the principal component loadings. 15 / 52
17 PCA loadings PC1 PC2 Murder Assault UrbanPop Rape / 52
18 Another Interpretation of Principal Components First principal component Second principal component / 52
19 PCA find the hyperplane closest to the observations The first principal component loading vector has a very special property: it defines the line in p-dimensional space that is closest to the n observations (using average squared Euclidean distance as a measure of closeness) The notion of principal components as the dimensions that are closest to the n observations extends beyond just the first principal component. For instance, the first two principal components of a data set span the plane that is closest to the n observations, in terms of average squared Euclidean distance. 18 / 52
20 Scaling of the variables matters If the variables are in di erent units, scaling each to have standard deviation equal to one is recommended. If they are in the same units, you might or might not scale the variables. Scaled Unscaled Second Principal Component * * UrbanPop * * * * * * * * * * * * * * * * * * * Rape * * * * * * * * * * * * Assault * * * * * * * * Murder * * * * Second Principal Component * * * * * * * * * * * * * * UrbanPop Rape * * * * * * * * Murder * * * * * * * * * * * * Assau * * * * First Principal Component First Principal Component 19 / 52
21 Proportion Variance Explained To understand the strength of each component, we are interested in knowing the proportion of variance explained (PVE) by each one. The total variance present in a data set (assuming that the variables have been centered to have mean zero) is defined as px px 1 nx Var(X j )= x 2 n ij, j=1 j=1 i=1 and the variance explained by the mth principal component is Var(Z m )= 1 nx z 2 n im. It can be shown that P p j=1 Var(X j)= P M m=1 Var(Z m), with M =min(n 1,p). i=1 20 / 52
22 Proportion Variance Explained: continued Therefore, the PVE of the mth principal component is given by the positive quantity between 0 and 1 P n i=1 z2 im P p P n. j=1 i=1 x2 ij The PVEs sum to one. We sometimes display the cumulative PVEs. Prop. Variance Explained Cumulative Prop. Variance Explained Principal Component Principal Component 21 / 52
23 How many principal components should we use? If we use principal components as a summary of our data, how many components are su cient? No simple answer to this question, as cross-validation is not available for this purpose. Why not? 22 / 52
24 How many principal components should we use? If we use principal components as a summary of our data, how many components are su cient? No simple answer to this question, as cross-validation is not available for this purpose. Why not? When could we use cross-validation to select the number of components? 22 / 52
25 How many principal components should we use? If we use principal components as a summary of our data, how many components are su cient? No simple answer to this question, as cross-validation is not available for this purpose. Why not? When could we use cross-validation to select the number of components? the scree plot on the previous slide can be used as a guide: we look for an elbow. 22 / 52
26 Clustering Clustering refers to a very broad set of techniques for finding subgroups, or clusters, in a data set. We seek a partition of the data into distinct groups so that the observations within each group are quite similar to each other, It make this concrete, we must define what it means for two or more observations to be similar or di erent. Indeed, this is often a domain-specific consideration that must be made based on knowledge of the data being studied. 23 / 52
27 PCA vs Clustering PCA looks for a low-dimensional representation of the observations that explains a good fraction of the variance. Clustering looks for homogeneous subgroups among the observations. 24 / 52
28 Clustering for Market Segmentation Suppose we have access to a large number of measurements (e.g. median household income, occupation, distance from nearest urban area, and so forth) for a large number of people. Our goal is to perform market segmentation by identifying subgroups of people who might be more receptive to a particular form of advertising, or more likely to purchase a particular product. The task of performing market segmentation amounts to clustering the people in the data set. 25 / 52
29 Two clustering methods In K-means clustering, we seek to partition the observations into a pre-specified number of clusters. In hierarchical clustering, we do not know in advance how many clusters we want; in fact, we end up with a tree-like visual representation of the observations, called a dendrogram, that allows us to view at once the clusterings obtained for each possible number of clusters, from 1 to n. 26 / 52
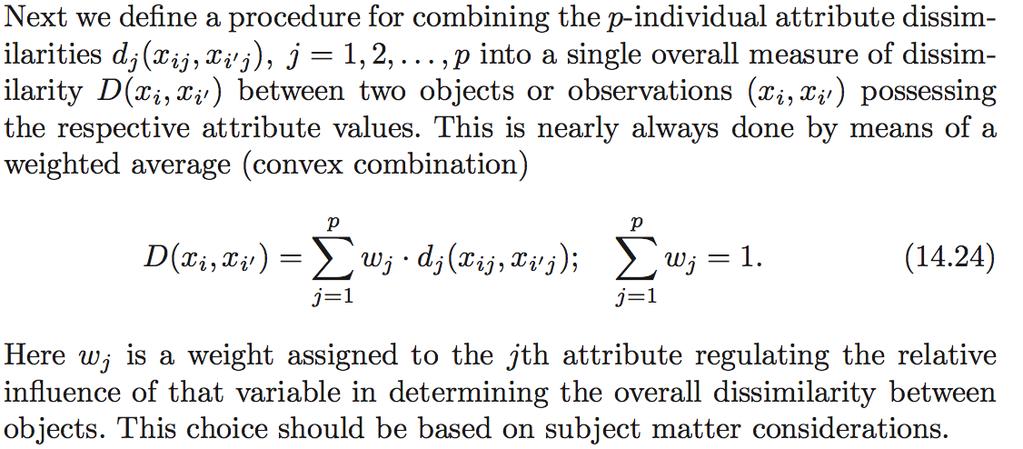
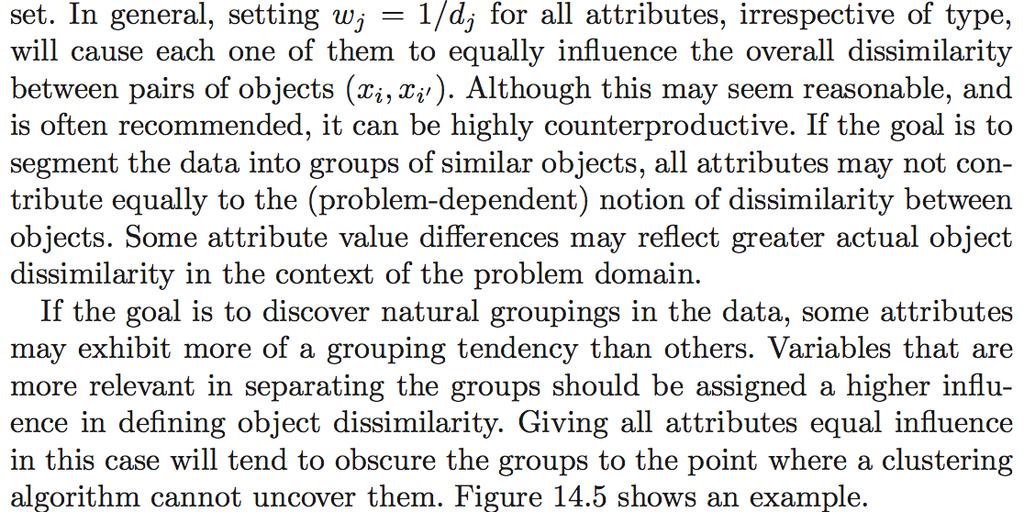
30 Dissimilarities Based on Attributes Most often we have measurements x ij for i = 1, 2,...,N, on variables j = 1, 2,..., p(also called attributes). Since most of the popular clustering algorithms take a dissimilarity matrix as their input, we must first construct pairwise dissimilarities between the observations. In the most common case, we define a dissimilarity d j (x ij, x ij ) between values of the jth attribute, and then define D(x i, x i 0) = px d j (x ij, x i 0 j ) as the dissimilarity between objects i and i. By far the most common choice is squared distance j=1 d j (x ij, xi 0 j) = (x ij x i 0 j ) 2 However, other choices are possible, and can lead to potentially different results. For nonquantitative attributes, squared distance may not be appropriate. In addition, it is sometimes desirable to weight attributes differently.
31 Dissimilarities Based on Attributes
32 Dissimilarities Based on Attributes
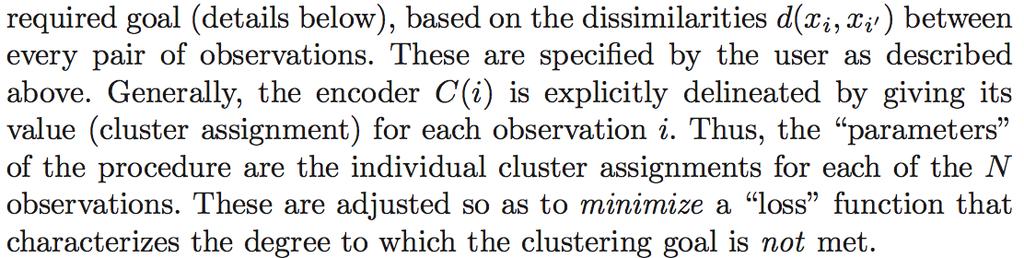
33 Object Dissimilarity
34 Object Dissimilarity
35 Object Dissimilarity
36 Object Dissimilarity
37 Object Dissimilarity
38 Combinatorial Algorithms
39 Combinatorial Algorithms
40 Combinatorial Algorithms
41 Combinatorial Algorithms
42 K-means clustering K=2 K=3 K=4 A simulated data set with 150 observations in 2-dimensional space. Panels show the results of applying K-means clustering with di erent values of K, the number of clusters. The color of each observation indicates the cluster to which it was assigned using the K-means clustering algorithm. Note that there is no ordering of the clusters, so the cluster coloring is arbitrary. These cluster labels were not used in clustering; instead, they are the outputs of the clustering procedure. 27 / 52
43 Details of K-means clustering Let C 1,...,C K denote sets containing the indices of the observations in each cluster. These sets satisfy two properties: 1. C 1 [ C 2 [...[ C K = {1,...,n}. In other words, each observation belongs to at least one of the K clusters. 2. C k \ C k 0 = ; for all k 6= k 0. In other words, the clusters are non-overlapping: no observation belongs to more than one cluster. For instance, if the ith observation is in the kth cluster, then i 2 C k. 28 / 52
44 Details of K-means clustering: continued The idea behind K-means clustering is that a good clustering is one for which the within-cluster variation is as small as possible. The within-cluster variation for cluster C k is a measure WCV(C k ) of the amount by which the observations within a cluster di er from each other. Hence we want to solve the problem ( K X ) minimize C 1,...,C K k=1 WCV(C k ). (2) In words, this formula says that we want to partition the observations into K clusters such that the total within-cluster variation, summed over all K clusters, is as small as possible. 29 / 52
45 How to define within-cluster variation? Typically we use Euclidean distance WCV(C k )= 1 C k X i,i 0 2C k j=1 px (x ij x i 0 j) 2, (3) where C k denotes the number of observations in the kth cluster. Combining (2) and (3) gives the optimization problem that defines K-means clustering, 8 9 < KX 1 X px = minimize (x C 1,...,C K : ij x i C k 0 j) 2 ;. (4) k=1 i,i 0 2C k j=1 30 / 52
46 K-Means Clustering Algorithm 1. Randomly assign a number, from 1 to K, to each of the observations. These serve as initial cluster assignments for the observations. 2. Iterate until the cluster assignments stop changing: 2.1 For each of the K clusters, compute the cluster centroid. The kth cluster centroid is the vector of the p feature means for the observations in the kth cluster. 2.2 Assign each observation to the cluster whose centroid is closest (where closest is defined using Euclidean distance). 31 / 52
47 Properties of the Algorithm This algorithm is guaranteed to decrease the value of the objective (4) at each step. Why? 32 / 52
48 Properties of the Algorithm This algorithm is guaranteed to decrease the value of the objective (4) at each step. Why? Note that 1 C k X i,i 0 2C k j=1 where x kj = 1 cluster C k. C k px (x ij x i 0 j) 2 =2 X i2c k j=1 px (x ij x kj ) 2, P i2c k x ij is the mean for feature j in however it is not guaranteed to give the global minimum. Why not? 32 / 52
49 Example Data Step 1 Iteration 1, Step 2a Iteration 1, Step 2b Iteration 2, Step 2a Final Results 33 / 52
50 K-means
51 Details of Previous Figure The progress of the K-means algorithm with K=3. Top left: The observations are shown. Top center: In Step 1 of the algorithm, each observation is randomly assigned to a cluster. Top right: In Step 2(a), the cluster centroids are computed. These are shown as large colored disks. Initially the centroids are almost completely overlapping because the initial cluster assignments were chosen at random. Bottom left: In Step 2(b), each observation is assigned to the nearest centroid. Bottom center: Step 2(a) is once again performed, leading to new cluster centroids. Bottom right: The results obtained after 10 iterations. 34 / 52
52 Example: di erent starting values / 52
53 Details of Previous Figure K-means clustering performed six times on the data from previous figure with K = 3, each time with a di erent random assignment of the observations in Step 1 of the K-means algorithm. Above each plot is the value of the objective (4). Three di erent local optima were obtained, one of which resulted in a smaller value of the objective and provides better separation between the clusters. Those labeled in red all achieved the same best solution, with an objective value of / 52
54 K-means
55 K-means
56 K-medoids the K-means algorithm is appropriate when the dissimilarity measure is taken to be squared Euclidean distance D(x i, x i ). This requires all of the variables to be of the quantitative type. In addition, using squared Euclidean distance places the highest influence on the largest distances. This causes the procedure to lack robustness against outliers that produce very large distances.
57 K-medoids
58 K-medoids
59 K-medoids
60 Hierarchical Clustering K-means clustering requires us to pre-specify the number of clusters K. This can be a disadvantage (later we discuss strategies for choosing K) Hierarchical clustering is an alternative approach which does not require that we commit to a particular choice of K. In this section, we describe bottom-up or agglomerative clustering. This is the most common type of hierarchical clustering, and refers to the fact that a dendrogram is built starting from the leaves and combining clusters up to the trunk. 37 / 52
61 Hierarchical Clustering: the idea Builds a hierarchy in a bottom-up fashion... D E A B C 38 / 52
62 Hierarchical Clustering: the idea Builds a hierarchy in a bottom-up fashion... D E A B C 38 / 52
63 Hierarchical Clustering: the idea Builds a hierarchy in a bottom-up fashion... D E A B C 38 / 52
64 Hierarchical Clustering: the idea Builds a hierarchy in a bottom-up fashion... D E A B C 38 / 52
65 Hierarchical Clustering: the idea Builds a hierarchy in a bottom-up fashion... D E A B C 38 / 52
66 Hierarchical Clustering Algorithm The approach in words: Start with each point in its own cluster. Identify the closest two clusters and merge them. Repeat. Ends when all points are in a single cluster. Dendrogram A C B D E D E B A C 39 / 52
67 Hierarchical Clustering Algorithm The approach in words: Start with each point in its own cluster. Identify the closest two clusters and merge them. Repeat. Ends when all points are in a single cluster. Dendrogram A C B D E D E B A C 39 / 52
68 An Example X observations generated in 2-dimensional space. In reality there are three distinct classes, shown in separate colors. However, we will treat these class labels as unknown and will seek to cluster the observations in order to discover the classes from the data. X 1 40 / 52
69 Application of hierarchical clustering / 52
70 Details of previous figure Left: Dendrogram obtained from hierarchically clustering the data from previous slide, with complete linkage and Euclidean distance. Center: The dendrogram from the left-hand panel, cut at a height of 9 (indicated by the dashed line). This cut results in two distinct clusters, shown in di erent colors. Right: The dendrogram from the left-hand panel, now cut at a height of 5. This cut results in three distinct clusters, shown in di erent colors. Note that the colors were not used in clustering, but are simply used for display purposes in this figure 42 / 52
71 Another Example X X1 An illustration of how to properly interpret a dendrogram with nine observations in two-dimensional space. The raw data on the right was used to generate the dendrogram on the left. Observations 5 and 7 are quite similar to each other, as are observations 1 and 6. However, observation 9 is no more similar to observation 2 than it is to observations 8, 5, and 7, even though observations 9 and 2 are close together in terms of horizontal distance. This is because observations 2, 8, 5, and 7 all fuse with observation 9 at the same height, approximately / 52
72 Merges in previous example 9 9 X X X X1 9 X X X X1 44 / 52
73 Types of Linkage Linkage Complete Single Average Centroid Description Maximal inter-cluster dissimilarity. Compute all pairwise dissimilarities between the observations in cluster A and the observations in cluster B, and record the largest of these dissimilarities. Minimal inter-cluster dissimilarity. Compute all pairwise dissimilarities between the observations in cluster A and the observations in cluster B, and record the smallest of these dissimilarities. Mean inter-cluster dissimilarity. Compute all pairwise dissimilarities between the observations in cluster A and the observations in cluster B, and record the average of these dissimilarities. Dissimilarity between the centroid for cluster A (a mean vector of length p) and the centroid for cluster B. Centroid linkage can result in undesirable inversions. 45 / 52
74 Choice of Dissimilarity Measure So far have used Euclidean distance. An alternative is correlation-based distance which considers two observations to be similar if their features are highly correlated. This is an unusual use of correlation, which is normally computed between variables; here it is computed between the observation profiles for each pair of observations Observation 1 Observation 2 Observation Variable Index 46 / 52
75 Scaling of the variables matters Socks Computers Socks Computers Socks Computers 47 / 52
76 Practical issues Should the observations or features first be standardized in some way? For instance, maybe the variables should be centered to have mean zero and scaled to have standard deviation one. In the case of hierarchical clustering, What dissimilarity measure should be used? What type of linkage should be used? How many clusters to choose? (in both K-means or hierarchical clustering). Di cult problem. No agreed-upon method. See Elements of Statistical Learning, chapter 13 for more details. 48 / 52
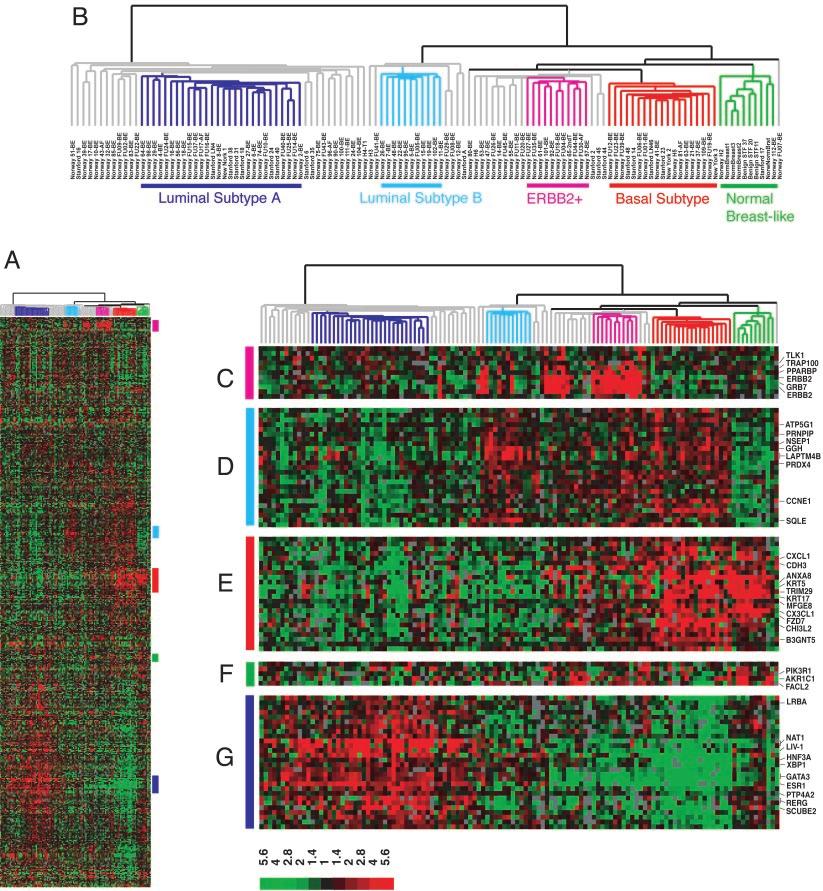
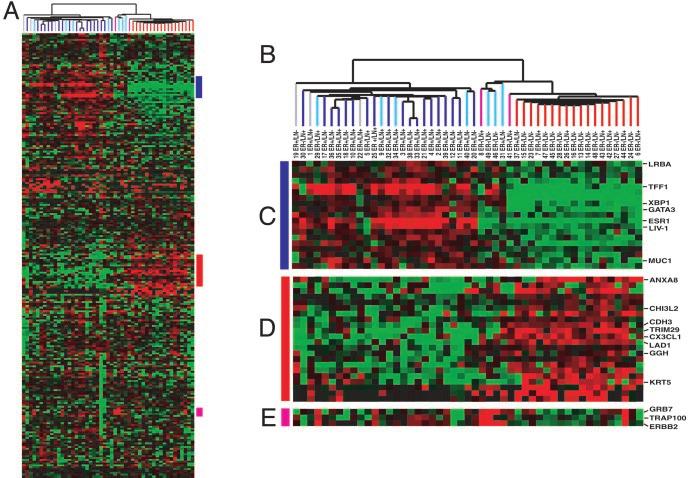
77 Example: breast cancer microarray study Repeated observation of breast tumor subtypes in independent gene expression data sets; Sorlie at el, PNAS 2003 Average linkage, correlation metric Clustered samples using 500 intrinsic genes: each woman was measured before and after chemotherapy. Intrinsic genes have smallest within/between variation. 49 / 52
78 50 / 52
79 51 / 52
80 Conclusions Unsupervised learning is important for understanding the variation and grouping structure of a set of unlabeled data, and can be a useful pre-processor for supervised learning It is intrinsically more di cult than supervised learning because there is no gold standard (like an outcome variable) and no single objective (like test set accuracy) It is an active field of research, with many recently developed tools such as self-organizing maps, independent components analysis and spectral clustering. See The Elements of Statistical Learning, chapter / 52
Statistical Methods for Data Mining
 Statistical Methods for Data Mining Kuangnan Fang Xiamen University Email: xmufkn@xmu.edu.cn Unsupervised Learning Unsupervised vs Supervised Learning: Most of this course focuses on supervised learning
Unsupervised Learning
 Unsupervised Learning Fabio G. Cozman - fgcozman@usp.br November 16, 2018 What can we do? We just have a dataset with features (no labels, no response). We want to understand the data... no easy to define
May 1, CODY, Error Backpropagation, Bischop 5.3, and Support Vector Machines (SVM) Bishop Ch 7. May 3, Class HW SVM, PCA, and K-means, Bishop Ch
 Bishop Ch 7. May 3, Class HW SVM, PCA, and K-means, Bishop Ch") May 1, CODY, Error Backpropagation, Bischop 5.3, and Support Vector Machines (SVM) Bishop Ch 7. May 3, Class HW SVM, PCA, and K-means, Bishop Ch 12.1, 9.1 May 8, CODY Machine Learning for finding oil,
May 1, CODY, Error Backpropagation, Bischop 5.3, and Support Vector Machines (SVM) Bishop Ch 7. May 3, Class HW SVM, PCA, and K-means, Bishop Ch 12.1, 9.1 May 8, CODY Machine Learning for finding oil,
Manufactured Home Production by Product Mix ( )
") Manufactured Home Production by Product Mix (1990-2016) Data Source: Institute for Building Technology and Safety (IBTS) States with less than three active manufacturers are indicated with asterisks (*).
Manufactured Home Production by Product Mix (1990-2016) Data Source: Institute for Building Technology and Safety (IBTS) States with less than three active manufacturers are indicated with asterisks (*).
Reporting Child Abuse Numbers by State
 Youth-Inspired Solutions to End Abuse Reporting Child Abuse Numbers by State Information Courtesy of Child Welfare Information Gateway Each State designates specific agencies to receive and investigate
Alaska ATU 1 $13.85 $4.27 $ $ Tandem Switching $ Termination
 Page 1 Table 1 UNBUNDLED NETWORK ELEMENT RATE COMPARISON MATRIX All Rates for RBOC in each State Unless Otherwise Noted Updated April, 2001 Loop Port Tandem Switching Density Rate Rate Switching and Transport
Alaska ATU 1 $13.85 $4.27 $ $ Tandem Switching $ Termination
 Page 1 Table 1 UNBUNDLED NETWORK ELEMENT RATE COMPARISON MATRIX All Rates for RBOC in each State Unless Otherwise Noted Updated July 1, 2001 Loop Port Tandem Switching Density Rate Rate Switching and Transport
Levels of Measurement. Data classing principles and methods. Nominal. Ordinal. Interval. Ratio. Nominal: Categorical measure [e.g.
 Introduction to the Mapping Sciences Map Composition & Design IV: Measurement & Class Intervaling Principles & Methods Overview: Levels of measurement Data classing principles and methods 1 2 Levels of
MapMarker Standard 10.0 Release Notes
 MapMarker Standard 10.0 Release Notes Table of Contents Introduction............................................................... 1 System Requirements......................................................
Alaska no no all drivers primary. Arizona no no no not applicable. primary: texting by all drivers but younger than
 Distracted driving Concern is mounting about the effects of phone use and texting while driving. Cellphones and texting January 2016 Talking on a hand held cellphone while driving is banned in 14 states
MapMarker Plus 10.2 Release Notes
 MapMarker Plus 10.2 Table of Contents Introduction............................................................... 1 System Requirements...................................................... 1 System Recommendations..................................................
Chart 2: e-waste Processed by SRD Program in Unregulated States
 e Samsung is a strong supporter of producer responsibility. Samsung is committed to stepping ahead and performing strongly in accordance with our principles. Samsung principles include protection of people,
How Social is Your State Destination Marketing Organization (DMO)?
?") How Social is Your State Destination Marketing Organization (DMO)? Status: This is the 15th effort with the original being published in June of 2009 - to bench- mark the web and social media presence of
How Social is Your State Destination Marketing Organization (DMO)? Status: This is the 15th effort with the original being published in June of 2009 - to bench- mark the web and social media presence of
What's Next for Clean Water Act Jurisdiction
 Association of State Wetland Managers Hot Topics Webinar Series What's Next for Clean Water Act Jurisdiction July 11, 2017 12:00 pm 1:30 pm Eastern Webinar Presenters: Roy Gardner, Stetson University,
MapMarker Plus v Release Notes
 Release Notes Table of Contents Introduction............................................................... 2 MapMarker Developer Installations........................................... 2 Running the
Arizona does not currently have this ability, nor is it part of the new system in development.
 Topic: Question by: : E-Notification Cheri L. Myers North Carolina Date: June 13, 2012 Manitoba Corporations Canada Alabama Alaska Arizona Arkansas California Colorado Connecticut Delaware District of
AGILE BUSINESS MEDIA, LLC 500 E. Washington St. Established 2002 North Attleboro, MA Issues Per Year: 12 (412)
") Please review your report carefully. If corrections are needed, please fax us the pages requiring correction. Otherwise, sign and return to your Verified Account Coordinator by fax or email. Fax to: 415-461-6007
Please review your report carefully. If corrections are needed, please fax us the pages requiring correction. Otherwise, sign and return to your Verified Account Coordinator by fax or email. Fax to: 415-461-6007
Oklahoma Economic Outlook 2016
 Oklahoma Economic Outlook 216 by Dan Rickman Regents Professor of Economics and Oklahoma Gas and Electric Services Chair in Regional Economic Analysis http://economy.okstate.edu/ U.S. Real Gross Domestic
Bulk Resident Agent Change Filings. Question by: Stephanie Mickelsen. Jurisdiction. Date: 20 July Question(s)
") Topic: Bulk Resident Agent Change Filings Question by: Stephanie Mickelsen Jurisdiction: Kansas Date: 20 July 2010 Question(s) Jurisdiction Do you file bulk changes? How does your state file and image
Topic: Bulk Resident Agent Change Filings Question by: Stephanie Mickelsen Jurisdiction: Kansas Date: 20 July 2010 Question(s) Jurisdiction Do you file bulk changes? How does your state file and image
Ted C. Jones, PhD Chief Economist
 Ted C. Jones, PhD Chief Economist Hurricanes U.S. Jobs Jobs (Millions) Seasonally Adjusted 150 145 140 135 130 1.41% Prior 12 Months 2.05 Million Net New Jobs in Past 12-Months 125 '07 '08 '09 '10 '11
SECTION 2 NAVIGATION SYSTEM: DESTINATION SEARCH
 NAVIGATION SYSTEM: DESTINATION SEARCH SECTION 2 Destination search 62 Selecting the search area............................. 62 Destination search by Home........................... 64 Destination search
J.D. Power and Associates Reports: Overall Wireless Network Problem Rates Differ Considerably Based on Type of Usage Activity
 Reports: Overall Wireless Network Problem Rates Differ Considerably Based on Type of Usage Activity Ranks Highest in Wireless Network Quality Performance in Five Regions WESTLAKE VILLAGE, Calif.: 25 August
Is your standard BASED on the IACA standard, or is it a complete departure from the. If you did consider. using the IACA
 Topic: XML Standards Question By: Sherri De Marco Jurisdiction: Michigan Date: 2 February 2012 Jurisdiction Question 1 Question 2 Has y If so, did jurisdiction you adopt adopted any the XML standard standard
MapMarker Plus 12.0 Release Notes
 MapMarker Plus 12.0 Release Notes Table of Contents Introduction, p. 2 Running the Tomcat Server as a Windows Service, p. 2 Desktop and Adapter Startup Errors, p. 2 Address Dictionary Update, p. 3 Address
Oklahoma Economic Outlook 2015
 Oklahoma Economic Outlook 2015 by Dan Rickman Regents Professor of Economics and Oklahoma Gas and Electric Services Chair in Regional Economic Analysis http://economy.okstate.edu/ October 2013-2014 Nonfarm
Network Traffic Measurements and Analysis
 DEIB - Politecnico di Milano Fall, 2017 Introduction Often, we have only a set of features x = x 1, x 2,, x n, but no associated response y. Therefore we are not interested in prediction nor classification,
CONSOLIDATED MEDIA REPORT B2B Media 6 months ended June 30, 2018
 CONSOLIDATED MEDIA REPORT B2B Media 6 months ended June 30, 2018 TOTAL GROSS CONTACTS 313,819 180,000 167,321 160,000 140,000 120,000 100,000 80,000 73,593 72,905 60,000 40,000 20,000 0 clinician s brief
Terry McAuliffe-VA. Scott Walker-WI
 Terry McAuliffe-VA Scott Walker-WI Cost Before Performance Contracting Model Energy Services Companies Savings Positive Cash Flow $ ESCO Project Payment Cost After 1 2 3 4 5 6 7 8 9 10 11 12 13 14 15 16
2011 Aetna Producer Certification Help Guide. Updated July 28, 2011
 2011 Aetna Producer Certification Help Guide Updated July 28, 2011 Table of Contents 1 Introduction...3 1.1 Welcome...3 1.2 Purpose...3 1.3 Preparation...3 1.4 Overview...4 2 Site Overview...5 2.1 Site
π H LBS. x.05 LB. PARCEL SCALE OVERVIEW OF CONTROLS uline.com CONTROL PANEL CONTROL FUNCTIONS lb kg 0
 Capacity: x.5 lb / 6 x.2 kg π H-2714 LBS. x.5 LB. PARCEL SCALE 1-8-295-551 uline.com lb kg OVERVIEW OF CONTROLS CONTROL PANEL Capacity: x.5 lb / 6 x.2 kg 1 2 3 4 METTLER TOLEDO CONTROL PANEL PARTS # DESCRIPTION
Question by: Scott Primeau. Date: 20 December User Accounts 2010 Dec 20. Is an account unique to a business record or to a filer?
 Topic: User Accounts Question by: Scott Primeau : Colorado Date: 20 December 2010 Manitoba create user to create user, etc.) Corporations Canada Alabama Alaska Arizona Arkansas California Colorado Connecticut
The Promise of Brown v. Board Not Yet Realized The Economic Necessity to Deliver on the Promise
 Building on its previous work examining education and the economy, the Alliance for Excellent Education (the Alliance), with generous support from Farm, analyzed state-level economic data to determine
LAB #6: DATA HANDING AND MANIPULATION
 NAVAL POSTGRADUATE SCHOOL LAB #6: DATA HANDING AND MANIPULATION Statistics (OA3102) Lab #6: Data Handling and Manipulation Goal: Introduce students to various R commands for handling and manipulating data,
Introduction to R for Epidemiologists
 Introduction to R for Epidemiologists Jenna Krall, PhD Thursday, January 29, 2015 Final project Epidemiological analysis of real data Must include: Summary statistics T-tests or chi-squared tests Regression
Clustering. Chapter 10 in Introduction to statistical learning
 Clustering Chapter 10 in Introduction to statistical learning 16 14 12 10 8 6 4 2 0 2 4 6 8 10 12 14 1 Clustering ² Clustering is the art of finding groups in data (Kaufman and Rousseeuw, 1990). ² What
Statistics 202: Data Mining. c Jonathan Taylor. Week 8 Based in part on slides from textbook, slides of Susan Holmes. December 2, / 1
 Week 8 Based in part on slides from textbook, slides of Susan Holmes December 2, 2012 1 / 1 Part I Clustering 2 / 1 Clustering Clustering Goal: Finding groups of objects such that the objects in a group
Managing Transportation Research with Databases and Spreadsheets: Survey of State Approaches and Capabilities
 Managing Transportation Research with Databases and Spreadsheets: Survey of State Approaches and Capabilities Pat Casey AASHTO Research Advisory Committee meeting Baton Rouge, Louisiana July 18, 2013 Survey
Publisher's Sworn Statement
 Publisher's Sworn Statement CLOSETS & Organized Storage is published four times per year and is dedicated to providing the most current trends in design, materials and technology to the professional closets,
CONSOLIDATED MEDIA REPORT Business Publication 6 months ended December 31, 2017
 CONSOLIDATED MEDIA REPORT Business Publication 6 months ended December 31, 2017 TOTAL GROSS CONTACTS 1,952,295 2,000,000 1,800,000 1,868,402 1,600,000 1,400,000 1,200,000 1,000,000 800,000 600,000 400,000
Exploratory data analysis for microarrays
 Exploratory data analysis for microarrays Jörg Rahnenführer Computational Biology and Applied Algorithmics Max Planck Institute for Informatics D-66123 Saarbrücken Germany NGFN - Courses in Practical DNA
Wireless Network Data Speeds Improve but Not Incidence of Data Problems, J.D. Power Finds
 Wireless Network Data Speeds Improve but Not Incidence of Data Problems, J.D. Power Finds Ranks Highest in Wireless Network Quality Performance in All Six Regions; U.S. Cellular Ties for Highest Rank in
US STATE CONNECTIVITY
 US STATE CONNECTIVITY P3 REPORT FOR CELLULAR NETWORK COVERAGE IN INDIVIDUAL US STATES DIFFERENT GRADES OF COVERAGE When your mobile phone indicates it has an active signal, it is connected with the most
User Experience Task Force
 Section 7.3 Cost Estimating Methodology Directive By March 1, 2014, a complete recommendation must be submitted to the Governor, Chief Financial Officer, President of the Senate, and the Speaker of the
How Employers Use E-Response Date: April 26th, 2016 Version: 6.51
 NOTICE: SIDES E-Response is managed by the state from whom the request is received. If you want to sign up for SIDES E-Response, are having issues logging in to E-Response, or have questions about how
Clustering. CE-717: Machine Learning Sharif University of Technology Spring Soleymani
 Clustering CE-717: Machine Learning Sharif University of Technology Spring 2016 Soleymani Outline Clustering Definition Clustering main approaches Partitional (flat) Hierarchical Clustering validation
Hierarchical clustering
 Hierarchical clustering Rebecca C. Steorts, Duke University STA 325, Chapter 10 ISL 1 / 63 Agenda K-means versus Hierarchical clustering Agglomerative vs divisive clustering Dendogram (tree) Hierarchical
57,611 59,603. Print Pass-Along Recipients Website
 TOTAL GROSS CONTACTS: 1,268,334* 1,300,000 1,200,000 1,151,120 1,100,000 1,000,000 900,000 800,000 700,000 600,000 500,000 400,000 300,000 200,000 100,000 0 57,611 59,603 Pass-Along Recipients Website
MapMarker Plus v Release Notes
 Release Notes Table of Contents Introduction............................................................... 2 MapMarker Developer Installations........................................... 2 Running the
Disaster Economic Impact
 Hurricanes Disaster Economic Impact Immediate Impact 6-12 Months Later Loss of Jobs Declining Home Sales Strong Job Growth Rising Home Sales Punta Gorda MSA Employment Thousands Seasonally Adjusted 50
For Every Action There is An Equal and Opposite Reaction Newton Was an Economist - The Outlook for Real Estate and the Economy
 For Every Action There is An Equal and Opposite Reaction Newton Was an Economist - The Outlook for Real Estate and the Economy Ted C. Jones, PhD Chief Economist Twitter #DrTCJ Mega Themes More Jobs Than
Established Lafayette St., P.O. Box 998 Issues Per Year: 12 Yarmouth, ME 04096
 JANUARY 1, 2016 JUNE 30, 2016 SECURITY SYSTEMS NEWS UNITED PUBLICATIONS, INC. Established 1998 106 Lafayette St., P.O. Box 998 Issues Per Year: 12 Yarmouth, ME 04096 Issues This Report: 6 (207) 846-0600
C.A.S.E. Community Partner Application
 C.A.S.E. Community Partner Application This application is to be completed by community organizations and agencies who wish to partner with the Civic and Service Education (C.A.S.E.) Program here at North
Workload Characterization Techniques
 Workload Characterization Techniques Raj Jain Washington University in Saint Louis Saint Louis, MO 63130 Jain@cse.wustl.edu These slides are available on-line at: http://www.cse.wustl.edu/~jain/cse567-08/
Telephone Appends. White Paper. September Prepared by
 September 2016 Telephone Appends White Paper Prepared by Rachel Harter Joe McMichael Derick Brown Ashley Amaya RTI International 3040 E. Cornwallis Road Research Triangle Park, NC 27709 Trent Buskirk David
Instructions for Enrollment
 Instructions for Enrollment No Medicaid There are 3 documents contained in this Enrollment Packet which need to be completed to enroll with the. Please submit completed documents in a PDF to Lab Account
SAS Visual Analytics 8.1: Getting Started with Analytical Models
 SAS Visual Analytics 8.1: Getting Started with Analytical Models Using This Book Audience This book covers the basics of building, comparing, and exploring analytical models in SAS Visual Analytics. The
Embedded Systems Conference Silicon Valley
 Embedded Systems Conference Silicon Valley EVENT AUDIT DATES OF EVENT: Conference: April 3 7, 2006 Exhibits: April 4 6, 2006 LOCATION: McEnery Convention Center, San Jose EVENT PRODUCER/MANAGER: Company
Crop Progress. Corn Emerged - Selected States [These 18 States planted 92% of the 2016 corn acreage]
![Crop Progress. Corn Emerged - Selected States [These 18 States planted 92% of the 2016 corn acreage]](/thumbs/83/87811371.jpg "Crop Progress. Corn Emerged - Selected States [These 18 States planted 92% of the 2016 corn acreage]") Crop Progress ISSN: 00 Released June, 0, by the National Agricultural Statistics Service (NASS), Agricultural Statistics Board, United s Department of Agriculture (USDA). Corn Emerged Selected s [These
Crop Progress ISSN: 00 Released June, 0, by the National Agricultural Statistics Service (NASS), Agricultural Statistics Board, United s Department of Agriculture (USDA). Corn Emerged Selected s [These
Cluster Analysis. Mu-Chun Su. Department of Computer Science and Information Engineering National Central University 2003/3/11 1
 Cluster Analysis Mu-Chun Su Department of Computer Science and Information Engineering National Central University 2003/3/11 1 Introduction Cluster analysis is the formal study of algorithms and methods
BRAND REPORT FOR THE 6 MONTH PERIOD ENDED JUNE 2014
 BRAND REPORT FOR THE 6 MONTH PERIOD ENDED JUNE 2014 No attempt has been made to rank the information contained in this report in order of importance, since BPA Worldwide believes this is a judgment which
Online Certification/Authentication of Documents re: Business Entities. Date: 05 April 2011
 Topic: Question by: : Online Certification/Authentication of Documents re: Business Entities Robert Lindsey Virginia Date: 05 April 2011 Manitoba Corporations Canada Alabama Alaska Arizona Arkansas California
Qualified recipients are Chief Executive Officers, Partners, Chairmen, Presidents, Owners, VPs, and other real estate management personnel.
 JANUARY 1, 2018 JUNE 30, 2018 GROUP C MEDIA 44 Apple Street Established 1968 Tinton Falls, NJ 07724 Issues Per Year: 6 (732) 559-1254 (732) 758-6634 FAX Issues This Report: 3 www.businessfacilities.com
Local Telephone Competition: Status as of December 31, 2010
 Local Telephone Competition: Status as of December 31, 2010 Industry Analysis and Technology Division Wireline Competition Bureau October 2011 This report is available for reference in the FCC s Reference
DATES OF EVENT: Conference: March 31 April 2, 2009 Exhibits: April 1 3, Sands Expo & Convention Center, Las Vegas, NV
 EVENT AUDIT DATES OF EVENT: Conference: March 31 April 2, 2009 Exhibits: April 1 3, 2009 LOCATION: Sands Expo & Convention Center, Las Vegas, NV EVENT PRODUCER/MANAGER: Company Name: Reed Exhibitions Address:
Summary of the State Elder Abuse. Questionnaire for Alaska
 Summary of the State Elder Abuse Questionnaire for Alaska A Final Report to: Department of Administration Adult Protective Services February 2002 Prepared by Researchers at The University of Iowa Department
4/25/2013. Bevan Erickson VP, Marketing
 2013 Bevan Erickson VP, Marketing The Challenge of Niche Markets 1 Demographics KNOW YOUR AUDIENCE 120,000 100,000 80,000 60,000 40,000 20,000 AAPC Membership 120,000+ Members - 2 Region Members Northeast
DATES OF EVENT: Conference: March 23 March 25, 2010 Exhibits: March 24 March 26, Sands Expo & Convention Center, Las Vegas, NV
 EVENT AUDIT DATES OF EVENT: Conference: March 23 March 25, 2010 Exhibits: March 24 March 26, 2010 LOCATION: Sands Expo & Convention Center, Las Vegas, NV EVENT PRODUCER/MANAGER: Company Name: Reed Exhibitions
DATES OF NEXT EVENT: Conference: June 4 8, 2007 Exhibits: June 4 7, 2007 San Diego Convention Center, San Diego, CA
 EVENT AUDIT DATES OF EVENT: Conference: July 24 28, 2006 Exhibits: July 24 27, 2006 LOCATION: Moscone Center, San Francisco, CA EVENT PRODUCER/MANAGER: Company Name: Association for Computing Machinery
Statistics 202: Data Mining. c Jonathan Taylor. Clustering Based in part on slides from textbook, slides of Susan Holmes.
 Clustering Based in part on slides from textbook, slides of Susan Holmes December 2, 2012 1 / 1 Clustering Clustering Goal: Finding groups of objects such that the objects in a group will be similar (or
Advanced LabVIEW for FTC
 Advanced LabVIEW for FTC By Mike Turner Software Mentor, Green Machine If you only write down one slide. This is that slide. 1. Use enumerated types more often. 2. Make functional global variables for
BBS654 Data Mining. Pinar Duygulu. Slides are adapted from Nazli Ikizler
 BBS654 Data Mining Pinar Duygulu Slides are adapted from Nazli Ikizler 1 Classification Classification systems: Supervised learning Make a rational prediction given evidence There are several methods for
Summary of the State Elder Abuse. Questionnaire for Hawaii
 Summary of the State Elder Abuse Questionnaire for Hawaii A Final Report to: Department of Human Services February 2002 Prepared by Researchers at The University of Iowa Department of Family Medicine 2
10701 Machine Learning. Clustering
 171 Machine Learning Clustering What is Clustering? Organizing data into clusters such that there is high intra-cluster similarity low inter-cluster similarity Informally, finding natural groupings among
45 th Design Automation Conference
 45 th Design Automation Conference EVENT AUDIT DATES OF EVENT: Conference: June 8 13, 2008 Exhibits: June 8 10, 2008 LOCATION: Anaheim Convention Center, Anaheim, CA EVENT PRODUCER/MANAGER: Company Name:
NEHA-NRPP APPLICATION FOR CERTIFICATION
 NEHA-NRPP APPLICATION FOR CERTIFICATION This application is a basic form to provide NEHA-NRPP with information necessary to finalize your certification and provide you with an opportunity to apply for
CSE 5243 INTRO. TO DATA MINING
 CSE 5243 INTRO. TO DATA MINING Cluster Analysis: Basic Concepts and Methods Huan Sun, CSE@The Ohio State University 09/25/2017 Slides adapted from UIUC CS412, Fall 2017, by Prof. Jiawei Han 2 Chapter 10.
Crop Progress. Corn Dough Selected States [These 18 States planted 92% of the 2017 corn acreage] Corn Dented Selected States ISSN:
![Crop Progress. Corn Dough Selected States [These 18 States planted 92% of the 2017 corn acreage] Corn Dented Selected States ISSN:](/thumbs/83/87620109.jpg "Crop Progress. Corn Dough Selected States [These 18 States planted 92% of the 2017 corn acreage] Corn Dented Selected States ISSN:") Crop Progress ISSN: 00 Released August, 0, by the National Agricultural Statistics Service (NASS), Agricultural Statistics Board, United s Department of Agriculture (USDA). Corn Dough Selected s [These
Crop Progress ISSN: 00 Released August, 0, by the National Agricultural Statistics Service (NASS), Agricultural Statistics Board, United s Department of Agriculture (USDA). Corn Dough Selected s [These
WINDSTREAM CARRIER ETHERNET: E-NNI Guide & ICB Processes
 WINDSTREAM CARRIER ETHERNET: E-NNI Guide & ICB Processes Version.0, April 2017 Overview The Carrier Ethernet (E-Access) product leverages Windstream s MPLS and Ethernet infrastructure to provide switched
76 Million Boomers. 83 Million Millennials 19 to Million Millennials 16 to 35
 76 Million Boomers 83 Million Millennials 19 to 35 91 Million Millennials 16 to 35 Top Millennial Population Growth Markets 2005 to 2015 12-Month Population Job Rank City, State Growth Growth 1 Charlotte,
Real Estate Forecast 2017
 Real Estate Forecast 2017 Twitter @DrTCJ Non-Renewals - Dead on Arrival Mortgage Insurance Deductibility Residential Mortgage Debt Forgiveness Residential Energy Savings Renewables Wind and Solar ObamaCare
Summary of the State Elder Abuse. Questionnaire for Texas
 Summary of the State Elder Abuse Questionnaire for Texas A Final Report to: Department of Protection and Regulatory Services February 2002 Prepared by Researchers at The University of Iowa Department of
CSE 5243 INTRO. TO DATA MINING
 CSE 5243 INTRO. TO DATA MINING Cluster Analysis: Basic Concepts and Methods Huan Sun, CSE@The Ohio State University Slides adapted from UIUC CS412, Fall 2017, by Prof. Jiawei Han 2 Chapter 10. Cluster
Unsupervised Learning
 Outline Unsupervised Learning Basic concepts K-means algorithm Representation of clusters Hierarchical clustering Distance functions Which clustering algorithm to use? NN Supervised learning vs. unsupervised
Clustering CS 550: Machine Learning
 Clustering CS 550: Machine Learning This slide set mainly uses the slides given in the following links: http://www-users.cs.umn.edu/~kumar/dmbook/ch8.pdf http://www-users.cs.umn.edu/~kumar/dmbook/dmslides/chap8_basic_cluster_analysis.pdf
Distracted Driving Accident Claims Involving Mobile Devices Special Considerations and New Frontiers in Legal Liability
 Presenting a live 90-minute webinar with interactive Q&A Distracted Driving Accident Claims Involving Mobile Devices Special Considerations and New Frontiers in Legal Liability WEDNESDAY, AUGUST 1, 2012
U.S. Residential High Speed Internet
 U.S. Residential High Speed Internet High-Speed Internet High-Speed Fiber and DSL broadband options from two top providers: FIBER DSL *Availability and speeds vary by customer location. Why Sell High-Speed
Guide to the Virginia Mericle Menu Collection
 Guide to the Vanessa Broussard Simmons and Craig Orr 2017 Archives Center, National Museum of American History P.O. Box 37012 Suite 1100, MRC 601 Washington, D.C. 20013-7012 archivescenter@si.edu http://americanhistory.si.edu/archives
JIM TAYLOR PILOT CAR SVC J & J PILOT CAR SVC PILOTCAR.NET ROYAL ESCORT
 Alabama CONSUMER CARRIERS, LLC 334-476-1977 DRIVERS FIRST CHOICE FAITH PILOT CAR 405-642-4276 PIT ROW SERVICES 205-763-9340 TY-TY EXPRESS PILOT CAR 334-559-1568 Arizona AG PILOT CAR 480-686-7383 ALL STATE
Loops. An R programmer can determine the order of processing of commands, via use of the control statements; repeat{}, while(), for(), break, and next
, for(), break, and next") Source: https://www.r-exercises.com/2016/06/01/scripting-loops-in-r/ Loops An R programmer can determine the order of processing of commands, via use of the control statements; repeat{, while(), for(),
Source: https://www.r-exercises.com/2016/06/01/scripting-loops-in-r/ Loops An R programmer can determine the order of processing of commands, via use of the control statements; repeat{, while(), for(),
BOUNDARY PVC EVERLASTING FENCE 100% VIRGIN VINYL THE NEW YORK STYLE FENCE STOCK COLORS WHITE BEIGE BROWN/CLAY GRAY. Copyright 2007
 TM BOUNDARY PVC EVERLASTING FENCE 100% VIRGIN VINYL STOCK COLORS WHITE BEIGE BROWN/CLAY GRAY THE NEW YORK STYLE FENCE 1 Copyright 200 BEAUTIFY YOUR PROPERTY AND HAVE THE EASE OF MIND KNOWING THAT YOUR
10601 Machine Learning. Hierarchical clustering. Reading: Bishop: 9-9.2
 161 Machine Learning Hierarchical clustering Reading: Bishop: 9-9.2 Second half: Overview Clustering - Hierarchical, semi-supervised learning Graphical models - Bayesian networks, HMMs, Reasoning under
Legal-Compliance Department March 22, 2019 Page 1 of 7
 Licensing Information NMLS I.D. 2600 Corporate Office: 1600 South Douglass Road, Suites 110 & 200-A, Anaheim, CA 92806 Loan Servicing Branch Offices: 2100 E. 196 th Street, Suites 100 & 200, Westfield,
Gene Clustering & Classification
 BINF, Introduction to Computational Biology Gene Clustering & Classification Young-Rae Cho Associate Professor Department of Computer Science Baylor University Overview Introduction to Gene Clustering
2018 Payroll Tax Table Update Instructions (Effective January 2, 2018)
") 2018 Payroll Tax Table Update Instructions (Effective January 2, 2018) READ THIS FIRST! These are the initial Federal and State Tax Table changes for 2018 that have been released through 1/02/2018. This
2018 Payroll Tax Table Update Instructions (Effective January 2, 2018) READ THIS FIRST! These are the initial Federal and State Tax Table changes for 2018 that have been released through 1/02/2018. This
Legal-Compliance Department October 11, 2017 Page 1 of 8
 Licensing Information NMLS I.D. 2600 Corporate Office: 1600 South Douglass Road, Suites 110 & 200-A, Anaheim, CA 92806 Loan Servicing Branch Offices: 2100 E. 196 th Street, Suites 100 & 200, Westfield,
Cluster Analysis. Prof. Thomas B. Fomby Department of Economics Southern Methodist University Dallas, TX April 2008 April 2010
 Cluster Analysis Prof. Thomas B. Fomby Department of Economics Southern Methodist University Dallas, TX 7575 April 008 April 010 Cluster Analysis, sometimes called data segmentation or customer segmentation,
ECLT 5810 Clustering
 ECLT 5810 Clustering What is Cluster Analysis? Cluster: a collection of data objects Similar to one another within the same cluster Dissimilar to the objects in other clusters Cluster analysis Grouping
EyeforTravel s Hotel Distribution Index. EyeforTravel s Hotel Distribution Index
 EyeforTravel s Hotel Distribution Index EyeforTravel s Hotel Distribution Index What is the Distribution Index? Eyefortravel s Hotel Distribution Index is a new service that allows you to benchmark your
5 August 22, USPS Network Optimization and First Class Mail Large Commercial Accounts Questionnaire Final August 22, 2011
 1 USPS Network Optimization and First Class Mail Large Commercial Accounts Questionnaire Final August 22, 2011 Project #J NOTE: DIRECTIONS IN BOLD UPPER CASE ARE PROGRAMMER INSTRUCTIONS; THESE INSTRUCTIONS
Ted C. Jones Chief Economist. Ted C. Jones, PhD Chief Economist
 Ted C. Jones Chief Economist Ted C. Jones, PhD Chief Economist When Getting On An Airplane, the Person On the Aisle Always Gets There First Things Change Jobs are Everything Period U.S. Jobs Jobs (Millions)