Thoracic Disease Identification and Localization with Limited Supervision
|
|
|
- Erin Robinson
- 5 years ago
- Views:
Transcription

1 Thoracic Disease Identification and Localization with Limited Supervision Zhe Li 1, Chong Wang 3, Mei Han 2, Yuan Xue 3, Wei Wei 3, Li-Jia Li 3, Li Fei-Fei 3 1 Syracuse University, 2 PingAn Technology, US Research Lab, 3 Google Inc. 1 zli89@syr.edu, 2 ex-hanmei001@pingan.com.cn, 3 {chongw, yuanxue, wewei, lijiali, feifeili}@google.com Abstract Accurate identification and localization of abnormalities from radiology images play an integral part in clinical diagnosis and treatment planning. Building a highly accurate prediction model for these tasks usually requires a large number of images manually annotated with labels and finding sites of abnormalities. In reality, however, such annotated data are expensive to acquire, especially the ones with location annotations. We need methods that can work well with only a small amount of location annotations. To address this challenge, we present a unified approach that simultaneously performs disease identification and localization through the same underlying model for all images. We demonstrate that our approach can effectively leverage both class information as well as limited location annotation, and significantly outperforms the comparative reference baseline in both classification and localization tasks. 1. Introduction Automatic image analysis is becoming an increasingly important technique to support clinical diagnosis and treatment planning. It is usually formulated as a classification problem where medical imaging abnormalities are identified as different clinical conditions [25, 4, 26, 28, 34]. In clinical practice, visual evidence that supports the classification result, such as spatial localization [2] or segmentation [35, 38] of sites of abnormalities is an indispensable part of clinical diagnosis which provides interpretation and insights. Therefore, it is of vital importance that the image analysis method is able to provide both classification results and the associated visual evidence with high accuracy. Figure 1 is an overview of our approach. We focus on chest X-ray image analysis. Our goal is to both classify the clinical conditions and identify the abnormality locations. A chest X-ray image might contain multiple sites of abnormalities with monotonous and homogeneous image features. This often leads to the inaccurate classification of clinical conditions. It is also difficult to identify the sites of This work was done when Zhe Li and Mei Han were at Google. Chest X-ray Image Unified diagnosis network Atelectasis: Cardiomegaly: Consolidation: Edema: Pathology Diagnosis Localization for Cardiomegaly Figure 1. Overview of our chest X-ray image analysis network for thoracic disease diagnosis. The network reads chest X-ray images and produces prediction scores and localization for the diseases abnormalities because of their variances in the size and location. For example, as shown in Figure 2, the presentation of Atelectasis (alveoli are deflated down) is usually limited to local regions of a lung [10] but possible to appear anywhere on both sides of lungs; while Cardiomegaly (enlarged heart) always covers half of the chest and is always around the heart. The lack of large-scale datasets also stalls the advancement of automatic chest X-ray diagnosis. Wang et al. provides one of the largest publicly available chest x-ray datasets with disease labels 1 along with a small subset with region-level annotations (bounding boxes) for evaluation [29] 2. As we know, the localization annotation is much more informative than just a single disease label to improve the model performance as demonstrated in [19]. However, getting detailed disease localization annotation can be difficult and expensive. Thus, designing models that can work well with only a small amount of localization annotation is a crucial step for the success of clinical applications. In this paper, we present a unified approach that simultaneously improves disease identification and localization with only a small amount of X-ray images containing disease location information. Figure 1 demonstrates an example of the output of our model. Unlike the standard object detection task in computer vision, we do not strictly predict bounding boxes. Instead, we produce regions that indicate the diseases, which aligns with the purpose of visualizing 1 While abnormalities, findings, clinical conditions, and diseases have distinct meanings in the medical domain, here we simply refer them as diseases and disease labels for the focused discussion in computer vision. 2 The method proposed in [29] did not use the bounding box information for localization training

![Firstly, we apply a CNN to the input image so that the model learns the information of the entire image and implicitly encodes both the class and location information for the disease [22].](/docs-images/83/87411683/images/2-1.jpg "We then slice the image into a patch grid to capture the local information of the disease.")
 problem [3] at least one patch in the image belongs to that disease.")

2 Cardiomegaly Atelectasis Figure 2. Examples of chest X-ray images with the disease bounding box. The disease regions are annotated in the yellow bounding boxes by radiologists. and interpreting the disease better. Firstly, we apply a CNN to the input image so that the model learns the information of the entire image and implicitly encodes both the class and location information for the disease [22]. We then slice the image into a patch grid to capture the local information of the disease. For an image with bounding box annotation, the learning task becomes a fully supervised problem since the disease label for each patch can be determined by the overlap between the patch and the bounding box. For an image with only a disease label, the task is formulated as a multiple instance learning (MIL) problem [3] at least one patch in the image belongs to that disease. If there is no disease in the image, all patches have to be disease-free. In this way, we have unified the disease identification and localization into the same underlying prediction model but with two different loss functions. We evaluate the model on the aforementioned chest X- ray image dataset provided in [29]. Our quantitative results show that the proposed model achieves significant accuracy improvement over the published state-of-the-art on both disease identification and localization, despite the limited number of bounding box annotations of a very small subset of the data. In addition, our qualitative results reveal a strong correspondence between the radiologist s annotations and detected disease regions, which might produce further interpretation and insights of the diseases. 2. Related Work Object detection. Following the R-CNN work [8], recent progresses has focused on processing all regions with only one shared CNN [11, 7], and on eliminating explicit region proposal methods by directly predicting the bounding boxes. In [23], Ren et al. developed a region proposal network (RPN) that regresses from anchors to regions of interest (ROIs). However, these approaches could not be easily used for images without enough annotated bounding boxes. To make the network process images much faster, Redmon et al. proposed a grid-based object detection network, YOLO, where an image is partitioned intos S grid cells, each of which is responsible to predict the coordinates and confidence scores of B bounding boxes [22]. The classification and bounding box prediction are formulated into one loss function to learn jointly. A step forward, Liu et al. partitioned the image into multiple grids with different sizes proposing a multi-box detector overcoming the weakness in YOLO and achieved better performance [20]. Similarly, these approaches are not applicable for the images without bounding boxes annotation. Even so, we still adopt the idea of handling an image as a group of grid cells and treat each patch as a classification target. Medical disease diagnosis. Zhang et al. proposed a dual-attention model using images and optional texts to make accurate prediction [33]. In [34], Zhang et al. proposed an image-to-text model to establish a direct mapping from medical images to diagnostic reports. Both models were evaluated on a dataset of bladder cancer images and corresponding diagnostic reports. Wang et al. took advantage of a large-scale chest X-ray dataset to formulate the disease diagnosis problem as multi-label classification, using class-specific image feature transformation [29]. They also applied a thresholding method to the feature map visualization [32] for each class and derived the bounding box for each disease. Their qualitative results showed that the model usually generated much larger bounding box than the ground-truth. Hwang et al. [15] proposed a self-transfer learning framework to learn localization from the globally pooled class-specific feature maps supervised by image labels. These works have the same essence with class activation mapping [36] which handles natural images. The location annotation information was not directly formulated into the loss function in the none of these works. Feature map pooling based localization did not effectively capture the precise disease regions. Multiple instance learning. In multiple instance learning (MIL), an input is a labeled bag (e.g., an image) with many instances (e.g., image patches) [3]. The label is assigned at the bag level. Wu et al. assumed each image as a dual-instance example, including its object proposals and possible text annotations [30]. The framework achieved convincing performance in vision tasks including classification and image annotation. In medical imaging domain, Yan et al. utilized a deep MIL framework for body part recognition [31]. Hou et al. first trained a CNN on image patches and then an image-level decision fusion model by patchlevel prediction histograms to generate the image-level labels [14]. By ranking the patches and defining three types of losses for different schemes, Zhu et al. proposed an endto-end deep multi-instance network to achieve mass classification for whole mammogram [37]. We are building an end-to-end unified model to make great use of both image level labels and bounding box annotations effectively. 3. Model Given images with disease labels and limited bounding box information, we aim to design a unified model that simultaneously produces disease identification and localization. We have formulated two tasks into the same underlying prediction model so that 1) it can be jointly trained end-to-end and 2) two tasks can be mutually beneficial. The proposed architecture is summarized in Figure
 (a,b) (a2,b2) (a1,b1) (a2,b1)")
 Test (d) Formulation Any image for k (Eq. 2 ) Label Prediction Figure 3. Model overview. (a) The input image is firstly processed by a CNN.")
 During training, we use multi-instance learning assumption to formulate two types of images; during testing, the model predicts both labels and class-specific localizations.")
3 (a) (b) (c) Infiltration ResNet... h Patch Slicing Recognition Network Image w/o bounding boxes h CNN Conv Features Conv Features Conv Patch Features Conv Patch Scores Image w/ bounding boxes (a1,b2) (a,b) (a2,b2) (a1,b1) (a2,b1) Bilinear Interpolation Padding=0, Stride= Max Pooling Annotated for k (Eq. 1 ) Train Non-annotated for k (Eq. 2 ) Test (d) Formulation Any image for k (Eq. 2 ) Label Prediction Figure 3. Model overview. (a) The input image is firstly processed by a CNN. (b) The patch slicing layer resizes the convolutional features from the CNN using max-pooling or bilinear interpolation. (c) These regions are then passed to a fully-convolutional recognition network. (d) During training, we use multi-instance learning assumption to formulate two types of images; during testing, the model predicts both labels and class-specific localizations. The red frame represents the ground truth bounding box. The green cells represent patches with positive labels, and brown is negative. Please note during training, for unannotated images, we assume there is at least one positive patch and the green cells shown in the figure are not deterministic Image model Convolutional neural network. As shown in Figure 3(a), we use the residual neural network (ResNet) architecture [12] given its dominant performance in ILSVRC competitions [24]. Our framework can be easily extended to any other advanced CNN models. The recent version of preact-resnet [13] is used (we call it ResNet-v2 interchangeably in this paper). After removing the final classification layer and global pooling layer, an input image with shape h w c produces a feature tensor with shapeh w c where h, w, and c are the height, width, and number of channels of the input image respectively while h = h 32, w = w 32, c = The output of this network encodes the images into a set of abstracted feature maps. Patch slicing. Our model divides the input image into P P patch grid, and for each patch, we predict K binary class probabilities, where K is the number of possible disease types. As the CNN gives c input feature maps with size of h w, we down/up sample the input feature maps top P through a patch slicing layer shown in Figure 3(b). Please note that P is an adjustable hyperparameter. In this way, a node in the same spatial location across all the feature maps corresponds to one patch of the input image. We upsample the feature maps If their sizes are smaller than expected patch grid size. Otherwise, we downsample them. Upsampling. We use a simple bilinear interpolation to upsample the feature maps to the desired patch grid size. As interpolation is, in essence, a fractionally stridden convolution, it can be performed in-network for end-to-end learning and is fast and effective [21]. A deconvolution layer [32] is not necessary to cope with this simple task. Downsampling. The bilinear interpolation makes sense for downsampling only if the scaling factor is close to1. We use max-pooling to down sample the feature maps. In general cases, the spatial size of the output volume is a function of the input width/height (w), the filter (receptive field) size (f), the stride (s), and the amount of zero padding used (p) on the border. The output width/height (o) can be obtained by w f+2p s +1. To simplify the architecture, we set p = 0 and s = 1, so thatf = w o+1. Fully convolutional recognition network. We follow [21] to use fully convolution layers as the recognition network. Its structure is shown in Figure 3(c). The c resized feature maps are firstly convolved by 3 3 filters into a smaller set of feature maps with c channels, followed by batch normalization [16] and rectified linear units (ReLU) [9]. Note that the batch normalization also regularizes the model. We set c = 512 to represent patch features. The abstracted feature maps are then passed through a 1 1 convolution layer to generate a set of P P final predictions with K channels. Each channel gives prediction scores for one class among all the patches, and the prediction for each class is normalized by a logistic function (sigmoid function) to[0,1]. The final output of our network is thep P K tensor of predictions. The image-level label prediction for each class ink is calculated acrossp P scores, which is described in Section Loss function Multi-label classification. Multiple disease types can be often identified in one chest X-ray image and these disease types are not mutually exclusive. Therefore, we define a binary classifier for each class/disease type in our model. The binary classifier outputs the class probability. Note that the binary classifier is not applied to the entire image, but to all small patches. We will show how this can translate to image-level labeling below. Joint formulation of localization and classification. 8292
4 Since we intend to build K binary classifiers, we will exemplify just one of them, for example, class k. Note that K binary classifiers will use the same features and only differ in their last logistic regression layers. The ith image x i is partitioned into a set M of patches equally, x i = [x i1,x i2,...,x im ], wherem = M = P P Images with annotated bounding boxes. As shown in Figure 3(d), suppose an image is annotated with classk and a bounding box. We denote n be the number of patches covered by the bounding box, wheren < m. Let this set be N. Each patch in the set N as positive for class k and each patch outside the bounding box as negative. Note that if a patch is covered partially by the bounding box of classk, we still consider it a positive patch for class k. The bounding box information is not lost. For the jth patch in ith image, let p k ij be the foreground probability for class k. Since all patches have their labels, the probability of an image being positive for classk is defined as, p(y k x i,bbox k i) = j N pk ij j M\N (1 pk ij ), (1) where y k is the kth network output denoting whether an image is a positive example of class k. For example, for a class other than k, this image is treated as the negative sample without a bounding box. We define a patch as positive to class k when it is overlapped with a ground-truth box, and negative otherwise. Images without annotated bounding boxes. If the ith image is labeled as class k without any bounding box, we know that there must be at least one patch classified as k to make this image a positive example of class k. Therefore, the probability of this image being positive for class k is defined as the image-level score 3, i (1 ηi)p(y k x i)log(p(y k x i)) i (1 ηi)(1 p(y k x i))log(1 p(y k x i)), (3) where i is the index of a data sample, η i is 1 when the ith sample is annotated with bounding boxes, otherwise 0. λ bbox is the factor balancing the contributions from annotated and unannotated samples. p(y k x i) {0,1} and 3 Later on, we notice an similar definition [18] for this multi-instance problem. We argue that our formulation is in a different context of solving classification and localization in a unified way for images with limited bounding box annotation. Yet, this related work can be viewed as a successful validation of our multi-instance learning based formulation. p(y k x i,bbox k i) {0,1} are the observed probabilities for class k. Obviously, p(y k x i,bbox k i) 1, thus equation 3 can be re-written as follows, L k = λ bbox i ηilog(p(y k x i,bbox k i)) i (1 ηi)p(y k x i)log(p(y k x i)) i (1 ηi)(1 p(y k x i))log(1 p(y k x i)). (4) In this way, the training is strongly supervised (per patch) by the given bounding box; it is also supervised by the image-level labels if the bounding boxes are not available. To enable end-to-end training across all classes, we sum up the class-wise loss to define the total loss as, L = k L k Localization generation The full model predicts a probability score for each patch in the input image. We define a score thresholdt s to distinguish the activated patches against the non-activated ones. If the probability score p k ij is larger than T s, we consider the jth patch in the ith image belongs to the localization for class k. We set T s = 0.5 in this work. Please note that we do not predict strict bounding boxes for the regions of disease the combined patches representing the localization information can be a non-rectangular shape Training We use ResNet-v2-50 as the image model and select the patch slicing size from {12,16,20}. The model is pretrained on the ImageNet 1000-class dataset [5] with Inception [27] preprocessing method where the image is normalized to [ 1,1] and resized to We initialize the p(y k x i ) = 1 j M (1 pk ij ). (2) CNN with the weights from the pre-trained model, which helps the model converge faster than training from scratch. At test time, we calculatep(y k x i ) by Eq. 2 as the prediction During training, we also fine-tune the image model, as we probability for classk. believe the feature distribution of medical images differs Combined loss function. Note that p(y k x i,bbox k i) and from that of natural images. We set the batch size as 5 p(y k x i ) are the image-level probabilities. The loss function to load the entire model to the GPU, train the model with for class k can be expressed as minimizing the negative log 500k iterations of minibatch, and decay the learning rate by likelihood of all observations as follows, 0.1 from every 10 epochs of training data. We add L k = λ bbox i ηip(y k x i,bbox k i)log(p(y k x i,bbox k L2 regularization to the loss function to prevent overfitting. i)) We optimize the model by Adam [17] method with asyn- λ bbox i ηi(1 p(y k x i,bbox k i))log(1 p(y k x i,bbox k i)) chronous training on 5 Nvidia P100 GPUs. The model is implemented in TensorFlow [1]. Smoothing the image-level scores. In Eq. 1 and 2, the notation denotes the product of a sequence of probability terms ([0,1]), which often leads to the a product value of 0 due to the computational underflow if m = M is large. The log loss in Eq. 3 mitigates this for Eq. 1, but does not help Eq. 2, since the log function can not directly affect its product term. To mitigate this effect, we normalize the patch scores p k ij and 1 pk ij from [0,1] to [0.98,1] to make sure the image-level scores p(y k x i,bbox k i) and p(y k x i ) smoothly varies within the range of [0, 1]. Since we are 8293
5 Disease Atelectasis Cardiomegaly Consolidation Edema Effusion Emphysema Fibrosis baseline ± ± 0.80± 0.88± 0.87± ± 0.78±0.02 Disease Hernia Infiltration Mass Nodule Pleural Thickening Pneumonia Pneumothorax baseline ± ± 0.83± 0.75± 0.79± 0.67± 0.87± Table 1. AUC scores comparison with the reference baseline model. Results are rounded to two decimal digits for table readability. Bold values denote better results. The results for the reference baseline are obtained from the latest update of [29]. thresholding the image-level scores in the experiments, we found this normalization works quite well. See supplementary material for a more detailed discussion on this. More weights on images with bounding boxes. In Eq. 4, the parameterλ bbox weighs the contribution from the images with annotated bounding boxes. Since the amount of such images is limited, and if we treat them equally with the images without bounding boxes, it often leads to worse performance. We thus increase the weight for images with bounding boxes toλ bbox = 5 by cross validation. 4. Experiments Dataset and preprocessing. NIH Chest X-ray dataset [29] consists of 112, 120 frontal-view X-ray images with 14 disease labels (each image can have multi-labels). These labels are obtained by analyzing the associated radiology reports. The disease labels are expected to have accuracy of above 90% [29]. We take the provided labels as groundtruth for training and evaluation in this work. Meanwhile, the dataset also contains 984 labelled bounding boxes for 880 images by board-certified radiologists. Note that the provided bounding boxes correspond to only 8 types of disease instances. We separate the images with provided bounding boxes from the entire dataset. Hence we have two sets of images called annotated (880 images) and unannotated (111, 240 images). We resize the original 3-channel images from to pixels for fast processing. The pixel values in each channel are normalized to[ 1,1]. We do not apply any data augmentation techniques Disease identification We conduct a 5-fold cross-validation. For each fold, we have done two experiments. In the first one, we train the model using 70% of bounding-box annotated and 70% unannotated images to compare the results with the reference model [29] (Table 1). To our knowledge, the reference model has the published state-of-the-art performance of disease identification on this dataset. In the second experiment, we explore two data ratio factors of annotated and unannotated images to demonstrate the effectiveness of the supervision provided by the bounding boxes (Figure 4). We decrease the amount of images without bounding boxes from 80% to 0% by a step of 20%. And then for each of those settings, we train our model by adding 80% or none of bounding-box annotated images. For both experiments, the model is always evaluated on the fixed 20% annotated and unannotated images for this fold. Evaluation metrics. We use AUC scores (the area under the ROC 4 curve) to measure the performance of our model [6]. A higher AUC score implies a better classifier. Comparison with the reference model. Table 1 gives the AUC scores for all the classes. We compare our results with the reference baseline fairly: we, as the reference, use ImageNet pre-trained ResNet-50 5, after which a convolution layer follows; both works use 70% images for training and 20% for testing, and we also conduct a 5-fold crossvalidation to show the robustness of our model. Compared to the reference model, our proposed model achieves better AUC scores for most diseases. The overall improvement is remarkable and the standard errors are small. The large objects, such as Cardiomegaly, Emphysema, and Pneumothorax, are as well recognized as the reference model. Nevertheless, for small objects like Mass and Nodule, the performance is significantly improved. Because our model slices the image into small patches and uses bounding boxes to supervise the training process, the patch containing small object stands out of all the patches to represent the complete image. For Hernia, there are only 227 (0.2%) samples in the dataset. These samples are not annotated with bounding boxes. Thus, the standard error is relatively larger than other diseases. Bounding box supervision improves classification performances. We consider using 0% annotated images as our own baseline (right groups in Figure 4). We use 80% annotated images (left groups in Figure 4) to compare with the our own baseline. We plot the mean performance for the cross-validation in Figure 4, the standard errors are not plotted but similar to the numbers reported in Table 1. The number of 80% annotated images is just 704, which is quite small compared to the number of 20% unannotated images (22, 248). We observe in Figure 4 that for almost all the disease types, using 80% annotated images to train the model improves the prediction performance (by comparing the bars with the same color in two groups for the same disease). For some disease types, the absolute improvement is significant (> 5%). We believe that this is because all the disease classifiers share the same underlying image model; a better-trained image model using eight disease annotations can improve all 14 classifiers performance. Specifically, some diseases, annotated and unannotated, share similar visual features. For example, Consolidation and Edema both appear as fluid accumulation 4 Here ROC is the Receiver Operating Characteristic, which measures the true positive rate (TPR) against the false positive rate (FPR) at various threshold settings (200 thresholds in this work). 5 Using ResNet-v2 [13] shows marginal performance difference for our network compared to ResNet-v1 [12] used in the reference baseline. 8294
6 AUC score AUC score Annotated Annotated % 0% 80% 0% 80% 0% 80% 0% 80% 0% 80% 0% 80% 0% Atelectasis Cardiomegaly Consolidation Edema Effusion Emphysema Fibrosis % 0% 80% 0% 80% 0% 80% 0% 80% 0% 80% 0% 80% 0% Hernia Infiltration Mass Nodule Pleural Thickening Pneumonia Pneumothorax Unannotated 80% 60% 40% 20% 0% Figure 4. AUC scores for models trained using different data combinations. Training set: annotated samples,{left: 80% (704 images), right: 0% (baseline, 0 images)} for each disease type; unannotated samples, {80% (88, 892), 60% (66, 744), 40% (44, 496), 20% (22, 248), 0%(0)} from left to right for each disease type. The evaluation set is 20% annotated and unannotated samples which are not included in the training set. No result for 0% annotated and 0% unannotated images. Using80% annotated images and certain amount of unannotated images improves the AUC score compared to using the same amount of unannotated images (same colored bars in two groups for the same disease), as the joint model benefits from the strong supervision of the tiny set of bounding box annotations in the lungs, but only Consolidation is annotated. The feature sharing enables supervision for Consolidation to improve Edema performance as well. Bounding box supervision reduces the demand of the training images. Importantly, it requires less unannotated images to achieve the similar AUC scores by using a small set of annotated images for training. As denoted with red circles in Figure 4, taking Edema as an example, using 40% (44, 496) unannotated images with 80% (704) annotated images (45, 200 in total) outperforms the performance of using only80% (88,892) unannotated images. Discussion. Generally, decreasing the amount of unannotated images (from left to right in each bar group) will degrade AUC scores accordingly in both groups of 0% and 80% annotated images. Yet as we decrease the amount of unannotated images, using annotated images for training gives smaller AUC degradation or even improvement. For example, we compare the Cardiomegaly AUC degradation for two pairs of experiments: {annotated:80%, unannotated:80% and 20%} and{annotated:0%, unannotated:80% and 20%}. The AUC degradation for the first group is just 0.07 while that for the second group is 0.12 (accuracy degradation from blue to yellow bar). When the amount of unannotated images is reduced to 0%, the performance is significantly degraded. Because under this circumstance, the training set only contains positive samples for eight disease types and lacks the positive samples of the other six. Interestingly, Cardiomegaly achieves the second best score (AUC = , the second green bar in Figure 4) when only annotated images are trained. The possible reason is that the location of cardiomegaly is always fixed to the heart covering a large area of the image and the feature distributions for enlarged hearts are similar to normal ones. Without unannotated samples, the model easily distinguishes the enlarged hearts from normal ones given supervision from bounding boxes. When the model sees hearts without annotation, the enlarged ones are disguised and fail to be recognized. As more unannotated samples are trained, the enlarged hearts are recognized again by image-level supervision (AUC from to ) Disease localization Similarly, we conduct a 5-fold cross-validation. For each fold, we have done three experiments. In the first experiment, we investigate the importance of bounding box supervision by using all the unannotated images and increasing the amount of annotated images from0% to80% by the step of 20% (Figure 5). In the second one, we fix the amount of annotated images to 80% and increase the amount of unannotated images from 0% to 100% by the step of 20% to observe whether unannotated images are able to help annotated images to improve the performance (Figure 6). At last, we train the model with 80% annotated images and half (50%) unannotated images to compare localization accuracy with the reference baseline [29] (Table 2). For each experiment, the model is always evaluated on the fixed 20% annotated images for this fold. Evaluation metrics. We evaluate the detected regions (which can be non-rectangular and discrete) against the annotated ground truth (GT) bounding boxes, using two types of measurement: intersection over union ratio (IoU) and intersection over the detected region (IoR) 6. The localization results are only calculated for those eight disease types with ground truth provided. We define a correct localization when either IoU > T(IoU) or IoR > T(IoR), where T(*) is the threshold. 6 Note that we treat discrete detected regions as one prediction region, thus IoR is analogous to intersection over the detected bounding box area ratio (IoBB). 8295
7 Atelectasis Cardiomegaly Effusion Infiltration Mass Nodule Pneumonia Pneumothorax Unannotated Annotated 0% : 100% 20% : 100% 40% : 100% 60% : 100% 80% : 100% Figure 5. Disease localization accuracy using IoR where T(IoR)=0.1. Training set: annotated samples, {0% (0), 20% (176), 40% (352), 60% (528), 80% (704)} from left to right for each disease type; unannotated samples, 100% (111, 240 images). The evaluation set is 20% annotated samples which are not included in the training set. For each disease, the accuracy is increased from left to right, as we increase the amount of annotated samples, because more annotated samples bring more bounding box supervision to the joint model Atelectasis Cardiomegaly Effusion Infiltration Mass Nodule Pneumonia Pneumothorax Annotated Unannotated 80% : 0% 80% : 20% 80% : 40% 80% : 60% 80% : 80% 80% : 100% Figure 6. Disease localization accuracy using IoR where T(IoR)=0.1. Training set: annotated samples, 80% (704 images); unannotated samples, {0% (0), 20% (22,248), 40% (44,496), 60% (66,744), 80% (88,892), 100% (111,240)} from left to right for each disease type. The evaluation set is 20% annotated samples which are not included in the training set. Using annotated samples only can produce a model which localizes some diseases. As the amount of unannotated samples increases in the training set, the localization accuracy is improved and all diseases can be localized. The joint formulation for both types of samples enables unannotated samples to improve the performance with weak supervision. Bounding box supervision is necessary for localization. We present the experiments shown in Figure 5. The threshold is set as tolerable as T(IoR)=0.1 to show the training data combination effect on the accuracy. Please refer to the supplementary material for localization performance with T(IoU)=0.1, which is similar to Figure 5. Even though the amount of the complete set of unannotated images is dominant compared with the evaluation set (111, 240 v.s. 176), without annotated images (the most left bar in each group), the model fails to generate accurate localization for most disease types. Because in this situation, the model is only supervised by image-level labels and optimized using probabilistic approximation from patch-level predictions. As we increase the amount of annotated images gradually from 0% to 80% by the step of 20% (from left to right in each group), the localization accuracy for each type is increased accordingly. We can see the necessity of bounding box supervision by observing the localization accuracy increase. Therefore, the bounding box is necessary to provide accurate localization results and the accuracy is positively proportional to the amount of annotated images. We have similar observations when T(*) varies. More unannotated data does not always mean better results for localization. In Figure 6, when we fix the amount of annotated images and increase the amount of unannotated ones for training (from left to right in each group), the localization accuracy does not increase accordingly. Some disease types achieve very high accuracy (even highest) without any unannotated images (the most left bar in each group), such as Pneumonia and Cardiomegaly. Similarly as described in the discussion of Section 4.1, unannotated images and too many negative samples degrade the localization performance for these diseases. All disease types experience an accuracy increase, a peak score, and then an accuracy fall (from orange to green bar in each group). Therefore, with bounding box supervision, unannotated images will help to achieve better results in some cases and it is not necessary to use all of them. Comparison with the reference model. In each fold, we use 80% annotated images and 50% unannotated images to train the model and evaluate on the other 20% annotated images in each fold. Since we use 5-fold crossvalidation, the complete set of annotated images has been evaluated to make a relatively fair comparison with the reference model. In Table 2, we compare our localization accuracy under varying T(IoU) with respect to the reference model in [29]. Please refer to the supplementary material for the comparison between our localization performance and the reference model with varying T(IoR). Our model predicts accurate disease regions, not only for the easy tasks like Cardiomegaly but also for the hard ones like Mass and Nodule which have very small regions. When the threshold increases, our model maintains a large accuracy lead over the reference model. For example, when evaluated by T(IoU)=0.6, our Cardiomegaly accuracy is still 73.42% while the reference model achieves only 16.03%; our Mass accuracy is 14.92% while the reference model fails to detect any Mass (0% accuracy). In clinical practice, a specialist expects as accurate localization as possible so that a higher threshold is preferred. Hence, our model outperforms the reference model with a significant improvement with less training data. Please note that as we consider discrete regions as one predicted region, the detected area and its union with GT bboxs are usually larger than the reference work which generates multiple bounding boxes. Thus for some disease types like Pneumonia, when the 8296


={0.1, 0.2, 0.3, 0.4, 0.")


, both")


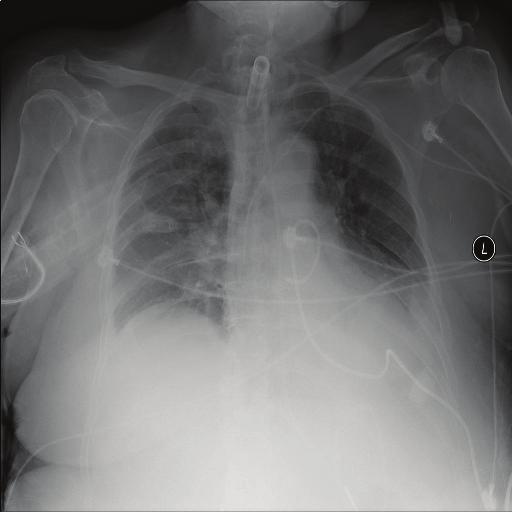

8 T(IoU) Model Atelectasis ± ± ± ± ± ± ± Cardiomegaly ± ± ± ± ± ± ± 0.05 Effusion ± ± ± ± ± ± ± 0.03 Infiltration ± ± ± ± ± ± ± 0.02 Mass ± ± ± ± ± ± ± 0.06 Nodule ± ± ± ± ± 0.03 ± ± 0.00 Pneumonia ± ± ± ± ± ± ± 0.03 Pneumothorax ± ± ± ± ± ± ± 0.03 Table 2. Disease localization accuracy comparison using IoU where T(IoU)={0.1, 0.2, 0.3, 0.4, 0.5, 0.6, 0.7}.The bold values denote the best results. Note that we round the results to two decimal digits for table readability. Using different thresholds, our model outperforms the reference baseline in most cases and remains capability of localizing diseases when the threshold is big. Mass Effusion Edema Cardiomegaly Fibrosis Consolidation Infiltration Atelectasis Pneumothorax Figure 7. Example localization visualization on the test images. The visualization is generated by rendering the final output tensor as heatmaps and overlapping on the original images. We list some thoracic diseases as examples. The left image in each pair is the original chest X-ray image and the right one is the localization result. All examples are positive for corresponding labels. We also plot the ground-truth bounding boxes in yellow on the results when they are provided in the dataset. threshold is small, our result is not as good as the reference Qualitative results Figure 7 shows exemplary localization results of the unified diagnosis model. The localization enables the explainability of chest X-ray images. It is intuitive to see that our model produces accurate localization for the diseases compared with the given ground-truth bounding boxes. Please note for Infiltration (3th and 4th images in the 3rd row of Figure 7), both sides of lungs for this patient are infiltrated. Since the dataset only has one bounding box for one disease per image, it misses annotating other bounding boxes for the same disease. Our model gives the remedy. Even though the extra region decreases the IoR/IoU score in the evaluation, but in clinical practice, it provides the specialist with suspicious candidate regions for further examination. When the localization results have no ground-truth bounding boxes to compare with, there is also a strong consistency between our results and radiological signs. For example, our model localizes the enlarged heart region (1st and 2nd images in the 2nd row) which implies Cardiomegaly, and the lung peripheries is highlighted (5th and 6th images in the 2nd row) implying Fibrosis which is in accordance with the radiological sign of the net-like shadowing of lung peripheries. The Edema (7th and 8th images in the 1st row) and Consolidation (7th and 8th images in the 2nd row) are accurately marked by our model. Edema always appears in an area that is full of small liquid effusions as the example shows. Consolidation is usually a region of compressible lung tissue that has filled with the liquid which appears as a big white area. The model successfully distinguishes both diseases which are caused by similar reason. 5. Conclusion We propose a unified model that jointly models disease identification and localization with limited localization annotation data. This is achieved through the same underlying prediction model for both tasks. Quantitative and qualitative results demonstrate that our method significantly outperforms the state-of-the-art algorithm. 8297
9 References [1] M. Abadi, A. Agarwal, P. Barham, E. Brevdo, Z. Chen, C. Citro, G. S. Corrado, A. Davis, J. Dean, M. Devin, S. Ghemawat, I. Goodfellow, A. Harp, G. Irving, M. Isard, Y. Jia, R. Jozefowicz, L. Kaiser, M. Kudlur, J. Levenberg, D. Mané, R. Monga, S. Moore, D. Murray, C. Olah, M. Schuster, J. Shlens, B. Steiner, I. Sutskever, K. Talwar, P. Tucker, V. Vanhoucke, V. Vasudevan, F. Viégas, O. Vinyals, P. Warden, M. Wattenberg, M. Wicke, Y. Yu, and X. Zheng. Tensor- Flow: Large-scale machine learning on heterogeneous systems, Software available from tensorflow.org. [2] A. Akselrod-Ballin, L. Karlinsky, S. Alpert, S. Hasoul, R. Ben-Ari, and E. Barkan. A region based convolutional network for tumor detection and classification in breast mammography. In International Workshop on Large-Scale Annotation of Biomedical Data and Expert Label Synthesis, pages Springer, [3] B. Babenko. Multiple instance learning: algorithms and applications. [4] X. Chen, Y. Xu, D. W. K. Wong, T. Y. Wong, and J. Liu. Glaucoma detection based on deep convolutional neural network. In Engineering in Medicine and Biology Society (EMBC), th Annual International Conference of the IEEE, pages IEEE, [5] J. Deng, W. Dong, R. Socher, L.-J. Li, K. Li, and L. Fei- Fei. Imagenet: A large-scale hierarchical image database. In Computer Vision and Pattern Recognition, CVPR IEEE Conference on, pages IEEE, [6] T. Fawcett. An introduction to roc analysis. Pattern recognition letters, 27(8): , [7] R. Girshick. Fast r-cnn. In Proceedings of the IEEE international conference on computer vision, pages , [8] R. Girshick, J. Donahue, T. Darrell, and J. Malik. Rich feature hierarchies for accurate object detection and semantic segmentation. In Proceedings of the IEEE conference on computer vision and pattern recognition, pages , [9] X. Glorot, A. Bordes, and Y. Bengio. Deep sparse rectifier neural networks. In Proceedings of the Fourteenth International Conference on Artificial Intelligence and Statistics, pages , [10] B. A. Gylys and M. E. Wedding. Medical terminology systems: a body systems approach. FA Davis, [11] K. He, X. Zhang, S. Ren, and J. Sun. Spatial pyramid pooling in deep convolutional networks for visual recognition. In European Conference on Computer Vision, pages Springer, [12] K. He, X. Zhang, S. Ren, and J. Sun. Deep residual learning for image recognition. In Proceedings of the IEEE conference on computer vision and pattern recognition, pages , [13] K. He, X. Zhang, S. Ren, and J. Sun. Identity mappings in deep residual networks. In European Conference on Computer Vision, pages Springer, [14] L. Hou, D. Samaras, T. M. Kurc, Y. Gao, J. E. Davis, and J. H. Saltz. Patch-based convolutional neural network for whole slide tissue image classification. In Proceedings of the IEEE Conference on Computer Vision and Pattern Recognition, pages , [15] S. Hwang and H.-E. Kim. Self-transfer learning for fully weakly supervised object localization. arxiv preprint arxiv: , [16] S. Ioffe and C. Szegedy. Batch normalization: Accelerating deep network training by reducing internal covariate shift. In International Conference on Machine Learning, pages , [17] D. Kingma and J. Ba. Adam: A method for stochastic optimization. arxiv preprint arxiv: , [18] F. Liao, M. Liang, Z. Li, X. Hu, and S. Song. Evaluate the malignancy of pulmonary nodules using the 3d deep leaky noisy-or network. arxiv preprint arxiv: , [19] C. Liu, J. Mao, F. Sha, and A. L. Yuille. Attention correctness in neural image captioning. In AAAI, pages , [20] W. Liu, D. Anguelov, D. Erhan, C. Szegedy, S. Reed, C.- Y. Fu, and A. C. Berg. Ssd: Single shot multibox detector. In European conference on computer vision, pages Springer, [21] J. Long, E. Shelhamer, and T. Darrell. Fully convolutional networks for semantic segmentation. In Proceedings of the IEEE Conference on Computer Vision and Pattern Recognition, pages , [22] J. Redmon, S. Divvala, R. Girshick, and A. Farhadi. You only look once: Unified, real-time object detection. In Proceedings of the IEEE Conference on Computer Vision and Pattern Recognition, pages , [23] S. Ren, K. He, R. Girshick, and J. Sun. Faster r-cnn: Towards real-time object detection with region proposal networks. In Advances in neural information processing systems, pages 91 99, [24] O. Russakovsky, J. Deng, H. Su, J. Krause, S. Satheesh, S. Ma, Z. Huang, A. Karpathy, A. Khosla, M. Bernstein, et al. Imagenet large scale visual recognition challenge. International Journal of Computer Vision, 115(3): , [25] J. Shi, X. Zheng, Y. Li, Q. Zhang, and S. Ying. Multimodal neuroimaging feature learning with multimodal stacked deep polynomial networks for diagnosis of alzheimer s disease. IEEE journal of biomedical and health informatics, [26] H.-C. Shin, K. Roberts, L. Lu, D. Demner-Fushman, J. Yao, and R. M. Summers. Learning to read chest x-rays: recurrent neural cascade model for automated image annotation. In Proceedings of the IEEE Conference on Computer Vision and Pattern Recognition, pages , [27] C. Szegedy, W. Liu, Y. Jia, P. Sermanet, S. Reed, D. Anguelov, D. Erhan, V. Vanhoucke, and A. Rabinovich. Going deeper with convolutions. In Proceedings of the IEEE conference on computer vision and pattern recognition, pages 1 9, [28] J. Wang, H. Ding, F. Azamian, B. Zhou, C. Iribarren, S. Molloi, and P. Baldi. Detecting cardiovascular disease from mammograms with deep learning. IEEE transactions on medical imaging, [29] X. Wang, Y. Peng, L. Lu, Z. Lu, M. Bagheri, and R. M. Summers. Chestx-ray8: Hospital-scale chest x-ray database and benchmarks on weakly-supervised classification and localization of common thorax diseases. In 2017 IEEE Conference on Computer Vision and Pattern Recognition (CVPR), pages IEEE,
10 [30] J. Wu, Y. Yu, C. Huang, and K. Yu. Deep multiple instance learning for image classification and auto-annotation. In Proceedings of the IEEE Conference on Computer Vision and Pattern Recognition, pages , [31] Z. Yan, Y. Zhan, Z. Peng, S. Liao, Y. Shinagawa, S. Zhang, D. N. Metaxas, and X. S. Zhou. Multi-instance deep learning: Discover discriminative local anatomies for bodypart recognition. IEEE transactions on medical imaging, 35(5): , [32] M. D. Zeiler and R. Fergus. Visualizing and understanding convolutional networks. In European conference on computer vision, pages Springer, [33] Z. Zhang, P. Chen, M. Sapkota, and L. Yang. Tandemnet: Distilling knowledge from medical images using diagnostic reports as optional semantic references. In International Conference on Medical Image Computing and Computer- Assisted Intervention, pages Springer, [34] Z. Zhang, Y. Xie, F. Xing, M. McGough, and L. Yang. Mdnet: a semantically and visually interpretable medical image diagnosis network. arxiv preprint arxiv: , [35] L. Zhao and K. Jia. Multiscale cnns for brain tumor segmentation and diagnosis. Computational and mathematical methods in medicine, 2016, [36] B. Zhou, A. Khosla, A. Lapedriza, A. Oliva, and A. Torralba. Learning deep features for discriminative localization. In Proceedings of the IEEE Conference on Computer Vision and Pattern Recognition, pages , [37] W. Zhu, Q. Lou, Y. S. Vang, and X. Xie. Deep multi-instance networks with sparse label assignment for whole mammogram classification. In International Conference on Medical Image Computing and Computer-Assisted Intervention, pages Springer, [38] J. Zilly, J. M. Buhmann, and D. Mahapatra. Glaucoma detection using entropy sampling and ensemble learning for automatic optic cup and disc segmentation. Computerized Medical Imaging and Graphics, 55:28 41,
Cross-domain Deep Encoding for 3D Voxels and 2D Images
 Cross-domain Deep Encoding for 3D Voxels and 2D Images Jingwei Ji Stanford University jingweij@stanford.edu Danyang Wang Stanford University danyangw@stanford.edu 1. Introduction 3D reconstruction is one
Channel Locality Block: A Variant of Squeeze-and-Excitation
 Channel Locality Block: A Variant of Squeeze-and-Excitation 1 st Huayu Li Northern Arizona University Flagstaff, United State Northern Arizona University hl459@nau.edu arxiv:1901.01493v1 [cs.lg] 6 Jan
Dynamic Routing on Deep Neural Network for Thoracic Disease Classification and Sensitive Area Localization
 Dynamic Routing on Deep Neural Network for Thoracic Disease Classification and Sensitive Area Localization Yan Shen, Mingchen Gao Department of Computer Science and Engineering, University at Buffalo Abstract.
Faster R-CNN: Towards Real-Time Object Detection with Region Proposal Networks
 Faster R-CNN: Towards Real-Time Object Detection with Region Proposal Networks Shaoqing Ren, Kaiming He, Ross Girshick, and Jian Sun Presented by Tushar Bansal Objective 1. Get bounding box for all objects
REGION AVERAGE POOLING FOR CONTEXT-AWARE OBJECT DETECTION
 REGION AVERAGE POOLING FOR CONTEXT-AWARE OBJECT DETECTION Kingsley Kuan 1, Gaurav Manek 1, Jie Lin 1, Yuan Fang 1, Vijay Chandrasekhar 1,2 Institute for Infocomm Research, A*STAR, Singapore 1 Nanyang Technological
Scene classification with Convolutional Neural Networks
 Scene classification with Convolutional Neural Networks Josh King jking9@stanford.edu Vayu Kishore vayu@stanford.edu Filippo Ranalli franalli@stanford.edu Abstract This paper approaches the problem of
Neural Networks with Input Specified Thresholds
 Neural Networks with Input Specified Thresholds Fei Liu Stanford University liufei@stanford.edu Junyang Qian Stanford University junyangq@stanford.edu Abstract In this project report, we propose a method
Feature-Fused SSD: Fast Detection for Small Objects
 Feature-Fused SSD: Fast Detection for Small Objects Guimei Cao, Xuemei Xie, Wenzhe Yang, Quan Liao, Guangming Shi, Jinjian Wu School of Electronic Engineering, Xidian University, China xmxie@mail.xidian.edu.cn
Kaggle Data Science Bowl 2017 Technical Report
 Kaggle Data Science Bowl 2017 Technical Report qfpxfd Team May 11, 2017 1 Team Members Table 1: Team members Name E-Mail University Jia Ding dingjia@pku.edu.cn Peking University, Beijing, China Aoxue Li
3D Deep Convolution Neural Network Application in Lung Nodule Detection on CT Images
 3D Deep Convolution Neural Network Application in Lung Nodule Detection on CT Images Fonova zl953@nyu.edu Abstract Pulmonary cancer is the leading cause of cancer-related death worldwide, and early stage
Object Detection Based on Deep Learning
 Object Detection Based on Deep Learning Yurii Pashchenko AI Ukraine 2016, Kharkiv, 2016 Image classification (mostly what you ve seen) http://tutorial.caffe.berkeleyvision.org/caffe-cvpr15-detection.pdf
3 Object Detection. BVM 2018 Tutorial: Advanced Deep Learning Methods. Paul F. Jaeger, Division of Medical Image Computing
 3 Object Detection BVM 2018 Tutorial: Advanced Deep Learning Methods Paul F. Jaeger, of Medical Image Computing What is object detection? classification segmentation obj. detection (1 label per pixel)
Direct Multi-Scale Dual-Stream Network for Pedestrian Detection Sang-Il Jung and Ki-Sang Hong Image Information Processing Lab.
 [ICIP 2017] Direct Multi-Scale Dual-Stream Network for Pedestrian Detection Sang-Il Jung and Ki-Sang Hong Image Information Processing Lab., POSTECH Pedestrian Detection Goal To draw bounding boxes that
Efficient Segmentation-Aided Text Detection For Intelligent Robots
 Efficient Segmentation-Aided Text Detection For Intelligent Robots Junting Zhang, Yuewei Na, Siyang Li, C.-C. Jay Kuo University of Southern California Outline Problem Definition and Motivation Related
R-FCN++: Towards Accurate Region-Based Fully Convolutional Networks for Object Detection
 The Thirty-Second AAAI Conference on Artificial Intelligence (AAAI-18) R-FCN++: Towards Accurate Region-Based Fully Convolutional Networks for Object Detection Zeming Li, 1 Yilun Chen, 2 Gang Yu, 2 Yangdong
A FRAMEWORK OF EXTRACTING MULTI-SCALE FEATURES USING MULTIPLE CONVOLUTIONAL NEURAL NETWORKS. Kuan-Chuan Peng and Tsuhan Chen
 A FRAMEWORK OF EXTRACTING MULTI-SCALE FEATURES USING MULTIPLE CONVOLUTIONAL NEURAL NETWORKS Kuan-Chuan Peng and Tsuhan Chen School of Electrical and Computer Engineering, Cornell University, Ithaca, NY
Proceedings of the International MultiConference of Engineers and Computer Scientists 2018 Vol I IMECS 2018, March 14-16, 2018, Hong Kong
 , March 14-16, 2018, Hong Kong , March 14-16, 2018, Hong Kong , March 14-16, 2018, Hong Kong , March 14-16, 2018, Hong Kong TABLE I CLASSIFICATION ACCURACY OF DIFFERENT PRE-TRAINED MODELS ON THE TEST DATA
Tracking by recognition using neural network
 Zhiliang Zeng, Ying Kin Yu, and Kin Hong Wong,"Tracking by recognition using neural network",19th IEEE/ACIS International Conference on Software Engineering, Artificial Intelligence, Networking and Parallel/Distributed
Mask R-CNN. presented by Jiageng Zhang, Jingyao Zhan, Yunhan Ma
 Mask R-CNN presented by Jiageng Zhang, Jingyao Zhan, Yunhan Ma Mask R-CNN Background Related Work Architecture Experiment Mask R-CNN Background Related Work Architecture Experiment Background From left
Detecting Thoracic Diseases from Chest X-Ray Images Binit Topiwala, Mariam Alawadi, Hari Prasad { topbinit, malawadi, hprasad
 CS 229, Fall 2017 1 Detecting Thoracic Diseases from Chest X-Ray Images Binit Topiwala, Mariam Alawadi, Hari Prasad { topbinit, malawadi, hprasad }@stanford.edu Abstract Radiologists have to spend time
Spatial Localization and Detection. Lecture 8-1
 Lecture 8: Spatial Localization and Detection Lecture 8-1 Administrative - Project Proposals were due on Saturday Homework 2 due Friday 2/5 Homework 1 grades out this week Midterm will be in-class on Wednesday
Finding Tiny Faces Supplementary Materials
 Finding Tiny Faces Supplementary Materials Peiyun Hu, Deva Ramanan Robotics Institute Carnegie Mellon University {peiyunh,deva}@cs.cmu.edu 1. Error analysis Quantitative analysis We plot the distribution
Lecture 5: Object Detection
 Object Detection CSED703R: Deep Learning for Visual Recognition (2017F) Lecture 5: Object Detection Bohyung Han Computer Vision Lab. bhhan@postech.ac.kr 2 Traditional Object Detection Algorithms Region-based
An Accurate and Real-time Self-blast Glass Insulator Location Method Based On Faster R-CNN and U-net with Aerial Images
 1 An Accurate and Real-time Self-blast Glass Insulator Location Method Based On Faster R-CNN and U-net with Aerial Images Zenan Ling 2, Robert C. Qiu 1,2, Fellow, IEEE, Zhijian Jin 2, Member, IEEE Yuhang
arxiv: v1 [cs.cv] 25 Aug 2018
![arxiv: v1 [cs.cv] 25 Aug 2018](/thumbs/93/112131672.jpg "arxiv: v1 [cs.cv] 25 Aug 2018") Painting Outside the Box: Image Outpainting with GANs Mark Sabini and Gili Rusak Stanford University {msabini, gilir}@cs.stanford.edu arxiv:1808.08483v1 [cs.cv] 25 Aug 2018 Abstract The challenging task
Painting Outside the Box: Image Outpainting with GANs Mark Sabini and Gili Rusak Stanford University {msabini, gilir}@cs.stanford.edu arxiv:1808.08483v1 [cs.cv] 25 Aug 2018 Abstract The challenging task
YOLO9000: Better, Faster, Stronger
 YOLO9000: Better, Faster, Stronger Date: January 24, 2018 Prepared by Haris Khan (University of Toronto) Haris Khan CSC2548: Machine Learning in Computer Vision 1 Overview 1. Motivation for one-shot object
MULTI-SCALE OBJECT DETECTION WITH FEATURE FUSION AND REGION OBJECTNESS NETWORK. Wenjie Guan, YueXian Zou*, Xiaoqun Zhou
 MULTI-SCALE OBJECT DETECTION WITH FEATURE FUSION AND REGION OBJECTNESS NETWORK Wenjie Guan, YueXian Zou*, Xiaoqun Zhou ADSPLAB/Intelligent Lab, School of ECE, Peking University, Shenzhen,518055, China
Real-time Object Detection CS 229 Course Project
 Real-time Object Detection CS 229 Course Project Zibo Gong 1, Tianchang He 1, and Ziyi Yang 1 1 Department of Electrical Engineering, Stanford University December 17, 2016 Abstract Objection detection
Object detection with CNNs
 Object detection with CNNs 80% PASCAL VOC mean0average0precision0(map) 70% 60% 50% 40% 30% 20% 10% Before CNNs After CNNs 0% 2006 2007 2008 2009 2010 2011 2012 2013 2014 2015 2016 year Region proposals
Content-Based Image Recovery
 Content-Based Image Recovery Hong-Yu Zhou and Jianxin Wu National Key Laboratory for Novel Software Technology Nanjing University, China zhouhy@lamda.nju.edu.cn wujx2001@nju.edu.cn Abstract. We propose
[Supplementary Material] Improving Occlusion and Hard Negative Handling for Single-Stage Pedestrian Detectors
![[Supplementary Material] Improving Occlusion and Hard Negative Handling for Single-Stage Pedestrian Detectors](/thumbs/89/97941029.jpg "[Supplementary Material] Improving Occlusion and Hard Negative Handling for Single-Stage Pedestrian Detectors") [Supplementary Material] Improving Occlusion and Hard Negative Handling for Single-Stage Pedestrian Detectors Junhyug Noh Soochan Lee Beomsu Kim Gunhee Kim Department of Computer Science and Engineering
[Supplementary Material] Improving Occlusion and Hard Negative Handling for Single-Stage Pedestrian Detectors Junhyug Noh Soochan Lee Beomsu Kim Gunhee Kim Department of Computer Science and Engineering
Detecting Bone Lesions in Multiple Myeloma Patients using Transfer Learning
 Detecting Bone Lesions in Multiple Myeloma Patients using Transfer Learning Matthias Perkonigg 1, Johannes Hofmanninger 1, Björn Menze 2, Marc-André Weber 3, and Georg Langs 1 1 Computational Imaging Research
Lecture 7: Semantic Segmentation
 Semantic Segmentation CSED703R: Deep Learning for Visual Recognition (207F) Segmenting images based on its semantic notion Lecture 7: Semantic Segmentation Bohyung Han Computer Vision Lab. bhhanpostech.ac.kr
3D Densely Convolutional Networks for Volumetric Segmentation. Toan Duc Bui, Jitae Shin, and Taesup Moon
 3D Densely Convolutional Networks for Volumetric Segmentation Toan Duc Bui, Jitae Shin, and Taesup Moon School of Electronic and Electrical Engineering, Sungkyunkwan University, Republic of Korea arxiv:1709.03199v2
arxiv: v1 [cs.cv] 15 Oct 2018
![arxiv: v1 [cs.cv] 15 Oct 2018](/thumbs/89/99052786.jpg "arxiv: v1 [cs.cv] 15 Oct 2018") Instance Segmentation and Object Detection with Bounding Shape Masks Ha Young Kim 1,2,*, Ba Rom Kang 2 1 Department of Financial Engineering, Ajou University Worldcupro 206, Yeongtong-gu, Suwon, 16499,
Instance Segmentation and Object Detection with Bounding Shape Masks Ha Young Kim 1,2,*, Ba Rom Kang 2 1 Department of Financial Engineering, Ajou University Worldcupro 206, Yeongtong-gu, Suwon, 16499,
Deep Tracking: Biologically Inspired Tracking with Deep Convolutional Networks
 Deep Tracking: Biologically Inspired Tracking with Deep Convolutional Networks Si Chen The George Washington University sichen@gwmail.gwu.edu Meera Hahn Emory University mhahn7@emory.edu Mentor: Afshin
SSD: Single Shot MultiBox Detector. Author: Wei Liu et al. Presenter: Siyu Jiang
 SSD: Single Shot MultiBox Detector Author: Wei Liu et al. Presenter: Siyu Jiang Outline 1. Motivations 2. Contributions 3. Methodology 4. Experiments 5. Conclusions 6. Extensions Motivation Motivation
Deep Residual Architecture for Skin Lesion Segmentation
 Deep Residual Architecture for Skin Lesion Segmentation Venkatesh G M 1, Naresh Y G 1, Suzanne Little 2, and Noel O Connor 2 1 Insight Centre for Data Analystics-DCU, Dublin, Ireland 2 Dublin City University,
Yiqi Yan. May 10, 2017
 Yiqi Yan May 10, 2017 P a r t I F u n d a m e n t a l B a c k g r o u n d s Convolution Single Filter Multiple Filters 3 Convolution: case study, 2 filters 4 Convolution: receptive field receptive field
Traffic Multiple Target Detection on YOLOv2
 Traffic Multiple Target Detection on YOLOv2 Junhong Li, Huibin Ge, Ziyang Zhang, Weiqin Wang, Yi Yang Taiyuan University of Technology, Shanxi, 030600, China wangweiqin1609@link.tyut.edu.cn Abstract Background
Automatic Detection of Multiple Organs Using Convolutional Neural Networks
 Automatic Detection of Multiple Organs Using Convolutional Neural Networks Elizabeth Cole University of Massachusetts Amherst Amherst, MA ekcole@umass.edu Sarfaraz Hussein University of Central Florida
Extend the shallow part of Single Shot MultiBox Detector via Convolutional Neural Network
 Extend the shallow part of Single Shot MultiBox Detector via Convolutional Neural Network Liwen Zheng, Canmiao Fu, Yong Zhao * School of Electronic and Computer Engineering, Shenzhen Graduate School of
3D model classification using convolutional neural network
 3D model classification using convolutional neural network JunYoung Gwak Stanford jgwak@cs.stanford.edu Abstract Our goal is to classify 3D models directly using convolutional neural network. Most of existing
arxiv: v1 [cs.cv] 31 Mar 2016
![arxiv: v1 [cs.cv] 31 Mar 2016](/thumbs/92/108399479.jpg "arxiv: v1 [cs.cv] 31 Mar 2016") Object Boundary Guided Semantic Segmentation Qin Huang, Chunyang Xia, Wenchao Zheng, Yuhang Song, Hao Xu and C.-C. Jay Kuo arxiv:1603.09742v1 [cs.cv] 31 Mar 2016 University of Southern California Abstract.
Object Boundary Guided Semantic Segmentation Qin Huang, Chunyang Xia, Wenchao Zheng, Yuhang Song, Hao Xu and C.-C. Jay Kuo arxiv:1603.09742v1 [cs.cv] 31 Mar 2016 University of Southern California Abstract.
Show, Discriminate, and Tell: A Discriminatory Image Captioning Model with Deep Neural Networks
 Show, Discriminate, and Tell: A Discriminatory Image Captioning Model with Deep Neural Networks Zelun Luo Department of Computer Science Stanford University zelunluo@stanford.edu Te-Lin Wu Department of
Multi-Glance Attention Models For Image Classification
 Multi-Glance Attention Models For Image Classification Chinmay Duvedi Stanford University Stanford, CA cduvedi@stanford.edu Pararth Shah Stanford University Stanford, CA pararth@stanford.edu Abstract We
SUMMARY. in the task of supervised automatic seismic interpretation. We evaluate these tasks qualitatively and quantitatively.
 Deep learning seismic facies on state-of-the-art CNN architectures Jesper S. Dramsch, Technical University of Denmark, and Mikael Lüthje, Technical University of Denmark SUMMARY We explore propagation
Object Detection. CS698N Final Project Presentation AKSHAT AGARWAL SIDDHARTH TANWAR
 Object Detection CS698N Final Project Presentation AKSHAT AGARWAL SIDDHARTH TANWAR Problem Description Arguably the most important part of perception Long term goals for object recognition: Generalization
Deep learning for object detection. Slides from Svetlana Lazebnik and many others
 Deep learning for object detection Slides from Svetlana Lazebnik and many others Recent developments in object detection 80% PASCAL VOC mean0average0precision0(map) 70% 60% 50% 40% 30% 20% 10% Before deep
Unified, real-time object detection
 Unified, real-time object detection Final Project Report, Group 02, 8 Nov 2016 Akshat Agarwal (13068), Siddharth Tanwar (13699) CS698N: Recent Advances in Computer Vision, Jul Nov 2016 Instructor: Gaurav
Facial Key Points Detection using Deep Convolutional Neural Network - NaimishNet
 1 Facial Key Points Detection using Deep Convolutional Neural Network - NaimishNet Naimish Agarwal, IIIT-Allahabad (irm2013013@iiita.ac.in) Artus Krohn-Grimberghe, University of Paderborn (artus@aisbi.de)
Supplementary material for Analyzing Filters Toward Efficient ConvNet
 Supplementary material for Analyzing Filters Toward Efficient Net Takumi Kobayashi National Institute of Advanced Industrial Science and Technology, Japan takumi.kobayashi@aist.go.jp A. Orthonormal Steerable
Cascade Region Regression for Robust Object Detection
 Large Scale Visual Recognition Challenge 2015 (ILSVRC2015) Cascade Region Regression for Robust Object Detection Jiankang Deng, Shaoli Huang, Jing Yang, Hui Shuai, Zhengbo Yu, Zongguang Lu, Qiang Ma, Yali
REVISITING DISTRIBUTED SYNCHRONOUS SGD
 REVISITING DISTRIBUTED SYNCHRONOUS SGD Jianmin Chen, Rajat Monga, Samy Bengio & Rafal Jozefowicz Google Brain Mountain View, CA, USA {jmchen,rajatmonga,bengio,rafalj}@google.com 1 THE NEED FOR A LARGE
Deep Learning in Visual Recognition. Thanks Da Zhang for the slides
 Deep Learning in Visual Recognition Thanks Da Zhang for the slides Deep Learning is Everywhere 2 Roadmap Introduction Convolutional Neural Network Application Image Classification Object Detection Object
arxiv: v2 [cs.cv] 23 May 2016
![arxiv: v2 [cs.cv] 23 May 2016](/thumbs/88/115196824.jpg "arxiv: v2 [cs.cv] 23 May 2016") Localizing by Describing: Attribute-Guided Attention Localization for Fine-Grained Recognition arxiv:1605.06217v2 [cs.cv] 23 May 2016 Xiao Liu Jiang Wang Shilei Wen Errui Ding Yuanqing Lin Baidu Research
Localizing by Describing: Attribute-Guided Attention Localization for Fine-Grained Recognition arxiv:1605.06217v2 [cs.cv] 23 May 2016 Xiao Liu Jiang Wang Shilei Wen Errui Ding Yuanqing Lin Baidu Research
Bounding Out-of-Sample Objects A weakly-supervised approach
 Bounding Out-of-Sample Objects A weakly-supervised approach Li Quan Khoo Stanford University (SCPD) lqkhoo@stanford.edu Abstract In the context of image processing, the most salient parts of the image
Know your data - many types of networks
 Architectures Know your data - many types of networks Fixed length representation Variable length representation Online video sequences, or samples of different sizes Images Specific architectures for
Supplementary Material: Unconstrained Salient Object Detection via Proposal Subset Optimization
 Supplementary Material: Unconstrained Salient Object via Proposal Subset Optimization 1. Proof of the Submodularity According to Eqns. 10-12 in our paper, the objective function of the proposed optimization
Fully Convolutional Networks for Semantic Segmentation
 Fully Convolutional Networks for Semantic Segmentation Jonathan Long* Evan Shelhamer* Trevor Darrell UC Berkeley Chaim Ginzburg for Deep Learning seminar 1 Semantic Segmentation Define a pixel-wise labeling
SELF SUPERVISED DEEP REPRESENTATION LEARNING FOR FINE-GRAINED BODY PART RECOGNITION
 SELF SUPERVISED DEEP REPRESENTATION LEARNING FOR FINE-GRAINED BODY PART RECOGNITION Pengyue Zhang Fusheng Wang Yefeng Zheng Medical Imaging Technologies, Siemens Medical Solutions USA Inc., Princeton,
Tiny ImageNet Visual Recognition Challenge
 Tiny ImageNet Visual Recognition Challenge Ya Le Department of Statistics Stanford University yle@stanford.edu Xuan Yang Department of Electrical Engineering Stanford University xuany@stanford.edu Abstract
RSRN: Rich Side-output Residual Network for Medial Axis Detection
 RSRN: Rich Side-output Residual Network for Medial Axis Detection Chang Liu, Wei Ke, Jianbin Jiao, and Qixiang Ye University of Chinese Academy of Sciences, Beijing, China {liuchang615, kewei11}@mails.ucas.ac.cn,
Elastic Neural Networks for Classification
 Elastic Neural Networks for Classification Yi Zhou 1, Yue Bai 1, Shuvra S. Bhattacharyya 1, 2 and Heikki Huttunen 1 1 Tampere University of Technology, Finland, 2 University of Maryland, USA arxiv:1810.00589v3
Learning Spatio-Temporal Features with 3D Residual Networks for Action Recognition
 Learning Spatio-Temporal Features with 3D Residual Networks for Action Recognition Kensho Hara, Hirokatsu Kataoka, Yutaka Satoh National Institute of Advanced Industrial Science and Technology (AIST) Tsukuba,
Computer Vision Lecture 16
 Announcements Computer Vision Lecture 16 Deep Learning Applications 11.01.2017 Seminar registration period starts on Friday We will offer a lab course in the summer semester Deep Robot Learning Topic:
Computer Vision Lecture 16
 Computer Vision Lecture 16 Deep Learning Applications 11.01.2017 Bastian Leibe RWTH Aachen http://www.vision.rwth-aachen.de leibe@vision.rwth-aachen.de Announcements Seminar registration period starts
INTRODUCTION TO DEEP LEARNING
 INTRODUCTION TO DEEP LEARNING CONTENTS Introduction to deep learning Contents 1. Examples 2. Machine learning 3. Neural networks 4. Deep learning 5. Convolutional neural networks 6. Conclusion 7. Additional
Supervised Learning of Classifiers
 Supervised Learning of Classifiers Carlo Tomasi Supervised learning is the problem of computing a function from a feature (or input) space X to an output space Y from a training set T of feature-output
Pedestrian Detection based on Deep Fusion Network using Feature Correlation
 Pedestrian Detection based on Deep Fusion Network using Feature Correlation Yongwoo Lee, Toan Duc Bui and Jitae Shin School of Electronic and Electrical Engineering, Sungkyunkwan University, Suwon, South
Computer Vision Lecture 16
 Computer Vision Lecture 16 Deep Learning for Object Categorization 14.01.2016 Bastian Leibe RWTH Aachen http://www.vision.rwth-aachen.de leibe@vision.rwth-aachen.de Announcements Seminar registration period
In Defense of Fully Connected Layers in Visual Representation Transfer
 In Defense of Fully Connected Layers in Visual Representation Transfer Chen-Lin Zhang, Jian-Hao Luo, Xiu-Shen Wei, Jianxin Wu National Key Laboratory for Novel Software Technology, Nanjing University,
Supplementary Material: Unsupervised Domain Adaptation for Face Recognition in Unlabeled Videos
 Supplementary Material: Unsupervised Domain Adaptation for Face Recognition in Unlabeled Videos Kihyuk Sohn 1 Sifei Liu 2 Guangyu Zhong 3 Xiang Yu 1 Ming-Hsuan Yang 2 Manmohan Chandraker 1,4 1 NEC Labs
Volumetric and Multi-View CNNs for Object Classification on 3D Data Supplementary Material
 Volumetric and Multi-View CNNs for Object Classification on 3D Data Supplementary Material Charles R. Qi Hao Su Matthias Nießner Angela Dai Mengyuan Yan Leonidas J. Guibas Stanford University 1. Details
arxiv: v1 [cs.cv] 29 Sep 2016
![arxiv: v1 [cs.cv] 29 Sep 2016](/thumbs/76/73787064.jpg "arxiv: v1 [cs.cv] 29 Sep 2016") arxiv:1609.09545v1 [cs.cv] 29 Sep 2016 Two-stage Convolutional Part Heatmap Regression for the 1st 3D Face Alignment in the Wild (3DFAW) Challenge Adrian Bulat and Georgios Tzimiropoulos Computer Vision
arxiv:1609.09545v1 [cs.cv] 29 Sep 2016 Two-stage Convolutional Part Heatmap Regression for the 1st 3D Face Alignment in the Wild (3DFAW) Challenge Adrian Bulat and Georgios Tzimiropoulos Computer Vision
Mimicking Very Efficient Network for Object Detection
 Mimicking Very Efficient Network for Object Detection Quanquan Li 1, Shengying Jin 2, Junjie Yan 1 1 SenseTime 2 Beihang University liquanquan@sensetime.com, jsychffy@gmail.com, yanjunjie@outlook.com Abstract
Encoder-Decoder Networks for Semantic Segmentation. Sachin Mehta
 Encoder-Decoder Networks for Semantic Segmentation Sachin Mehta Outline > Overview of Semantic Segmentation > Encoder-Decoder Networks > Results What is Semantic Segmentation? Input: RGB Image Output:
Mask R-CNN. Kaiming He, Georgia, Gkioxari, Piotr Dollar, Ross Girshick Presenters: Xiaokang Wang, Mengyao Shi Feb. 13, 2018
 Mask R-CNN Kaiming He, Georgia, Gkioxari, Piotr Dollar, Ross Girshick Presenters: Xiaokang Wang, Mengyao Shi Feb. 13, 2018 1 Common computer vision tasks Image Classification: one label is generated for
arxiv: v1 [cs.cv] 26 Jun 2017
![arxiv: v1 [cs.cv] 26 Jun 2017](/thumbs/80/82184026.jpg "arxiv: v1 [cs.cv] 26 Jun 2017") Detecting Small Signs from Large Images arxiv:1706.08574v1 [cs.cv] 26 Jun 2017 Zibo Meng, Xiaochuan Fan, Xin Chen, Min Chen and Yan Tong Computer Science and Engineering University of South Carolina, Columbia,
Detecting Small Signs from Large Images arxiv:1706.08574v1 [cs.cv] 26 Jun 2017 Zibo Meng, Xiaochuan Fan, Xin Chen, Min Chen and Yan Tong Computer Science and Engineering University of South Carolina, Columbia,
A Method to Estimate the Energy Consumption of Deep Neural Networks
 A Method to Estimate the Consumption of Deep Neural Networks Tien-Ju Yang, Yu-Hsin Chen, Joel Emer, Vivienne Sze Massachusetts Institute of Technology, Cambridge, MA, USA {tjy, yhchen, jsemer, sze}@mit.edu
CIS680: Vision & Learning Assignment 2.b: RPN, Faster R-CNN and Mask R-CNN Due: Nov. 21, 2018 at 11:59 pm
 CIS680: Vision & Learning Assignment 2.b: RPN, Faster R-CNN and Mask R-CNN Due: Nov. 21, 2018 at 11:59 pm Instructions This is an individual assignment. Individual means each student must hand in their
arxiv: v1 [cs.cv] 6 Jul 2016
![arxiv: v1 [cs.cv] 6 Jul 2016](/thumbs/80/81416563.jpg "arxiv: v1 [cs.cv] 6 Jul 2016") arxiv:607.079v [cs.cv] 6 Jul 206 Deep CORAL: Correlation Alignment for Deep Domain Adaptation Baochen Sun and Kate Saenko University of Massachusetts Lowell, Boston University Abstract. Deep neural networks
arxiv:607.079v [cs.cv] 6 Jul 206 Deep CORAL: Correlation Alignment for Deep Domain Adaptation Baochen Sun and Kate Saenko University of Massachusetts Lowell, Boston University Abstract. Deep neural networks
Object Detection with YOLO on Artwork Dataset
 Object Detection with YOLO on Artwork Dataset Yihui He Computer Science Department, Xi an Jiaotong University heyihui@stu.xjtu.edu.cn Abstract Person: 0.64 Horse: 0.28 I design a small object detection
Hand Detection For Grab-and-Go Groceries
 Hand Detection For Grab-and-Go Groceries Xianlei Qiu Stanford University xianlei@stanford.edu Shuying Zhang Stanford University shuyingz@stanford.edu Abstract Hands detection system is a very critical
CEA LIST s participation to the Scalable Concept Image Annotation task of ImageCLEF 2015
 CEA LIST s participation to the Scalable Concept Image Annotation task of ImageCLEF 2015 Etienne Gadeski, Hervé Le Borgne, and Adrian Popescu CEA, LIST, Laboratory of Vision and Content Engineering, France
Convolutional Neural Networks. Computer Vision Jia-Bin Huang, Virginia Tech
 Convolutional Neural Networks Computer Vision Jia-Bin Huang, Virginia Tech Today s class Overview Convolutional Neural Network (CNN) Training CNN Understanding and Visualizing CNN Image Categorization:
Study of Residual Networks for Image Recognition
 Study of Residual Networks for Image Recognition Mohammad Sadegh Ebrahimi Stanford University sadegh@stanford.edu Hossein Karkeh Abadi Stanford University hosseink@stanford.edu Abstract Deep neural networks
arxiv: v1 [cs.cv] 5 Oct 2015
![arxiv: v1 [cs.cv] 5 Oct 2015](/thumbs/71/66021937.jpg "arxiv: v1 [cs.cv] 5 Oct 2015") Efficient Object Detection for High Resolution Images Yongxi Lu 1 and Tara Javidi 1 arxiv:1510.01257v1 [cs.cv] 5 Oct 2015 Abstract Efficient generation of high-quality object proposals is an essential
Efficient Object Detection for High Resolution Images Yongxi Lu 1 and Tara Javidi 1 arxiv:1510.01257v1 [cs.cv] 5 Oct 2015 Abstract Efficient generation of high-quality object proposals is an essential
Mind the regularized GAP, for human action classification and semi-supervised localization based on visual saliency.
 Mind the regularized GAP, for human action classification and semi-supervised localization based on visual saliency. Marc Moreaux123, Natalia Lyubova1, Isabelle Ferrane 2 and Frederic Lerasle3 1 Softbank
arxiv: v1 [cs.cv] 18 Jun 2017
![arxiv: v1 [cs.cv] 18 Jun 2017](/thumbs/75/72105835.jpg "arxiv: v1 [cs.cv] 18 Jun 2017") Using Deep Networks for Drone Detection arxiv:1706.05726v1 [cs.cv] 18 Jun 2017 Cemal Aker, Sinan Kalkan KOVAN Research Lab. Computer Engineering, Middle East Technical University Ankara, Turkey Abstract
Using Deep Networks for Drone Detection arxiv:1706.05726v1 [cs.cv] 18 Jun 2017 Cemal Aker, Sinan Kalkan KOVAN Research Lab. Computer Engineering, Middle East Technical University Ankara, Turkey Abstract
Structured Prediction using Convolutional Neural Networks
 Overview Structured Prediction using Convolutional Neural Networks Bohyung Han bhhan@postech.ac.kr Computer Vision Lab. Convolutional Neural Networks (CNNs) Structured predictions for low level computer
Modern Convolutional Object Detectors
 Modern Convolutional Object Detectors Faster R-CNN, R-FCN, SSD 29 September 2017 Presented by: Kevin Liang Papers Presented Faster R-CNN: Towards Real-Time Object Detection with Region Proposal Networks
Instance-aware Semantic Segmentation via Multi-task Network Cascades
 Instance-aware Semantic Segmentation via Multi-task Network Cascades Jifeng Dai, Kaiming He, Jian Sun Microsoft research 2016 Yotam Gil Amit Nativ Agenda Introduction Highlights Implementation Further
Visual Inspection of Storm-Water Pipe Systems using Deep Convolutional Neural Networks
 Visual Inspection of Storm-Water Pipe Systems using Deep Convolutional Neural Networks Ruwan Tennakoon, Reza Hoseinnezhad, Huu Tran and Alireza Bab-Hadiashar School of Engineering, RMIT University, Melbourne,
Faster R-CNN: Towards Real-Time Object Detection with Region Proposal Networks
 Faster R-CNN: Towards Real-Time Object Detection with Region Proposal Networks Shaoqing Ren Kaiming He Ross Girshick Jian Sun Present by: Yixin Yang Mingdong Wang 1 Object Detection 2 1 Applications Basic
arxiv: v1 [cs.cv] 14 Jul 2017
![arxiv: v1 [cs.cv] 14 Jul 2017](/thumbs/74/70463879.jpg "arxiv: v1 [cs.cv] 14 Jul 2017") Temporal Modeling Approaches for Large-scale Youtube-8M Video Understanding Fu Li, Chuang Gan, Xiao Liu, Yunlong Bian, Xiang Long, Yandong Li, Zhichao Li, Jie Zhou, Shilei Wen Baidu IDL & Tsinghua University
Temporal Modeling Approaches for Large-scale Youtube-8M Video Understanding Fu Li, Chuang Gan, Xiao Liu, Yunlong Bian, Xiang Long, Yandong Li, Zhichao Li, Jie Zhou, Shilei Wen Baidu IDL & Tsinghua University
Smart Parking System using Deep Learning. Sheece Gardezi Supervised By: Anoop Cherian Peter Strazdins
 Smart Parking System using Deep Learning Sheece Gardezi Supervised By: Anoop Cherian Peter Strazdins Content Labeling tool Neural Networks Visual Road Map Labeling tool Data set Vgg16 Resnet50 Inception_v3
Machine Learning. Deep Learning. Eric Xing (and Pengtao Xie) , Fall Lecture 8, October 6, Eric CMU,
 , Fall Lecture 8, October 6, Eric CMU,") Machine Learning 10-701, Fall 2015 Deep Learning Eric Xing (and Pengtao Xie) Lecture 8, October 6, 2015 Eric Xing @ CMU, 2015 1 A perennial challenge in computer vision: feature engineering SIFT Spin image
Machine Learning 10-701, Fall 2015 Deep Learning Eric Xing (and Pengtao Xie) Lecture 8, October 6, 2015 Eric Xing @ CMU, 2015 1 A perennial challenge in computer vision: feature engineering SIFT Spin image
Machine Learning 13. week
 Machine Learning 13. week Deep Learning Convolutional Neural Network Recurrent Neural Network 1 Why Deep Learning is so Popular? 1. Increase in the amount of data Thanks to the Internet, huge amount of
Towards Real-Time Automatic Number Plate. Detection: Dots in the Search Space
 Towards Real-Time Automatic Number Plate Detection: Dots in the Search Space Chi Zhang Department of Computer Science and Technology, Zhejiang University wellyzhangc@zju.edu.cn Abstract Automatic Number