Stability comparison of dimensionality reduction techniques attending to data and parameter variations
|
|
|
- Morgan Porter
- 5 years ago
- Views:
Transcription
1 Eurographics Conference on Visualization (EuroVis) (2013) M. Hlawitschka and T. Weinkauf (Editors) Short Papers Stability comparison of dimensionality reduction techniques attending to data and parameter variations Francisco J. García-Fernández 1,2, Michel Verleysen 2, John A. Lee 2 and Ignacio Díaz 1 1 University of Oviedo, Spain 2 Université Catholique de Louvain, Belgium Abstract The analysis of the big volumes of data requires efficient and robust dimension reduction techniques to represent data into lower-dimensional spaces, which ease human understanding. This paper presents a study of the stability, robustness and performance of some of these dimension reduction algorithms with respect to algorithm and data parameters, which usually have a major influence in the resulting embeddings. This analysis includes the performance of a large panel of techniques on both artificial and real datasets, focusing on the geometrical variations experimented when changing different parameters. The results are presented by identifying the visual weaknesses of each technique, providing some suitable data-processing tasks to enhance the stability. Categories and Subject Descriptors (according to ACM CCS): Intelligence Machine learning I.2.6 [Computing Methodologies]: Artificial 1. Introduction The technological evolution in recent years has resulted in an unprecedented generalization of data sources, which usually implies not only better, but also bigger datasets. Social networks and open data initiatives are clear examples of this new trend. For many economic sectors, these huge amounts of data include potential information, which usually is hidden and therefore it is necessary to be extracted. As a consequence, this requires having suitable techniques for analyzing and visualizing all these data. As these data are typically high-dimensional and so they can not be visualized directly in a two/three dimensional lattice, dimensionality reduction (DR) techniques play a key role, making a transformation of these data into a meaningful, visualizable and reduceddimensional space. Dimensionality reduction includes techniques that allow the user to obtain meaningful data representations of a given dimensionality, improving the process of comprehension and analysis of data. In this field, several techniques have been proposed we only focus on unsupervised techniques. Principal Component Analysis (PCA) [Jol05] or Multidimensional Scaling (MDS) [Tor52, YH38] are well-known examples of linear DR techniques. Although linear techniques usually perform well, they fail when working with complex datasets, which lie on a nonlinear manifold. In these cases, nonlinear techniques performs better as they have the ability to deal with this kind of data. Nonlinear DR techniques [LV07] started to appear later, especially with nonlinear variants of multidimensional scaling [Sam69] and neural approaches [KSH01, DH97]. In recent years, the evolution in the DR field has focused on spectral techniques, such as [TSL00], Local Linear Embedding (L) [RS00], Laplacian Eigenmaps () [BN03], and non-convex techniques, such as Stochastic Neighbor Embedding (SNE) [HR02] and t-distributed Stochastic Neighbor Embedding () [vdmh08]. These modern DR techniques are usually known as manifold learning algorithms [TDBET98]. This paper contributes to the study the stability of unsupervised DR techniques with respect to variations of their parameters and of the data. In contrast to [KYO12], where the authors present a study the stability by introducing a perturbation to data, this paper focuses on answering question referring to both data and parameters. The reminder of this paper is organized as follows. Section 2 introduces the motivation and the aim of this work. Section 3 describes the experimental methodology and a description of the data used. Section 4 illustrates the results. Finally Section 5 ends up with the conclusions.
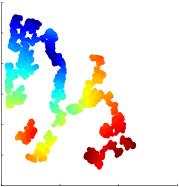
2 2. Stability of dimensionality reduction techniques Dimensionality reduction transforms a set of N highdimensional vectors, X = [x i ] 1 i<n, into N low-dimensional vectors (d << D), Y = [y i ] 1 i<n. Mathematically, a DR technique can be understood as an application f : R D R d, where d < D. Thereby, the main idea of DR is to keep faraway the points which are very dissimilar in the input space, while keeping close the ones that are near to each other in the original lattice. In order to better understand the stability of DR techniques, it is necessary to take into account the way the embedding is constructed. One of the simplest approaches to data projection is to preserve pairwise distances, either using an appropriate metric [Sam69,DH97] or using a probabilitybased approach [HR02, vdmh08], obtaining a pairwise distance or dissimilarity matrix respectively. However, the previous approaches cannot be applied if the pairwise distance matrix has unknown elements. In this case, an alternative is to compute a graph model of the data, whose edges depend on the known elements of the pairwise distance matrix. Particularly, this method can also be applied when all the elements of the pairwise matrix distance are known, like in many manifold learning algorithms. Finally, the embedding can be obtained from this model whether retaining the global [TSL00] or the local structure of data [RS00, BN03]. If the stability of DR algorithms is analyzed attending to parameter and data variations, some behaviors are expected. For instance, graph-based solutions have a major drawback if the constructed graph is not completely connected a typical situation with clustered datasets, even if the complete pairwise distance matrix is known. In this case, they are not capable of reducing the complete dataset X, whereas methods based on pairwise distances or similarity matrices are. Moreover, the behavior of various graph-based algorithms may differ. Local-based graphs have a larger dependency on small changes in the data points than global-based ones. If adding a moderate number of new points heavily modifies the representation, this is considered as negative for visualization purposes, because there is no continuity in the resulting embeddings. Regarding the way the embedding is solved, two major alternatives exist [vdmpvdh09]. On the one hand, convex techniques minimization of a convex cost function, such as, L or, involve an eigenvalue decomposition. The mathematical procedure introduces indeterminacies in the embeddings, which can lead to irrelevant geometric transformations like mirroring, rotation and translation of the projection between different results. On the other hand, non-convex techniques minimization of a non-convex cost function, e.g. SNE or, use the gradient descent algorithm in order to obtain the final projection. The problem with these algorithms comes from the randomness introduced in the process: the initialization is random for all nonconvex techniques, and the way in which the data points are presented in each iteration is also random only in stochastic gradient descent algorithm, so it is difficult to obtain comparable projection under the same conditions. From the visual analytics point of view, some behaviors are desired [War08]. Perception and cognition are important parts of the process of visual analytics and it is necessary to take them into account in order to select the most suitable technique for a visual analytics application. Thereby, some of the behaviors previously described about the performances of DR techniques are not good for this process. Geometric variations e.g. rotation, translation,... in the projection make the analysis for the user difficult. Internally, the human brain needs to revert these transformations in order to ease the comparison of projections, slowing the process. Thus, it is necessary that the DR techniques take into account this fact. These geometric transformations include not only the variations caused by the algorithm, but also the discontinuity when changing some data or algorithm parameters, such as the order of the data points or the neighborhood parameter respectively. Apart from these, other requirements for DR techniques in the visual analytics field can be related to time computation. Particularly in the case of interactive applications, the time between the action of the user and change in the display must be the shortest possible, so if the algorithm is timeconsuming, maybe it is not suitable for interactive purposes. The study made in this paper intends to provide an initial approach to helping in the selection of a suitable algorithm that combines a good dimensionality reduction performance and good visualization features. 3. Experimental methodology In this section, we describe the experiments and the methodology applied, as well as the processing tasks we propose for improving the stability of DR techniques Dimensionality Reduction Techniques analyzed In order to evaluate the stability and robustness of the DR techniques, we propose the following experiments. Each experiment focuses on different desired features for the application of DR techniques in the visual analytic field. The experiments are carried out on four well-known synthetic datasets: S-curve, Swiss roll, helix and twin-peaks, and two natural datasets, MNIST [LBBHov] and Olivetti faces [SH94] (see Figure 1). In this analysis, we select six DR techniques, which are enumerated below. The settings of the techniques for the experiments are shown in Table 1. Principal component analysis (PCA) [Jol05]. [TSL00]. Laplacian Eigenmaps () [BN03].
![Locally Linear Embedding (L) [RS00]. Stochastic Neighbor Embedding (SNE) [HR02]. t-distributed Stochastic Neighbor Embedding () [vdmh08].](/docs-images/87/96355892/images/3-0.jpg "S curve Helix MNIST Swiss Roll Twin Peaks Olivetti faces Figure 1: Datasets used for the stability comparison.")
3 Locally Linear Embedding (L) [RS00]. Stochastic Neighbor Embedding (SNE) [HR02]. t-distributed Stochastic Neighbor Embedding () [vdmh08]. S curve Helix MNIST Swiss Roll Twin Peaks Olivetti faces Figure 1: Datasets used for the stability comparison. Technique Parameters Settings PCA None None L SNE k: number of neighbors Perplexity (P): size of a k-ary neighbor 4 < k < 40 4 < P < 40 Table 1: Parameter settings for the experiments Experiment description A detailed description of each experiment applied to the data is shown below. On the one hand, Experiments 1 and 2 are related to each technique in order to study the influence of the parameters in the resulting embeddings. On the other hand, Experiments 3 and 4 are oriented to common scenarios when working with natural datasets. Experiment 1. This experiment focuses on analysing the influence of the order in which the data points are introduced to the DR algorithm. Datasets of 1000 points are introduced in different random orders, with the aim of analyzing the geometric variations experimented by the techniques. Experiment 2. For this experiment, the objective is to study the stability of the DR techniques under changes in their parameters (see Table 1). Thus we test the behavior of the DR techniques using identical datasets, analyzing their visual continuity in the resulting projections for a wide set of values for the parameters. Experiment 3. We apply this experiment regarding the performance of DR techniques when working with incrementally changing datasets. Starting from a dataset of 800 points, we increase the number of points in several steps observing the transformations generated by each technique. Experiment 4. In this case, the experiment aims at analyzing the variations observed when datasets from the same topological space, but with different points, are projected, in order to study which technique yields the more stable results. In order to improve the stability and robustness of the selected DR algorithms, we propose two simple, easily applicable and low computational pre- and post-processing methods. 1. In the case of convex techniques, we propose the use of Procrustes Analysis [Ken89]. This algorithm is a mathematical procedure in statistical shape analysis that allows one to analyze a set of shapes. Basically, this method computes the rotation matrix and the translation vector of each projection, according to a projection considered as the baseline. Since this algorithm makes a point-by-point comparison, it can only be used with datasets that share them, so it does not apply to Experiment For non-convex techniques, our approach focuses on controlling the initialization of the algorithms, fixing the initial conditions by fixing the random seed used to generate them, while using a stochastic gradient descent algorithm to obtain the optimal solution. This semi-random approach can control the initialization, while the random introduction of the points helps to avoid local minima. It is important to point out that our approach is a postprocessing task in the case of convex techniques, while in non-convex algorithms, the method is a pre-processing. 4. Results Due to paper length constrains, only the most relevant results are shown in Figure 2. For Exp. 1 (Figure 2, top left), we show the results for, L, whose performance is similar to, and t- SNE, similar to SNE. The general behavior of the techniques is reasonably stable, excluding due to the randomness in the initialization, whose performance is really improved with the pre-processing. In the case of convex techniques, the approach proposed, based on Procrustes Analysis, is able of aligning the embedding in a suitable way, avoiding geometrical transformations. Referring to the influence of the parameters (Figure 2, top righ), the behavior of similar to L is more unstable than or. As it can bee seen in Figure 2, the continuity in the case of is better than, which also tends to obtain cluttered visualization. In the case of convex techniques, the semi-random approach gives more stability to the projections obtained than with a random initialization. When working with incrementally changing datasets (Figure 2, bottom left),, and L are not always capable of obtaining a fully connected graph if the number of points is not large enough, while this problem does not appear in PCA or. Concerning this experiment, the


 k=5 k=11 k=19 k=25 A B A (Random seed 1)")


 A P=5 K=11 P=30 K=19 P=33")


, the")


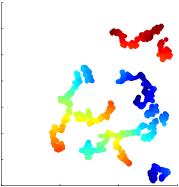


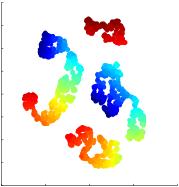
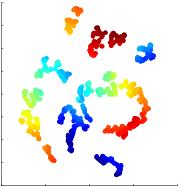
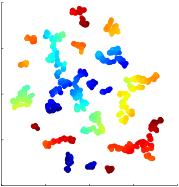

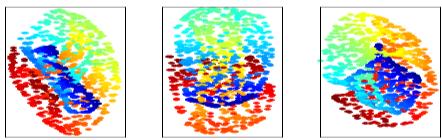


4 García-Fernández et al. / Stability comparison of dimensionality reduction techniques attending to data and parameter variations Experiment 2: Influence of parameter Experiment 1: Order of data (P=13) (k=5) k=5 k=11 k=19 k=25 A B A (Random seed 1) B (Random seed 2) k=5 B A (Fixed seed) w/ Procrustes P=21 P=29 k=7 k=13 R.S. 1 R.S. 2 R.S. 3 R.S. 4 k=17 B (Fixed seed) R.S.: Random seed B: Same input data, randomly permuted A: Original Input data. N=1500 N=1000 N=2000 SNE N=2000 D.2 D.3 D.1 D.2 D.3 K=11 P=10 D.1 k=33 P=30 K=17 P=13 k=7 : Fixed Seed Experiment 4: Same distribution Experiment 3: Incrementally changing dataset N=1000 P=13 w/ Procrustes L (k=11) A P=5 K=11 P=30 K=19 P=33 P=10 PCA D: Distribution Figure 2: Relevant results obtained from the experimental methodology proposed for the Swiss roll dataset. Notice that framed projections corresponds to processed results with Procrustes Analysis and the semi-random approach. post-processing in improves the continuity between projections with the same perplexity. Also, it is important to emphasize that if the number of points in the dataset is large, the influence of the parameter is lower. In Experiment 4 (Figure 2, bottom righ), the projection of graph-based techniques, and L may differ a lot depending on the data, while in the case of SNE and or PCA, which is not shown, the projections are reasonably stable for the same parameter. 5. Conclusions and future work In this paper, we present a study of the analysis of stability of unsupervised dimensionality reduction techniques under variations in data and in the parameters of the algorithms. The analysis is achieved through different experiments over several artificial and natural datasets. As a general conclusion, local methods and L, which retain local structure of data are more likely to be influenced by small changes in both data and parameter variations. They also tend to provide cluttered visualizations, whereas data points in, and PCA are much more scattered., due to the nature of its gradient, tends to form small clusters in the embedding. It is interesting to point out that if the visualization of the whole dataset is a major requirement, graph-based techniques are not a good solution, as the construction of the graph can lead to not fully-connected graphs and so not all points will be embedded. On the other, PCA, and SNE are not affected by this problem. Among them, the quality of the embedding is usually better in and SNE, particularly when working with non-linear manifolds. Our approaches to improving the stability of DR techniques obtain satisfying results. The Procrustes Analysis algorithm applied to convex techniques performs well in most of the cases, although it has a major dependence on the projection chosen as the baseline for the geometric transformation. In the case of non-convex techniques, the semirandom approach proposed makes a stronger control of the final shape, leading to more comparable projections. As a future work, some possible directions are promising. Particularly, the application of the methodologies proposed in this paper to visual analytics tools in order to ease the knowledge discovery process by stabilizing the projections, as well as the extension of the study including other an outof-sample comparison, supervised techniques and the definition of a metric of stability for DR techniques. Acknowledgement This work has been financed by the Spanish Ministry of Science and Education and FEDER funds under grants DPI C02-01 and by the Government of Asturias. J.A.Lee is a Research Associate with the Belgian F.R.S.FNRS (Fonds National de la Recherche Scientifique). c The Eurographics Association 2013.
5 References [BN03] BELKIN M., NIYOGI P.: Laplacian eigenmaps for dimensionality reduction and data representation. Neural Computation 15, 6 (June 2003), , 2 [DH97] DEMARTINES P., HERAULT J.: Curvilinear component analysis: a self-organizing neural network for nonlinear mapping of data sets. IEEE Trans. on Neural Networks 8, 1 (Jan. 1997), , 2 [HR02] HINTON G., ROWEIS S.: Stochastic neighbor embedding. Advances in neural information processing systems 15 (2002), , 2, 3 [Jol05] JOLLIFFE I.: Principal component analysis. Wiley Online Library, , 2 [Ken89] KENDALL D. G.: A survey of the statistical theory of shape. Statistical Science 4, 2 (1989), [KSH01] KOHONEN T., SCHROEDER M. R., HUANG T. S. (Eds.): Self-Organizing Maps, 3rd ed. Springer-Verlag New York, Inc., Secaucus, NJ, USA, [KYO12] KHODER J., YOUNES R., OUEZDOU F. B.: Stability of dimensionality reduction methods applied on artificial hyperspectral images. In Computer Vision and Graphics, Bolc L., Tadeusiewicz R., Chmielewski L. J., Wojciechowski K., (Eds.), no in Lecture Notes in Computer Science. Springer Berlin Heidelberg, Jan. 2012, pp [LBBHov] CUN Y., BOTTOU L., BENGIO Y., HAFFNER P.: Gradient-based learning applied to document recognition. Proceedings of the IEEE 86, 11 (Nov), [LV07] E J., VERYSEN M.: Nonlinear dimensionality reduction. Springer, [RS00] ROWEIS S. T., SAUL L. K.: Nonlinear dimensionality reduction by locally linear embedding. Science 290, 5500 (Dec. 2000), , 2, 3 [Sam69] SAMMON J.W. J.: A nonlinear mapping for data structure analysis. Computers, IEEE Transactions on C-18, 5 (may 1969), , 2 [SH94] SAMARIA F. S., HARTER A. C.: Parameterisation of a stochastic model for human face identification. In Applications of Computer Vision, Proceedings of the Second IEEE Workshop on (1994), pp [TDBET98] TOLLIS I. G., DI BATTISTA G., EADES P., TAMAS- SIA R.: Graph Drawing: Algorithms for the Visualization of Graphs. Prentice Hall, July [Tor52] TORGERSON W.: Multidimensional scaling: I. theory and method. Psychometrika 17, 4 (1952), [TSL00] TENENBAUM J. B., SILVA V. D., LANGFORD J. C.: A global geometric framework for nonlinear dimensionality reduction. Science 290, 5500 (Dec. 2000), , 2 [vdmh08] VAN DER MAATEN L., HINTON G.: Visualizing data using. Journal of Machine Learning Research 9 (Nov. 2008), , 2, 3 [vdmpvdh09] VAN DER MAATEN L., POSTMA E., VAN DEN HERIK J.: Dimensionality reduction: A comparative review, [War08] WARE C.: Visual thinking for design. Morgan Kaufmann Pub, [YH38] YOUNG G., HOUSEHOLDER A.: Discussion of a set of points in terms of their mutual distances. Psychometrika 3, 1 (1938),
Sensitivity to parameter and data variations in dimensionality reduction techniques
 Sensitivity to parameter and data variations in dimensionality reduction techniques Francisco J. García-Fernández 1,2,MichelVerleysen 2, John A. Lee 3 and Ignacio Díaz 1 1- Univ. of Oviedo - Department
Curvilinear Distance Analysis versus Isomap
 Curvilinear Distance Analysis versus Isomap John Aldo Lee, Amaury Lendasse, Michel Verleysen Université catholique de Louvain Place du Levant, 3, B-1348 Louvain-la-Neuve, Belgium {lee,verleysen}@dice.ucl.ac.be,
Locality Preserving Projections (LPP) Abstract
 Abstract") Locality Preserving Projections (LPP) Xiaofei He Partha Niyogi Computer Science Department Computer Science Department The University of Chicago The University of Chicago Chicago, IL 60615 Chicago, IL
Locality Preserving Projections (LPP) Xiaofei He Partha Niyogi Computer Science Department Computer Science Department The University of Chicago The University of Chicago Chicago, IL 60615 Chicago, IL
Isometric Mapping Hashing
 Isometric Mapping Hashing Yanzhen Liu, Xiao Bai, Haichuan Yang, Zhou Jun, and Zhihong Zhang Springer-Verlag, Computer Science Editorial, Tiergartenstr. 7, 692 Heidelberg, Germany {alfred.hofmann,ursula.barth,ingrid.haas,frank.holzwarth,
Nonlinear projections. Motivation. High-dimensional. data are. Perceptron) ) or RBFN. Multi-Layer. Example: : MLP (Multi(
 ) or RBFN. Multi-Layer. Example: : MLP (Multi(") Nonlinear projections Université catholique de Louvain (Belgium) Machine Learning Group http://www.dice.ucl ucl.ac.be/.ac.be/mlg/ 1 Motivation High-dimensional data are difficult to represent difficult
Nonlinear projections Université catholique de Louvain (Belgium) Machine Learning Group http://www.dice.ucl ucl.ac.be/.ac.be/mlg/ 1 Motivation High-dimensional data are difficult to represent difficult
Robust Pose Estimation using the SwissRanger SR-3000 Camera
 Robust Pose Estimation using the SwissRanger SR- Camera Sigurjón Árni Guðmundsson, Rasmus Larsen and Bjarne K. Ersbøll Technical University of Denmark, Informatics and Mathematical Modelling. Building,
Non-linear dimension reduction
 Sta306b May 23, 2011 Dimension Reduction: 1 Non-linear dimension reduction ISOMAP: Tenenbaum, de Silva & Langford (2000) Local linear embedding: Roweis & Saul (2000) Local MDS: Chen (2006) all three methods
Selecting Models from Videos for Appearance-Based Face Recognition
 Selecting Models from Videos for Appearance-Based Face Recognition Abdenour Hadid and Matti Pietikäinen Machine Vision Group Infotech Oulu and Department of Electrical and Information Engineering P.O.
Technical Report. Title: Manifold learning and Random Projections for multi-view object recognition
 Technical Report Title: Manifold learning and Random Projections for multi-view object recognition Authors: Grigorios Tsagkatakis 1 and Andreas Savakis 2 1 Center for Imaging Science, Rochester Institute
How to project circular manifolds using geodesic distances?
 How to project circular manifolds using geodesic distances? John Aldo Lee, Michel Verleysen Université catholique de Louvain Place du Levant, 3, B-1348 Louvain-la-Neuve, Belgium {lee,verleysen}@dice.ucl.ac.be
Dimension Reduction CS534
 Dimension Reduction CS534 Why dimension reduction? High dimensionality large number of features E.g., documents represented by thousands of words, millions of bigrams Images represented by thousands of
Local multidimensional scaling with controlled tradeoff between trustworthiness and continuity
 Local multidimensional scaling with controlled tradeoff between trustworthiness and continuity Jaro Venna and Samuel Kasi, Neural Networs Research Centre Helsini University of Technology Espoo, Finland
Manifold Learning for Video-to-Video Face Recognition
 Manifold Learning for Video-to-Video Face Recognition Abstract. We look in this work at the problem of video-based face recognition in which both training and test sets are video sequences, and propose
Courtesy of Prof. Shixia University
 Courtesy of Prof. Shixia Liu @Tsinghua University Outline Introduction Classification of Techniques Table Scatter Plot Matrices Projections Parallel Coordinates Summary Motivation Real world data contain
Effects of sparseness and randomness of pairwise distance matrix on t-sne results
 ESANN proceedings, European Symposium on Artificial Neural Networks, Computational Intelligence and Machine Learning. Bruges (Belgium), -9 April, idoc.com publ., ISBN 9--9--. Available from http://www.idoc.com/en/livre/?gcoi=.
CSE 6242 A / CX 4242 DVA. March 6, Dimension Reduction. Guest Lecturer: Jaegul Choo
 CSE 6242 A / CX 4242 DVA March 6, 2014 Dimension Reduction Guest Lecturer: Jaegul Choo Data is Too Big To Analyze! Limited memory size! Data may not be fitted to the memory of your machine! Slow computation!
CSE 6242 A / CS 4803 DVA. Feb 12, Dimension Reduction. Guest Lecturer: Jaegul Choo
 CSE 6242 A / CS 4803 DVA Feb 12, 2013 Dimension Reduction Guest Lecturer: Jaegul Choo CSE 6242 A / CS 4803 DVA Feb 12, 2013 Dimension Reduction Guest Lecturer: Jaegul Choo Data is Too Big To Do Something..
SELECTION OF THE OPTIMAL PARAMETER VALUE FOR THE LOCALLY LINEAR EMBEDDING ALGORITHM. Olga Kouropteva, Oleg Okun and Matti Pietikäinen
 SELECTION OF THE OPTIMAL PARAMETER VALUE FOR THE LOCALLY LINEAR EMBEDDING ALGORITHM Olga Kouropteva, Oleg Okun and Matti Pietikäinen Machine Vision Group, Infotech Oulu and Department of Electrical and
Head Frontal-View Identification Using Extended LLE
 Head Frontal-View Identification Using Extended LLE Chao Wang Center for Spoken Language Understanding, Oregon Health and Science University Abstract Automatic head frontal-view identification is challenging
The Analysis of Parameters t and k of LPP on Several Famous Face Databases
 The Analysis of Parameters t and k of LPP on Several Famous Face Databases Sujing Wang, Na Zhang, Mingfang Sun, and Chunguang Zhou College of Computer Science and Technology, Jilin University, Changchun
Large-Scale Face Manifold Learning
 Large-Scale Face Manifold Learning Sanjiv Kumar Google Research New York, NY * Joint work with A. Talwalkar, H. Rowley and M. Mohri 1 Face Manifold Learning 50 x 50 pixel faces R 2500 50 x 50 pixel random
Linear and Non-linear Dimentionality Reduction Applied to Gene Expression Data of Cancer Tissue Samples
 Linear and Non-linear Dimentionality Reduction Applied to Gene Expression Data of Cancer Tissue Samples Franck Olivier Ndjakou Njeunje Applied Mathematics, Statistics, and Scientific Computation University
Visualizing Data using t-sne
 Journal of Machine Learning Research 9 (2008) Submitted 5/08; Published Visualizing Data using t-sne Laurens van der Maaten MICC-IKAT Maastricht University P.O. Box 616, 6200 MD Maastricht, The Netherlands
ManiSonS: A New Visualization Tool for Manifold Clustering
 ManiSonS: A New Visualization Tool for Manifold Clustering José M. Martínez-Martínez, Pablo Escandell-Montero, José D.Martín-Guerrero, Joan Vila-Francés and Emilio Soria-Olivas IDAL, Intelligent Data Analysis
Feature Extraction of High-Dimensional Structures for Exploratory Analytics
 Feature Extraction of High-Dimensional Structures for Exploratory Analytics by Andrew M. Neiderer ARL-TN-531 April 2013 Approved for public release; distribution is unlimited. NOTICES Disclaimers The findings
ESANN'2006 proceedings - European Symposium on Artificial Neural Networks Bruges (Belgium), April 2006, d-side publi., ISBN
, April 2006, d-side publi., ISBN") ESANN'26 proceedings - European Symposium on Artificial Neural Networks Bruges (Belgium), 26-28 April 26, d-side publi., ISBN 2-9337-6-4. Visualizing the trustworthiness of a projection Michaël Aupetit
ESANN'26 proceedings - European Symposium on Artificial Neural Networks Bruges (Belgium), 26-28 April 26, d-side publi., ISBN 2-9337-6-4. Visualizing the trustworthiness of a projection Michaël Aupetit
Supervised Variable Clustering for Classification of NIR Spectra
 Supervised Variable Clustering for Classification of NIR Spectra Catherine Krier *, Damien François 2, Fabrice Rossi 3, Michel Verleysen, Université catholique de Louvain, Machine Learning Group, place
Globally and Locally Consistent Unsupervised Projection
 Proceedings of the Twenty-Eighth AAAI Conference on Artificial Intelligence Globally and Locally Consistent Unsupervised Projection Hua Wang, Feiping Nie, Heng Huang Department of Electrical Engineering
Manifold Clustering. Abstract. 1. Introduction
 Manifold Clustering Richard Souvenir and Robert Pless Washington University in St. Louis Department of Computer Science and Engineering Campus Box 1045, One Brookings Drive, St. Louis, MO 63130 {rms2,
Lecture Topic Projects
 Lecture Topic Projects 1 Intro, schedule, and logistics 2 Applications of visual analytics, basic tasks, data types 3 Introduction to D3, basic vis techniques for non-spatial data Project #1 out 4 Data
Evgeny Maksakov Advantages and disadvantages: Advantages and disadvantages: Advantages and disadvantages: Advantages and disadvantages:
 Today Problems with visualizing high dimensional data Problem Overview Direct Visualization Approaches High dimensionality Visual cluttering Clarity of representation Visualization is time consuming Dimensional
Assessment of Dimensionality Reduction Based on Communication Channel Model; Application to Immersive Information Visualization
 Assessment of Dimensionality Reduction Based on Communication Channel Model; Application to Immersive Information Visualization Mohammadreza Babaee, Mihai Datcu and Gerhard Rigoll Institute for Human-Machine
CSE 6242 / CX October 9, Dimension Reduction. Guest Lecturer: Jaegul Choo
 CSE 6242 / CX 4242 October 9, 2014 Dimension Reduction Guest Lecturer: Jaegul Choo Volume Variety Big Data Era 2 Velocity Veracity 3 Big Data are High-Dimensional Examples of High-Dimensional Data Image
Learning a Manifold as an Atlas Supplementary Material
 Learning a Manifold as an Atlas Supplementary Material Nikolaos Pitelis Chris Russell School of EECS, Queen Mary, University of London [nikolaos.pitelis,chrisr,lourdes]@eecs.qmul.ac.uk Lourdes Agapito
Nonlinear dimensionality reduction of large datasets for data exploration
 Data Mining VII: Data, Text and Web Mining and their Business Applications 3 Nonlinear dimensionality reduction of large datasets for data exploration V. Tomenko & V. Popov Wessex Institute of Technology,
Cluster Analysis and Visualization. Workshop on Statistics and Machine Learning 2004/2/6
 Cluster Analysis and Visualization Workshop on Statistics and Machine Learning 2004/2/6 Outlines Introduction Stages in Clustering Clustering Analysis and Visualization One/two-dimensional Data Histogram,
Image Similarities for Learning Video Manifolds. Selen Atasoy MICCAI 2011 Tutorial
 Image Similarities for Learning Video Manifolds Selen Atasoy MICCAI 2011 Tutorial Image Spaces Image Manifolds Tenenbaum2000 Roweis2000 Tenenbaum2000 [Tenenbaum2000: J. B. Tenenbaum, V. Silva, J. C. Langford:
Extended Isomap for Pattern Classification
 From: AAAI- Proceedings. Copyright, AAAI (www.aaai.org). All rights reserved. Extended for Pattern Classification Ming-Hsuan Yang Honda Fundamental Research Labs Mountain View, CA 944 myang@hra.com Abstract
Non-Local Manifold Tangent Learning
 Non-Local Manifold Tangent Learning Yoshua Bengio and Martin Monperrus Dept. IRO, Université de Montréal P.O. Box 1, Downtown Branch, Montreal, H3C 3J7, Qc, Canada {bengioy,monperrm}@iro.umontreal.ca Abstract
Visualizing the quality of dimensionality reduction
 Visualizing the quality of dimensionality reduction Bassam Mokbel 1, Wouter Lueks 2, Andrej Gisbrecht 1, Michael Biehl 2, Barbara Hammer 1 1) Bielefeld University - CITEC Centre of Excellence, Germany
Automatic Group-Outlier Detection
 Automatic Group-Outlier Detection Amine Chaibi and Mustapha Lebbah and Hanane Azzag LIPN-UMR 7030 Université Paris 13 - CNRS 99, av. J-B Clément - F-93430 Villetaneuse {firstname.secondname}@lipn.univ-paris13.fr
Remote Sensing Data Classification Using Combined Spectral and Spatial Local Linear Embedding (CSSLE)
") 2016 International Conference on Artificial Intelligence and Computer Science (AICS 2016) ISBN: 978-1-60595-411-0 Remote Sensing Data Classification Using Combined Spectral and Spatial Local Linear Embedding
2016 International Conference on Artificial Intelligence and Computer Science (AICS 2016) ISBN: 978-1-60595-411-0 Remote Sensing Data Classification Using Combined Spectral and Spatial Local Linear Embedding
Sparse Manifold Clustering and Embedding
 Sparse Manifold Clustering and Embedding Ehsan Elhamifar Center for Imaging Science Johns Hopkins University ehsan@cis.jhu.edu René Vidal Center for Imaging Science Johns Hopkins University rvidal@cis.jhu.edu
Recognizing Handwritten Digits Using the LLE Algorithm with Back Propagation
 Recognizing Handwritten Digits Using the LLE Algorithm with Back Propagation Lori Cillo, Attebury Honors Program Dr. Rajan Alex, Mentor West Texas A&M University Canyon, Texas 1 ABSTRACT. This work is
Automatic Alignment of Local Representations
 Automatic Alignment of Local Representations Yee Whye Teh and Sam Roweis Department of Computer Science, University of Toronto ywteh,roweis @cs.toronto.edu Abstract We present an automatic alignment procedure
An Intelligent Clustering Algorithm for High Dimensional and Highly Overlapped Photo-Thermal Infrared Imaging Data
 An Intelligent Clustering Algorithm for High Dimensional and Highly Overlapped Photo-Thermal Infrared Imaging Data Nian Zhang and Lara Thompson Department of Electrical and Computer Engineering, University
REPRESENTATION OF BIG DATA BY DIMENSION REDUCTION
 Fundamental Journal of Mathematics and Mathematical Sciences Vol. 4, Issue 1, 2015, Pages 23-34 This paper is available online at http://www.frdint.com/ Published online November 29, 2015 REPRESENTATION
Iterative Non-linear Dimensionality Reduction by Manifold Sculpting
 Iterative Non-linear Dimensionality Reduction by Manifold Sculpting Mike Gashler, Dan Ventura, and Tony Martinez Brigham Young University Provo, UT 84604 Abstract Many algorithms have been recently developed
Support Vector Machines for visualization and dimensionality reduction
 Support Vector Machines for visualization and dimensionality reduction Tomasz Maszczyk and W lodzis law Duch Department of Informatics, Nicolaus Copernicus University, Toruń, Poland tmaszczyk@is.umk.pl;google:w.duch
Geometrical homotopy for data visualization
 Geometrical homotopy for data visualization Diego H. Peluffo-Ordo n ez 1, Juan C. Alvarado-Pe rez 2, John A. Lee 3,4, and Michel Verleysen 3 1- Eslinga research group, Faculty of Engineering Universidad
Nonlinear Dimensionality Reduction Applied to the Classification of Images
 onlinear Dimensionality Reduction Applied to the Classification of Images Student: Chae A. Clark (cclark8 [at] math.umd.edu) Advisor: Dr. Kasso A. Okoudjou (kasso [at] math.umd.edu) orbert Wiener Center
Constrained Optimization of the Stress Function for Multidimensional Scaling
 Constrained Optimization of the Stress Function for Multidimensional Scaling Vydunas Saltenis Institute of Mathematics and Informatics Akademijos 4, LT-08663 Vilnius, Lithuania Saltenis@ktlmiilt Abstract
Manifold Spanning Graphs
 Manifold Spanning Graphs CJ Carey and Sridhar Mahadevan School of Computer Science University of Massachusetts, Amherst Amherst, Massachusetts, 01003 {ccarey,mahadeva}@cs.umass.edu Abstract Graph construction
A Stochastic Optimization Approach for Unsupervised Kernel Regression
 A Stochastic Optimization Approach for Unsupervised Kernel Regression Oliver Kramer Institute of Structural Mechanics Bauhaus-University Weimar oliver.kramer@uni-weimar.de Fabian Gieseke Institute of Structural
Free Projection SOM: A New Method For SOM-Based Cluster Visualization
 Free Projection SOM: A New Method For SOM-Based Cluster Visualization 1 ABDEL-BADEEH M. SALEM 1, EMAD MONIER, KHALED NAGATY Computer Science Department Ain Shams University Faculty of Computer & Information
User control for adjusting conflicting objectives in parameter-dependent visualization of data
 Eurographics Conference on Visualization (EuroVis) (2013) M. Hlawitschka and T. Weinkauf (Editors) Short Papers User control for adjusting conflicting objectives in parameter-dependent visualization of
Appearance Manifold of Facial Expression
 Appearance Manifold of Facial Expression Caifeng Shan, Shaogang Gong and Peter W. McOwan Department of Computer Science Queen Mary, University of London, London E1 4NS, UK {cfshan, sgg, pmco}@dcs.qmul.ac.uk
Interactive dimensionality reduction of large datasets using interpolation
 ESANN 218 proceedings, European Symposium on Artificial Neural Networks, Computational Intelligence and Machine Learning. Bruges (Belgium), 2-27 April 218, i6doc.com publ., ISBN 978-2878747-6. Interactive
Stability Assessment of Electric Power Systems using Growing Neural Gas and Self-Organizing Maps
 Stability Assessment of Electric Power Systems using Growing Gas and Self-Organizing Maps Christian Rehtanz, Carsten Leder University of Dortmund, 44221 Dortmund, Germany Abstract. Liberalized competitive
Generalized Principal Component Analysis CVPR 2007
 Generalized Principal Component Analysis Tutorial @ CVPR 2007 Yi Ma ECE Department University of Illinois Urbana Champaign René Vidal Center for Imaging Science Institute for Computational Medicine Johns
Non-Local Estimation of Manifold Structure
 Non-Local Estimation of Manifold Structure Yoshua Bengio, Martin Monperrus and Hugo Larochelle Département d Informatique et Recherche Opérationnelle Centre de Recherches Mathématiques Université de Montréal
AUTOMATIC PATTERN CLASSIFICATION BY UNSUPERVISED LEARNING USING DIMENSIONALITY REDUCTION OF DATA WITH MIRRORING NEURAL NETWORKS
 AUTOMATIC PATTERN CLASSIFICATION BY UNSUPERVISED LEARNING USING DIMENSIONALITY REDUCTION OF DATA WITH MIRRORING NEURAL NETWORKS Name(s) Dasika Ratna Deepthi (1), G.R.Aditya Krishna (2) and K. Eswaran (3)
CPSC 340: Machine Learning and Data Mining. Multi-Dimensional Scaling Fall 2017
 CPSC 340: Machine Learning and Data Mining Multi-Dimensional Scaling Fall 2017 Assignment 4: Admin 1 late day for tonight, 2 late days for Wednesday. Assignment 5: Due Monday of next week. Final: Details
ABSTRACT. Keywords: visual training, unsupervised learning, lumber inspection, projection 1. INTRODUCTION
 Comparison of Dimensionality Reduction Methods for Wood Surface Inspection Matti Niskanen and Olli Silvén Machine Vision Group, Infotech Oulu, University of Oulu, Finland ABSTRACT Dimensionality reduction
Discovering Shared Structure in Manifold Learning
 Discovering Shared Structure in Manifold Learning Yoshua Bengio and Martin Monperrus Dept. IRO, Université de Montréal P.O. Box 1, Downtown Branch, Montreal, H3C 3J7, Qc, Canada {bengioy,monperrm}@iro.umontreal.ca
Semi-supervised Data Representation via Affinity Graph Learning
 1 Semi-supervised Data Representation via Affinity Graph Learning Weiya Ren 1 1 College of Information System and Management, National University of Defense Technology, Changsha, Hunan, P.R China, 410073
Relative Constraints as Features
 Relative Constraints as Features Piotr Lasek 1 and Krzysztof Lasek 2 1 Chair of Computer Science, University of Rzeszow, ul. Prof. Pigonia 1, 35-510 Rzeszow, Poland, lasek@ur.edu.pl 2 Institute of Computer
Time Series Clustering Ensemble Algorithm Based on Locality Preserving Projection
 Based on Locality Preserving Projection 2 Information & Technology College, Hebei University of Economics & Business, 05006 Shijiazhuang, China E-mail: 92475577@qq.com Xiaoqing Weng Information & Technology
ORT EP R RCH A ESE R P A IDI! " #$$% &' (# $!"
 R E S E A R C H R E P O R T IDIAP A Parallel Mixture of SVMs for Very Large Scale Problems Ronan Collobert a b Yoshua Bengio b IDIAP RR 01-12 April 26, 2002 Samy Bengio a published in Neural Computation,
Locally Linear Landmarks for large-scale manifold learning
 Locally Linear Landmarks for large-scale manifold learning Max Vladymyrov and Miguel Á. Carreira-Perpiñán Electrical Engineering and Computer Science University of California, Merced http://eecs.ucmerced.edu
Global versus local methods in nonlinear dimensionality reduction
 Global versus local methods in nonlinear dimensionality reduction Vin de Silva Department of Mathematics, Stanford University, Stanford. CA 94305 silva@math.stanford.edu Joshua B. Tenenbaum Department
Global versus local methods in nonlinear dimensionality reduction
 Global versus local methods in nonlinear dimensionality reduction Vin de Silva Department of Mathematics, Stanford University, Stanford. CA 94305 silva@math.stanford.edu Joshua B. Tenenbaum Department
Neighbor Line-based Locally linear Embedding
 Neighbor Line-based Locally linear Embedding De-Chuan Zhan and Zhi-Hua Zhou National Laboratory for Novel Software Technology Nanjing University, Nanjing 210093, China {zhandc, zhouzh}@lamda.nju.edu.cn
Geodesic Based Ink Separation for Spectral Printing
 Geodesic Based Ink Separation for Spectral Printing Behnam Bastani*, Brian Funt**, *Hewlett-Packard Company, San Diego, CA, USA **Simon Fraser University, Vancouver, BC, Canada Abstract An ink separation
A *69>H>N6 #DJGC6A DG C<>C::G>C<,8>:C8:H /DA 'D 2:6G, ()-"&"3 -"(' ( +-" " " % '.+ % ' -0(+$,
-&3 -(' ( +- % '.+ % ' -0(+$,") The structure is a very important aspect in neural network design, it is not only impossible to determine an optimal structure for a given problem, it is even impossible to prove that a given structure
The structure is a very important aspect in neural network design, it is not only impossible to determine an optimal structure for a given problem, it is even impossible to prove that a given structure
COMBINED METHOD TO VISUALISE AND REDUCE DIMENSIONALITY OF THE FINANCIAL DATA SETS
 COMBINED METHOD TO VISUALISE AND REDUCE DIMENSIONALITY OF THE FINANCIAL DATA SETS Toomas Kirt Supervisor: Leo Võhandu Tallinn Technical University Toomas.Kirt@mail.ee Abstract: Key words: For the visualisation
A Hierarchial Model for Visual Perception
 A Hierarchial Model for Visual Perception Bolei Zhou 1 and Liqing Zhang 2 1 MOE-Microsoft Laboratory for Intelligent Computing and Intelligent Systems, and Department of Biomedical Engineering, Shanghai
Reducing topological defects in self-organizing maps using multiple scale neighborhood functions
 Reducing topological defects in self-organizing maps using multiple scale neighborhood functions Kazushi Murakoshi,YuichiSato Department of Knowledge-based Information Engineering, Toyohashi University
School of Computer and Communication, Lanzhou University of Technology, Gansu, Lanzhou,730050,P.R. China
 Send Orders for Reprints to reprints@benthamscienceae The Open Automation and Control Systems Journal, 2015, 7, 253-258 253 Open Access An Adaptive Neighborhood Choosing of the Local Sensitive Discriminant
Feature selection in environmental data mining combining Simulated Annealing and Extreme Learning Machine
 Feature selection in environmental data mining combining Simulated Annealing and Extreme Learning Machine Michael Leuenberger and Mikhail Kanevski University of Lausanne - Institute of Earth Surface Dynamics
Face Recognition using Laplacianfaces
 Journal homepage: www.mjret.in ISSN:2348-6953 Kunal kawale Face Recognition using Laplacianfaces Chinmay Gadgil Mohanish Khunte Ajinkya Bhuruk Prof. Ranjana M.Kedar Abstract Security of a system is an
Globally Stabilized 3L Curve Fitting
 Globally Stabilized 3L Curve Fitting Turker Sahin and Mustafa Unel Department of Computer Engineering, Gebze Institute of Technology Cayirova Campus 44 Gebze/Kocaeli Turkey {htsahin,munel}@bilmuh.gyte.edu.tr
Two-step Modified SOM for Parallel Calculation
 Two-step Modified SOM for Parallel Calculation Two-step Modified SOM for Parallel Calculation Petr Gajdoš and Pavel Moravec Petr Gajdoš and Pavel Moravec Department of Computer Science, FEECS, VŠB Technical
Assessing a Nonlinear Dimensionality Reduction-Based Approach to Biological Network Reconstruction.
 Assessing a Nonlinear Dimensionality Reduction-Based Approach to Biological Network Reconstruction. Vinodh N. Rajapakse vinodh@math.umd.edu PhD Advisor: Professor Wojciech Czaja wojtek@math.umd.edu Project
Visual object classification by sparse convolutional neural networks
 Visual object classification by sparse convolutional neural networks Alexander Gepperth 1 1- Ruhr-Universität Bochum - Institute for Neural Dynamics Universitätsstraße 150, 44801 Bochum - Germany Abstract.
Spectral Clustering X I AO ZE N G + E L HA M TA BA S SI CS E CL A S S P R ESENTATION MA RCH 1 6,
 Spectral Clustering XIAO ZENG + ELHAM TABASSI CSE 902 CLASS PRESENTATION MARCH 16, 2017 1 Presentation based on 1. Von Luxburg, Ulrike. "A tutorial on spectral clustering." Statistics and computing 17.4
Structured Light II. Thanks to Ronen Gvili, Szymon Rusinkiewicz and Maks Ovsjanikov
 Structured Light II Johannes Köhler Johannes.koehler@dfki.de Thanks to Ronen Gvili, Szymon Rusinkiewicz and Maks Ovsjanikov Introduction Previous lecture: Structured Light I Active Scanning Camera/emitter
A Taxonomy of Semi-Supervised Learning Algorithms
 A Taxonomy of Semi-Supervised Learning Algorithms Olivier Chapelle Max Planck Institute for Biological Cybernetics December 2005 Outline 1 Introduction 2 Generative models 3 Low density separation 4 Graph
Stratified Structure of Laplacian Eigenmaps Embedding
 Stratified Structure of Laplacian Eigenmaps Embedding Abstract We construct a locality preserving weight matrix for Laplacian eigenmaps algorithm used in dimension reduction. Our point cloud data is sampled
Dimension Reduction of Image Manifolds
 Dimension Reduction of Image Manifolds Arian Maleki Department of Electrical Engineering Stanford University Stanford, CA, 9435, USA E-mail: arianm@stanford.edu I. INTRODUCTION Dimension reduction of datasets
LEARNING COMPRESSED IMAGE CLASSIFICATION FEATURES. Qiang Qiu and Guillermo Sapiro. Duke University, Durham, NC 27708, USA
 LEARNING COMPRESSED IMAGE CLASSIFICATION FEATURES Qiang Qiu and Guillermo Sapiro Duke University, Durham, NC 2778, USA ABSTRACT Learning a transformation-based dimension reduction, thereby compressive,
Package mmtsne. July 28, 2017
 Type Package Title Multiple Maps t-sne Author Benjamin J. Radford Package mmtsne July 28, 2017 Maintainer Benjamin J. Radford Version 0.1.0 An implementation of multiple maps
IT-Dendrogram: A New Member of the In-Tree (IT) Clustering Family
 Clustering Family") IT-Dendrogram: A New Member of the In-Tree (IT) Clustering Family Teng Qiu (qiutengcool@163.com) Yongjie Li (liyj@uestc.edu.cn) University of Electronic Science and Technology of China, Chengdu, China
IT-Dendrogram: A New Member of the In-Tree (IT) Clustering Family Teng Qiu (qiutengcool@163.com) Yongjie Li (liyj@uestc.edu.cn) University of Electronic Science and Technology of China, Chengdu, China
Modelling Data Segmentation for Image Retrieval Systems
 Modelling Data Segmentation for Image Retrieval Systems Leticia Flores-Pulido 1,2, Oleg Starostenko 1, Gustavo Rodríguez-Gómez 3 and Vicente Alarcón-Aquino 1 1 Universidad de las Américas Puebla, Puebla,
Additional supplementary methods
 Additional supplementary methods t-distributed Stochastic Neighbor Embedding. t-distributed Stochastic Neighbor Embedding (t-sne) is a Nonlinear Dimensionality Reduction (NLDR) algorithm that projects
FACE RECOGNITION FROM A SINGLE SAMPLE USING RLOG FILTER AND MANIFOLD ANALYSIS
 FACE RECOGNITION FROM A SINGLE SAMPLE USING RLOG FILTER AND MANIFOLD ANALYSIS Jaya Susan Edith. S 1 and A.Usha Ruby 2 1 Department of Computer Science and Engineering,CSI College of Engineering, 2 Research
Shape Classification and Cell Movement in 3D Matrix Tutorial (Part I)
") Shape Classification and Cell Movement in 3D Matrix Tutorial (Part I) Fred Park UCI icamp 2011 Outline 1. Motivation and Shape Definition 2. Shape Descriptors 3. Classification 4. Applications: Shape Matching,
Shape Classification and Cell Movement in 3D Matrix Tutorial (Part I) Fred Park UCI icamp 2011 Outline 1. Motivation and Shape Definition 2. Shape Descriptors 3. Classification 4. Applications: Shape Matching,
Improving Image Segmentation Quality Via Graph Theory
 International Symposium on Computers & Informatics (ISCI 05) Improving Image Segmentation Quality Via Graph Theory Xiangxiang Li, Songhao Zhu School of Automatic, Nanjing University of Post and Telecommunications,
Linear Discriminant Analysis in Ottoman Alphabet Character Recognition
 Linear Discriminant Analysis in Ottoman Alphabet Character Recognition ZEYNEB KURT, H. IREM TURKMEN, M. ELIF KARSLIGIL Department of Computer Engineering, Yildiz Technical University, 34349 Besiktas /