CS266 Software Reverse Engineering (SRE) Reversing and Patching Wintel Machine Code
|
|
|
- Magnus Barton
- 5 years ago
- Views:
Transcription
1 CS266 Software Reverse Engineering (SRE) Reversing and Patching Wintel Machine Code Teodoro (Ted) Cipresso, Department of Computer Science San José State University Spring 2015 The information in this presentation is taken from the thesis Software reverse engineering education available at where all citations can be found.
2 Reversing and Patching Wintel Machine Code Introduction to Compilers and Machine Code Machine code is the executable representation of software. Typically: The result of translating high-level language source code (e.g., C/C++) to object code using using a compiler. Object code contains platform-specific machine instructions. The set of machine instructions available is defined by the CPU (or GPU). Object code file is made executable using linker: A linker resolves any external dependencies that object code may have, such as user-written or OS libraries (DLLs). Machine code is often referred to as native code as it executes only on the platform to which it belongs (is native to). 2
3 Reversing and Patching Wintel Machine Code Introduction to Compilers and Machine Code In contrast to high-level languages, there are low-level languages which are still considered to be high-level by the CPU because the language syntax is still a textual or mnemonic abstraction of the processor's instruction set. For example, assembly language, a language that uses helpful mnemonics to represent machine instructions, still must be translated to object code and made executable using a linker. The translation from assembly code to object code is done by an assembler instead of a compiler reflecting the closeness of assembly language's syntax to actual machine code. 3
4 Reversing and Patching Wintel Machine Code Introduction to Compilers and Machine Code The reason why compilers translate programs coded in high-level and low-level languages to machine code is three-fold: (1) CPUs only understand machine instructions (operation codes). (2) Having a CPU dynamically translate HLL statements to machine instructions would consume significant, additional CPU time. (3) A CPU that could dynamically translate HLL statements to machine instructions would be complex, expensive, and difficult to maintain. Imagine having to update the firmware in the CPU (or GPU) every time a bug is fixed or a feature is added to your favorite HLL; this would be much more annoying than patch Tuesday 4
5 Reversing and Patching Wintel Machine Code Introduction to Compilers and Machine Code To relieve a HLL compiler from the difficult task of generating machine instructions, some compilers do not generate machine code directly, instead they generate code in a LLL such as assembly [8]. This allows for a separation of concerns where the compiler doesn't have to know how to encode and format machine instructions for every target platform or processor. Instead it just concerns itself with generating valid assembly code for an assembler on the target platform. Some compilers, such as the C/C++ compilers in the GNU Compiler Collection (GCC), have the option to output assembly code. This allows a programmer to tweak the code [9, 2004]. 5
6 Reversing and Patching Wintel Machine Code Introduction to Compilers and Machine Code The steps in the process undertaken by the GCC compiler to create an executable are given below [9, 2004]: Preprocessing: Expand macros in the high-level language source file. Compilation: Translate the high-level source code to assembly language. Assembly: Translate assembly language to object code (machine code). Linking (Create the final executable): Statically or dynamically link together the object code with the object code of the programs and libraries it depends on. Establish initial relative addresses for the variables, constants, and entry points in the object code. 6
7 Reversing and Patching Wintel Machine Code Introduction to Compilers and Machine Code 7
8 Reversing and Patching Wintel Machine Code Decompilation and Disassembly of Machine Code Having an understanding of how high-level language programs become executables can be helpful when attempting to reverse machine code. Most tools that assist in reversing executables work by translating the machine code back into assembly language. This is possible because there exists a one-to-one mapping from each assembly language statement to a machine instruction [10]. A tool that translates machine code back into assembly language is called a disassembler. 8
9 Reversing and Patching Wintel Machine Code Decompilation and Disassembly of Machine Code From a reversers point of view it would be best to translate assembly language [back] to a high-level language, as it would be much less difficult to comprehend and alter the program. This is a difficult task for any tool because once high-level language source code is compiled down to machine code, a great deal of information is lost. For example, one cannot tell by looking at the machine code which highlevel language (if any) the machine code originated from. Object-oriented constructs would be especially difficult to recover. Perhaps knowing the kind of assembly code a particular compiler generates for certain constructs might help in generating HLL code, but this is not a reliable strategy. 9
10 Reversing and Patching Wintel Machine Code Decompilation and Disassembly of Machine Code The greatest difficulty in reverse engineering machine code comes from the lack of adequate decompilers. [5] argues that it should be possible to create good decompilers for binaries, but recognizes that other experts disagree raising the point that some information is irretrievably lost during the compilation process. For those interested in recovering the source code of a binary, decompilation may not offer much hope because as [11] states: a general decompiler does not attempt to reverse every action of the compiler, rather it transforms the input repeatedly until the result is high level source code. It therefore won't recreate the original source file; probably nothing like it. 10
11 Reversing and Patching Wintel Machine Code Decompilation and Disassembly of Machine Code Boomerang is an open-source decompiler that seeks to one day be able to decompile machine code to high-level language source code [11]. To get a sense of the effectiveness of Boomerang as a reversing tool, a simple program, HelloWorld.c was compiled and linked using the MinGW 32-bit GNU C++ compiler for Windows and then decompiled using Boomerang. The C code generated by the Boomerang decompiler looked like a hybrid of C and assembly language, had countless syntax errors, and ultimately bore no resemblance to the original program. Similar results are seen with other binaries; Boomerang seems to need manual guidance when decompiling MSVC-compiled programs. 11
12 12
13 Reversing and Patching Wintel Machine Code Decompilation and Disassembly of Machine Code The Reversing Engineering Compiler or REC is both a compiler and a decompiler that claims to be able to produce a C-like representation of machine code [12]. The results of the decompilation using REC were similar to that of Boomerang. Based on the current state of decompilation technology for machine code, recovering or generating HLL source code from a native binary doesn't appear to be a feasible approach. However, due to the one-to-one mapping between machine instructions and assembly language statements, we can obtain an assembly language representation using a tool known as a disassembler. 13
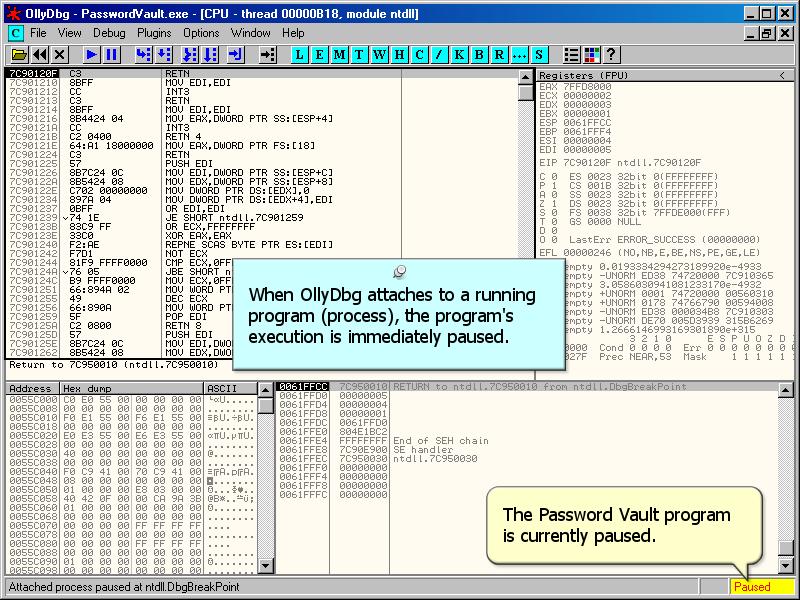
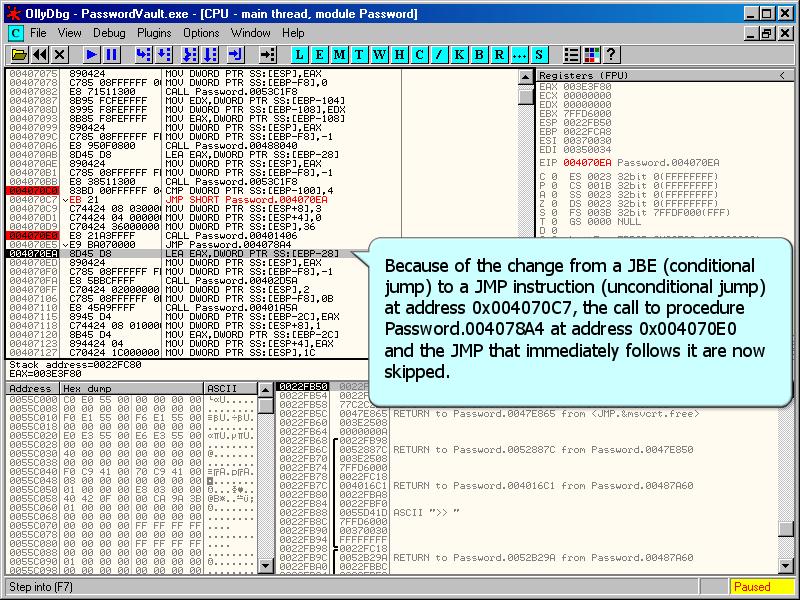
14 Reversing and Patching Wintel Machine Code Decompilation and Disassembly of Machine Code Multiple graphical tools available that not only include a disassembler, a tool which generates assembly language from machine code, but also allow for debugging and altering the machine code during execution. OllyDbg is a shareware interactive machine code debugger and disassembler tool for Windows [13]. The tool s emphasis on machine code analysis makes it particularly helpful in cases where the source code for the target program is unavailable. OllyDbg operates as follows: 1) disassemble the binary executable, 2) generate assembly language from the machine code, and 3) perform heuristic analysis to identify individual functions, loops, and functions calls. 14
15
16 Reversing and Patching Wintel Machine Code Machine Code Reversing and Patching using OllyDbg Pane Capabilities Disassembler Edit, debug, test, and patch a binary executable using actions available on a popup menu. Patch an executable by copying edits to the disassembly back to the binary. Dump Display the contents of memory or a file in one of 7 predefined formats: byte, text, integer, float, address, disassembly, or PE Header. Set memory breakpoints. Locate references to data in the disassembly. Information Decode and resolve the arguments of the currently selected assembly instruction in the Disassembler pane. Modify the value of register arguments. View memory locations referenced by each argument in either the Disassembler of Dump panes. 16
17 Reversing and Patching Wintel Machine Code Machine Code Reversing and Patching using OllyDbg Pane Capabilities Registers Decodes and displays the values of the CPU and FPU registers for the currently executing thread. Floating point register decoding can be configured for MMX (Intel) or 3DNow! (AMD) multimedia extensions. Modify the value of CPU registers. Stack Display the stack of the currently executing thread. Trace stack frames. In general, stack frames are used to: Restore the state of registers and memory on return from a call statement. Allocate storage for the local variables, parameters, and return value of the called subroutine. Provide a return address. 17

18

19

20

21

22
23

24
25

26
27
28

29
30
31
32

33
34
35
36

37
38

39

40

41
42
43

44
45
46
47

48

49
50

51

52
53
54

55
56

57

58
59

60

61

62

63
64
65

66
67
68

69
70
71

72
73

74
75
76
77

78

79
80
81

82
83
84
85
86
87

88
89
90
91
92

93
94
95

96

97
98
99

100

101
102
103
104

105
106

107
108

109

110
111
112
113

114
115
116

117
118
119

120
121
122
123
124

125
126

127

128

129
130

131

132

133
134
135

136

137

138

139
140
141

142

143
144

145

146
147
148

149
150
151

152
153

154
155
156

157

158
159

160

161

162
163

164 Reversing and Patching Wintel Machine Code Overview of Windows Debuggers The following Windows debuggers can be downloaded for free from here: KD Kernel Debugger: remote debug OS problems like blue screens, also useful for device driver development. NTSD NT debugger: user-mode debugger for user-mode applications. Essentially a GUI added to CDB Command-line debugger. WinDbg: wraps KD and NTSD with a GUI, therefore WinDbg can function both as a kernel-mode and user-mode debugger. Visual Studio [.NET]: same debugging engine as KD and NTSD but offers richer UI than WinDbg for user-mode application debugging. [WinDbg1, slides ] 164
165 Reversing and Patching Wintel Machine Code Comparison of Windows Debuggers Feature KD NTSD WinDbg Visual Studio.NET Kernel-mode debugging Y N Y N User-mode debugging Y Y Y Y Unmanaged debugging (e.g, C++) Y Y Y Y Managed debugging (e.g., C#) Y Y Y Y Remote debugging Y Y Y Y Attach to process Y Y Y Y Detach from process in Win2K and XP Y Y Y Y SQL debugging N N N Y 165
. Supports three types of commands: Regular commands (e.g.: k) for debugging processes. Dot commands (e.g.:.sympath) for controlling the debugger.")
 COFF (.DBG) format or the PDB (.PDB) format.")
166 Reversing and Patching Wintel Machine Code WinDbg (NTSD + KD with a better UI) Provides command-line options: start minimized (-m), attach to a process by pid (-p) and auto-open crash files (-z). Supports three types of commands: Regular commands (e.g.: k) for debugging processes. Dot commands (e.g.:.sympath) for controlling the debugger. Extension commands (e.g.:!handle) that you may add to WinDbg. These are implemented as exported functions in extension DLLs. You need symbols in order to be able to do effective debugging. Symbol files could be in the (older) COFF (.DBG) format or the PDB (.PDB) format. You can set symbol directories through File->Symbol File Path, or using.sympath from the WinDbg command window. 166
167 Reversing and Patching Wintel Machine Code WinDbg Just-in-time Debugging You can set WinDbg as the default JIT debugger by running Windbg I. Sets registry key HKLM\Software\Microsoft\Windows NT\CurrentVersion\AeDebug to WinDbg. WinDbg will be launched if a process, which is not already being debugged, throws an exception and does not handle/consume the exception. To set WinDbg as the default managed debugger (C#), you d need to set these registry keys explicitly: HKLM\Software\Microsoft\.NETFramework\DbgJITDebugLaunchSetting to 2 HKLM\Software\Microsoft\.NETFramework\DbgManagedDebugger to WinDbg. 167


168 Reversing and Patching Wintel Machine Code Dump Files and Crash Dump Analysis When Windows crashes, it dumps the physical memory contents and all process information to a dump file, configured through System->Control Panel- >Advanced->Startup and Recovery. [WinDbg1] 168
169 Reversing and Patching Wintel Machine Code Dump Files and Crash Dump Analysis The.dump command creates a user-mode or kernel-mode crash dump file. You can take a snapshot of a process by generating a crash dump: Syntax:.dump [options] file-path A mini-dump /m is usually small versus a full-memory mini-dump /mf. It is useful to dump handle information as well /mfh. A mini-dump contains information about all threads including their stacks and list of loaded modules. A full dump contains more information such as the process heap. 169

170 Reversing and Patching Wintel Machine Code Dump Files and Crash Dump Analysis (cont d) To analyze a dump in WinDbg, browse to File->Open Crash Dump, and select a dump file from the file system. WinDbg will show you the instruction the dumped process was executing when it crashed. 170
171 Additional References [WinDbg1] Windows Debuggers: Part 1: A WinDbg Tutorial 171
172 172
Installing Microsoft Windows Driver Development Kit (DDK) for Microsoft Windows Server 2003 Service Pack 1 (SP1) on Windows XP Pro SP2
 for Microsoft Windows Server 2003 Service Pack 1 (SP1) on Windows XP Pro SP2") Installing Microsoft Windows Driver Development Kit (DDK) for Microsoft Windows Server 2003 Service Pack 1 (SP1) on Windows XP Pro SP2 This step-by-step document also contains how-to install the Debugging
Installing Microsoft Windows Driver Development Kit (DDK) for Microsoft Windows Server 2003 Service Pack 1 (SP1) on Windows XP Pro SP2 This step-by-step document also contains how-to install the Debugging
Systems software design. Software build configurations; Debugging, profiling & Quality Assurance tools
 Systems software design Software build configurations; Debugging, profiling & Quality Assurance tools Who are we? Krzysztof Kąkol Software Developer Jarosław Świniarski Software Developer Presentation
T Hands-on 2. User-mode debuggers OllyDbg
 T-110.6220 Hands-on 2 User-mode debuggers OllyDbg Disassemblers vs debuggers Static analysis / Disassemblers Theoretic approach Give us a static view of the binary Example: IDA Dynamic analysis / Debuggers
Visual Studio 2008 Load Symbols Manually
 Visual Studio 2008 Load Symbols Manually Microsoft Visual Studio 2008 SP1 connects to the Microsoft public symbol are loaded manually if you want to load symbols automatically when you launch. Have you
Targeting the NetWare Operating System PDK 5.0
 Targeting the NetWare Operating System PDK 5.0 Revised: 12/13/02 Metrowerks, the Metrowerks logo, and CodeWarrior are registered trademarks of Metrowerks Corp. in the US and/or other countries. All other
CS266 Software Reverse Engineering (SRE) Reengineering and Reuse of Legacy Software
 Reengineering and Reuse of Legacy Software") CS266 Software Reverse Engineering (SRE) Teodoro (Ted) Cipresso, teodoro.cipresso@sjsu.edu Department of Computer Science San José State University Spring 2015 The information in this presentation is taken
CS266 Software Reverse Engineering (SRE) Teodoro (Ted) Cipresso, teodoro.cipresso@sjsu.edu Department of Computer Science San José State University Spring 2015 The information in this presentation is taken
Lab 3-2: Exploring the Heap
 Lab 3-2: Exploring the Heap Objectives Become familiar with the Windows Embedded CE 6.0 heap Prerequisites Completed Lab 2-1 Estimated time to complete this lab: 30 minutes Lab Setup To complete this lab,
Code Blocks Cannot Find Compiler Executable Windows 7
 Code Blocks Cannot Find Compiler Executable Windows 7 Windows. Once you've installed a new compiler, be sure to read the I couldn't find a way to force CB to use a unix-link shell, but was able to find
Practical Malware Analysis
 Practical Malware Analysis Ch 4: A Crash Course in x86 Disassembly Revised 1-16-7 Basic Techniques Basic static analysis Looks at malware from the outside Basic dynamic analysis Only shows you how the
Flare-On 5: Challenge 7 Solution WorldOfWarcraft.exe
 Flare-On 5: Challenge 7 Solution WorldOfWarcraft.exe Challenge Author: Ryan Warns Summary This challenge implements a 32-bit Windows binary meant to run in a Windows on Windows (WOW) environment. Analysis
1. Describe History of C++? 2. What is Dev. C++? 3. Why Use Dev. C++ instead of C++ DOS IDE?
 1. Describe History of C++? The C++ programming language has a history going back to 1979, when Bjarne Stroustrup was doing work for his Ph.D. thesis. One of the languages Stroustrup had the opportunity
Embest IDE Pro for ARM 2005
 Embest IDE Pro for ARM 2005 1.1 About Embest IDE Pro for ARM2005 Embest IDE Pro for ARM2005 is a new release of Embest IDE for ARM based on 2004 version. It is an Integrated Development Environment for
Efficient and Large Scale Program Flow Tracing in Linux. Alexander Shishkin, Intel
 Efficient and Large Scale Program Flow Tracing in Linux Alexander Shishkin, Intel 16.09.2013 Overview Program flow tracing - What is it? - What is it good for? Intel Processor Trace - Features / capabilities
A software view. Computer Systems. The Compilation system. How it works. 1. Preprocesser. 1. Preprocessor (cpp)
") A software view User Interface Computer Systems MTSU CSCI 3240 Spring 2016 Dr. Hyrum D. Carroll Materials from CMU and Dr. Butler How it works hello.c #include int main() { printf( hello, world\n
A software view User Interface Computer Systems MTSU CSCI 3240 Spring 2016 Dr. Hyrum D. Carroll Materials from CMU and Dr. Butler How it works hello.c #include int main() { printf( hello, world\n
Assembly Language Fundamentals
 Topics (Chapters 2 and 4) Mnemonics, OP codes Assembler Assembler Directives Assembly Process Object program Linker Loader Debugger 1 Turning C into Assembly C Program Compiler Assembly File Program in
Chapter 2. Operating-System Structures
 Chapter 2 Operating-System Structures 2.1 Chapter 2: Operating-System Structures Operating System Services User Operating System Interface System Calls Types of System Calls System Programs Operating System
Operating Systems. Designed and Presented by Dr. Ayman Elshenawy Elsefy
 Operating Systems Designed and Presented by Dr. Ayman Elshenawy Elsefy Dept. of Systems & Computer Eng.. AL-AZHAR University Website : eaymanelshenawy.wordpress.com Email : eaymanelshenawy@yahoo.com Reference
CHAPTER 2: SYSTEM STRUCTURES. By I-Chen Lin Textbook: Operating System Concepts 9th Ed.
 CHAPTER 2: SYSTEM STRUCTURES By I-Chen Lin Textbook: Operating System Concepts 9th Ed. Chapter 2: System Structures Operating System Services User Operating System Interface System Calls Types of System
CodeWarrior Development Studio for Power Architecture Processors FAQ Guide
 CodeWarrior Development Studio for Power Architecture Processors FAQ Guide Document Number: CWPAFAQUG Rev. 10.x, 06/2015 2 Freescale Semiconductor, Inc. Contents Section number Title Page Chapter 1 Introduction
Supplement: Visual C++ Debugging
 Supplement: Visual C++ Debugging For Introduction to C++ Programming By Y. Daniel Liang Note: The screen shots are taken from VC++ 2010. It is the same for the later version. 1 Introduction The debugger
Embedded Systems. 2. Software Development. Lothar Thiele. Computer Engineering and Networks Laboratory
 Embedded Systems 2. Software Development Lothar Thiele Computer Engineering and Networks Laboratory Remember: Computer Engineering I Compilation of a C program to machine language program: textual representation
NEW CEIBO DEBUGGER. Menus and Commands
 NEW CEIBO DEBUGGER Menus and Commands Ceibo Debugger Menus and Commands D.1. Introduction CEIBO DEBUGGER is the latest software available from Ceibo and can be used with most of Ceibo emulators. You will
Frequently Asked Questions about Real-Time
 FAQ: RTX64 2014 Frequently Asked Questions about Real-Time What is Real-Time? Real-time describes an application which requires a response to an event within some small upper bounded time frame. Typically,
TREX Set-Up Guide: Creating a TREX Executable File for Windows
 TREX Set-Up Guide: Creating a TREX Executable File for Windows Prepared By: HDR 1 International Boulevard, 10 th Floor, Suite 1000 Mahwah, NJ 07495 May 13, 2013 Creating a TREX Executable File for Windows
Integrated Software Environment. Part 2
 Integrated Software Environment Part 2 Operating Systems An operating system is the most important software that runs on a computer. It manages the computer's memory, processes, and all of its software
FFTSS Library Version 3.0 User s Guide
 Last Modified: 31/10/07 FFTSS Library Version 3.0 User s Guide Copyright (C) 2002-2007 The Scalable Software Infrastructure Project, is supported by the Development of Software Infrastructure for Large
1.1 For Fun and Profit. 1.2 Common Techniques. My Preferred Techniques
 1 Bug Hunting Bug hunting is the process of finding bugs in software or hardware. In this book, however, the term bug hunting will be used specifically to describe the process of finding security-critical
Chapter 2: Operating-System Structures
 Chapter 2: Operating-System Structures Chapter 2: Operating-System Structures Operating System Services User Operating System Interface System Calls Types of System Calls System Programs Operating System
Managed. Code Rootkits. Hooking. into Runtime. Environments. Erez Metula ELSEVIER. Syngress is an imprint of Elsevier SYNGRESS
 Managed Code Rootkits Hooking into Runtime Environments Erez Metula ELSEVIER AMSTERDAM BOSTON HEIDELBERG LONDON NEWYORK OXFORD PARIS SAN DIEGO SAN FRANCISCO SINGAPORE SYDNEY TOKYO Syngress is an imprint
Virtual Memory Validator. by Software Verification
 Virtual Memory Validator by Software Verification Copyright Software Verify Limited (c) 2002-2016 Virtual Memory Validator Virtual Memory Visualization for Windows NT, 2000, XP by Software Verification
ECE 498 Linux Assembly Language Lecture 1
 ECE 498 Linux Assembly Language Lecture 1 Vince Weaver http://www.eece.maine.edu/ vweaver vincent.weaver@maine.edu 13 November 2012 Assembly Language: What s it good for? Understanding at a low-level what
CS356: Discussion #6 Assembly Procedures and Arrays. Marco Paolieri
 CS356: Discussion #6 Assembly Procedures and Arrays Marco Paolieri (paolieri@usc.edu) Procedures Functions are a key abstraction in software They break down a problem into subproblems. Reusable functionality:
Laboratory Assignment #4 Debugging in Eclipse CDT 1
 Lab 4 (10 points) November 20, 2013 CS-2301, System Programming for Non-majors, B-term 2013 Objective Laboratory Assignment #4 Debugging in Eclipse CDT 1 Due: at 11:59 pm on the day of your lab session
Chapter 2: Operating-System Structures. Operating System Concepts 9 th Edit9on
 Chapter 2: Operating-System Structures Operating System Concepts 9 th Edit9on Silberschatz, Galvin and Gagne 2013 Objectives To describe the services an operating system provides to users, processes, and
Eliminate Memory Errors to Improve Program Stability
 Introduction INTEL PARALLEL STUDIO XE EVALUATION GUIDE This guide will illustrate how Intel Parallel Studio XE memory checking capabilities can find crucial memory defects early in the development cycle.
Chapter 2: Operating-System Structures. Operating System Concepts 9 th Edition
 Chapter 2: Operating-System Structures Silberschatz, Galvin and Gagne 2013 Chapter 2: Operating-System Structures Operating System Services User Operating System Interface System Calls Types of System
NonStop Development Environment for Eclipse 4.0 Debugging Supplement
 NonStop Development Environment for Eclipse 4.0 Debugging Supplement HP Part Number: 732675-001 Published: October 2013 Edition: NSDEE 4.0, J06.03 and subsequent J-series RVUs, H06.08 and subsequent H-series
Eliminate Threading Errors to Improve Program Stability
 Introduction This guide will illustrate how the thread checking capabilities in Intel Parallel Studio XE can be used to find crucial threading defects early in the development cycle. It provides detailed
Native Process Debugger
 Native Process Debugger TRACE32 Online Help TRACE32 Directory TRACE32 Index TRACE32 Documents... Native Process Debugger... 1 Operation Theory... 3 Quick Start... 4 Starting a new process 4 Attach to a
Intel Parallel Studio XE 2017 Composer Edition BETA C++ - Debug Solutions Release Notes
 Developer Zone Intel Parallel Studio XE 2017 Composer Edition BETA C++ - Debug Solutions Release Notes Submitted by Georg Z. (Intel) on August 5, 2016 This page provides the current Release Notes for the
Debugging and Profiling
 Debugging and Profiling Dr. Axel Kohlmeyer Senior Scientific Computing Expert Information and Telecommunication Section The Abdus Salam International Centre for Theoretical Physics http://sites.google.com/site/akohlmey/
Chapter 11 Introduction to Programming in C
 Chapter 11 Introduction to Programming in C C: A High-Level Language Gives symbolic names for containers of values don t need to know which register or memory location Provides abstraction of underlying
Copyright Notice. 2 Copyright Notice
 2 Copyright Notice Copyright Notice AQtrace, as described in this online help system, is licensed under the software license agreement distributed with the product. The software may be used or copied only
About the Presentations
 About the Presentations The presentations cover the objectives found in the opening of each chapter. All chapter objectives are listed in the beginning of each presentation. You may customize the presentations
P&E Microcomputer Systems, Inc. PKGPPCNEXUS
 P&E Microcomputer Systems, Inc. PKGPPCNEXUS Quick Start Guide for the PHYTEC phycore-mpc5554 Rapid Development Kit Visit us on the web: www.pemicro.com 2006 P&E Microcomputer Systems, Inc. All Rights Reserved
SWAR: MMX, SSE, SSE 2 Multiplatform Programming
 SWAR: MMX, SSE, SSE 2 Multiplatform Programming Relatore: dott. Matteo Roffilli roffilli@csr.unibo.it 1 What s SWAR? SWAR = SIMD Within A Register SIMD = Single Instruction Multiple Data MMX,SSE,SSE2,Power3DNow
Chapter 2: System Structures. Operating System Concepts 9 th Edition
 Chapter 2: System Structures Silberschatz, Galvin and Gagne 2013 Chapter 2: System Structures Operating System Services User Operating System Interface System Calls Types of System Calls System Programs
Notes of the course - Advanced Programming. Barbara Russo
 Notes of the course - Advanced Programming Barbara Russo a.y. 2014-2015 Contents 1 Lecture 2 Lecture 2 - Compilation, Interpreting, and debugging........ 2 1.1 Compiling and interpreting...................
Chapter 2 Operating-System Structures
 This chapter will discuss the following concepts: 2.1 Operating System Services 2.2 User Operating System Interface 2.3 System Calls 2.4 System Programs 2.5 Operating System Design and Implementation 2.6
API for Auxiliary Processing Unit
 API for Auxiliary Processing Unit TRACE32 Online Help TRACE32 Directory TRACE32 Index TRACE32 Documents... Misc... API for Auxiliary Processing Unit... 1 Introduction... 3 Release Information 3 Features
Source level debugging. October 18, 2016
 Source level debugging October 18, 2016 Source level debugging Source debugging is a nice tool for debugging execution problems; it can be particularly useful when working with crashed programs that leave
Course Syllabus [1/2]
![Course Syllabus [1/2]](/thumbs/81/83845788.jpg "Course Syllabus [1/2]") Course Syllabus [1/2] Instructor 逄愛君, acpang@csie.ntu.edu.tw Office Number: 417, Office Hour: 15:00~17:00 (Thursday) Textbook Assembly Language for Intel-Based Computers, Kip R. Irvine, Pearson Education,
Course Syllabus [1/2] Instructor 逄愛君, acpang@csie.ntu.edu.tw Office Number: 417, Office Hour: 15:00~17:00 (Thursday) Textbook Assembly Language for Intel-Based Computers, Kip R. Irvine, Pearson Education,
Eliminate Threading Errors to Improve Program Stability
 Eliminate Threading Errors to Improve Program Stability This guide will illustrate how the thread checking capabilities in Parallel Studio can be used to find crucial threading defects early in the development
Reviewing gcc, make, gdb, and Linux Editors 1
 Reviewing gcc, make, gdb, and Linux Editors 1 Colin Gordon csgordon@cs.washington.edu University of Washington CSE333 Section 1, 3/31/11 1 Lots of material borrowed from 351/303 slides Colin Gordon (University
Windows 7 Won't Update Says Service Not Running
 Windows 7 Won't Update Says Service Not Running The "joys" of Windows Update not working in Windows XP, Vista, 7, 8 and 8.1 are In case your PC crashes with error code 0xc000021a (and displays error This
CS 270 Systems Programming. Debugging Tools. CS 270: Systems Programming. Instructor: Raphael Finkel
 Debugging Tools CS 270: Systems Programming Instructor: Raphael Finkel Gdb: The Gnu debugger It runs on most computers and operating systems. It allows you to examine a running executable program. It does
Decompilation of Binary Programs & Structuring Decompiled Graphs
 Decompilation of Binary Programs & Structuring Decompiled Graphs Ximing Yu May 3, 2011 1 Introduction A decompiler, or reverse compiler, is a program that attempts to perform the inverse process of the
Debug for GDB Users. Action Description Debug GDB $debug <program> <args> >create <program> <args>
 Page 1 of 5 Debug for GDB Users Basic Control To be useful, a debugger must be capable of basic process control. This functionally allows the user to create a debugging session and instruct the process
Practical Hardware Debugging: Quick Notes On How to Simulate Altera s Nios II Multiprocessor Systems Using Mentor Graphics ModelSim
 Practical Hardware Debugging: Quick Notes On How to Simulate Altera s Nios II Multiprocessor Systems Using Mentor Graphics ModelSim Ray Duran Staff Design Specialist FAE, Altera Corporation 408-544-7937
RTX. Features by Release IZ-DOC-X
 RTX Features by Release IZ-DOC-X86-0031 August 12, 2011 Operating System Supported RTX Versions 5.5 6.0.1 6.1 6.5.1 7.0 7.1 8.0 8.1 8.1.1 8.1.2 9.0 4 2009 2009 SP1 2009 SP2 2011 2011 SP1 Windows 7 No No
System Debug. This material exempt per Department of Commerce license exception TSU Xilinx, Inc. All Rights Reserved
 System Debug This material exempt per Department of Commerce license exception TSU Objectives After completing this module, you will be able to: Describe GNU Debugger (GDB) functionality Describe Xilinx
Dynamic Tracing and Instrumentation
 Dynamic Tracing and Instrumentation Bryan Cantrill and Mike Shapiro (bmc, mws@eng.sun.com) Solaris Kernel Group Kernel Debugging Today if (no_advanced_debugging) printf(9f) ASSERT(i_am_a_debug_kernel!=
TotalView Release Notes
 Platform Changes The following new platforms are now supported by TotalView: NVIDIA CUDA 5.0 and 5.5 Mac OS X Mavericks (10.9) Ubuntu 12.04, 12.10 and 13.04 Fedora 19 The following platforms are no longer
UFCETW-20-2 Examination Answer all questions in Section A (60 marks) and 2 questions from Section B (40 marks)
 and 2 questions from Section B (40 marks)") Embedded Systems Programming Exam 20010-11 Answer all questions in Section A (60 marks) and 2 questions from Section B (40 marks) Section A answer all questions (60%) A1 Embedded Systems: ARM Appendix
Embedded Systems Programming Exam 20010-11 Answer all questions in Section A (60 marks) and 2 questions from Section B (40 marks) Section A answer all questions (60%) A1 Embedded Systems: ARM Appendix
How does breakpoints work in debuggers? Vineel Kumar Reddy Kovvuri
 How does breakpoints work in debuggers? Vineel Kumar Reddy Kovvuri http://vineelkumarreddy.com Contents 1 Introduction 2 2 Breakpoints Theory 2 3 Breakpoints Practice 4 1 1 Introduction Its been a while,
TraceBack: First Fault Diagnosis by Reconstruction of Distributed Control Flow
 TraceBack: First Fault Diagnosis by Reconstruction of Distributed Control Flow Andrew Ayers Chris Metcalf Junghwan Rhee Richard Schooler VERITAS Emmett Witchel Microsoft Anant Agarwal UT Austin MIT Software
Debugging with TotalView
 Debugging with TotalView Le Yan HPC Consultant User Services Goals Learn how to start TotalView on Linux clusters Get familiar with TotalView graphic user interface Learn basic debugging functions of TotalView
Language Translation. Compilation vs. interpretation. Compilation diagram. Step 1: compile. Step 2: run. compiler. Compiled program. program.
 Language Translation Compilation vs. interpretation Compilation diagram Step 1: compile program compiler Compiled program Step 2: run input Compiled program output Language Translation compilation is translation
Optimizing Your Android Applications
 Optimizing Your Android Applications Alexander Nelson November 27th, 2017 University of Arkansas - Department of Computer Science and Computer Engineering The Problem Reminder Immediacy and responsiveness
VARDHAMAN COLLEGE OF ENGINEERING (AUTONOMOUS) Shamshabad, Hyderabad
 Shamshabad, Hyderabad") Introduction to MS-DOS Debugger DEBUG In this laboratory, we will use DEBUG program and learn how to: 1. Examine and modify the contents of the 8086 s internal registers, and dedicated parts of the memory
Introduction to MS-DOS Debugger DEBUG In this laboratory, we will use DEBUG program and learn how to: 1. Examine and modify the contents of the 8086 s internal registers, and dedicated parts of the memory
The X86 Assembly Language Instruction Nop Means
 The X86 Assembly Language Instruction Nop Means As little as 1 CPU cycle is "wasted" to execute a NOP instruction (the exact and other "assembly tricks", as explained also in this thread on Programmers.
Analysis of MS Multiple Excel Vulnerabilities
 Analysis of MS-07-036 Multiple Excel Vulnerabilities I. Introduction This research was conducted using the Office 2003 Excel Viewer application and the corresponding security patch for MS-07-036 - Vulnerabilities
DNWSH - Version: 2.3..NET Performance and Debugging Workshop
 DNWSH - Version: 2.3.NET Performance and Debugging Workshop .NET Performance and Debugging Workshop DNWSH - Version: 2.3 8 days Course Description: The.NET Performance and Debugging Workshop is a practical
9/19/18. COS 318: Operating Systems. Overview. Important Times. Hardware of A Typical Computer. Today CPU. I/O bus. Network
 Important Times COS 318: Operating Systems Overview Jaswinder Pal Singh and a Fabulous Course Staff Computer Science Department Princeton University (http://www.cs.princeton.edu/courses/cos318/) u Precepts:
Short Notes of CS201
 #includes: Short Notes of CS201 The #include directive instructs the preprocessor to read and include a file into a source code file. The file name is typically enclosed with < and > if the file is a system
Machine Code and Assemblers November 6
 Machine Code and Assemblers November 6 CSC201 Section 002 Fall, 2000 Definitions Assembly time vs. link time vs. load time vs. run time.c file.asm file.obj file.exe file compiler assembler linker Running
IAR C-SPY Hardware Debugger Systems User Guide
 IAR C-SPY Hardware Debugger Systems User Guide for the Renesas SH Microcomputer Family CSSHHW-1 COPYRIGHT NOTICE Copyright 2010 IAR Systems AB. No part of this document may be reproduced without the prior
Chapter 2: Operating-System Structures. Operating System Concepts Essentials 8 th Edition
 Chapter 2: Operating-System Structures Operating System Concepts Essentials 8 th Edition Silberschatz, Galvin and Gagne 2011 Chapter 2: Operating-System Structures Operating System Services User Operating
Chapter Overview. Assembly Language for Intel-Based Computers, 4 th Edition. Chapter 1: Basic Concepts. Printing this Slide Show
 Assembly Language for Intel-Based Computers, 4 th Edition Kip R. Irvine Chapter 1: Basic Concepts Chapter Overview Welcome to Assembly Language Virtual Machine Concept Data Representation Boolean Operations
Princeton University COS 217: Introduction to Programming Systems GDB Tutorial and Reference
 Princeton University COS 217: Introduction to Programming Systems GDB Tutorial and Reference Part 1: Tutorial This tutorial describes how to use a minimal subset of the gdb debugger. For more information
3 TUTORIAL. In This Chapter. Figure 1-0. Table 1-0. Listing 1-0.
 3 TUTORIAL Figure 1-0. Table 1-0. Listing 1-0. In This Chapter This chapter contains the following topics: Overview on page 3-2 Exercise One: Building and Running a C Program on page 3-4 Exercise Two:
Chapter 2: Operating-System
 Chapter 2: Operating-System Structures Chapter 2: Operating-System Structures Operating System Services! User Operating System Interface! System Calls! Types of System Calls! System Programs! Operating
Scientific Programming in C IX. Debugging
 Scientific Programming in C IX. Debugging Susi Lehtola 13 November 2012 Debugging Quite often you spend an hour to write a code, and then two hours debugging why it doesn t work properly. Scientific Programming
CS201 - Introduction to Programming Glossary By
 CS201 - Introduction to Programming Glossary By #include : The #include directive instructs the preprocessor to read and include a file into a source code file. The file name is typically enclosed with
CodeWarrior IDE Essentials for Embedded Systems Featuring Hiware Technology
 CodeWarrior IDE Essentials for Embedded Systems Featuring Hiware Technology Revised Metrowerks, the Metrowerks logo, and CodeWarrior are registered trademarks of Metrowerks Corp. in the US
What's New in CDT 7.0? dominique dot toupin at ericsson dot com
 What's New in CDT 7.0? dominique dot toupin at ericsson dot com 23 committers Project Status Representing IDE vendors, consultants, and users Downloads continue to grow Galileo SR-1: 530,000! CDT / Linux
COP4020 Programming Languages. Compilers and Interpreters Robert van Engelen & Chris Lacher
 COP4020 ming Languages Compilers and Interpreters Robert van Engelen & Chris Lacher Overview Common compiler and interpreter configurations Virtual machines Integrated development environments Compiler
Release Notes. S32 Design Studio for ARM v1.1
 Release Notes S32 Design Studio for ARM v1.1 TABLE OF CONTENTS 1 Release description... 2 1.1 Release content... 2 2 What s New... 2 2.1 New device support... 2 2.2 New features... 2 3 System Requirements...
For Teacher's Use Only Q No Total Q No Q No
 Student Info Student ID: Center: Exam Date: FINALTERM EXAMINATION Spring 2010 CS201- Introduction to Programming Time: 90 min Marks: 58 For Teacher's Use Only Q No. 1 2 3 4 5 6 7 8 Total Marks Q No. 9
Processes and Threads
 COS 318: Operating Systems Processes and Threads Kai Li and Andy Bavier Computer Science Department Princeton University http://www.cs.princeton.edu/courses/archive/fall13/cos318 Today s Topics u Concurrency
Orange Coast College. Business Division. Computer Science Department CS 116- Computer Architecture. The Instructions
 Orange Coast College Business Division Computer Science Department CS 116- Computer Architecture The Instructions 1 1 Topics: Assembly language, assemblers MIPS R2000 Assembly language Instruction set
EL2310 Scientific Programming
 (yaseminb@kth.se) Overview Overview Roots of C Getting started with C Closer look at Hello World Programming Environment Discussion Basic Datatypes and printf Schedule Introduction to C - main part of
RVDS 4.0 Introductory Tutorial
 RVDS 4.0 Introductory Tutorial 402v02 RVDS 4.0 Introductory Tutorial 1 Introduction Aim This tutorial provides you with a basic introduction to the tools provided with the RealView Development Suite version
VT Advantage System Crashes on the Install PC
 VT Advantage System Crashes on the Install PC Document ID: 50842 Contents Introduction Prerequisites Requirements Components Used Conventions Set up Your PC to Capture a System Crash Use the Microsoft
e-pg Pathshala Subject : Computer Science Paper: Embedded System Module: Embedded Software Development Tools Module No: CS/ES/36 Quadrant 1 e-text
 e-pg Pathshala Subject : Computer Science Paper: Embedded System Module: Embedded Software Development Tools Module No: CS/ES/36 Quadrant 1 e-text In this module, we will discuss about the host and target
Creating User-Friendly Exploits
 1 Creating User-Friendly Exploits Skylar Rampersaud skylar@immunityinc.com Security Research 2 What is a User-Friendly Exploit? An exploit that causes no distress to the user of the exploited program i.e.,
IRIX is moving in the n32 direction, and n32 is now the default, but the toolchain still supports o32. When we started supporting native mode o32 was
 Massachusetts Institute of Technology Department of Electrical Engineering and Computer Science 6.035, Fall 2002 Handout 23 Running Under IRIX Thursday, October 3 IRIX sucks. This handout describes what
LabWindows /CVI Release Notes Version 2010
 LabWindows /CVI Release Notes Version 2010 Contents These release notes introduce LabWindows /CVI 2010. Refer to this document for system requirements, installation and activation instructions, and information
EL2310 Scientific Programming
 Lecture 6: Introduction to C (pronobis@kth.se) Overview Overview Lecture 6: Introduction to C Roots of C Getting started with C Closer look at Hello World Programming Environment Schedule Last time (and
Simics Feature List. Simics Version 4.2. Revision 3030 Date
 Simics Feature List Simics Version 4.2 Revision 3030 Date 2009-10-16 1998 2009 Virtutech AB Drottningholmsvägen 22, SE-112 42 Stockholm, Sweden Trademarks Virtutech, the Virtutech logo, Simics, Hindsight,