OpenLAB CDS Report Template Editor
|
|
|
- Neal Lewis
- 6 years ago
- Views:
Transcription

1 OpenLAB CDS Report Template Editor Concepts Guide Agilent Technologies
2 Notices Agilent Technologies, Inc No part of this manual may be reproduced in any form or by any means (including electronic storage and retrieval or translation into a foreign language) without prior agreement and written consent from Agilent Technologies, Inc. as governed by United States and international copyright laws. Manual Part Number M Edition 10/2016 Printed in Germany Agilent Technologies Hewlett-Packard-Strasse Waldbronn Software Revision This guide is valid for revision C SR3 of Agilent OpenLAB CDS ChemStation Edition. Warranty The material contained in this document is provided as is, and is subject to being changed, without notice, in future editions. Further, to the maximum extent permitted by applicable law, Agilent disclaims all warranties, either express or implied, with regard to this manual and any information contained herein, including but not limited to the implied warranties of merchantability and fitness for a particular purpose. Agilent shall not be liable for errors or for incidental or consequential damages in connection with the furnishing, use, or performance of this document or of any information contained herein. Should Agilent and the user have a separate written agreement with warranty terms covering the material in this document that conflict with these terms, the warranty terms in the separate agreement shall control. Technology Licenses The hardware and/or software described in this document are furnished under a license and may be used or copied only in accordance with the terms of such license. Restricted Rights Legend If software is for use in the performance of a U.S. Government prime contract or subcontract, Software is delivered and licensed as Commercial computer software as defined in DFAR (June 1995), or as a commercial item as defined in FAR 2.101(a) or as Restricted computer software as defined in FAR (June 1987) or any equivalent agency regulation or contract clause. Use, duplication or disclosure of Software is subject to Agilent Technologies standard commercial license terms, and non-dod Departments and Agencies of the U.S. Government will receive no greater than Restricted Rights as defined in FAR (c)(1-2) (June 1987). U.S. Government users will receive no greater than Limited Rights as defined in FAR (June 1987) or DFAR (b)(2) (November 1995), as applicable in any technical data. Safety Notices CAUTION A CAUTION notice denotes a hazard. It calls attention to an operating procedure, practice, or the like that, if not correctly performed or adhered to, could result in damage to the product or loss of important data. Do not proceed beyond a CAUTION notice until the indicated conditions are fully understood and met. WARNING A WARNING notice denotes a hazard. It calls attention to an operating procedure, practice, or the like that, if not correctly performed or adhered to, could result in personal injury or death. Do not proceed beyond a WARNING notice until the indicated conditions are fully understood and met. Concepts Guide
3 In This Guide... In This Guide... This guide contains information for template developers. It describes the concepts and advanced features of the Report Template Editor (RTE). For information on basic tasks and the user interface please refer to the RTE online help. 1 Overview This chapter provides an overview of the possibilities of the Report Template Editor. 2 Text Fields and Data Fields This chapter describes the characteristics and usage of text fields and data fields in RTE. 3 Tables This chapter describes the characteristics and usage of tables in RTE. 4 Matrices This chapter describes the characteristics and usage of matrices in RTE. 5 Composite Groups This chapter describes the characteristics and usage of Composite Groups in RTE. 6 Images This chapter describes the characteristics and usage of images in RTE. 7 Chromatograms This chapter describes the characteristics and usage of chromatograms in RTE. Concepts Guide 3
4 In This Guide... 8 Calibration Curves This chapter describes the characteristics and usage of calibration curves in RTE. 9 Spectra This chapter describes the characteristics and usage of spectra in RTE. 10 Mass Spectrometry Report Items This chapter describes the characteristics and usage of Mass Spectrometry report items in RTE. 11 Charts This chapter describes the characteristics and usage of charts in RTE. 12 Method Information This chapter describes the characteristics and usage of method information in RTE. 13 Other Snippets This chapter contains information on snippets that are based on previously described report items, but preconfigured for specific purposes. 14 Expressions This chapter describes the characteristics and usage of expressions in RTE. 15 Calculation Variables This chapter describes the characteristics and usage of calculation variables in RTE. 16 Report Template Audit Trail This chapter describes the Report Template Audit Trail in RTE. 4 Concepts Guide
5 In This Guide Report Parameters This chapter describes the characteristics and usage of report parameters in RTE. 18 Advanced Report Features This chapter describes the characteristics and usage of advanced report features such as document maps, locked report items, or custom assemblies. 19 Appendix This chapter contains a list of all operators and functions available in the Expression Editor. Concepts Guide 5
6 Contents Contents 1 Overview 9 Overview 10 Report Types 12 Working With Templates 13 2 Text Fields and Data Fields 21 About Text Fields and Data Fields 22 Using Fields 25 3 Tables 27 About Tables 28 Using Tables 29 About Table Groups 42 Using Table Groups 44 About Custom Tables 45 4 Matrices 47 About Matrices 48 About Matrix Groups 49 Using Matrices 51 5 Composite Groups 55 About Composite Groups 56 Using Composite Groups 57 6 Images 61 About Images 62 Using Images 62 6 Concepts Guide
7 Contents 7 Chromatograms 63 About Chromatograms 64 Using Chromatograms 67 8 Calibration Curves 75 About Calibration Curves 76 Using Calibration Curves 78 To Show Disabled Calibration Points 80 9 Spectra 81 About Spectra 82 Using Spectra Mass Spectrometry Report Items 87 About Mass Spectra 88 Using Mass Spectra Charts 93 About Charts 94 Using Charts Method Information 107 About Method Information 108 To filter for a specific section Other Snippets 111 Instrument Information Expressions 115 About Expressions 116 Using Expressions Calculation Variables 139 About Variables 140 Using Variables 146 Concepts Guide 7
8 Contents 16 Report Template Audit Trail 157 About the Report Template Audit Trail Report Parameters 159 About Report Parameters 160 Using Report Parameters Advanced Report Features 167 Document Map 168 Locked/Unlocked Report Items 171 Custom Assemblies Appendix 175 Enumerations 176 Keys in Diagnostic Data Concepts Guide
9 Concepts Guide 1 Overview Overview 10 Report Types 12 Working With Templates 13 To Add and Configure Report Items 13 To Move or Resize Report Items 13 To Align Report Items 14 To Change the Paper Size and Orientation 18 To Insert the Page Number 18 To Change the Font Properties for Multiple Report Items 19 This chapter provides an overview of the possibilities of the Report Template Editor. Agilent Technologies 9
10 1 Overview Overview Overview With Reporting, the data you loaded for analyzing and reprocessing is automatically available for reporting. The Report Template Editor (RTE) helps you building new report templates with your own template layout, or editing existing ones, for example by adding complex calculations. Data provided by different applications You can use report templates in different applications, for example, in OpenLAB ECM Intelligent Reporter, OpenLAB CDS ChemStation, or OpenLAB CDS EZChrom edition. With report templates, a user can create reports with a specific design, such as a sequence overview with a sequence table and statistics, or a cross-sequence summary. The reports will contain the data selected in the current session of the respective program. Report features Create different report types such as single sample reports, sequence summary reports, or cross-sequence summary reports ( Report Types on page 12). Using report parameters allows you to create dynamic reports that contain limited data as chosen by the user, such as all data for a specific month or year ( About Report Parameters on page 160). File format of report templates All report templates are based on the Report Definition Language (RDL), which is a standardized XML format provided by Microsoft. Snippets The Report Template Editor (RTE) provides various preconfigured report items - also referred to as snippets - that you can use in your templates. 10 Concepts Guide
11 Overview 1 Overview Report Template Documentation Report Template Documentation Tool is a standalone application to view the description of the RTE supported report templates. It can also save this description in PDF format. The description about the report template includes layout of report items along with their parameter details, such as calculation variables, report parameters, expressions used, filter condition, sort condition, audit trail etc. To launch the Report Template Documentation Tool, run the TemplateDocumentation.exe file. By default, it is located in c:\chem32\core for ChemStation Edition or c:\program Files\Agilent Technologies\EZChrom for EZChrom Edition. When the application is launched, an Open dialog allows you to select a report template. Report Items NOTE The described report items are a superset. Not all report items are always available. The availability of report items depends on the following: Type of the current template (for example, Single Sequence Summary or Cross-Sequence Summary) Type and revision of the application Instrument module and driver version Concepts Guide 11
12 1 Overview Report Types Report Types Each template is of a specific report type. Depending on this report type, the template is connected to a particular database view with the data organized in a specific way. The following report types are available: With Single Injection reports, RTE automatically creates a list of all injections in the current data scope. The generated report then shows the report items from the template separately for each injection. Therefore, you do not need to worry about repeating composite groups on injection IDs. On the other hand, you cannot compare results from different injections in one table or matrix. For example, the report contains a sequence table. You selected 4 injections from 2 different sequences. The generated report contains 4 separate tables, one for each injection. With Single Sequence Summary reports, RTE automatically creates a list of all sequences in the current data scope. The generated report then shows the report items from the template separately for each of the sequences. Therefore, you do not need to worry about repeating composite groups on sequence IDs. On the other hand, you cannot compare results from different sequences in one table or matrix. For example, the report contains a sequence table. You selected 4 injections from 2 different sequences. The generated report contains 2 separate tables, one for each sequence. With Cross-Sequence Summary reports, the data is not automatically grouped. Therefore, you must pay more attention to the grouping of your report items, but in return you can create report items that compare data from different sequences. For example, the report contains a sequence table. You selected 4 injections from 2 different sequences. The generated report contains only one table with 4 rows. 12 Concepts Guide
13 Overview 1 Working With Templates Working With Templates To Add and Configure Report Items 1 In the Report Items browser, open the tree for the required item type, and drill down to the report item level. 2 Drag the report item to the template. 3 Grab the handles to resize the item, or grab the gray border to move the item. 4 To configure the report item, right-click the item and select Properties from the context menu. Alternatively, you can double-click the report item. If you double-click a text field, you can directly enter the Value. If you double-click a data field, you can directly enter the Label of the field. If you double-click a table header, you can directly enter the header text. If you double-click other report items, the corresponding Properties dialog opens. 5 Adjust the properties according to your requirements. 6 Select File > Save or File > Save as to save the report template. To Move or Resize Report Items To move a report item: Grab the report item border with the mouse, and drag it to the new position. - or - Select the report item, and use the arrow keys. To resize a report item: Grab the handles of the report item border, and drag them to the required new size. - or - Select the report item, and press Shift+Arrow key. Concepts Guide 13

14 1 Overview Working With Templates To Align Report Items To set the same size for multiple report items 1 Click the text field or data field from which you want to use the width or height. 2 Hold the Ctrl key while clicking the text fields or data fields that you want to adjust. 3 Right-click one of the selected items, and select the appropriate Make Same Size command from the context menu. The width or height or both are adjusted to the size of the first selected item. The following figure shows the report items after setting the same width to all items. 14 Concepts Guide


15 Overview 1 Working With Templates To align multiple report items relative to each other 1 Click the report item you want to use to align the other report items. 2 Hold the Ctrl key while clicking the items you want to align. The first selected report items is highlighted with black squares. All other selected items are highlighted with white squares. 3 Right-click one of the selected items, and select the appropriate Align command from the context menu. All items are aligned to the first selected item. The following figure shows the report items after aligning the left margins. 4 If you align data fields that have the same width, the split line between label and value is also aligned. Figure 1 Unaligned data fields Figure 2 Aligned data fields with aligned split lines Concepts Guide 15


16 1 Overview Working With Templates To set equal horizontal spacing To adjust the spacing between multiple report items, either none of the selected items must be in a composite group, or all items must be in the same composite group. 1 Select the text fields or data fields for which you want to adjust the spacing. The order in which you select the items is irrelevant. 2 Align the items horizontally (Tops, Middles or Bottoms). The following figure shows an example with aligned tops. 3 Right-click one of the selected items, and select Horizontal Spacing > Make Equal from the context menu. The same horizontal spacing is used between all selected items. To set equal vertical spacing 1 Select the text fields or data fields for which you want to adjust the spacing. The order in which you select the items is irrelevant. 2 Align the items vertically (Lefts, Rights, or Centers). To following figure shows an example with same widths and aligned lefts. 16 Concepts Guide

17 Overview 1 Working With Templates 3 Right-click one of the selected items, and select Vertical Spacing > Make Equal from the context menu. The same vertical spacing is used between all selected items. Concepts Guide 17
18 1 Overview Working With Templates To Change the Paper Size and Orientation 1 In the Report Properties dialog, select the Report page. 2 To change the page size, select the required size under Report Layout. 3 To change the paper orientation, select the required format under Paper Orientation. 4 To remove the gray area: Move the mouse over the right border of the gray area. When the pointer becomes a double-headed arrow, drag the pointer to the left. 5 Save your settings. The area shown in the Editing Pane already considers the margins configured in the report properties. When you generate the report, RTE will automatically add these margins. If the new page width is too small for all report items to be printed, the area that exceeds the page size is shown with a light gray background. If there is a gray area and report items extend into this gray area, additional pages will be printed. If the gray area does not contain any report items, it will simply be ignored for the preview, and cut off when saving the template. 6 If required, delete, resize, or move the report items from the gray area. 7 To remove the gray area: Move the mouse over the right border of the gray area. When the pointer becomes a double-headed arrow, drag the pointer to the left. To Insert the Page Number You can insert the page number or the number of total pages to your template. To do so, simply open the Special Objects category in the Report Items browser, and drag the required snippet to the header or footer section. 18 Concepts Guide
19 Overview 1 Working With Templates To Change the Font Properties for Multiple Report Items 1 Select all report items for which you want to change the font properties. To select multiple items: Keep the Ctrl key pressed while clicking. or Drag a rectangle over the required items. 2 Click Font Properties in the toolbar. NOTE The button is only active, if you selected report items for which you can change the font properties. These items are: Unlocked text fields Unlocked data fields Unlocked matrices Unlocked tables 3 Adjust the font properties as required, and confirm your settings. Concepts Guide 19
20 1 Overview Working With Templates 20 Concepts Guide
21 Concepts Guide 2 Text Fields and Data Fields About Text Fields and Data Fields 22 Using Fields 25 To adjust the width of the label part 25 To enter text directly 25 To add a line break 25 This chapter describes the characteristics and usage of text fields and data fields in RTE. Agilent Technologies 21
22 2 Text Fields and Data Fields About Text Fields and Data Fields About Text Fields and Data Fields Available fields The assortment of data fields in the Report Items browser depends on the following factors: The selected report type The chromatography data system Field types The Report Template Editor provides the following types of fields: Text fields are basically simple textboxes that can contain either static text or dynamic expressions. Text fields are, for example, used to display static headlines in a report template. In the Report Items browser, you find the Text field in the Special Objects category. Data fields are divided into two parts, label and value. The label contains a static text, the value contains a dynamic expression. Data fields are typically used to show specific data, for example the sequence name or the sample name. You can, however, modify both label and value according to your requirements. In the Report Items browser, you find all available data fields in the Fields category. 22 Concepts Guide

23 Text Fields and Data Fields 2 About Text Fields and Data Fields Custom fields are a special type of data field. You configure the custom fields in the chromatography data system, for example, in the method definition in ChemStation. Custom fields allow you to create customized information (both labels and values) which belongs to a specific context, for example, to a sample or to a compound. RTE allows you to perform calculations with custom fields. In contrast to the regular data fields, the label shown for custom fields is not the data field name (e.g. Sample_CustomField01) but rather the customized label information (e.g. "TabletWeight"). This is achieved by a combination of the Trim, Choose, and Split functions in the expression for the value. RTE automatically creates this expression. You can configure both label and value in your chromatography data system. Complex custom fields are data fields that do not contain a single value but an entire XML structure. This XML structure contains various key/value pairs. If you drag such a field to the template, a dialog asks you for the key of the information you want to access. As a result, RTE creates a data field where the label is the name of the complex custom field, and the value is the specific value stored under the given key. This value is accessed with the help of the CFE function. RTE automatically creates this expression. Concepts Guide 23
24 2 Text Fields and Data Fields About Text Fields and Data Fields Depending on the chromatography data system, the following complex custom fields may be available: Injection > DiagnosticData: information on the injection, for example start pressure, stop pressure, or air temperature. The keys depend on the chromatography data system used (see Keys in Diagnostic Data on page 187). Sequence > CustomFields: all labels and values contained in the data fields Sequence_CustomField01 to 10 (or higher, if there are more than ten custom fields). Sample > CustomFields: all labels and values contained in the data fields Sample_CustomField01 to 10 (or higher, if there are more than ten custom fields). Injection > CustomFields: all labels and values contained in the data fields Injection_CustomField01 to 10 (or higher, if there are more than ten custom fields) Compound > CustomFields: all labels and values contained in the data fields Compound_CustomField01 to 10 (or higher, if there are more than ten custom fields) 24 Concepts Guide
25 Text Fields and Data Fields 2 Using Fields Using Fields To adjust the width of the label part Data fields are divided in two parts, label and value: To adjust the width of the label part, move the mouse over the boundary line between label and value, and drag the line to the required width. To enter text directly In text fields, you can edit the text directly by double-clicking the text field in the Editing Pane. The entered text corresponds to the Value configured in the item properties. You can enter either static text or dynamic expressions (starting with an equals sign). In data fields, you can only edit the label part directly, by double-clicking it. To add a line break You have various options for entering line breaks:. Edit the text directly in the Editing Pane, and press Ctrl+Enter. Edit the Value of the text field in the Expression Editor, and press Ctrl+Enter. Edit the Value of the text field in the Expression Editor, and enter the Visual Basic constant vbnewline. For example, the expression can look like the following: ="Retention" + vbnewline + "Time" Concepts Guide 25
26 2 Text Fields and Data Fields Using Fields 26 Concepts Guide
27 Concepts Guide 3 Tables About Tables 28 Using Tables 29 To add and remove columns 29 To remove columns 30 To adjust a specific column 30 To change the order of table columns 30 To adjust the column widths 31 To adjust the colors and fonts in a table 31 To highlight outliers using conditional formatting 32 To adjust the table borders 33 To change the column header 34 To create a line break in a table header 34 To create a second table row 35 To change the text alignment in a table 36 To adjust the number format in a table 36 To configure a table footer 37 To sort a table 38 To filter a table 39 To filter for peak area or area% 40 To repeat a table 41 To adjust the Repeat On field 41 About Table Groups 42 Using Table Groups 44 To configure a table group 44 About Custom Tables 45 This chapter describes the characteristics and usage of tables in RTE. Agilent Technologies 27

28 3 Tables About Tables About Tables With tables, you can display results in a 2-dimensional format. Tables are used, for example, to summarize the results of samples/sequences. The amount of columns and the headlines are static, the number of rows corresponds to the number of records in the dataset. Basically, each table contains a specific dataset that is determined by the type of the base template (see Report Types on page 12). Thus, without any further configuration, the table would show one row for each record in the dataset, where the records are unsorted, ungrouped, and unfiltered. In order to organize and structure the data, you have the following options for configuring a table: Repeat Table On: Display the table several times, where each table only contains the data according to the value of specific key information. The particular values (for example, compound names) are used as table headers. Grouping: The detail rows are arranged according to the distinct values of a given key information (for example, the distinct sample names). Sorting: The detail rows are sorted according to a given key information. Filtering: Exclude specific data from the table content. Area Rejection: Exclude information on peaks that are too small. Show Peak Types: Specify the type of peaks to be shown in a table (for example, Identified Peaks or Unknown Peaks). The table report items available in the Report Items browser are all preconfigured in a specific way, so you can use them with only a few adjustments. 28 Concepts Guide
29 Tables 3 Using Tables Using Tables To add and remove columns In the Editing Pane (drag and drop): 1 Select the table in the Editing Pane. 2 In the Fields category in the Report Items browser, select the information you want to add to the table, and drag the field to the table. While you move the mouse across the table columns, RTE selects the respective columns. When you release the mouse button, RTE will add the new column to the right of the currently selected column. In the Editing Pane (context menu) 1 In the Editing Pane, select the table column next to which you want to add the new column. 2 Right-click that column, and select Insert Column to Left or Insert Column to Right from the context menu. A sub menu opens with all data categories. The categories contain all data fields that are available for the report type of the current template 3 Select the data field that you want to show in the new table column. In the Table Properties dialog: 1 Select the table. 2 In the Table Properties, select the Columns page. 3 Double-click the required data field in the Available Fields tree. OR Alternatively, you can select the field and click. The corresponding table column is inserted to the right of the selected column. Concepts Guide 29
30 3 Tables Using Tables To remove columns In the Editing Pane: 1 In the Editing Pane, select the table column you want to delete. 2 Right-click the column, and select Delete Column from the context menu. In the Table Properties dialog: 1 In the Table Properties, select the Columns page. 2 In the Table Layout, click the required column to select it. 3 Click. The column is removed from the table. To adjust a specific column To open the Properties dialog for one specific table column: 1 Right-click the column in the Editing Pane, and select Column Properties from the context menu. 2 Alternatively, open the Properties dialog for the entire table, select the Columns page, select the required column under Table Layout, and click Column Properties. To change the order of table columns In the Editing Pane: 1 Select the table in the Editing Pane. 2 In the dark gray bar at the top of the table header fields, select the column and drag it to the new position. While dragging the column, new positions are indicated by a thin blue line. In the Table Properties dialog: 1 Open the Table Properties dialog. 2 Select the Columns page. 3 In the dark gray bar at the top of the table header fields, select the column and drag it to the new position. While dragging the column, new positions are indicated by a thin blue line. 30 Concepts Guide
31 Tables 3 Using Tables To adjust the column widths For columns containing any type of value: 1 Select the table in the Editing Pane. 2 In the dark gray bar at the top of the table header fields, drag the column borders with the mouse. For columns containing string values: 1 Select the table in the Editing Pane. 2 In Table Properties, select the Columns page. 3 Select the column that you want to adjust. 4 Click Column Properties. The Column Properties dialog opens. 5 In the Column Properties dialog, select the Value Format page. 6 Enter the required width (number of characters) in the Column Width field. 7 Save the settings. To adjust the colors and fonts in a table You have the following options for adjusting the colors and fonts used in a table: Select a table style for the entire table. Set the colors and fonts manually for a specific column or for the entire table. You can set the colors/fonts separately for the table headings and the table data. Configure conditional formatting for a specific column (see To highlight outliers using conditional formatting on page 32). The settings are applied in the order shown here. Thus, the table style is overruled by the color and font specifications, which are overruled by the conditional formatting. Concepts Guide 31
32 3 Tables Using Tables To select a table style: 1 In Table Properties, select the Format page. 2 Select one of the styles in the Format Styles list box. The corresponding appearance is shown under Preview. 3 Save the settings. To set colors and fonts for the entire table: 1 In Table Properties, select the Style page. 2 Under Data Font Properties For All Columns, adjust the settings for the table data. 3 Under Header Font Properties For All Columns, adjust the settings for the table headers. 4 Save the settings. To set colors and fonts manually for a specific column: 1 In Table Properties, select the Columns page. 2 Select the column for which you want to change the colors or fonts. 3 Click Column Properties. The Column Properties dialog opens. 4 In Column Properties, select the Font page. 5 Adjust the settings for the table data and the table header. 6 Save the settings. To highlight outliers using conditional formatting You can use conditional formatting, for example, to highlight outliers in a data overview. Values that are outside a specified range or meet other specific conditions are displayed in a different color or font. 1 In Column Properties, select the Conditional Formatting page. 2 Scroll to the color or font property you want to use for highlighting the outliers. For example, if you want to use bold fonts for the outliers, scroll to the Font Weight section. 32 Concepts Guide
33 Tables 3 Using Tables 3 Enter the expression that determines the condition. For example, if you want to highlight all compound amounts greater than 4, enter the following expression: Expression Operation Value Compound_Amount > =4 If the expression is true for, the given format is activated. 4 Save the settings. To adjust the table borders Depending on the snippet, you have the following options for adjusting the table borders: In some table snippets, you can select a table style for the entire table. The table style determines the style of inside borders and outside edges. In all table snippets, you can manually configure the table borders. The manual settings overrule the table style settings. To choose a table style: 1 In Table Properties, select the Format page. 2 Select one of the styles in the Format Styles list box. The corresponding appearance is shown under Preview. 3 Save the settings. To manually configure the table borders: 1 In Table Properties, select the Style page. 2 Adjust the default settings or the settings of each individual border. NOTE To hide the borders, set the Style property to None. To show the borders, set the Style property e.g. to Solid. 3 Save the settings. Concepts Guide 33
34 3 Tables Using Tables To change the column header To change the headers directly in the Editing Pane: 1 Double-click the table header in the Editing Pane. You can now edit the header text directly. 2 To confirm the new text, press Enter or click outside the header. To change the headers in Table Properties: 1 In Table Properties, select the Columns page. 2 In Table Layout, double-click the header you want to edit. You can now edit the header text directly. 3 To confirm the new text, press Enter or move the mouse over the Available Fields area. To change the headers in Column Properties: 1 In Table Properties, select the Columns page. 2 Select the column that you want to adjust. 3 Click Column Properties. The Column Properties dialog opens. 4 In the Column Properties dialog, select the Value page. 5 Under Header, change the text in the Header Text field. 6 Save the settings. To create a line break in a table header If you want to add a line break in a table header, you can use the vbnewline constant, which is provided by Visual Basic. For example, if you want to add a line break between the words Retention and Time, the expression in the table header will look like this: ="Retention" + vbnewline + "Time" This type of line break is not shown in the Editing Pane, but will be applied when you generate the report. 34 Concepts Guide
35 Tables 3 Using Tables To create a second table row To create a second row in the table header 1 In the Table Properties, select the Columns page. 2 Under Multiple Table Rows, select the Enable Additional Header Row check box. 3 Select the column for which you want to set the heading, and click Column Properties. The Column Properties dialog opens. 4 On the Value page, provide a header text for the second header row in the Additional Header Text field. 5 On the Header Format page, configure the format of the table header. Both header rows will have the same format. To create a second row in the table details 1 In the Table Properties, select the Columns page. 2 Under Multiple Table Rows, select the Enable Additional Detail Row check box. 3 Select the column for which you want to set the heading, and click Column Properties. NOTE We recommend using only one table details row for the first column, and adding a second table row only to the other columns. This will make it easier to identify the table rows belonging to each other in the generated report. The Column Properties dialog opens. 4 On the Value page, provide an expression for the second detail row in the Additional Value field. 5 On the Value Format page, configure the format of the two detail rows. The basic formatting will be the same for both detail rows. You can, however, set a different number format for each detail row. 6 On the Summary Calculations page, you can configure specific summary calculations for each detail row. From the drop-down list, choose the detail row that you want to configure. However, for a better overview of the results, we recommend creating a summary calculation only for one specific detail row. Concepts Guide 35

36 3 Tables Using Tables 7 On the Conditional Formatting page, you can format each detail row separately. From the drop-down list, choose the detail row that you want to configure. Figure 3 Example of a double-row table To change the text alignment in a table 1 In Table Properties, select the Columns page. 2 Select the column that you want to adjust. 3 Click Column Properties. The Column Properties dialog opens. 4 To adjust the alignment of the table header, select the Header Format page. To adjust the alignment of the value, select the Value Format page. 5 Adjust the horizontal/vertical alignment and the other cell properties as needed. 6 Save the settings. To adjust the number format in a table 1 In Table Properties, select the Columns page. 2 Select the column that you want to adjust. 3 Click Column Properties. The Column Properties dialog opens. 36 Concepts Guide
37 Tables 3 Using Tables 4 In the Column Properties dialog, select the Value Format page. 5 Under Number Format, adjust the settings according to your requirements. The Preview area shows the appearance of the currently selected settings. NOTE The Number Format section is only visible if the selected column contains numbers. 6 Save the settings. To configure a table footer You can add various functions to the table footer. These functions summarize the data of the entire table. 1 Select the column that you want to summarize, then click Column Properties. The Column Properties dialog opens. 2 In the Column Properties dialog, select the Summary Calculations page. 3 Select the functions that you want to use in the table footer. Each function will appear in a separate row. 4 Adjust the number format for each function used. a Under Number Format for Summary Calculations, select the relevant function. b Adjust the number format as required. The Preview area shows the appearance of the currently selected settings. 5 Save the settings. The selected functions are added to the table as footer rows. Each function is shown in its own footer row. NOTE NOTE If you add a summary calculation, the table will expand downwards in the generated template. However, the layout of the report item is not automatically adjusted in the Editing Pane! You need to resize the table layout to allow for the additional footer lines. Otherwise, the subsequent report items may overlay the table footer in the generated template. If a table column shows an expression that contains a calculation variable or a report parameter, you cannot add a summary calculation for this column. Concepts Guide 37
38 3 Tables Using Tables To sort a table You can provide sorting expressions for any report item that lists multiple pieces of information, such as tables or composite groups. This procedure explains how to change the sorting expression for a table, but it basically applies also to the other report items. 1 In the properties dialog, select the Sorting page. 2 In the Expression drop-down list, select the data field you want to use for sorting. For example, you can sort by the following expressions: Fields > Peak > RetentionTime if you want to sort by the retention time Fields > Sample > AcquisitionOrderNo if you want to sort by the order of the samples in the sequence table. Fields > Sample > OrderNo if the sequence template specifies multiple injections for a line, and you want to group and sort injections that originate from the same template line. This field contains the sequence table line number of the first injection for a template line. Fields > Injection > OrderNo if you want to sort by the order in which the injections took place The correct name of the respective data field is shown with an equals sign in front of it. For example: =Peak_RetentionTime. 3 In the Direction drop-down list, select whether you want to sort the entries in an ascending or descending order. 4 If required, you can add expressions to sort by more than one field. The sorting expressions will be applied from top to bottom. 5 If required, change the order of the sorting expressions with the arrow buttons and. 38 Concepts Guide
39 Tables 3 Using Tables To filter a table If you want to create a table that shows only specific data, you need to filter the table accordingly. This procedure shows you how to filter for a sample name, sample type, or compound name. 1 In Table Properties, select the Filtering page. 2 In the Expression drop-down list, select the data field that you want to use for filtering: Fields > Sample > NAME if you want to filter for a specific sample name Fields > Sample > TYPE if you want to filter for a specific sample type Fields > Compound > NAME if you want to filter for a specific compound name The correct name of the respective data field is shown with an equals sign in front of it. For example: =Sample_Name. 3 In the Operation drop-down list, select Equals. 4 Select the Value field. If you start typing, you replace the entire existing content of the field. If you press F2, the cursor is shown, and you can edit the existing content. 5 Enter the required value. NOTE In the Value field, always start with an Equals sign (=). Text strings must be enclosed in quotes to be recognized as text. Numbers are written without quotes. NOTE If you filter for an enumeration, you must enter the required number in the Value field. See Enumerations on page 176 for an overview of all enumerations. For example: ="Standard L1" as a sample name =1 as a sample type, in this case the calibration samples ="TRAMADOL" as a compound name 6 Click OK to confirm the settings. The table in the generated report now contains only the data that passed the filter condition. Concepts Guide 39
40 3 Tables Using Tables To filter for peak area or area% To exclude small peaks 1 In Table Properties, select the Peaks and Repeating page. 2 Under Area Rejection, select the check boxes to exclude peaks with area or area% less than a specific value. 3 Enter a value for area or area%. This value is used as a minimum value. Only peaks with an area or area% equal to or greater than this value are included in the report. To exclude large peaks 1 In Table Properties, select the Filtering page. 2 Enter a filter expression to filter for peaks with an area or area% equal to or greater than a specific value. For example, you can use the following expressions: Expression Operation Value =Peak_Area > =3 =Peak_AreaPercent > =3 NOTE After reloading a template in the Editing Pane, RTE may automatically map the filter condition to the Area Rejection property. This happens, if you use the Greater Than (>) operators. The filter expression is then removed from the Filtering page and is visible in the Peaks and Repeating page instead. 40 Concepts Guide
41 Tables 3 Using Tables To repeat a table This procedure shows you how to repeat a table on the compound name. 1 In Table Properties, select the Peaks and Repeating page. 2 In the Repeat Table On drop-down list, select Fields > Compound > NAME The name of the according data field is shown, with an equals sign in front of it: =Compound_Name. 3 Click OK to confirm the settings. In the table preview in the Editing Pane, a headline is added for the compound name. If you generate the report, the table will be repeated for each compound name available in the current scope. To adjust the Repeat On field This procedure explains how you can adjust the label, value, or format of the Repeat On field for repeated tables. Prerequisites In the table properties, you have provided a Repeat Table On expression. 1 In Table Properties, select the Peaks and Repeating page. 2 Click Repeat On Field Properties. 3 Choose the label, value expression, and format for the Repeat On field. 4 Click OK. Concepts Guide 41

42 3 Tables About Table Groups About Table Groups With table groups, you can structure the detail rows of a table. You can define specific header rows, and show footer rows with summary information specifically for that group. For example, if you used two detector wavelengths for signal detection, you get two signals for each detected compound. In this case, you can create a table group for the detector wavelengths in order to show all signals of one wavelength under each other, with a group header above and a summarizing footer below the details rows. Usage of table groups is limited to max. three groups. The order of grouping is defined by the position of the group in the list. Two groups will be shown with header/footer lines in the report template, the third group will only be used to organize the detail rows in the table. 42 Concepts Guide
43 Tables 3 About Table Groups Preparation for using table groups Using table groups can make the table quite complex, especially if there is more than one group. It is important that you plan the table groups in advance and know exactly how the groups will structure your data. Otherwise, you might get unexpected results and will not know which properties of which group must be changed to correct the table. Use the following guidelines before creating table groups: What is the top-level element in your report template? Use this element for the Repeat Table On setting. Which field should be used to group the detail data? Which (static) sub headline should be used for the groups? Use this information for the Group On setting in the table group. Which fields should be used to sort the detail data inside each group? Use this information in the properties of the table itself. The table sorting will overrule the table group sorting. Which footers do you need needed for each table group? The use of headers or footers is optional. It may be useful to provide a summary of statistical information on a specific table group. Concepts Guide 43
44 3 Tables Using Table Groups Using Table Groups To configure a table group 1 In Table Properties, select the Grouping page. 2 Click Add to create a new table group. The Group Properties dialog opens. The Group Name is generated automatically. 3 In Group Properties, provide a Group On expression. This expression will be used to group the table detail rows. 4 If required: Select the Columns page and specify the group header and group footer information. To create a group header, enter a string in the Group Header column. To create a group footer, select one or more of the provided check boxes. 5 If required: Select the Filtering page and specify a filter expression for the distinct group values. 6 If required: Select the Sorting page and specify a sorting expression for the distinct group values. This sorting can differ from the sorting of the table detail rows! NOTE The sorting of table group data is only applied within each single group. The order of the different groups in the table depends on the table sorting. 44 Concepts Guide

45 Tables 3 About Custom Tables About Custom Tables The Custom Table snippet allows you to report custom data on sequence level or injection level. The data will be displayed in a tabular format to report key-value pairs. The key-value pairs are stored in complex custom fields, but the custom field information is also present in an external XML file. The XML file is referenced in the chromatographic data. NOTE It depends on the instrument drivers which XML files they provide. Concepts Guide 45
46 3 Tables About Custom Tables 46 Concepts Guide
47 Concepts Guide 4 Matrices About Matrices 48 About Matrix Groups 49 Using Matrices 51 To create a matrix 51 To sort a matrix 52 To adjust the column widths 53 This chapter describes the characteristics and usage of matrices in RTE. Agilent Technologies 47
48 4 Matrices About Matrices About Matrices Matrices are like pivot tables or crosstabs in a spreadsheet. As we have seen in the previous chapters, tables contain a variable number of rows, depending on the dataset contents, and a fixed number of columns with detail information. Matrices, however, also contain a variable number of columns. The number of columns depends on the dataset contents. In a table, for example, you can show a list of all compounds found in a specific injection, and the columns show the specific properties (such as amount or retention time) of each compound. In a matrix you can show a list of all injections; the number of columns corresponds to the number of detected compounds in the injected samples. NOTE If your data contains multiple signals, the matrix items in the Report Template Editor will only show the main signal. 48 Concepts Guide

49 Matrices 4 About Matrix Groups About Matrix Groups The most important thing about matrices is that everything in a matrix is based on groups. In contrast to tables, matrices contain two different types of groups: row groups and column groups. In the snippets available in the Report Items browser, these row groups and column groups are preconfigured. You can only partially change these settings. The options that you can change may vary from snippet to snippet. Row groups Row groups define the data in the left part of the matrix. If a matrix contains several row groups, there are several specific columns in this left part, where each column is defined by its own row group. The following figure shows the principle: Figure 4 Row groups The number of row groups and the width of the corresponding columns is defined by the snippet. You can not change these settings in the Report Template Editor. Concepts Guide 49


50 4 Matrices About Matrix Groups Column groups The column group defines the data that makes up the columns in the right part of the matrix. In some matrix snippets, you can adjust the value used to build the columns. The following figure shows the principle: Figure 5 Column groups Data properties The detail data is always displayed in the cells defined by the row groups and column groups. The details cells can be split in order to show several different values that belong to the same groups. These multiple details cells can be shown either in columns (side by side) or in rows (on top of each other). The layout type is defined by the snippet and can not be changed in the Report Template Editor. The number of details cells and their content can be configured in the matrix properties. Figure 6 Details cells shown on top of each other Figure 7 Details cells shown side by side 50 Concepts Guide

51 Matrices 4 Using Matrices Using Matrices To create a matrix With the available matrix snippets, you can create overviews for different scenarios: With the Compound Summary RT Amount snippet, you generate an overview of the retention times and amounts for each detected compound. The compounds are shown as columns; the sample names, vial locations, and injection numbers are shown as rows. The snippet also contains summary calculations in the footer (average, standard deviation, and relative standard deviation). There are two Sample Summary snippets. With these snippets, you generate an overview of the retention time and compound amount for each sample. The sample names are shown as columns; the compound names and their respective retention times are shown as rows. Concepts Guide 51
52 4 Matrices Using Matrices The Sample Summary Area Amount snippet is not repeated on a specific field. Thus, it shows all samples in the same overview. If there are many samples, the matrix width may become quite large. This snippet is typically used to obtain an overview of a specific set of samples. The Sample Summary per Type is repeated on Sample_Type. Thus, the matrix is repeated several times, and each repetition shows only samples of the same sample type. To sort a matrix There is no Sorting page available for the matrix itself. Any sorting information must be provided separately for the respective row group or column group! 1 In the Matrix Properties, select the Grouping page. 2 To change the sort order of a row group, click Edit in the Rows section. To change the sort order of a column group, click Edit in the Columns section. For more information on row groups and column groups, see About Matrix Groups on page Select the Sorting page. 4 In the Expression drop-down list, select the data field you want to use for sorting. For example, you can sort by the following expressions: Fields > Peak > RetentionTime if you want to sort by the retention time Fields > Sample > AcquisitionOrderNo if you want to sort by the order of the samples in the sequence table. Fields > Sample > OrderNo if the sequence template specifies multiple injections for a line, and you want to group and sort injections that originate from the same template line. This field contains the sequence table line number of the first injection for a template line. Fields > Injection > OrderNo if you want to sort by the order in which the injections took place The correct name of the respective data field is shown with an equals sign in front of it. For example: =Peak_RetentionTime. 52 Concepts Guide
53 Matrices 4 Using Matrices 5 In the Direction drop-down list, select whether you want to sort the entries in an ascending or descending order. 6 If required, you can add expressions to sort by more than one field. The sorting expressions will be applied from top to bottom. 7 If required, change the order of the sorting expressions with the arrow buttons and. To adjust the column widths You can adjust the width of both the static columns shown in the left part of the matrix and the width of the dynamically created columns in the right part of the matrix. To change the width of static columns: 1 In Matrix Properties, select the Grouping page. 2 Select the appropriate row group, and click Edit. 3 In Group Properties, select the Format page. 4 Enter a suitable number of characters for the column width. 5 Save your settings. To change the width of dynamically created columns: 1 In the Matrix Properties, select the Data page. 2 Select the appropriate column, and click Column Properties. 3 In Column Properties, select the Format page. 4 Under Column Width, enter a suitable number (in points) for the column width. Concepts Guide 53
54 4 Matrices Using Matrices 54 Concepts Guide
55 Concepts Guide 5 Composite Groups About Composite Groups 56 Using Composite Groups 57 To create a Composite Group 57 To repeat a composite group 58 To create a nested composite group 58 To filter a composite group 59 This chapter describes the characteristics and usage of Composite Groups in RTE. Agilent Technologies 55

56 5 Composite Groups About Composite Groups About Composite Groups A composite group is a conglomeration of report items of any type that are always used together. In the Report Items browser, you find predefined composite groups in the Sequences category and in the Samples category. These groups contain a collection of data fields with basic header information on a sequence or sample. In the Editing Pane, composite groups are marked by a surrounding rectangle. Save locally If you save the composite group in the Report Template Editor, the composite group is listed in the Report Items browser under the Composite Groups category. You can then reuse it for other report templates. The xml file associated to the composite group is saved in your local file system, so that you can transfer the xml file to other computers and reuse the composite group there as well. The location depends on the host application and the operation system. For example, with OpenLAB CDS ChemStation Edition and Windows XP, the xml file is saved under C:\Documents and Settings\ [username]\application Data\Agilent Technologies\Agilent ChemStation\[version]\ IntelligentReporter\CompositeGroups. Repeat on Composite groups can be repeated on a specific key information. The entire group is then displayed several times - once for each value of the selected information. For example, a group containing information on samples may be repeated for each sample in a sequence. Composite groups correspond to lists in Microsoft Business Intelligence Studio. 56 Concepts Guide
57 Composite Groups 5 Using Composite Groups Using Composite Groups To create a Composite Group Prerequisites You have placed several report items in the template that should always be used together. These may be report items of any type, including other composite groups. To prepare the group: 1 Select all of the report items that you want to combine to form a composite group. You can select multiple report items in different ways: Drag the mouse over the relevant items. - or - Select the first item, then hold down Ctrl and click the other required items one after each other. All of the required items are now selected. 2 Click the Group Items icon in the toolbar. A rectangle is added that encloses the selected report items. 3 To configure the group properties, right-click anywhere inside the group, and select Properties from the context menu. Be careful not to click any specific report item, as this would select the specific item instead of the group. The Composite Group Properties dialog opens. To save the group: 1 Right-click anywhere inside the group, and select Save Composite Group from the context menu. Be careful not to click any specific report item, as this would select the specific item instead of the group. 2 Enter a suitable name for the group. NOTE Existing composite groups cannot be overwritten. You must always provide a new name when saving a composite group. The new composite group is now available in the Report Items browser under the Composite Groups category. Concepts Guide 57
58 5 Composite Groups Using Composite Groups To repeat a composite group The following procedure shows you how to repeat a composite group on the sample name. 1 In the Composite Group Properties, select the Grouping page. 2 In the Group Repeat drop-down list, select Fields > Sample > NAME. The name of the respective database field is shown, with an equals sign in front of it: =Sample_Name. 3 Click OK to confirm your settings. To create a nested composite group A composite group may contain any type of report item, even other composite groups. This way it is possible to create nested groups where, for example, the outer group is repeated on the sample type, and the inner group is repeated on the sample name. The following procedure shows you how to create a nested group. 1 Create and save a composite group with sample information that is repeated on the sample name. 2 Add the field Sample_Type to your template. Place it above the previously created composite group. 3 Select both the Sample_Type field and the previously prepared composite group. 4 Create a new composite group containing the two selected items. 5 Repeat the new composite group on Sample_Type. If you generate the report, the different sample types are shown as headings. Under each sample type, the respective samples are listed. NOTE Nested composite groups correlate to "lists in lists" in Microsoft Business Intelligence Studio. 58 Concepts Guide
59 Composite Groups 5 Using Composite Groups To filter a composite group The filter of a composite group is only active if the composite group is repeated on a specific value. If you need to filter a composite group that is not repeated at all, enter the expression =-1 as the Group repeat on value. With -1, the composite group is shown only once, but the filter is active nonetheless. Concepts Guide 59
60 5 Composite Groups Using Composite Groups 60 Concepts Guide
61 Concepts Guide 6 Images About Images 62 Using Images 62 This chapter describes the characteristics and usage of images in RTE. Agilent Technologies 61
62 6 Images About Images About Images RTE offers you the possibility to add images, such as your company logo, to the report template. Images are typically added to the report header, but you can also place them in the report body or report footer. You find the image items in the Report Items browser under the Special Objects category. The default image is an Agilent logo, but you can change the image source and also the image size in the Image Properties dialog. The file selection dialog for the image source automatically opens when you drop the predefined image item onto the template. Using Images 1 Drag and drop the image to your template. OR Add an the default image from the Report Items tree (Special Objects > Image). 2 Adjust the image properties. 62 Concepts Guide
63 Concepts Guide 7 Chromatograms About Chromatograms 64 Using Chromatograms 67 To show only specific samples or signals 67 To show only a specific sample type 68 To label also the missing compounds 69 To switch on/off peak labeling depending on the peak 69 To show only peaks with a certain minimum area 70 To scale on the peak height of a certain compound 70 To create a single peak plot 71 To create a multi page plot 72 To show an instrument curve 72 This chapter describes the characteristics and usage of chromatograms in RTE. Agilent Technologies 63

64 7 Chromatograms About Chromatograms About Chromatograms With chromatogram report items, you can print signals from the detectors of the chromatographic system on the report. The report item shows the results for all injections that are included in the selected data. There is at least one signal per injection. If the detector was configured to give multiple measurements, for example a diode-array or multi-wavelength detector, the chromatogram accordingly contains multiple signals per injection. NOTE The data shown in the chromatogram also depends on whether the chromatogram is placed in a composite group and on the grouping and filtering of the composite group. Depending on the configuration of the report item, the signals may be shown in separate graphs, overlaid graphs, stacked graphs, or as Iso plots. Figure 8 Example: chromatogram with three signals in separate graphs 64 Concepts Guide


65 Chromatograms 7 About Chromatograms Figure 9 Example: chromatogram with multiple signals in an overlaid graph Figure 10 Example: chromatogram with multiple signals in a stacked graph Figure 11 Example: chromatogram with multiple signals shown as iso plot Concepts Guide 65
66 7 Chromatograms About Chromatograms Single Signal Plot and Multi Signal Plot In the Report Items browser, different types of snippets are available for the chromatogram: The Single Signal Plot snippet always shows only one detector signal. The chromatogram is automatically repeated on the signal ID. Therefore, if the data contains multiple signals (for example, from multiple injections or from a multi-wavelength detector), the chromatogram is repeated several times. The Multi Signal Plot snippets show all signals in the same chromatogram report item. You can configure the display format and group settings. 66 Concepts Guide
67 Chromatograms 7 Using Chromatograms Using Chromatograms To show only specific samples or signals Specific samples If you want to show only the signals for a specific sample (here: the sample SSRSD1) in a chromatogram, you can filter for the sample name. Expression Operation Value =Sample_Name = ="SSRSD1" In order to compare the signals for two different samples, add a second expression for the other sample name. The two expressions will automatically be linked by Or. Alternatively, you can use the Contains operator and a wildcard in the Value field: Expression Operation Value =Sample_Name Contains ="SSRSD *" Specific signals If you want display only the signals from a specific detector, you can filter for the detector name (here: DAD1). The detector name is usually contained in the first characters of the signal name. Therefore you filter for all signals where the relevant characters are contained in the signal name. Expression Operation Value =Signal_Name Contains ="DAD1" If you want to filter for one specific signal, use the complete signal name (here: DAD1 A, Sig=270,8 Ref=500,100) in the filter expression. Expression Operation Value =Signal_Name = ="DAD1 A, Sig=270,8 Ref=500,100" Concepts Guide 67
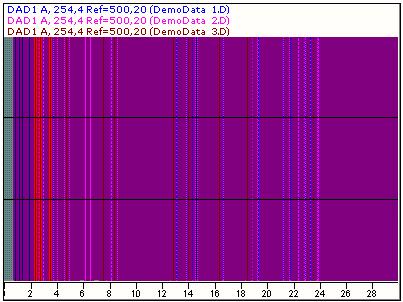
68 7 Chromatograms Using Chromatograms To show only a specific sample type This procedure shows you how to create an overlaid chromatogram that displays only the samples of a specific sample type. To create one chromatogram for each sample type: 1 Add the data field Fields > Sample > Type to the report template. 2 Add the Multi Signal Plot Overlaid snippet to the report template. 3 Select the two items and click the Group Items icon to create a composite group. 4 Repeat the composite group on Sample_Type. 5 If you used multiple signals, filter the chromatogram for one specific signal. For example, the filter expression would be: Expression Operation Value Signal_Name Contains ="DAD 1A*" To create a template with only one chromatogram for one sample type: 1 Add the Multi Signal Plot Overlaid snippet to the template. 2 Filter for the sample type, and if required, for a specific signal. For example, the filter expression would be: Expression Operation Value Sample_Type = =3 Signal_Name Contains ="DAD 1A*" NOTE If you filter for an enumeration (such as Sample_Type), you must enter the required number in the Value field. See Enumerations on page 176 for an overview of all enumerations. 68 Concepts Guide
69 Chromatograms 7 Using Chromatograms To label also the missing compounds By default, only the identified compounds are labeled in the chromatogram. If you want to add labels for the missing compounds at the respective retention times, proceed as follows: 1 In Multi Signal Plot Properties, select the Peak Labels page. 2 Make sure the Show Peak Labels check box is selected. 3 Select the Undetected Compounds check box. 4 Save the settings. NOTE The report item preview in the Editing Pane is based on built-in data, not on the actually selected data. The labels for undetected compounds will therefore be visible only after generating the report. To switch on/off peak labeling depending on the peak If you want to label the peaks depending on certain peak properties, you must create a customized expression for the peak labels. 1 In Multi Signal Plot Properties, select the Peak Labels page. 2 Make sure, the Show Peak Labels check box is selected. 3 Under Peak Labels, select No Label for the labels 2 to 4. 4 Click fx... to create a customized expression for Label 1. The Expression Editor opens. 5 Enter one of the following expressions, according to your requirements. Expression =Iif(Peak_Area> 5, Str(Round(Peak_RetentionTime, 2)), "") =Iif(UCase(Compound_Name)="TRAMADOL", "*** Tramadol found ***", "") Description Shows the retention time rounded to two decimals, but only for peaks with a calculated area greater than five. Shows the label "*** Tramadol found ***" for the Tramadol peak. All other peaks remain unlabeled. 6 Save the settings. Concepts Guide 69
70 7 Chromatograms Using Chromatograms To show only peaks with a certain minimum area If you want to show only peaks with a certain minimum area, you can filter for the peak area. For example, you can show only peaks with Area% greater than 5. Expression Operation Value =Peak_AreaPercent > =5 NOTE If all peaks are filtered out, no signal is displayed. To scale on the peak height of a certain compound If you want scale on the peak of a certain compound, and you do not know how many other compounds there are and which peak heights they have, you can use a customized expression to scale on the correct peak. 1 In the Multi Signal Plot Properties, select the Signal Axis page. 2 Under Scaling, select All Signals in Given Scale. 3 Click fx... to the right of the To field. The Expression Editor opens. 4 Enter the following expression: Expression =Iif(UCase( Compound_Name)="TRAMADOL", Peak_Height*1.05, "") Description This expression returns the height of the Tramadol peak, multiplied by "Tramadol" may be written in uppercase or lowercase in the method. 5 Save the settings. 70 Concepts Guide
71 Chromatograms 7 Using Chromatograms To create a single peak plot 1 Create a composite group that is repeated on Peak_ID. With this group, you ensure that only one single peak is shown in each chromatogram. NOTE If you want to create a single peak plot for only one compound, you can filter the composite group for the required compound. 2 Add a chromatogram to the composite group. 3 Configure the Signal Axis of the chromatogram. a Under Scaling, select All signals in given scale. b Enter the following expressions for the upper limit of the signal axis: Use for Expression Description To =Peak_Height*1.05 This expressions returns the peak height multiplied by There are different ways to configure the Time Axis page. With the following settings, the signal axis is labeled with absolute values, and the upper limit in each graph will correspond to the height of each peak. a b Under Scaling, select All Time Axes with Same Scale, and select the Custom scale check box. Enter the following expressions for the lower and upper limit of the time axis: Use for Expression Description From =Round(Peak_BeginTime- 0.05*(Peak_EndTime - Peak_BeginTime), 1) This expressions returns the peak begin time, minus five percent of the peak duration. To =Round(Peak_EndTime *(Peak_EndTime - Peak_BeginTime), 1) This expressions returns the peak end time, plus five percent of the peak duration. 5 Save your settings. Concepts Guide 71
72 7 Chromatograms Using Chromatograms To create a multi page plot If you want to divide a chromatogram into two parts, you need to add two chromatogram items to your report template. If you place them inside a composite group, make sure both chromatograms are placed inside. Also, the filter conditions for each of the chromatograms must be identical. The only difference between the two chromatograms is the time range: First chromatogram: from 0 to 50% (or to 52.5% to get a small overlap) Second chromatogram: from 50 to 100% (or from 47.5% to get a small overlap) NOTE When creating multi-page plots, carefully consider which option you select under Search Scale Within for the scaling of the signal axis. If you select the Given Time Axis Range option, you will obtain different signal axes for each separate plot. To show an instrument curve You can display various instrument curves, depending on the modules you use. This procedure shows you how to add the pump pressure instrument curve to your report. 1 In the Chromatogram Properties, select the Instrument Curves page. 2 Select the Include Instrument Curves check box. 3 To show the chromatograms together with the instrument curves, select the Include Chromatograms check box. To show instrument curves without chromatograms, clear the Include Chromatograms check box. 4 Under Filter List, click into the Expression field. The expression SIGNAL NAME is automatically set. 5 In the Operation field, select Contains. 6 In the Value field, enter *Pressure*. 72 Concepts Guide
73 Chromatograms 7 Using Chromatograms 7 Save the settings. 8 Preview the report. Each chromatogram in the report contains the associated pressure curve. If you used two pumps, two pressure curves will be displayed. The display format (such as Overlaid or Separate) depends on the settings in the Multi Signals page of the Chromatogram Properties. NOTE In order to find out which other instrument traces are available, remove any filters in the Instrument Traces page and preview the report. The available signal names are shown in a legend. Concepts Guide 73
74 7 Chromatograms Using Chromatograms 74 Concepts Guide
75 Concepts Guide 8 Calibration Curves About Calibration Curves 76 Using Calibration Curves 78 To create a calibration curve 78 To place multiple curves in a row 80 To Show Disabled Calibration Points 80 This chapter describes the characteristics and usage of calibration curves in RTE. Agilent Technologies 75

76 8 Calibration Curves About Calibration Curves About Calibration Curves With calibration curves, you can place the visual presentation of the calibration results on your report template. The graph shows the results for all compounds and calibration samples that are included in the selected data. NOTE In order to obtain a calibration curve, you must have configured the respective samples as calibration samples in the sequence table, and you must have configured the calibration table. Depending on the configuration of the report item, the multiple curves may be shown in separate, overlaid, or stacked graphs. Figure 12 Example: calibration curve with separate graphs 76 Concepts Guide

77 Calibration Curves 8 About Calibration Curves Figure 13 Example: calibration curves in an overlaid graph Types of calibration curves In the Report Items browser, the following snippets are available for the calibration curve: Calib Curve Plot by Compound contains a composite group with a calibration curve and additional information such as the formula or the correlation coefficient. The composite group is automatically repeated on the compound name. Therefore, if your data contains multiple calibrated compounds, the information is repeated several times. Calibration Curves Overlaid adds a single calibration curve item. In this item all curves contained in the current scope (defined by data selection, grouping, filtering, etc.) are shown overlaid in the same graph. You can configure the display format and group settings. Concepts Guide 77

78 8 Calibration Curves Using Calibration Curves Using Calibration Curves To create a calibration curve With the available calibration curve snippets, you can create calibration curves for different scenarios. See the following examples: In order to create an overlaid calibration curve with data from multiple compounds, simply add the Calibration Curves Overlaid snippet to your report. The report will show only one graph in which the curves of all compounds are overlaid. To show the calibration curves for single compound, you have the following options: Add the Calibration Curves Overlaid snippet and filter the calibration curve item for the required compound (for example, Compound_Name="TRAMADOL"). Only one calibration curve will be shown in the report. Add the Calib Curve Plot by Compound snippet. A composite group will be shown that is repeated on the compound name. The composite group also contains some more information on the calibration curve, such as the formula or the correlation coefficient. 78 Concepts Guide

79 Calibration Curves 8 Using Calibration Curves NOTE If a ChemStation data file was processed with a non-matching calibration table, the report shows an empty calibration curve, and no peaks are identified. This happens if the calibration table has been set up for one signal, but data have been recorded for a different signal. Ensure that the signal description in the calibration table exactly matches the DAD signal set up in the used method (for example, DAD1A 254,4 Ref 360,600). Concepts Guide 79

80 8 Calibration Curves To Show Disabled Calibration Points To place multiple curves in a row Calibration curves are shown one under each other by default. However, you can configure the report item so that multiple curves are shown side by side in the same row. To place multiple curves in a row 1 Add a calibration curve report item to your template. 2 In Calibration Curve Properties, select the Multi Curves page. 3 Under Display format, select Separate. Only separate graphs can be shown side by side in the same row. 4 In Calibration Curve Properties, select the Layout page. 5 In the # Graphics field, enter the number of curves to be shown in one row. For example, enter 4 to show four curves in one row. 6 Save your settings. The given number of curves is now shown in the same row. Figure 14 4 calibration curves in the same row To Show Disabled Calibration Points 1 In Calibration Curve Properties, select the Point Labels page. 2 Under History Points, select the Show History Points check box. History points and disabled points use the same marker, but history points are always shown in red. 80 Concepts Guide
81 Concepts Guide 9 Spectra About Spectra 82 Using Spectra 84 This chapter describes the characteristics and usage of spectra in RTE. Agilent Technologies 81

82 9 Spectra About Spectra About Spectra With spectra report items, you can place the visual output of an optical 3D detector (for example, a diode array detector) on your report template. The spectra shown in the graph correspond to your selection of the positions in each peak. You can extract spectra, for example, at the start, at the apex, or at the end of a peak. In addition, you can filter the data shown in a spectrum using the filter list. Depending on the configuration of the report item, multiple spectra may be shown in separate graphs, overlaid graphs, stacked graphs, or as Iso plots. If there are spectra for different compounds, you can group the spectra by compound name. Figure 15 Example: three spectra in separate graphs 82 Concepts Guide


83 Spectra 9 About Spectra Figure 16 Example: three spectra in an overlaid graph Figure 17 Example: three spectra in a stacked graph Figure 18 Example: three spectra shown as Iso plot Concepts Guide 83


84 9 Spectra Using Spectra Using Spectra With the available spectra snippets, you can create graphs for different scenarios: The Spectra Plot snippet contains a plot where all available spectra are shown in an overlaid format. By default, the spectra are grouped by peak, and multiple spectra selected from the same peak are shown in an overlaid graph. This snippet is typically used in combination with a composite group that is repeated on a specific information, depending on your requirements. You can, for example, create a composite group that is repeated by sample name; inside this composite group, the Spectra Plot snippet will show one graph for each peak, with overlaid spectra for all injections of the current sample. The Spectra Plot All Peaks snippet contains a plot that is embedded in two composite groups. The first composite group is repeated on the signal name, the second composite group is repeated on the peak ID. Thus, you obtain a single spectrum for each peak and signal. 84 Concepts Guide


85 Spectra 9 Using Spectra The Spectra Plot Compounds snippet contains a plot that is embedded in a single composite group. The composite group is repeated on the peak ID, and it also contains the retention time and the compound name for each peak. If there are multiple signals, this snippet uses only the peaks of the main signal. The Spectra Plot per Peak snippet is repeated by peak, that is, the entire report item is displayed once for each peak in the generated report. You cannot remove the repeating by peak in the report item properties. Multiple spectra selected from the same peak are shown in an overlaid graph. Concepts Guide 85
86 9 Spectra Using Spectra 86 Concepts Guide
87 Concepts Guide 10 Mass Spectrometry Report Items About Mass Spectra 88 Total Ion Chromatogram (TIC) and Extracted-Ion Chromatogram (EIC) 88 MS Spectra Plot 89 Using Mass Spectra 90 To Show a Total Ion Chromatogram (TIC) 90 To Show an Extracted Ion Chromatogram (EIC) 90 To Show an MS Spectra Plot 91 To Reduce the Response Offset 91 This chapter describes the characteristics and usage of Mass Spectrometry report items in RTE. Agilent Technologies 87
88 10 Mass Spectrometry Report Items About Mass Spectra About Mass Spectra Total Ion Chromatogram (TIC) and Extracted-Ion Chromatogram (EIC) NOTE The number and content of TIC and EIC chromatograms depends on the settings in the data analysis method of the acquisition software. With the Chromatograms > MS Chromatogram snippet, you can add a Total Ion Chromatogram (TIC) or an Extracted-Ion Chromatogram (EIC) to your report template. The TIC shows the sum of all detected masses during the run. It can provide an overview, for example, in addition to a chromatogram generated with a UV/Vis detector. Figure 19 Example: UV/Vis and Total Ion Chromatogram 88 Concepts Guide

89 Mass Spectrometry Report Items 10 About Mass Spectra The EIC shows the abundance of only one specific ("extracted") mass-to-charge value during the run. You can have multiple EIC chromatograms for a single injection. The relevant mass-to-charge values are set in the data analysis method of the acquisition software. TIC and EIC have basically the same properties as other chromatogram items. You define the type of chromatogram by filtering for the corresponding signal names or signal types. The snippet Chromatograms > MS Chromatogram filters for any MS signal, that is, it shows both TIC and EICs, depending on their availability. You can adjust the filter conditions as required. MS Spectra Plot With the Spectra > MS Spectra Plot snippet, you add the centroid spectra plot for a specific peak. Figure 20 MS Spectra Plot report item Concepts Guide 89
90 10 Mass Spectrometry Report Items Using Mass Spectra Using Mass Spectra To Show a Total Ion Chromatogram (TIC) 1 Create a group that is repeated on the compounds or peaks. MS spectra plots are typically shown per compound or per peak. 2 To show only compounds or peaks that have been found in the Total Ion Chromatogram (TIC), add the following filter condition to the group: Expression Operation Value =Signal_Description Contains *TIC* 3 Add the snippet Spectra > MS Spectra Plot to the group. To Show an Extracted Ion Chromatogram (EIC) 1 If you want to show the EIC together with other compound information: Create a group that is repeated on compounds. 2 Add the snippet Chromatograms > MS Chromatogram to your report template. If you created a group, place the snippet inside this group. 3 In the filter conditions of the chromatogram, add a filter for the signal description: Expression Operation Value =Signal_Description Contains ="*EIC*" Alternatively, add the snippet Chromatograms > MS Compound Results. It contains the EICs and corresponding MS spectra for each compound in the current scope. Separate plots are shown for the main signal (highest mass peak, with calibration role Main (1)) and the qualifier signal (peak with calibration role Qualifier (2)). 90 Concepts Guide
91 Mass Spectrometry Report Items 10 Using Mass Spectra To Show an MS Spectra Plot 1 Create a group that is repeated on the compounds or peaks. MS spectra plots are typically shown per compound or per peak. 2 To show only compounds or peaks that have been found in the Total Ion Chromatogram (TIC), add the following filter condition to the group: Expression Operation Value =Signal_Description Contains *TIC* 3 Add the snippet Spectra > MS Spectra Plot to the group. To Reduce the Response Offset In UV/Vis spectra, there is typically a space (offset) shown between the graph and the x-axis. For the centroid spectra used in Mass Spectrometry, you may want to reduce this offset. 1 In the MS Spectra Properties, select the Response Axis page. 2 Under Scale Offset, enter 0 as the Low value. Concepts Guide 91
92 10 Mass Spectrometry Report Items Using Mass Spectra 92 Concepts Guide
93 Concepts Guide 11 Charts About Charts 94 Preparing the Data 96 Category Group 98 Series Group 101 Using Charts 102 To change the chart title and axes titles 102 To change the values plotted on the y-axis 102 To change the y-axis labels 103 To change the values plotted on the x-axis 103 To change the x-axis labels 104 To change the legend title 104 To change the series labels 105 To plot different y-values in the same chart 106 This chapter describes the characteristics and usage of charts in RTE. Agilent Technologies 93


94 11 Charts About Charts About Charts Charts are very useful for graphic display of data. As in tables or matrices, you can present aggregated data. The following chart types are available in RTE: Line chart With line charts you can visualize categorized data using a direct line to connect the values. The category values are used to label the x-axis. For example, you can categorize the data by the sample name, calibration level or compound name. Different series of data are shown as several lines in different colors. Line - Simple and Line - Smooth: Column chart Column charts are very similar to line charts. You can also visualize categorized data, but the data is shown as column bars instead of being connect with a line. The category values are used to label the x-axis. For example, you can categorize the data by the sample name, calibration level or compound name. Different series of data are shown as several bars in different colors. Column - Simple, Column - Stacked, and Column - Stacked 100%: 94 Concepts Guide


95 Charts 11 About Charts Scatter chart In scatter charts, the location of the data points is determined by x and y-values. The x-values are typically numeric values or date/time values. For example, you can show the ratio of compound amount to peak area in an accuracy plot. Scatter - Simple, Scatter - Lines, and Scatter - Smooth Lines: Bubble chart As in scatter charts, the location of the data points is determined by x and y-values. In addition, the size of the bubbles is determined by the variance in the value of a specific data field. The bubble size therefore adds a third dimension to the graph. Typically, you select a value such as Peak_Area to determine the bubble size. The bubble size will then vary for each printed peak (that is, for each bubble). The highest value - in this example, the largest peak area - will be drawn as the biggest bubble. The smallest value - in this example, the smallest peak area - will be drawn as the smallest bubble. NOTE If you use a constant value, or choose a data field whose value does not vary, all bubbles will have the same size. Bubble: Concepts Guide 95
96 11 Charts About Charts Preparing the Data Using charts, especially scatter or bubble charts, can be quite complex. It is important that you plan the axis scaling, category group and series group expression in advance and know exactly how they will structure your data. Otherwise, you might get unexpected results and will not know which properties you must change in order to correct the result. NOTE The data shown in the chart also depends on the report type and on whether the chart is placed in a composite group: In Single Injection reports, the entire template content is repeated for each single injection. It is therefore impossible to compare data from several injections in the same chart with a Single Injection report. In composite groups you can group, sort, and filter the data that will be available in a chart. Read and understand the following before creating a chart: Which chart type suits your requirements? If you want to label the x-axis with string values such as Sample 1, Sample 2, Sample 3, you will typically create a line chart or column chart. If you want to label the x-axis with numeric values such as the retention time or the compound amount, you will typically create a scatter chart or bubble chart. How many data points do you want to show in the chart? For example, one for each sample, one for each compound, or one for each peak? Which expression can you use to distinguish the data? Use this expression for the category group. Do you need to distinguish the data aggregated by the category group? For example, the category group may distinguish the samples names, but you used two signals and want to display one data point per signal and sample name. Use the additional expression (in this example, the signal name) as a series group expression. Do you need to filter the data? For example, filter the data to show only specific compounds or only specific signals. 96 Concepts Guide
97 Charts 11 About Charts Which values do you want to plot on the y-axis? These values must be numeric. We recommend using aggregating functions, as the category group may contain multiple values. For scatter charts and bubble charts: Which values do you want to plot on the x-axis? The x-values are typically numeric or date/time values. However, it is also possible to plot text values on the x-axis. NOTE For line and column charts, the category values are identical to the x-axis values. For scatter and bubble charts, the category group only has an impact on the amount of displayed data the x-axis values are set separately and can differ from the category values. Do you need to sort the data? We recommend using the same expression for sorting and grouping the category group. In line and column charts, this sorts the labels on the x-axis. For scatter charts using lines, the line connects the data points in the order given by the category group. For bubble charts: Which value should influence the bubble size? Concepts Guide 97
98 11 Charts About Charts Category Group For all chart types, the category group has an impact on the amount of displayed data. You can choose a category group expression that groups multiple subsets of data together. For example, if your data contains multiple injections of the same sample, you can choose the sample name for the grouping expression. The chart will then show only one data value for each distinct sample, such as the average compound amount. The impact of the category group on the x-axis labels depends on the chart type: For line and column charts, the category values are identical to the x-axis values. For scatter and bubble charts, the category group only has an impact on the amount of displayed data the x-axis values are set separately and can differ from the category values. Category Group Example For example, your data may include 3 samples, where each of the samples has been injected 2 times. If you select =Injection_ID as a grouping expression, the diagram will contain 6 data points. If you select =Sample_ID, the diagram will only contain 3 data points. Each data point may show, for example, the average of the 2 peak areas. 98 Concepts Guide
 Category group expression: =Sample_ID")
99 Charts 11 About Charts Line chart with the following settings: y-value: =Peak_Area Category group expression: =Injection_ID Line chart with the following settings: y-value: =Avg(Peak_Area) Category group expression: =Sample_ID Concepts Guide 99

 x-value: =Avg(Compound_Amount) Category group expression:")
100 11 Charts About Charts Scatter chart with the following settings: y-value: =Peak_Area x-value: =Compound_Amount Category group expression: =Injection_ID Scatter chart with the following settings: y-value: =Avg(Peak_Area) x-value: =Avg(Compound_Amount) Category group expression: =Sample_ID 100 Concepts Guide

101 Charts 11 About Charts Series Group You can place several series of data in the same chart. For example, you may want to create a chart that shows the stability of retention times over a set of injections. If there are several compounds, you can show a separate line for each compound. In this case, create a category group based on the injection ID, and a series group which is grouped by the compound name. The result may resemble the following line chart. Y-value: =Peak_RetentionTime Format code for y-axis label: F1 Category group expression: =Injection_ID Category sorted by: =Injection_AcquiredDate Series group expression: =Compound_Name Concepts Guide 101
Agilent ChemStation Plus
 Agilent ChemStation Plus Getting Started Guide Agilent Technologies Notices Agilent Technologies, Inc. 2004 No part of this manual may be reproduced in any form or by any means (including electronic storage
Agilent 1260 Infinity Purification Solution
 Agilent 1260 Infinity Purification Solution Administrator's Quick Start Guide Agilent Technologies Notices Agilent Technologies, Inc. 2017 No part of this manual may be reproduced in any form or by any
Agilent ChemStation Plus
 Agilent ChemStation Plus Getting Started Guide Agilent Technologies Notices Agilent Technologies, Inc. 2004, 2006-2008 No part of this manual may be reproduced in any form or by any means (including electronic
Agilent OpenLAB Chromatography Data System (CDS)
") Agilent OpenLAB Chromatography Data System (CDS) EZChrom Edition Reusing EZChrom Data in OpenLAB CDS with Data Store or ECM Notices Agilent Technologies, Inc. 2012 No part of this manual may be reproduced
Agilent OpenLAB Chromatography Data System (CDS) EZChrom Edition Reusing EZChrom Data in OpenLAB CDS with Data Store or ECM Notices Agilent Technologies, Inc. 2012 No part of this manual may be reproduced
Agilent OpenLAB ECM Intelligent Reporter
 Agilent OpenLAB ECM Intelligent Reporter Installation and Configuration Guide Agilent Technologies Notices Agilent Technologies, Inc. 2007-2016 No part of this manual may be reproduced in any form or by
Agilent OpenLAB Chromatography Data System (CDS)
") Agilent OpenLAB Chromatography Data System (CDS) ChemStation Edition Reusing Data from ChemStation B.04.03 SP1 and SP2 in OpenLAB CDS ChemStation Edition Notices Agilent Technologies, Inc. 2012-2013, 2014
Agilent OpenLAB Chromatography Data System (CDS) ChemStation Edition Reusing Data from ChemStation B.04.03 SP1 and SP2 in OpenLAB CDS ChemStation Edition Notices Agilent Technologies, Inc. 2012-2013, 2014
Agilent OpenLAB Chromatography Data System
 Agilent OpenLAB Chromatography Data System EZChrom Elite Edition Migration Guide Agilent Technologies Notices Agilent Technologies, Inc. 2010 No part of this manual may be reproduced in any form or by
Agilent OpenLAB. Data Store. Backup and Restore Guide
 Agilent OpenLAB Data Store Backup and Restore Guide Notices Agilent Technologies, Inc. 2012 No part of this manual may be reproduced in any form or by any means (including electronic storage and retrieval
Agilent EZChrom SI. Startup Guide
 Agilent EZChrom SI Startup Guide Notices Copyright Scientific Software, Inc 2003 Agilent Technologies, Inc. 2006. No part of this manual may be reproduced in any form or by any means (including electronic
Agilent OpenLAB Chromatography Data System (CDS)
") Agilent OpenLAB Chromatography Data System (CDS) EZChrom Edition Compatibility Guide for Agilent Instrument Controllers Agilent Technologies Notices Agilent Technologies, Inc. 2010 No part of this manual
Agilent OpenLAB Chromatography Data System (CDS) EZChrom Edition Compatibility Guide for Agilent Instrument Controllers Agilent Technologies Notices Agilent Technologies, Inc. 2010 No part of this manual
Agilent CSV Export Utility
 Agilent CSV Export Utility User Guide Agilent Technologies Notices Agilent Technologies, Inc. 2011 No part of this manual may be reproduced in any form or by any means (including electronic storage and
Agilent ChemStation. ECM Interface Guide. Agilent Technologies
 Agilent ChemStation ECM Interface Guide Agilent Technologies Notices Agilent Technologies, Inc. 2004, 2005-2007 No part of this manual may be reproduced in any form or by any means (including electronic
Agilent OpenLAB. Data Store. Maintenance Guide
 Agilent OpenLAB Data Store Maintenance Guide Notices Agilent Technologies, Inc. 2012 No part of this manual may be reproduced in any form or by any means (including electronic storage and retrieval or
Agilent OpenLAB Chromatography Data System
 Agilent OpenLAB Chromatography Data System EZChrom Edition EZChrom Elite and ICM Migration Guide Agilent Technologies Notices Agilent Technologies, Inc. 2011 No part of this manual may be reproduced in
Agilent OpenLAB Chromatography Data System (CDS)
") Agilent OpenLAB Chromatography Data System (CDS) ChemStation Edition AIC (M8304AA) Setup Guide Agilent Technologies Notices Agilent Technologies, Inc. 2010-2014, 2015 No part of this manual may be reproduced
Agilent OpenLAB Chromatography Data System (CDS) ChemStation Edition AIC (M8304AA) Setup Guide Agilent Technologies Notices Agilent Technologies, Inc. 2010-2014, 2015 No part of this manual may be reproduced
Agilent Series Logic Analysis System
 Agilent 16900-Series Logic Analysis System Quick Start Guide for 16700-Series Users Agilent Technologies Notices Agilent Technologies, Inc. 2003-2004 No part of this manual may be reproduced in any form
Agilent OpenLAB Chromatography Data System (CDS)
") Agilent OpenLAB Chromatography Data System (CDS) Hardware and Software Requirements Agilent Technologies Notices Agilent Technologies, Inc. 2013-2014 No part of this manual may be reproduced in any form
Agilent OpenLAB Chromatography Data System (CDS) Hardware and Software Requirements Agilent Technologies Notices Agilent Technologies, Inc. 2013-2014 No part of this manual may be reproduced in any form
Agilent OpenLAB Data Analysis Upload Download Tool. User s Guide
 Agilent OpenLAB Data Analysis Upload Download Tool User s Guide Notices Agilent Technologies, Inc. 2014 No part of this manual may be reproduced in any form or by any means (including electronic storage
Agilent MassHunter Metabolite ID Software. Installation and Getting Started Guide
 Agilent MassHunter Metabolite ID Software Installation and Getting Started Guide Notices Agilent Technologies, Inc. 2011 No part of this manual may be reproduced in any form or by any means (including
Agilent OpenLab CDS ChemStation Edition
 Agilent OpenLab CDS ChemStation Edition Upgrade Preparation Guide Rev. B.0x.0x to Rev. C.0x.0x ChemStation Upgrade Preparation Guide Agilent Technologies Notices Agilent Technologies, Inc. 2010-2017, 2018
OpenLAB CDS ChemStation Edition
 OpenLAB CDS ChemStation Edition Guide for Administrators Guide for Administrators Agilent Technologies Notices Agilent Technologies, Inc. 2010-2017 No part of this manual may be reproduced in any form
Agilent N2739A 1000 Series Oscilloscope Rack Mount Kit
 Agilent N2739A 1000 Series Oscilloscope Rack Mount Kit Installation Guide Agilent Technologies Notices Agilent Technologies, Inc. 2008 No part of this manual may be reproduced in any form or by any means
Agilent ChemStation for UV-visible Spectroscopy
 Agilent ChemStation for UV-visible Spectroscopy Understanding Your Biochemical Analysis Software Agilent Technologies Notices Agilent Technologies, Inc. 2000, 2003-2008 No part of this manual may be reproduced
Agilent Lab Advisor. IT Administrator's Guide. Agilent Technologies
 Agilent Lab Advisor IT Administrator's Guide Agilent Technologies Notices Agilent Technologies, Inc. 2016 No part of this manual may be reproduced in any form or by any means (including electronic storage
Agilent Dissolution Tester Driver
 Agilent Dissolution Tester Driver Agilent Technologies Notices Agilent Technologies, Inc. 2011-2012 No part of this manual may be reproduced in any form or by any means (including electronic storage and
BenchCel Workstations Software
 BenchCel Workstations Software User Guide For Research Use Only. Not for use in diagnostic procedures. Original Instructions Notices Agilent Technologies, Inc. 2017 No part of this manual may be reproduced
Agilent EZChrom Elite. PDA Analysis
 Agilent EZChrom Elite PDA Analysis Notices Copyright Scientific Software, Inc 1997-2003 Agilent Technologies, Inc. 2006. No part of this manual may be reproduced in any form or by any means (including
Secure Workstation for OpenLAB CDS ChemStation Edition User's Guide
 Secure Workstation for OpenLAB CDS ChemStation Edition User's Guide Secure Workstation for OpenLAB CDS ChemStation Edition User's Guide Agilent Technologies Notices Agilent Technologies, Inc. 2014-2017
Agilent OpenLAB CDS Waters Alliance HPLC Instrument Control Add-On. Installation, Upgrade and Migration Guide
 Agilent OpenLAB CDS Waters Alliance HPLC Instrument Control Add-On Installation, Upgrade and Migration Guide Notices Agilent Technologies, Inc. 2013, 2014 No part of this manual may be reproduced in any
Agilent OpenLAB CDS. ChemStation Edition Instrument Configuration. Guide. Agilent Technologies
 Agilent OpenLAB CDS ChemStation Edition Instrument Configuration Guide ChemStation Edition Instrument Configuration Agilent Technologies Notices Agilent Technologies, Inc. 2010-2017 No part of this manual
Agilent ChemStore C/S. Concepts Guide
 Agilent ChemStore C/S Concepts Guide A Notices Agilent Technologies, Inc. 2002, 2004 No part of this manual may be reproduced in any form or by any means (including electronic storage and retrieval or
Agilent E2943A/E2944A ATCA Probes for Advanced Switching Interconnect
 Agilent E2943A/E2944A ATCA Probes for Advanced Switching Interconnect Hardware Setup Guide Agilent Technologies Notices Agilent Technologies, Inc. 2005 No part of this manual may be reproduced in any form
Agilent N2916B 6000 and 5000 Series Oscilloscope Rack Mount Kit
 Agilent N2916B 6000 and 5000 Series Oscilloscope Rack Mount Kit Installation Guide Agilent Technologies Notices Agilent Technologies, Inc. 2005, 2007 No part of this manual may be reproduced in any form
Agilent ChemStore C/S. Concepts Guide
 Agilent ChemStore C/S Concepts Guide A Notices Agilent Technologies, Inc. 2002, 2004-2008 No part of this manual may be reproduced in any form or by any means (including electronic storage and retrieval
Microscan Barcode Reader
 Microscan Barcode Reader Device Driver Guide For Research Use Only. Not for use in diagnostic procedures. Original Instructions Notices Agilent Technologies, Inc. 2017 No part of this manual may be reproduced
Agilent E2094M IO Libraries
 Agilent E2094M IO Libraries Agilent IO Libraries Installation and Configuration Guide Agilent Technologies Notices Agilent Technologies, Inc. 2003 No part of this manual may be reproduced in any form or
Agilent OpenLAB Data Store Administration. Guide for Administrators
 Agilent OpenLAB Data Store Administration Guide for Administrators Notices Agilent Technologies, Inc. 2013 No part of this manual may be reproduced in any form or by any means (including electronic storage
Agilent ChemStation OpenLAB Option
 Agilent ChemStation OpenLAB Option Concepts Guide ChemStation OpenLAB Option Concepts Guide Agilent Technologies Notices Agilent Technologies, Inc. 2008-2009, 2010 No part of this manual may be reproduced
Agilent OpenLAB Data Store. Maintenance Guide
 Agilent OpenLAB Data Store Maintenance Guide Notices Agilent Technologies, Inc. 2013 No part of this manual may be reproduced in any form or by any means (including electronic storage and retrieval or
Automated Plate Labeling
 Automated Plate Labeling Protocol Guide For Research Use Only. Not for use in diagnostic procedures. Original Instructions Notices Agilent Technologies, Inc. 2017 No part of this manual may be reproduced
eschoolplus+ Cognos Query Studio Training Guide Version 2.4
 + Training Guide Version 2.4 May 2015 Arkansas Public School Computer Network This page was intentionally left blank Page 2 of 68 Table of Contents... 5 Accessing... 5 Working in Query Studio... 8 Query
Microsoft Excel 2010 Tutorial
 1 Microsoft Excel 2010 Tutorial Excel is a spreadsheet program in the Microsoft Office system. You can use Excel to create and format workbooks (a collection of spreadsheets) in order to analyze data and
Agilent 85130C NMD 3.5 mm to Type-N Adapter Kit
 Agilent 85130C NMD 3.5 mm to Type-N Adapter Kit Operating and Service Manual Agilent Technologies Notices Agilent Technologies, Inc. 1987, 2004, 2008 No part of this manual may be reproduced in any form
Agilent OBSAI Protocol Tester
 Agilent OBSAI Protocol Tester Hardware Reference Guide Agilent Technologies Notices Agilent Technologies, Inc. 2008 No part of this manual may be reproduced in any form or by any means (including electronic
Keysight 11878A 50 Ohm 3.5 mm Adapter Kit
 Keysight 11878A 50 Ohm 3.5 mm Adapter Kit Operating and Service Manual Notices Keysight Technologies 1989, 2004, 2013, 2014 No part of this manual may be reproduced in any form or by any means (including
Agilent OpenLab CDS ChemStation Edition
 Agilent OpenLab CDS ChemStation Edition Networked and Distributed System Installation and Configuration Networked and Distributed System Installation and Configuration Agilent Technologies Notices Agilent
EZChrom Elite Compact. What s New in EZChrom Elite Compact Service Pack 2
 EZChrom Elite Compact What s New in EZChrom Elite Compact 3.3.2 Service Pack 2 Notices Agilent Technologies, Inc. 2010 No part of this manual may be reproduced in any form or by any means (including electronic
Keysight 85130F NMD 2.4 mm to 3.5 mm Adapter Kit
 Keysight 85130F NMD 2.4 mm to 3.5 mm Adapter Kit Operating and Service Manual Notices Keysight Technologies 1988-2015 No part of this manual may be reproduced in any form or by any means (including electronic
Keysight 11636B APC-3.5 mm Power Divider DC to 26.5 GHz
 Keysight 11636B APC-3.5 mm Power Divider DC to 26.5 GHz Operating and Service Manual Notices Keysight Technologies 1985, 2013, 2014 No part of this manual may be reproduced in any form or by any means
Setting Up Probes. Online Help
 Setting Up Probes Online Help Notices Agilent Technologies, Inc. 2001-2009 No part of this manual may be reproduced in any form or by any means (including electronic storage and retrieval or translation
Query Studio Training Guide Cognos 8 February 2010 DRAFT. Arkansas Public School Computer Network 101 East Capitol, Suite 101 Little Rock, AR 72201
 Query Studio Training Guide Cognos 8 February 2010 DRAFT Arkansas Public School Computer Network 101 East Capitol, Suite 101 Little Rock, AR 72201 2 Table of Contents Accessing Cognos Query Studio... 5
Notices. DFARS/Restricted Rights Notice. Warranty. Technology Licenses. Document History
 Notices DFARS/Restricted Rights Notice If software is for use in the performance of a U.S. Government prime contract or subcontract, Software is delivered and licensed as Commercial computer software as
Agilent MassHunter Drug Analysis Mode Using Quantitative Analysis Workflow Guide
 Agilent MassHunter Drug Analysis Mode Using Quantitative Analysis Workflow Guide Notices Agilent Technologies, Inc. 2013 No part of this manual may be reproduced in any form or by any means (including
Microsoft How to Series
 Microsoft How to Series Getting Started with EXCEL 2007 A B C D E F Tabs Introduction to the Excel 2007 Interface The Excel 2007 Interface is comprised of several elements, with four main parts: Office
Firmware Guide. Keysight PXIe Chassis Family
 Firmware Guide Keysight PXIe Chassis Family Notices Keysight Technologies, Inc. 2018 No part of this manual may be reproduced in any form or by any means (including electronic storage and retrieval or
Sample Scheduler for OpenLAB CDS EZChrom Edition. Installation & Configuration Guide. Agilent Technologies
 Sample Scheduler for OpenLAB CDS EZChrom Edition Installation & Configuration Guide Agilent Technologies Notices Agilent Technologies, Inc. 2016 No part of this manual may be reproduced in any form or
Agilent Genomic Workbench 7.0
 Agilent Genomic Workbench 7.0 Data Viewing User Guide Agilent Technologies Notices Agilent Technologies, Inc. 2012, 2015 No part of this manual may be reproduced in any form or by any means (including
BIT-3000 Dynamic Sequencing Generator and Analyzer. Datasheet 1.11
 BIT-3000 Dynamic Sequencing Generator and Analyzer Datasheet 1.11 BitifEye Digital Test Solutions GmbH Herrenberger Strasse 130 71034 Boeblingen, Germany info@bitifeye.com www.bitifeye.com Notices BitifEye
Agilent InfiniiMax II 1168A/1169A Probes
 Agilent InfiniiMax II 1168A/1169A Probes Handling Guide Agilent Technologies Notices Agilent Technologies, Inc. 2008 No part of this manual may be reproduced in any form or by any means (including electronic
Agilent 89600B VSA. Software Installation Guide
 Agilent 89600B VSA Software Installation Guide Notices Agilent Technologies, Inc. 2000-2011 No part of this manual may be reproduced in any form or by any means (including electronic storage and retrieval
Agilent 7890 Series Gas Chromatograph
 Agilent 7890 Series Gas Chromatograph GC Software Features Overview Agilent Technologies Notices Agilent Technologies, Inc. 2013 No part of this manual may be reproduced in any form or by any means (including
Keysight 85130D NMD 3.5 mm to 3.5 mm Adapter Kit
 Keysight 85130D NMD 3.5 mm to 3.5 mm Adapter Kit Operating and Service Manual Notices Keysight Technologies 1987-2015 No part of this manual may be reproduced in any form or by any means (including electronic
Agilent Technologies. Connectivity Guide. USB/LAN/GPIB Interfaces. Agilent Technologies
 Agilent Technologies USB/LAN/GPIB Interfaces Connectivity Guide Agilent Technologies Notices Agilent Technologies, Inc. 2003-2006 No part of this manual may be reproduced in any form or by any means (including
Agilent Triple Quadrupole LC/MS Peptide Quantitation with Skyline
 Agilent Triple Quadrupole LC/MS Peptide Quantitation with Skyline Workflow Guide A Peptide Optimization B Review Results in Skyline Create QQQ method in Skyline Edit Skyline settings Import peptides into
EZ IQ. Chromatography Software PN P1A
 O P E R A T I N G M A N U A L EZ IQ Chromatography Software Trademarks The trademarks of the products mentioned in this manual are held by the companies that produce them. Windows is a registered trademark
Agilent Technologies E5346A 38-Pin Probe and E5351A 38-Pin Adapter Cable
 Agilent Technologies E5346A 38-Pin Probe and E5351A 38-Pin Adapter Cable Installation Note The 38-pin probe and adapter cable provide a convenient way to connect two Agilent Technologies logic analyzer
Agilent CytoGenomics 2.5
 Agilent CytoGenomics 2.5 Installation and Administration Guide Research Use Only. Not for Diagnostic Procedures. Agilent Technologies Notices Agilent Technologies, Inc. 2012 No part of this manual may
Keysight M9393A PXIe Vector Signal Analyzer
 Security Guide Keysight M9393A PXIe Vector Signal Analyzer. Notice: This document contains references to Agilent. Please note that Agilent s Test and Measurement business has become Keysight Technologies.
Thermo Xcalibur Getting Started (Quantitative Analysis)
") Thermo Xcalibur Getting Started (Quantitative Analysis) XCALI-97207 Revision B September 2010 2010 Thermo Fisher Scientific Inc. All rights reserved. Xcalibur, Surveyor, and Accela are registered trademarks
Thermo Xcalibur Getting Started (Quantitative Analysis) XCALI-97207 Revision B September 2010 2010 Thermo Fisher Scientific Inc. All rights reserved. Xcalibur, Surveyor, and Accela are registered trademarks
Agilent 34826A BenchLink Data Logger for 34980A. Getting Started Guide. Agilent Technologies
 Agilent 34826A BenchLink Data Logger for 34980A Getting Started Guide Agilent Technologies Notices Agilent Technologies, Inc. 2006 No part of this manual may be reproduced in any form or by any means (including
Keysight E7515A UXM Firmware Update Tool
 Keysight E7515A UXM Firmware Update Tool For the E7515A UXM Wireless Test Set Installation & User Guide Notices Keysight Technologies, Inc. 2014-2017 No part of this manual may be reproduced in any form
Agilent Technologies E5385A 100-Pin Probe
 Agilent Technologies E5385A 100-Pin Probe Installation Note The Agilent Technologies E5385A 100-pin probe provides a convenient way to connect two Agilent Technologies logic analyzer probe cables to a
Microsoft Excel 2010
 Microsoft Excel 2010 omar 2013-2014 First Semester 1. Exploring and Setting Up Your Excel Environment Microsoft Excel 2010 2013-2014 The Ribbon contains multiple tabs, each with several groups of commands.
Agilent EZChrom Elite. User s Guide
 Agilent EZChrom Elite User s Guide Notices Copyright Scientific Software, Inc 1997-2005 Agilent Technologies, Inc. 2006. No part of this manual may be reproduced in any form or by any means (including
Agilent Genomic Workbench 6.0
 Agilent Genomic Workbench 6.0 Standard Edition Installation Guide Notices Agilent Technologies, Inc. 2010 No part of this manual may be reproduced in any form or by any means (including electronic storage
Quick Start Guide. ARIS Architect. Version 9.8 Service Release 2
 ARIS Architect Version 9.8 Service Release 2 October 2015 This document applies to ARIS Version 9.8 and to all subsequent releases. Specifications contained herein are subject to change and these changes
Keysight N108xA-Series IEEE Ethernet KR/CR Compliance and Debug Application
 Keysight N108xA-Series IEEE 802.3 Ethernet KR/CR Compliance and Debug Application Getting Started Notices Keysight Technologies, Inc. 2014 No part of this manual may be reproduced in any form or by any
Introducing Gupta Report Builder
 Business Reporting Chapter 1 Introducing Gupta Report Builder You can use Report Builder to design reports. This chapter describes: Our approach to building reports. Some of the reports you can build.
Agilent 1290 Infinity with ISET
 Agilent 1290 Infinity with ISET User Manual Agilent Technologies Notices Agilent Technologies, Inc. 2011 No part of this manual may be reproduced in any form or by any means (including electronic storage
Agilent N5410A Fibre Channel Automated Test Application
 Agilent N5410A Fibre Channel Automated Test Application Compliance Testing Methods of Implementation Agilent Technologies Notices Agilent Technologies, Inc. 2005 No part of this manual may be reproduced
Agilent SureCall 3.5. Installation Guide. Agilent Technologies. For Research Use Only. Not for use in diagnostic procedures.
 Agilent SureCall 3.5 Installation Guide For Research Use Only. Not for use in diagnostic procedures. Agilent Technologies Notices Agilent Technologies, Inc. 2016 No part of this manual may be reproduced
Excel 2007 New Features Table of Contents
 Table of Contents Excel 2007 New Interface... 1 Quick Access Toolbar... 1 Minimizing the Ribbon... 1 The Office Button... 2 Format as Table Filters and Sorting... 2 Table Tools... 4 Filtering Data... 4
The HOME Tab: Cut Copy Vertical Alignments
 The HOME Tab: Cut Copy Vertical Alignments Text Direction Wrap Text Paste Format Painter Borders Cell Color Text Color Horizontal Alignments Merge and Center Highlighting a cell, a column, a row, or the
Budget Exercise for Intermediate Excel
 Budget Exercise for Intermediate Excel Follow the directions below to create a 12 month budget exercise. Read through each individual direction before performing it, like you are following recipe instructions.
G5584A Labware MiniHub
 G5584A Labware MiniHub User Guide For Research Use Only. Not for use in diagnostic procedures. Original Instructions Notices Agilent Technologies, Inc. 2017 No part of this manual may be reproduced in
Keysight TAP Training Lab 2 TAP Results Viewer
 Keysight TAP Training Lab 2 TAP Results Viewer Notices DFARS/Restricted Rights Notice If software is for use in the performance of a U.S. Government prime contract or subcontract, Software is delivered
Microsoft Excel 2010 Part 2: Intermediate Excel
 CALIFORNIA STATE UNIVERSITY, LOS ANGELES INFORMATION TECHNOLOGY SERVICES Microsoft Excel 2010 Part 2: Intermediate Excel Spring 2014, Version 1.0 Table of Contents Introduction...3 Working with Rows and
Agilent Lab Advisor. User Manual. Agilent Technologies
 Agilent Lab Advisor User Manual Agilent Technologies Notices Agilent Technologies, Inc. 2012 No part of this manual may be reproduced in any form or by any means (including electronic storage and retrieval
Application of Skills: Microsoft Excel 2013 Tutorial
 Application of Skills: Microsoft Excel 2013 Tutorial Throughout this module, you will progress through a series of steps to create a spreadsheet for sales of a club or organization. You will continue to
User Guide. Web Intelligence Rich Client. Business Objects 4.1
 User Guide Web Intelligence Rich Client Business Objects 4.1 2 P a g e Web Intelligence 4.1 User Guide Web Intelligence 4.1 User Guide Contents Getting Started in Web Intelligence 4.1... 5 Log into EDDIE...
Ms excel. The Microsoft Office Button. The Quick Access Toolbar
 Ms excel MS Excel is electronic spreadsheet software. In This software we can do any type of Calculation & inserting any table, data and making chart and graphs etc. the File of excel is called workbook.
Nimsoft Monitor. proxy Guide. v3.1 series
 Nimsoft Monitor proxy Guide v3.1 series Legal Notices Copyright 2012, CA. All rights reserved. Warranty The material contained in this document is provided "as is," and is subject to being changed, without
Nimsoft Unified Management Portal
 Nimsoft Unified Management Portal NimsoftMobile Guide 2.0 Document Revision History Document Version Date Changes x.x xx/xx/2012 Initial version for xxxxxxxxxxxx Legal Notices Copyright 2012, Nimsoft Corporation
Quick Reference Summary
 Microsoft Excel 2010 Quick Reference Summary Microsoft Excel 2010 Quick Reference Summary 3-D Chart, Rotate EX 462 3-D Rotation button (Chart Tools Layout tab Background, change rotation (Format Chart
ARIS Architect QUICK START GUIDE. Version Service Release 7
 ARIS Architect QUICK START GUIDE Version 9.8 - Service Release 7 December 2016 This document applies to ARIS Version 9.8 and to all subsequent releases. Specifications contained herein are subject to change
86100 Series Infiniium DCA Oscilloscope
 86100 Series Infiniium DCA Oscilloscope This manual provides the documentation for the following instruments 86100D 86100C User s Manual Notices Keysight Technologies, Inc. 20xx-2014 No part of this manual
Microsoft Excel for Lawyers - The Fundamentals Reference Guide
 Microsoft Excel for Lawyers - The Fundamentals Reference Guide This guide includes step by step procedures for fundamental Excel commands and accompanies the Microsoft Excel for Lawyers -The Fundamentals
Agilent MSD Productivity ChemStation G1701 & G1710. Performance Report Parameters
 Agilent MSD Productivity ChemStation G1701 & G1710 Performance Report Parameters Notices Agilent Technologies, Inc. 2012 No part of this manual may be reproduced in any form or by any means (including
Agilent MassHunter Workstation Software Report Designer Add-in
 Agilent MassHunter Workstation Software Report Designer Add-in Quick Start Guide What is the Agilent MassHunter Workstation Software Report Designer Add-in? 2 Report Designer UI elements 3 Getting Started
THE EXCEL ENVIRONMENT... 1 EDITING...
 Excel Essentials TABLE OF CONTENTS THE EXCEL ENVIRONMENT... 1 EDITING... 1 INSERTING A COLUMN... 1 DELETING A COLUMN... 1 INSERTING A ROW... DELETING A ROW... MOUSE POINTER SHAPES... USING AUTO-FILL...