DynamoRIO Examples Part I Outline
|
|
|
- Lora Harrington
- 6 years ago
- Views:
Transcription
1 Examples: Part I 1:30-1:40 Welcome + DynamoRIO History 1:40-2:40 DynamoRIO Internals 2:40-3:00 Examples, Part 1 3:00-3:15 Break 3:15-4:15 DynamoRIO API 4:15-5:15 Examples, Part 2 5:15-5:30 Feedback
2 DynamoRIO Examples Part I Outline Common Steps of writing a DynamoRIO client Dynamic Instruction Counting Example 2
3 Common Steps Step 1: Register Events DR_EXPORT void dr_init(client_id_t id) Register Function dr_register_bb_event dr_register_thread_init_event dr_register_exit_event Events Basic Block Building Thread Initialization Process Exit Step2: Implementation Initialization Finalization Instrumentation Step 3: Optimization Optimize the instrumentation to improve the performance 3
4 DynamoRIO Examples Part I Outline Common Steps of writing a DynamoRIO client Dynamic Instruction Counting Example 4
5 Step 1: Register Events uint num_dyn_instrs; static void event_init(void); static void event_exit(void); static dr_emit_flags_t event_basic_block(void *drcontext, void *tag, instrlist_t *ilist, bool for_trace, bool translating); DR_EXPORT void dr_init(client_id_t id) { /* register events */ dr_register_bb_event (event_basic_block); dr_register_exit_event(event_exit); /* process initialization event */ event_init(); } 5
6 Step 2: Implementation (I) static void event_init(void) { } num_dyn_instrs = 0; static void event_exit(void) { dr_printf( Total number of instruction executed: %u\n, num_dyn_instrs); } static dr_emit_flags_t event_basic_block(void *drcontext, void *tag, instrlist_t *ilist, bool for_trace, bool translating) { int num_instrs; num_instrs = ilist_num_instrs(ilist); insert_count_code(drcontext, ilist, num_instrs); return DR_EMIT_DEFAULT; } 6
7 Step 2: Implementation (II) static int ilist_num_instrs(instrlist_t *ilist) { instr_t *instr; int num_instrs = 0; /* iterate over instruction list to count number of instructions */ for (instr = instrlist_first(ilist); instr!= NULL; instr = instr_get_next(instr)) num_instrs++; return num_instrs; } static void do_ins_count(int num_instrs) { num_dyn_instrs += num_instrs; } static void insert_count_code(void * drcontext, instrlist_t * ilist, int num_instrs) { dr_insert_clean_call(drcontext, ilist, instrlist_first(ilist), do_ins_count, false, 1, OPND_CREATE_INT32(num_instrs)); } 7
8 Instrumented Basic Block # switch stack # switch aflags and errorno # save all registers # call do_ins_count push $0x call $0xb7ef73e4 (do_ins_count) # restore registers # switch aflags and errorno back # switch stack back # application code add $0x0000e574 %ebx %ebx test %al $0x08 jz $0xb80e8a98 8
9 Step 3: Optimization (I): counter update inlining static void insert_count_code (void * drcontext, instrlist_t * ilist, int num_instrs) { instr_t *instr, *where; opnd_t opnd1, opnd2; } where = instrlist_first(ilist); /* save aflags */ dr_save_arith_flags(drcontext, ilist, where, SPILL_SLOT_1); /* num_dyn_instrs += num_instrs */ opnd1 = OPND_CREATE_ABSMEM(&num_dyn_instrs, OPSZ_PTR); opnd2 = OPND_CREATE_INT32(num_instrs); instr = INSTR_CREATE_add(drcontext, opnd1, opnd2); instrlist_meta_preinsert(ilist, where, instr); /* restore aflags */ dr_restore_arith_flags(drcontext, ilist, where, SPILL_SLOT_1); 9
10 Instrumented Basic Block mov %eax %fs:0x0c lahf %ah seto %al add $0x , 0xb7d25030 add $0x7f %al %al sahf %ah mov %fs:0x0c %eax # application code add $0x0000e574 %ebx %ebx test %al $0x08 jz $0xb7f14a98 10
11 Step 3: Optimization (II): aflags stealing static void insert_count_code (void * drcontext, instrlist_t * ilist, int num_instrs) { save_aflags = aflags_analysis(ilist); /* save aflags */ if (save_aflags) dr_save_arith_flags(drcontext, ilist, where, SPILL_SLOT_1); /* num_dyn_instrs += num_instrs */ opnd1 = OPND_CREATE_ABSMEM(&num_dyn_instrs, OPSZ_PTR); opnd2 = OPND_CREATE_INT32(num_instrs); instr = INSTR_CREATE_add(drcontext, opnd1, opnd2); instrlist_meta_preinsert(ilist, where, instr); /* restore aflags */ if (save_aflags) dr_restore_arith_flags(drcontext, ilist, where, SPILL_SLOT_1); } 11
12 Instrumented Basic Block add $0x , 0xb7d25030 # application code add $0x0000e574 %ebx %ebx test %al $0x08 jz $0xb7f14a98 12
13 Step 3: Optimization (III): more optimizations Using lea (load effective address) instead of add lea [%reg, num_instr] %reg Register liveness analysis Using dead register to avoid register save/restore for lea Global aflags/registers analysis Analyze aflags/registers liveness over CFG Trace Optimization Trace: single-entry multi-exit Update counters only at trace exits 13
14 Other Issues Data race on counter update in multithreaded programs Global lock for every update Atomic update (lock prefixed add) LOCK(instr); Thread private counter Thread-private code cache: different variable at different address Thread-shared code cache: thread local storage 32-bit counter overflow 64-bit counter: Two instructions on 32-bit architecture: add, adc One 32-bit local counter and one 64-bit global counter Instrument to update 32-bit local counter Update 64-bit global counter using time interrupt 14
15 Examples: Part 2 1:30-1:40 Welcome + DynamoRIO History 1:40-2:40 DynamoRIO Internals 2:40-3:00 Examples, Part 1 3:00-3:15 Break 3:15-4:15 DynamoRIO API 4:15-5:15 Examples, Part 2 5:15-5:30 Feedback
16 Larger Examples Dynamic Optimization Strength Reduction Software Prefetch Profiling Pipelined Profiling and Analysis Shadow Memory Umbra Millions of Watchpoints Dr. Memory 2
17 Dynamic Optimization Opportunities Traditional compiler optimizations Compiler has limited view: application assembled at runtime Some shipped products are built without optimizations Microarchitecture-specific optimizations Feature set and relative performance of instructions varies Combinatorial blowup if done statically Adaptive optimizations Need runtime information: prior profiling runs not always representative 3
18 Dynamic Optimization in DynamoRIO Traces are natural unit for optimization Focus only on hot code Cross procedure, file and module boundaries Linear control flow Single-entry, multi-exit simplifies analysis Support for adaptive optimization Can replace traces dynamically 4
19 Strength Reduction: inc to add On Pentium 4, inc is slower add 1 (and dec is slower than sub 1) Opposite is true on Pentium 3 Microarchitecture-specific optimization best performed dynamically 5
20 EXPORT void dr_init() { if (proc_get_family() == FAMILY_PENTIUM_IV) dr_register_trace_event(event_trace); } Pentium 4? static void event_trace(void *drcontext, app_pc tag, instrlist_t *trace, bool xl8) { instr_t *instr, *next_instr; int opcode; for (instr = instrlist_first(bb); instr!= NULL; instr = next_instr) { next_instr = instr_get_next(instr); opcode = instr_get_opcode(instr); if (opcode == OP_inc opcode == OP_dec) replace_inc_with_add(drcontext, instr, trace); } } } Look for inc / dec static bool replace_inc_with_add(void *drcontext, instr_t *instr, instrlist_t *trace) { instr_t *in; uint eflags; int opcode = instr_get_opcode(instr); bool ok_to_replace = false; for (in = instr; in!= NULL; in = instr_get_next(in)) { eflags = instr_get_arith_flags(in); if ((eflags & EFLAGS_READ_CF)!= 0) return false; if ((eflags & EFLAGS_WRITE_CF)!= 0) { ok_to_replace = true; break; } if (instr_is_exit_cti(in)) return false; } } if (!ok_to_replace) return false; if (opcode == OP_inc) in = INSTR_CREATE_add(drcontext, instr_get_dst(instr, 0), OPND_CREATE_INT8(1)); else in = INSTR_CREATE_sub(drcontext, instr_get_dst(instr, 0), OPND_CREATE_INT8(1)); instr_set_prefixes(in, instr_get_prefixes(instr)); instrlist_replace(trace, instr, in); instr_destroy(drcontext, instr); return true; Ensure eflags change ok Replace with add / sub 6
21 Strength Reduction Results ammp applu apsi art equake mesa mgrid sixtrack swim wupwise har. mean base inc2add Benchmark 2% mean speedup Normalized Execution Time
22 Software Prefetching Ubiquitous Memory Introspection (UMI): Online, light weight, adaptive memory optimization Key Ideas Sampling to identify hot traces Time interrupt Performance counter (L2 Cache miss) overflow interrupt Profiling a trace if it is hot enough Instrument trace for memory profiling Analyzing profiling if it is full Ref 1 Ref 2 Ref 3 Ref 4 Ref 5 Iter 1 Iter 2 Iter 3 Cache Simulation to identify loads with high miss ratios Stride reference analysis Optimization Instrument trace with L2 prefetch requests for high miss loads 8

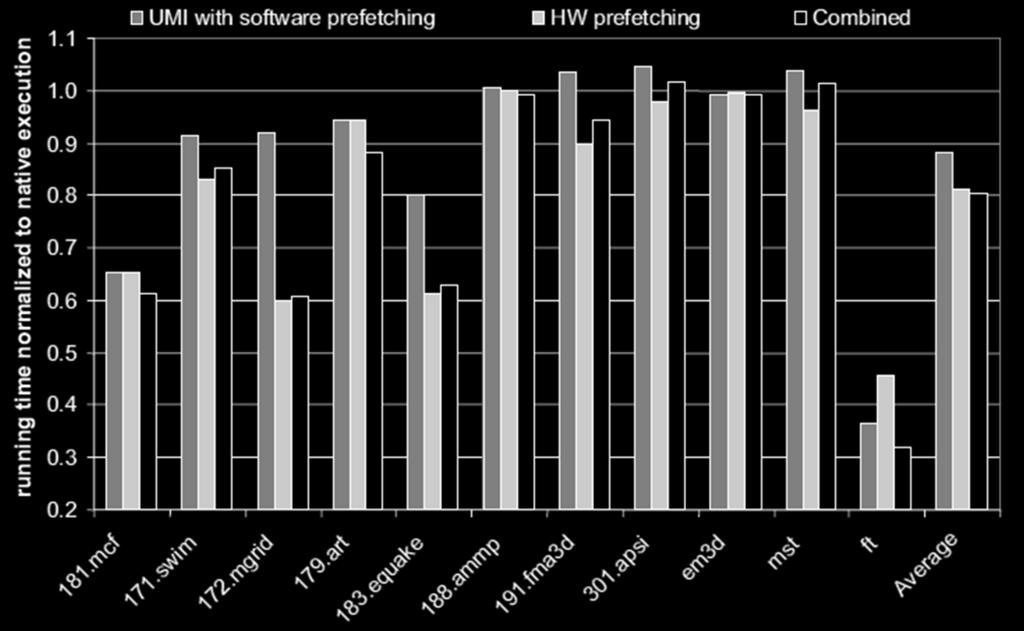
23 Software Prefetching Results 9
24 Larger Examples Dynamic Optimization Strength Reduction Software Prefetch Profiling Pipelined Profiling and Analysis Shadow Memory Umbra Millions of Watchpoints Dr. Memory 10
25 PiPA: Pipelined Profiling and Analysis Original application Instrumentation overhead Profiling and Analyzing overhead Time Threads or Processes Instrumented application stage 0 Profile processing stage 1 Analysis on profile 1 Analysis on profile 2 Analysis on profile 3 Parallel analysis stage 2 Analysis on profile 4 11
26 PiPA Challenges Minimize the profiling overhead Runtime Execution Profile (REP) Minimize the communication between stages double buffering Design efficient parallel analysis algorithms we focus on cache simulation PiPA Prototype Stage 0 : instrumented application collect REP Stage 1 : profile reconstruct and splitting Stage 2 : parallel cache simulation 12
27 Stage 0 : Profiling static dr_emit_flags_t event_basic_block(void *drcontext, void *tag, instrlist_t *ilist, bool for_trace, bool xl8) { instr_t *instr; for (instr = instrlist_first(ilist); instr!= NULL; instr_get_next(instr)) { /* check and instrument if any memory read */ if (instr_reads_memory(instr)) for (int i= 0; i< instr_num_srcs(instr); i++) if (opnd_is_memory_reference(instr_get_src(instr, i))) instrument_mem_read(drcontext, ilist, instr, instr_get_src(instr, i)); /* check and instrument if any memory write */ if (instr_writes_memory(instr)) for (int i= 0; i< instr_num_dsts(instr); i++) if (opnd_is_memory_reference(instr_get_dst(instr, i))) instrument_mem_write(drcontext, ilist, instr, instr_get_dst(instr, i)); } return DR_EMIT_DEFAULT; } 13
28 Stage 0: Profiling <pc, address, type, size> static void instrument_mem_read(void *drcontext, instrlist_t *ilist, instr_t *where, opnd_t ref) { app_pc pc = instr_get_app_pc(where); int size = opnd_size_in_bytes(opnd_get_size(ref)); /* calculate memory reference address */ if (opnd_is_base_disp(ref)) { opnd_set_size(ref, OPSZ_lea); instr = INSTR_CREATE_lea(drcontext, opnd_create_reg(reg1), ref); } else if (opnd_is_rel_addr(ref) opnd_is_abs_addr(ref)) instr = INSTR_CREATE_mov_imm(drcontext, opnd_create_reg(reg1), OPND_CREATE_INTPTR(opnd_get_addr(ref)); instrlist_meta_preinsert(ilist, where, instr); /* put address into profile buffer */ instrlist_meta_preinsert(ilist, where, INSTR_CREATE_mov_st(drcontext, OPND_CREATE_MEMPTR(reg2, 4), opnd_create_reg(reg1))); } 14
29 Stage 0: Profiling Runtime Execution Profile (REP) fast profiling small profile size easy information extraction REP unit REP static Information that known at static time REP dynamic Information that only known at runtime Can be customized for different analyses in our prototype we consider cache simulation 15
30 REP Example profile base pointer REP Unit REP First buffer bb1 eax esp... tag: 0x080483d7 num_slots: 2 num_refs: 3 refs: ref0 bb1: mov [eax + 0x0c] eax mov ebp esp pop ebp return pc: 0x080483d7 type: read size: 4 offset: 12 value_slot: 1 size_slot: -1 pc: 0x080483dc type: read size: 4 offset: 0 value_slot: 2 size_slot: Canary Zone Next buffer pc: 0x080483dd type: read size: 4 offset: 4 value_slot: 2 size_slot: REP S REP D 16
31 REP Example profile base pointer 12 bytes REP First buffer... bb1 eax esp bb2 esp... Canary Zone Next buffer tag: 0x080483d7 num_slots: 2 num_refs: 3 refs: ref0 bb1: mov [eax + 0x0c] eax mov ebp esp pop ebp return bb2: pop ebx pop ecx cmp eax, 0 jz label_bb3 pc: 0x080483d7 type: read size: 4 offset: 12 value_slot: 1 size_slot: -1 pc: 0x080483dc type: read size: 4 offset: 0 value_slot: 2 size_slot: -1 pc: 0x080483dd type: read size: 4 offset: 4 value_slot: 2 size_slot: REP S REP D 17
32 Profiling Optimization Store register values in REP avoid computing the memory address Register liveness analysis avoid register stealing if possible Record a single register value for multiple references a single stack pointer value for a sequence of push/pop the base address for multiple accesses to the same structure Profiling buffer count update Update counter once per basic block Using lea instruction to avoid aflags usage Buffer full check Canary Zone lea & jecxz to avoid aflags uasge 18
33 Profiling Overhead Slowdown relative to native execution SPECint2000 SPECfp2000 SPEC2000 optimized instrumentation instrumentation without optimization Avg slowdown : ~ 3x 19
34 Stage 1 : Profile Reconstruct Need to reconstruct the full memory reference information <pc, address, type, size> REP bb1... tag: 0x080483d7 num_slots: 2 num_refs: 3 refs: ref0 pc: 0x080483d7 type: read size: 4 offset: 12 value_slot: 1 size_slot: -1 pc: 0x080483dc type: read size: 4 offset: 0 value_slot: 2 size_slot: REP Unit 0x2304 REP Unit 0x141a bb2 0x Canary Zone PC Address Type Size x080483d7 0x2310 read 4 0x080483dc 0x141a read
35 Profile Reconstruct Overhead The impact of using REP experiments done on the 8-core system with 16MB buffers and 8 threads Slowdown relative to native execution PIPA using REP PIPA-REP : 4.5x PIPA using standard profile format PIPA-standard : 20.7x <pc, address, type, size> 21
36 Stage 2 : Parallel Cache Simulation How to parallelize? split the address trace into independent groups (in stage 1) two memory references that access different sets are independent Set associative caches partition the cache sets and simulate them using several independent simulators merge the results (no of hits and misses) at the end of the simulation Example: 32K cache, 32-byte line, 4-way associative => 256 sets 4 independent simulators, each one simulates 64 sets (round-robin distribution) PC Address Type Size 0: 0xbf9c4614, 0xbf9c4705, 0xbf9c460d xbf9c4614 r xbf9c4705 w xbf9c4a34 r xbf9c4a60 w xbf9c4a5c r xbf9c460d r 4 1: 2: 3: 0xbf9c4a34 0xbf9c4a5c 0xbf9c4a
37 Cache Simulation Overhead Experiments done on the 8-core system 8 recovery threads and 8 cache simulators Slowdown relative to native execution PiPA Pin dcache 10.5x 32x PiPA speedup over dcache : 3x 23
38 Larger Examples Dynamic Optimization Strength Reduction Software Prefetch Profiling Pipelined Profiling and Analysis Shadow Memory Umbra Millions of Watchpoints Dr. Memory 24
39 Shadow Memory Application Store meta-data associated with application data Millions of software watchpoints Dynamic information flow tracking (taint propagation) Race detection Memory usage debugging tool (MemCheck/Dr. Memory) Issues Performance Multi-thread applications Flexibility Platform dependent 25
40 Umbra Outline Design Implementation Optimization
41 Design Address Space A collection of fixed size units 256M (32-bit), 4G (64-bit) Application, Shadow, Unused Translation Table Translation from application memory unit to corresponding shadow memory unit addr = addr scale offset App Mem Shd Mem Offset [0x , 0x ) [0x , 0x ) [0x , 0x ) shd app + [0x , 0x ) [0x , 0x ) [0x , 0x ) 0x x x App Mem 1 Unused Shd Mem 1 Unused Shd Mem 2 Shd Mem 3 App Mem 2 App Mem 3 27
42 Implementation Memory Manager Monitor and control application memory allocation brk, mmap, munmap, mremap dr_register_pre_syscall_event dr_register_post_syscall_event Allocate shadow memory Maintain translation table Instrumenter Instrument every memory reference Context save Address calculation Address translation Shadow memory update Context restore 28
43 Instrument Code Example Context Save Address Calculation Address Translation Shadow Memory Update Context Restore mov %ecx [ECX_SLOT] mov %edx [EDX_SLOT] mov %eax [EAX_SLOT] lahf %ah seto %al lea [%ebx, 16] %ecx mov 0 %edx # table lookup code add %ecx, table[%edx].offset %ecx mov 1 [%ecx] add %al 0x7f sahf mov [ECX_SLOT] %ecx mov [EDX_SLOT] %edx mov [EAX_SLOT] %eax Application memory reference mov 0 [%ebx, 16]
44 Optimization Translation Optimization Thread Local Translation Table Memoization Check Reference Check Instrumentation Optimization Context Switch Reduction Reference Grouping 3-stage Code Layout 30
45 Translation Optimization Thread Local Translation Optimization Local translation table per thread Synchronize with global translation table when necessary Avoid lock contention Thread 1 Thread 2 Thread Local translation table Global translation table 31
46 Translation Optimization Memoization Cache Software cache per thread Stores frequently used translation entries Stack Units found in last table lookup Thread 1 Thread 2 Memoization Cache Thread Local translation table Global translation table 32
47 Translation Optimization Reference Cache Software cache per static application memory reference Last reference unit tag Last translation offset Thread 1 Thread 2 Reference cache Memoization Cache Thread Local translation table Global translation table 33
48 Instrumentation Optimization Context Switch Reduction Registers liveness analysis Reference Grouping One translation for multiple references using the same base Stack local variables Different members of the same object 3-stage Code Layout Inline stub Quick inline check code with minimal context switch Lean procedure Simple assembly procedure with partial context switch Callout C function with complete context switch 34
49 3-stage Code Layout Inline stub Reference cache check Jump to lean procedure if miss Lean procedure Memoization cache check Local table lookup Clean call to call out Callout Global table synchronization Local table lookup 35
50 Instrumentation Optimization Inline Stub # reference cache check lea [ref] %r1 %r1 & 0xf %r1 cmp %r1, ref.tag je.update_shadow_memory # jmp-and-link to lean procedure mov %r1 ref.tag mov.update_ref_cache [ret_pc] jmp lean_procedure.update_ref_cache mov %r1 ref.offset # shadow memory update.update_shadow_memory lea [ref] %r1 add %r1 + ref.offset %r1 mov 1 [%r1] Lean Procedure # memorization check cmp %r1, cache1.tag jne.cache1_miss mov cache1.offset %r1 jmp [ret_pc].cache1_miss cmp %r1, cache2.tag jne.cache2_miss mov cache1.offset %r1 jmp [ret_pc].cache2_miss # table lookup mov %r1 cache2.tag mov %r2 [R2_SLOT] mov 0 %r2 mov [R2_SLOT] %r2 mov %r1 cache2.offset jmp [ret_pc] 36
51 Performance Evaluation 18 DynamoRIO Local Translation Table Memorization Check Reference Cache Context Switch Reduction Reference Grouping CINT CFP CPU
52 Umbra Client: Shared Memory Detection static void instrument_update(void *drcontext, umbra_info_t *umbra_info, mem_ref_t *ref, instrlist_t *ilist, instr_t *where) { /* test [%reg].tid_map, tid_map*/ opnd1 = OPND_CREATE_MEM32(umbra_info reg, 0, OPSZ_4); opnd2 = OPND_CREATE_INT32(client_tls_data tid_map); instrlist_meta_preinsert(ilist, where, INSTR_CREATE_test(drcontext, opnd1, opnd2)); /* jnz where */ opnd1 = opnd_create_instr(where); instrlist_meta_preinsert(ilist, where, INSTR_CREATE_jcc(drcontext, OP_jnz, opnd1)); /* or */ opnd1 = OPND_CREATE_MEM32(umbra_info reg, 0, OPSZ_4); opnd2 = OPND_CREATE_INT32(client_tls_data tid_map 1); instr = INSTR_CREATE_or(drcontext, opnd1, opnd2); LOCK(instr); instrlist_meta_preinsert(ilist, label, instr); } 38
53 Watchpoints Watchpoints are poweful debugging tools Millions of Watchpoints Watch all heap allocations to detect uninitialized values Watch all buffers to detect overflow Watch all return addresses However, more than a handful of watched addresses cannot be handled efficiently by today s debuggers GDB is forced into a single-step mode Prohibitively expensive 39
54 Millions of Watchpoints Full instrumentation with shadow memory Simply mark the shadow memory Instrument to check on every memory access Partial instrumentation: On setting a watchpoint Duplicate data into shadow pages Set application page non-accessible On access violation handler Instrument the fault instruction Check reference target Report if access the watched data Redirect if access the protected pages 40
55 Larger Examples Dynamic Optimization Strength Reduction Software Prefetch Profiling Pipelined Profiling and Analysis Shadow Memory Umbra Millions of Watchpoints Dr. Memory 41
Practical Malware Analysis
 Practical Malware Analysis Ch 4: A Crash Course in x86 Disassembly Revised 1-16-7 Basic Techniques Basic static analysis Looks at malware from the outside Basic dynamic analysis Only shows you how the
CS412/CS413. Introduction to Compilers Tim Teitelbaum. Lecture 21: Generating Pentium Code 10 March 08
 CS412/CS413 Introduction to Compilers Tim Teitelbaum Lecture 21: Generating Pentium Code 10 March 08 CS 412/413 Spring 2008 Introduction to Compilers 1 Simple Code Generation Three-address code makes it
EECE.3170: Microprocessor Systems Design I Summer 2017 Homework 4 Solution
 1. (40 points) Write the following subroutine in x86 assembly: Recall that: int f(int v1, int v2, int v3) { int x = v1 + v2; urn (x + v3) * (x v3); Subroutine arguments are passed on the stack, and can
Computer Systems Lecture 9
 Computer Systems Lecture 9 CPU Registers in x86 CPU status flags EFLAG: The Flag register holds the CPU status flags The status flags are separate bits in EFLAG where information on important conditions
SYSTEM CALL IMPLEMENTATION. CS124 Operating Systems Fall , Lecture 14
 SYSTEM CALL IMPLEMENTATION CS124 Operating Systems Fall 2017-2018, Lecture 14 2 User Processes and System Calls Previously stated that user applications interact with the kernel via system calls Typically
Program Exploitation Intro
 Program Exploitation Intro x86 Assembly 04//2018 Security 1 Univeristà Ca Foscari, Venezia What is Program Exploitation "Making a program do something unexpected and not planned" The right bugs can be
CNIT 127: Exploit Development. Ch 1: Before you begin. Updated
 CNIT 127: Exploit Development Ch 1: Before you begin Updated 1-14-16 Basic Concepts Vulnerability A flaw in a system that allows an attacker to do something the designer did not intend, such as Denial
The IA-32 Stack and Function Calls. CS4379/5375 Software Reverse Engineering Dr. Jaime C. Acosta
 1 The IA-32 Stack and Function Calls CS4379/5375 Software Reverse Engineering Dr. Jaime C. Acosta 2 Important Registers used with the Stack EIP: ESP: EBP: 3 Important Registers used with the Stack EIP:
x86 assembly CS449 Fall 2017
 x86 assembly CS449 Fall 2017 x86 is a CISC CISC (Complex Instruction Set Computer) e.g. x86 Hundreds of (complex) instructions Only a handful of registers RISC (Reduced Instruction Set Computer) e.g. MIPS
Lab 3. The Art of Assembly Language (II)
") Lab. The Art of Assembly Language (II) Dan Bruce, David Clark and Héctor D. Menéndez Department of Computer Science University College London October 2, 2017 License Creative Commons Share Alike Modified
Lab. The Art of Assembly Language (II) Dan Bruce, David Clark and Héctor D. Menéndez Department of Computer Science University College London October 2, 2017 License Creative Commons Share Alike Modified
Assembly Language. Lecture 2 - x86 Processor Architecture. Ahmed Sallam
 Assembly Language Lecture 2 - x86 Processor Architecture Ahmed Sallam Introduction to the course Outcomes of Lecture 1 Always check the course website Don t forget the deadline rule!! Motivations for studying
x86 architecture et similia
 x86 architecture et similia 1 FREELY INSPIRED FROM CLASS 6.828, MIT A full PC has: PC architecture 2 an x86 CPU with registers, execution unit, and memory management CPU chip pins include address and data
How to Do a Million Watchpoints: Efficient Debugging Using Dynamic Instrumentation
 How to Do a Million Watchpoints: Efficient Debugging Using Dynamic Instrumentation Qin Zhao 1, Rodric Rabbah 2, Saman Amarasinghe 3, Larry Rudolph 4, and Weng-Fai Wong 1 1 National University of Singapore
Generating Low-Overhead Dynamic Binary Translators. Mathias Payer and Thomas R. Gross Department of Computer Science ETH Zürich
 Generating Low-Overhead Dynamic Binary Translators Mathias Payer and Thomas R. Gross Department of Computer Science ETH Zürich Motivation Binary Translation (BT) well known technique for late transformations
Kasper Lund, Software engineer at Google. Crankshaft. Turbocharging the next generation of web applications
 Kasper Lund, Software engineer at Google Crankshaft Turbocharging the next generation of web applications Overview Why did we introduce Crankshaft? Deciding when and what to optimize Type feedback and
Assembly Language. Lecture 2 x86 Processor Architecture
 Assembly Language Lecture 2 x86 Processor Architecture Ahmed Sallam Slides based on original lecture slides by Dr. Mahmoud Elgayyar Introduction to the course Outcomes of Lecture 1 Always check the course
Microkernel Construction
 Microkernel Construction Kernel Entry / Exit Nils Asmussen 05/04/2017 1 / 45 Outline x86 Details Protection Facilities Interrupts and Exceptions Instructions for Entry/Exit Entering NOVA Leaving NOVA 2
PRESENTED BY: SANTOSH SANGUMANI & SHARAN NARANG
 PRESENTED BY: SANTOSH SANGUMANI & SHARAN NARANG Table of contents Introduction Binary Disassembly Return Address Defense Prototype Implementation Experimental Results Conclusion Buffer Over2low Attacks
16.317: Microprocessor Systems Design I Fall 2015
 16.317: Microprocessor Systems Design I Fall 2015 Exam 2 Solution 1. (16 points, 4 points per part) Multiple choice For each of the multiple choice questions below, clearly indicate your response by circling
A Platform for Secure Static Binary Instrumentation
 A Platform for Secure Static Binary Instrumentation Mingwei Zhang, Rui Qiao, Niranjan Hasabnis and R. Sekar Stony Brook University VEE 2014 Work supported in part by grants from AFOSR, NSF and ONR Motivation
A Cross-Architectural Interface for Code Cache Manipulation. Kim Hazelwood and Robert Cohn
 A Cross-Architectural Interface for Code Cache Manipulation Kim Hazelwood and Robert Cohn Software-Managed Code Caches Software-managed code caches store transformed code at run time to amortize overhead
W4118: PC Hardware and x86. Junfeng Yang
 W4118: PC Hardware and x86 Junfeng Yang A PC How to make it do something useful? 2 Outline PC organization x86 instruction set gcc calling conventions PC emulation 3 PC board 4 PC organization One or more
Lightweight Memory Tracing
 Lightweight Memory Tracing Mathias Payer ETH Zurich Enrico Kravina ETH Zurich Thomas R. Gross ETH Zurich Abstract Memory tracing (executing additional code for every memory access of a program) is a powerful
Scott M. Lewandowski CS295-2: Advanced Topics in Debugging September 21, 1998
 Scott M. Lewandowski CS295-2: Advanced Topics in Debugging September 21, 1998 Assembler Syntax Everything looks like this: label: instruction dest,src instruction label Comments: comment $ This is a comment
Protection and System Calls. Otto J. Anshus
 Protection and System Calls Otto J. Anshus Protection Issues CPU protection Prevent a user from using the CPU for too long Throughput of jobs, and response time to events (incl. user interactive response
Winter Compiler Construction T11 Activation records + Introduction to x86 assembly. Today. Tips for PA4. Today:
 Winter 2006-2007 Compiler Construction T11 Activation records + Introduction to x86 assembly Mooly Sagiv and Roman Manevich School of Computer Science Tel-Aviv University Today ic IC Language Lexical Analysis
COREMU: a Portable and Scalable Parallel Full-system Emulator
 COREMU: a Portable and Scalable Parallel Full-system Emulator Haibo Chen Parallel Processing Institute Fudan University http://ppi.fudan.edu.cn/haibo_chen Full-System Emulator Useful tool for multicore
SOEN228, Winter Revision 1.2 Date: October 25,
 SOEN228, Winter 2003 Revision 1.2 Date: October 25, 2003 1 Contents Flags Mnemonics Basic I/O Exercises Overview of sample programs 2 Flag Register The flag register stores the condition flags that retain
Processes (Intro) Yannis Smaragdakis, U. Athens
 Yannis Smaragdakis, U. Athens") Processes (Intro) Yannis Smaragdakis, U. Athens Process: CPU Virtualization Process = Program, instantiated has memory, code, current state What kind of memory do we have? registers + address space Let's
Processes (Intro) Yannis Smaragdakis, U. Athens Process: CPU Virtualization Process = Program, instantiated has memory, code, current state What kind of memory do we have? registers + address space Let's
16.317: Microprocessor Systems Design I Fall 2014
 16.317: Microprocessor Systems Design I Fall 2014 Exam 2 Solution 1. (16 points, 4 points per part) Multiple choice For each of the multiple choice questions below, clearly indicate your response by circling
Do You Trust a Mutated Binary? Drew Bernat Correct Relocation
 Correct Relocation: Do You Trust a Mutated Binary? Drew Bernat bernat@cs.wisc.edu April 30, 2007 Correct Relocation Binary Manipulation We want to: Insert new code Modify or delete code These operations
Islamic University Gaza Engineering Faculty Department of Computer Engineering ECOM 2125: Assembly Language LAB. Lab # 7. Procedures and the Stack
 Islamic University Gaza Engineering Faculty Department of Computer Engineering ECOM 2125: Assembly Language LAB Lab # 7 Procedures and the Stack April, 2014 1 Assembly Language LAB Runtime Stack and Stack
Inserting Data Prefetches into Loops in Dynamically Translated Code in IA-32EL. Inserting Prefetches IA-32 Execution Layer - 1
 I Inserting Data Prefetches into Loops in Dynamically Translated Code in IA-32EL Inserting Prefetches IA-32 Execution Layer - 1 Agenda IA-32EL Brief Overview Prefetching in Loops IA-32EL Prefetching in
CNIT 127: Exploit Development. Ch 2: Stack Overflows in Linux
 CNIT 127: Exploit Development Ch 2: Stack Overflows in Linux Stack-based Buffer Overflows Most popular and best understood exploitation method Aleph One's "Smashing the Stack for Fun and Profit" (1996)
CSE 227 Computer Security Spring 2010 S f o t ftware D f e enses I Ste St f e an f Sa v Sa a v g a e g
 CSE 227 Computer Security Spring 2010 Software Df Defenses I Stefan Savage Kinds of defenses Eliminate violation of runtime model Better languages, code analysis Don t allow bad input Input validation
16.317: Microprocessor Systems Design I Spring 2015
 16.317: Microprocessor Systems Design I Spring 2015 Exam 2 Solution 1. (16 points, 4 points per part) Multiple choice For each of the multiple choice questions below, clearly indicate your response by
Return-orientated Programming
 Return-orientated Programming or The Geometry of Innocent Flesh on the Bone: Return-into-libc without Function Calls (on the x86) Hovav Shacham, CCS '07 Return-Oriented oriented Programming programming
Pin: Building Customized Program Analysis Tools with Dynamic Instrumentation
 Pin: Building Customized Program Analysis Tools with Dynamic Instrumentation Chi-Keung Luk Robert Cohn Robert Muth Harish Patil Artur Klauser Geoff Lowney Steven Wallace Vijay Janapa Reddi Kim Hazelwood
CS165 Computer Security. Understanding low-level program execution Oct 1 st, 2015
 CS165 Computer Security Understanding low-level program execution Oct 1 st, 2015 A computer lets you make more mistakes faster than any invention in human history - with the possible exceptions of handguns
THEORY OF COMPILATION
 Lecture 10 Activation Records THEORY OF COMPILATION EranYahav www.cs.technion.ac.il/~yahave/tocs2011/compilers-lec10.pptx Reference: Dragon 7.1,7.2. MCD 6.3,6.4.2 1 You are here Compiler txt Source Lexical
Reverse Engineering Low Level Software. CS5375 Software Reverse Engineering Dr. Jaime C. Acosta
 1 Reverse Engineering Low Level Software CS5375 Software Reverse Engineering Dr. Jaime C. Acosta Machine code 2 3 Machine code Assembly compile Machine Code disassemble 4 Machine code Assembly compile
Exceptions and Processes
 Exceptions and Processes Much of the material for this lecture is drawn from Computer Systems: A Programmer s Perspective (Bryant & O Hallaron) Chapter 8 1 Goals of this Lecture Help you learn about: Exceptions
ICS143A: Principles of Operating Systems. Midterm recap, sample questions. Anton Burtsev February, 2017
 ICS143A: Principles of Operating Systems Midterm recap, sample questions Anton Burtsev February, 2017 Describe the x86 address translation pipeline (draw figure), explain stages. Address translation What
administrivia today start assembly probably won t finish all these slides Assignment 4 due tomorrow any questions?
 administrivia today start assembly probably won t finish all these slides Assignment 4 due tomorrow any questions? exam on Wednesday today s material not on the exam 1 Assembly Assembly is programming
Assembly Programmer s View Lecture 4A Machine-Level Programming I: Introduction
 Assembly Programmer s View Lecture 4A Machine-Level Programming I: Introduction E I P CPU isters Condition Codes Addresses Data Instructions Memory Object Code Program Data OS Data Topics Assembly Programmer
Overview REWARDS TIE HOWARD Summary CS 6V Data Structure Reverse Engineering. Zhiqiang Lin
 CS 6V81-05 Data Structure Reverse Engineering Zhiqiang Lin Department of Computer Science The University of Texas at Dallas September 2 nd, 2011 Outline 1 Overview 2 REWARDS 3 TIE 4 HOWARD 5 Summary Outline
Betriebssysteme und Sicherheit Sicherheit. Buffer Overflows
 Betriebssysteme und Sicherheit Sicherheit Buffer Overflows Software Vulnerabilities Implementation error Input validation Attacker-supplied input can lead to Corruption Code execution... Even remote exploitation
x86 Assembly Tutorial COS 318: Fall 2017
 x86 Assembly Tutorial COS 318: Fall 2017 Project 1 Schedule Design Review: Monday 9/25 Sign up for 10-min slot from 3:00pm to 7:00pm Complete set up and answer posted questions (Official) Precept: Monday
CSE P 501 Compilers. x86 Lite for Compiler Writers Hal Perkins Autumn /25/ Hal Perkins & UW CSE J-1
 CSE P 501 Compilers x86 Lite for Compiler Writers Hal Perkins Autumn 2011 10/25/2011 2002-11 Hal Perkins & UW CSE J-1 Agenda Learn/review x86 architecture Core 32-bit part only for now Ignore crufty, backward-compatible
Buffer Overflow Attack
 Buffer Overflow Attack What every applicant for the hacker should know about the foundation of buffer overflow attacks By (Dalgona@wowhacker.org) Email: zinwon@gmail.com 2005 9 5 Abstract Buffer overflow.
THEORY OF COMPILATION
 Lecture 10 Code Generation THEORY OF COMPILATION EranYahav Reference: Dragon 8. MCD 4.2.4 1 You are here Compiler txt Source Lexical Analysis Syntax Analysis Parsing Semantic Analysis Inter. Rep. (IR)
Microkernel Construction
 Kernel Entry / Exit SS2013 Control Transfer Microkernel User Stack A Address Space Kernel Stack A User Stack User Stack B Address Space Kernel Stack B User Stack 1. Kernel Entry (A) 2. Thread Switch (A
X86 Review Process Layout, ISA, etc. CS642: Computer Security. Drew Davidson
 X86 Review Process Layout, ISA, etc. CS642: Computer Security Drew Davidson davidson@cs.wisc.edu From Last Time ACL-based permissions (UNIX style) Read, Write, execute can be restricted on users and groups
The Instruction Set. Chapter 5
 The Instruction Set Architecture Level(ISA) Chapter 5 1 ISA Level The ISA level l is the interface between the compilers and the hardware. (ISA level code is what a compiler outputs) 2 Memory Models An
SafeMachine malware needs love, too. Martin Hron, Jakub Jermář AVAST Software, research
 SafeMachine malware needs love, too Martin Hron, Jakub Jermář AVAST Software, research Dynamic malware detection Dynamic: dy nam ic adjective \dī-ˈna-mik\: changing; active; in motion In a context of the
Reverse Engineering II: The Basics
 Reverse Engineering II: The Basics This document is only to be distributed to teachers and students of the Malware Analysis and Antivirus Technologies course and should only be used in accordance with
Low-Level Essentials for Understanding Security Problems Aurélien Francillon
 Low-Level Essentials for Understanding Security Problems Aurélien Francillon francill@eurecom.fr Computer Architecture The modern computer architecture is based on Von Neumann Two main parts: CPU (Central
CPS104 Recitation: Assembly Programming
 CPS104 Recitation: Assembly Programming Alexandru Duțu 1 Facts OS kernel and embedded software engineers use assembly for some parts of their code some OSes had their entire GUIs written in assembly in
CMSC 313 COMPUTER ORGANIZATION & ASSEMBLY LANGUAGE PROGRAMMING
 CMSC 313 COMPUTER ORGANIZATION & ASSEMBLY LANGUAGE PROGRAMMING LECTURE 16, SPRING 2013 TOPICS TODAY Project 6 Perils & Pitfalls of Memory Allocation C Function Call Conventions in Assembly Language PERILS
Identifying and Analyzing Pointer Misuses for Sophisticated Memory-corruption Exploit Diagnosis
 Identifying and Analyzing Pointer Misuses for Sophisticated Memory-corruption Exploit Diagnosis Mingwei Zhang ( ) Aravind Prakash ( ) Xiaolei Li ( ) Zhenkai Liang ( ) Heng Yin ( ) ( ) School of Computing,
Module 3 Instruction Set Architecture (ISA)
") Module 3 Instruction Set Architecture (ISA) I S A L E V E L E L E M E N T S O F I N S T R U C T I O N S I N S T R U C T I O N S T Y P E S N U M B E R O F A D D R E S S E S R E G I S T E R S T Y P E S O
Module 3 Instruction Set Architecture (ISA) I S A L E V E L E L E M E N T S O F I N S T R U C T I O N S I N S T R U C T I O N S T Y P E S N U M B E R O F A D D R E S S E S R E G I S T E R S T Y P E S O
Exploiting Stack Buffer Overflows Learning how blackhats smash the stack for fun and profit so we can prevent it
 Exploiting Stack Buffer Overflows Learning how blackhats smash the stack for fun and profit so we can prevent it 29.11.2012 Secure Software Engineering Andreas Follner 1 Andreas Follner Graduated earlier
CSCI 334: Principles of Programming Languages. Computer Architecture (a really really fast introduction) Lecture 11: Control Structures II
 Lecture 11: Control Structures II") 1 byte{ 1 byte{ CSCI 334: Principles of Programming Languages Lecture 11: Control Structures II Computer Architecture (a really really fast introduction) Instructor: Dan Barowy Memory Instructions main
1 byte{ 1 byte{ CSCI 334: Principles of Programming Languages Lecture 11: Control Structures II Computer Architecture (a really really fast introduction) Instructor: Dan Barowy Memory Instructions main
Building Dynamic Instrumentation Tools with DynamoRIO. Derek Bruening Qin Zhao
 Building Dynamic Instrumentation Tools with DynamoRIO Derek Bruening Qin Zhao Tutorial Outline 1:30-1:40 Welcome + DynamoRIO History 1:40-2:40 DynamoRIO Internals 2:40-3:00 Examples, Part 1 3:00-3:15 Break
+ Overview. Projects: Developing an OS Kernel for x86. ! Handling Intel Processor Exceptions: the Interrupt Descriptor Table (IDT)
") + Projects: Developing an OS Kernel for x86 Low-Level x86 Programming: Exceptions, Interrupts, and Timers + Overview! Handling Intel Processor Exceptions: the Interrupt Descriptor Table (IDT)! Handling
+ Projects: Developing an OS Kernel for x86 Low-Level x86 Programming: Exceptions, Interrupts, and Timers + Overview! Handling Intel Processor Exceptions: the Interrupt Descriptor Table (IDT)! Handling
Basic Execution Environment
 Basic Execution Environment 3 CHAPTER 3 BASIC EXECUTION ENVIRONMENT This chapter describes the basic execution environment of an Intel Architecture processor as seen by assembly-language programmers.
A program execution is memory safe so long as memory access errors never occur:
 A program execution is memory safe so long as memory access errors never occur: Buffer overflows, null pointer dereference, use after free, use of uninitialized memory, illegal free Memory safety categories
Function Calls COS 217. Reading: Chapter 4 of Programming From the Ground Up (available online from the course Web site)
") Function Calls COS 217 Reading: Chapter 4 of Programming From the Ground Up (available online from the course Web site) 1 Goals of Today s Lecture Finishing introduction to assembly language o EFLAGS register
Function Calls COS 217 Reading: Chapter 4 of Programming From the Ground Up (available online from the course Web site) 1 Goals of Today s Lecture Finishing introduction to assembly language o EFLAGS register
238P: Operating Systems. Lecture 5: Address translation. Anton Burtsev January, 2018
 238P: Operating Systems Lecture 5: Address translation Anton Burtsev January, 2018 Two programs one memory Very much like car sharing What are we aiming for? Illusion of a private address space Identical
Università Ca Foscari Venezia
 Stack Overflow Security 1 2018-19 Università Ca Foscari Venezia www.dais.unive.it/~focardi secgroup.dais.unive.it Introduction Buffer overflow is due to careless programming in unsafe languages like C
COMPUTER ENGINEERING DEPARTMENT
 Page 1 of 11 COMPUTER ENGINEERING DEPARTMENT December 31, 2007 COE 205 COMPUTER ORGANIZATION & ASSEMBLY PROGRAMMING Major Exam II First Semester (071) Time: 7:00 PM-9:30 PM Student Name : KEY Student ID.
Homework / Exam. Return and Review Exam #1 Reading. Machine Projects. Labs. S&S Extracts , PIC Data Sheet. Start on mp3 (Due Class 19)
") Homework / Exam Return and Review Exam #1 Reading S&S Extracts 385-393, PIC Data Sheet Machine Projects Start on mp3 (Due Class 19) Labs Continue in labs with your assigned section 1 Interrupts An interrupt
Homework / Exam Return and Review Exam #1 Reading S&S Extracts 385-393, PIC Data Sheet Machine Projects Start on mp3 (Due Class 19) Labs Continue in labs with your assigned section 1 Interrupts An interrupt
Accelerating Multi-core Processor Design Space Evaluation Using Automatic Multi-threaded Workload Synthesis
 Accelerating Multi-core Processor Design Space Evaluation Using Automatic Multi-threaded Workload Synthesis Clay Hughes & Tao Li Department of Electrical and Computer Engineering University of Florida
Machine-level Representation of Programs. Jin-Soo Kim Computer Systems Laboratory Sungkyunkwan University
 Machine-level Representation of Programs Jin-Soo Kim (jinsookim@skku.edu) Computer Systems Laboratory Sungkyunkwan University http://csl.skku.edu Program? 짬뽕라면 준비시간 :10 분, 조리시간 :10 분 재료라면 1개, 스프 1봉지, 오징어
Representation of Information
 Representation of Information CS61, Lecture 2 Prof. Stephen Chong September 6, 2011 Announcements Assignment 1 released Posted on http://cs61.seas.harvard.edu/ Due one week from today, Tuesday 13 Sept
UMBC. contain new IP while 4th and 5th bytes contain CS. CALL BX and CALL [BX] versions also exist. contain displacement added to IP.
![UMBC. contain new IP while 4th and 5th bytes contain CS. CALL BX and CALL [BX] versions also exist. contain displacement added to IP.](/thumbs/74/70839578.jpg "UMBC. contain new IP while 4th and 5th bytes contain CS. CALL BX and CALL [BX] versions also exist. contain displacement added to IP.") Procedures: CALL: Pushes the address of the instruction following the CALL instruction onto the stack. RET: Pops the address. SUM PROC NEAR USES BX CX DX ADD AX, BX ADD AX, CX MOV AX, DX RET SUM ENDP NEAR
Procedures: CALL: Pushes the address of the instruction following the CALL instruction onto the stack. RET: Pops the address. SUM PROC NEAR USES BX CX DX ADD AX, BX ADD AX, CX MOV AX, DX RET SUM ENDP NEAR
Compiler Construction D7011E
 Compiler Construction D7011E Lecture 8: Introduction to code generation Viktor Leijon Slides largely by Johan Nordlander with material generously provided by Mark P. Jones. 1 What is a Compiler? Compilers
printf("this program adds the value 10 to a given integer number.\n\n");
;") PA1 Sample Solution Program 1 void add10(int *n); //Prototype int n; printf("this program adds the value 10 to a given integer number.\n\n"); printf("please enter an integer number: "); scanf("%d", &n);
PA1 Sample Solution Program 1 void add10(int *n); //Prototype int n; printf("this program adds the value 10 to a given integer number.\n\n"); printf("please enter an integer number: "); scanf("%d", &n);
CS 161 Computer Security. Week of January 22, 2018: GDB and x86 assembly
 Raluca Popa Spring 2018 CS 161 Computer Security Discussion 1 Week of January 22, 2018: GDB and x86 assembly Objective: Studying memory vulnerabilities requires being able to read assembly and step through
Objectives. ICT106 Fundamentals of Computer Systems Topic 8. Procedures, Calling and Exit conventions, Run-time Stack Ref: Irvine, Ch 5 & 8
 Objectives ICT106 Fundamentals of Computer Systems Topic 8 Procedures, Calling and Exit conventions, Run-time Stack Ref: Irvine, Ch 5 & 8 To understand how HLL procedures/functions are actually implemented
Assembly Language: Function Calls
 Assembly Language: Function Calls 1 Goals of this Lecture Help you learn: Function call problems: Calling and returning Passing parameters Storing local variables Handling registers without interference
CS241 Computer Organization Spring 2015 IA
 CS241 Computer Organization Spring 2015 IA-32 2-10 2015 Outline! Review HW#3 and Quiz#1! More on Assembly (IA32) move instruction (mov) memory address computation arithmetic & logic instructions (add,
Procedure-Calling Conventions October 30
 Procedure-Calling Conventions October 30 CSC201 Section 002 Fall, 2000 Saving registers Registers are inevitably used by subroutines; changes their! Registers have global scope; calling procedures also
Dr. Ramesh K. Karne Department of Computer and Information Sciences, Towson University, Towson, MD /12/2014 Slide 1
 Dr. Ramesh K. Karne Department of Computer and Information Sciences, Towson University, Towson, MD 21252 rkarne@towson.edu 11/12/2014 Slide 1 Intel x86 Aseembly Language Assembly Language Assembly Language
New features in AddressSanitizer. LLVM developer meeting Nov 7, 2013 Alexey Samsonov, Kostya Serebryany
 New features in AddressSanitizer LLVM developer meeting Nov 7, 2013 Alexey Samsonov, Kostya Serebryany Agenda AddressSanitizer (ASan): a quick reminder New features: Initialization-order-fiasco Stack-use-after-scope
Inside VMProtect. Introduction. Internal. Analysis. VM Logic. Inside VMProtect. Conclusion. Samuel Chevet. 16 January 2015.
 16 January 2015 Agenda Describe what VMProtect is Introduce code virtualization in software protection Methods for circumvention VM logic Warning Some assumptions are made in this presentation Only few
Lecture: SMT, Cache Hierarchies. Topics: SMT processors, cache access basics and innovations (Sections B.1-B.3, 2.1)
") Lecture: SMT, Cache Hierarchies Topics: SMT processors, cache access basics and innovations (Sections B.1-B.3, 2.1) 1 Thread-Level Parallelism Motivation: a single thread leaves a processor under-utilized
Lecture: SMT, Cache Hierarchies Topics: SMT processors, cache access basics and innovations (Sections B.1-B.3, 2.1) 1 Thread-Level Parallelism Motivation: a single thread leaves a processor under-utilized
Lecture 11: SMT and Caching Basics. Today: SMT, cache access basics (Sections 3.5, 5.1)
") Lecture 11: SMT and Caching Basics Today: SMT, cache access basics (Sections 3.5, 5.1) 1 Thread-Level Parallelism Motivation: a single thread leaves a processor under-utilized for most of the time by doubling
Lecture 11: SMT and Caching Basics Today: SMT, cache access basics (Sections 3.5, 5.1) 1 Thread-Level Parallelism Motivation: a single thread leaves a processor under-utilized for most of the time by doubling
Islamic University Gaza Engineering Faculty Department of Computer Engineering ECOM 2125: Assembly Language LAB. Lab # 10. Advanced Procedures
 Islamic University Gaza Engineering Faculty Department of Computer Engineering ECOM 2125: Assembly Language LAB Lab # 10 Advanced Procedures May, 2014 1 Assembly Language LAB Stack Parameters There are
What is a Compiler? Compiler Construction SMD163. Why Translation is Needed: Know your Target: Lecture 8: Introduction to code generation
 Compiler Construction SMD163 Lecture 8: Introduction to code generation Viktor Leijon & Peter Jonsson with slides by Johan Nordlander Contains material generously provided by Mark P. Jones What is a Compiler?
Assembly Language: Function Calls" Goals of this Lecture"
 Assembly Language: Function Calls" 1 Goals of this Lecture" Help you learn:" Function call problems:" Calling and returning" Passing parameters" Storing local variables" Handling registers without interference"
T Jarkko Turkulainen, F-Secure Corporation
 T-110.6220 2010 Emulators and disassemblers Jarkko Turkulainen, F-Secure Corporation Agenda Disassemblers What is disassembly? What makes up an instruction? How disassemblers work Use of disassembly In
Ramblr. Making Reassembly Great Again
 Ramblr Making Reassembly Great Again Ruoyu Fish Wang, Yan Shoshitaishvili, Antonio Bianchi, Aravind Machiry, John Grosen, Paul Grosen, Christopher Kruegel, Giovanni Vigna Motivation Available Solutions
Digital Forensics Lecture 3 - Reverse Engineering
 Digital Forensics Lecture 3 - Reverse Engineering Low-Level Software Akbar S. Namin Texas Tech University Spring 2017 Reverse Engineering High-Level Software Low-level aspects of software are often the
Reverse Engineering II: Basics. Gergely Erdélyi Senior Antivirus Researcher
 Reverse Engineering II: Basics Gergely Erdélyi Senior Antivirus Researcher Agenda Very basics Intel x86 crash course Basics of C Binary Numbers Binary Numbers 1 Binary Numbers 1 0 1 1 Binary Numbers 1
Operating Systems and Protection CS 217
 Operating Systems and Protection CS 7 Goals of Today s Lecture How multiple programs can run at once o es o Context switching o control block o Virtual Boundary between parts of the system o User programs
4. Jump to *RA 4. StackGuard 5. Execute code 5. Instruction Set Randomization 6. Make system call 6. System call Randomization
 04/04/06 Lecture Notes Untrusted Beili Wang Stages of Static Overflow Solution 1. Find bug in 1. Static Analysis 2. Send overflowing input 2. CCured 3. Overwrite return address 3. Address Space Randomization
Overview. Constructors and destructors Virtual functions Single inheritance Multiple inheritance RTTI Templates Exceptions Operator Overloading
 How C++ Works 1 Overview Constructors and destructors Virtual functions Single inheritance Multiple inheritance RTTI Templates Exceptions Operator Overloading Motivation There are lot of myths about C++
MACHINE-LEVEL PROGRAMMING I: BASICS COMPUTER ARCHITECTURE AND ORGANIZATION
 MACHINE-LEVEL PROGRAMMING I: BASICS COMPUTER ARCHITECTURE AND ORGANIZATION Today: Machine Programming I: Basics History of Intel processors and architectures C, assembly, machine code Assembly Basics:
Communicating with People (2.8)
") Communicating with People (2.8) For communication Use characters and strings Characters 8-bit (one byte) data for ASCII lb $t0, 0($sp) ; load byte Load a byte from memory, placing it in the rightmost 8-bits
Communicating with People (2.8) For communication Use characters and strings Characters 8-bit (one byte) data for ASCII lb $t0, 0($sp) ; load byte Load a byte from memory, placing it in the rightmost 8-bits