Writing Functions! Part I!
|
|
|
- Kevin Leonard
- 5 years ago
- Views:
Transcription
1 Writing Functions! Part I!
2 In your mat219_class project 1. Create a new R script or R notebook called wri7ng_func7ons 2. Include this code in your script or notebook: library(tidyverse) library(gapminder) gapminder <- gapminder::gapminder
3 checking validity of arguments
4 Test functions
5 max_minus_min <- func7on(x) { if(!is.numeric(x)){ stop( expected input is a numeric vector.\n, actual input was of class, class(x)[1]) } max(x) min(x) } If a func7on will get used again in different contexts, it is good to check the validity of the arguments Rule of Repair: When you must fail, fail noisily and as soon as possible
6 Your Turn 1 The max and min of a numeric vector are special cases of a quantile: min = 0 quantile Q1 = 0.25 quantile median = 0.5 quantile Q3 = 0.75 quantile max = 1 quantile Suppose we sometimes want max min, sometime Q3 Q1 (the IQR), and sometimes the difference between two other quantiles. Write a function that takes the difference of two specified quantiles for a numeric vector. Hint: consider using quantile().
7 quan7le(gapminder$lifeexp) boxplot(gapminder$lifeexp, plot = FALSE)$stats quan7le(gapminder$lifeexp, probs = 0.5) median(gapminder$lifeexp) quan7le(gapminder$lifeexp, probs = c(0.25, 0.75)) take some 7me to understand how quan7le() works
8 first step: get something to work the_probs <- c(0.25, 0.75) the_quan7les <- quan7le(gapminder$lifeexp, probs = the_probs) max(the_quan7les) - min(the_quan7les)
9 second step: turn the code into a func7on quan7le_diff <- func7on(x, probs) { the_quan7les <- quan7le(x = x, probs = probs) max(the_quan7les) - min(the_quan7les) } quan7le_diff(gapminder$lifeexp, probs = c(0.25, 0.75)) IQR(gapminder$lifeExp)
10 second step: turn the code into a func7on quan7le_diff <- func7on(x, probs) { the_quan7les <- quan7le(x = x, probs = probs) max(the_quan7les) - min(the_quan7les) } quan7le_diff(gapminder$lifeexp, probs = c(0, 1)) max_minus_min(gapminder$lifeexp)
11 default arguments
12 max_minus_min(gapminder$lifeexp) quan7le_diff(gapminder$lifeexp) it would be nice if our generaliza7on worked the same as our old func7on when we wanted it to
13 quan7le_diff <- func7on(x, probs = c(0, 1)) { the_quan7les <- quan7le(x = x, probs = probs) max(the_quan7les) - min(the_quan7les) } quan7le_diff(gapminder$lifeexp) max_minus_min(gapminder$lifeexp)
14 the argument
15 ?quan7le
16 quan7le_diff <- func7on(x, probs = c(0, 1), ) { the_quan7les <- quan7le(x = x, probs = probs, ) max(the_quan7les) - min(the_quan7les) } quan7le_diff(c(1, 2, NA), na.rm = TRUE)
17 iteration
18 Setup Run the following code to simulate exam scores for five students: set.seed(42) stu1 <- runif(10, 50, 100) stu2 <- runif(10, 50, 100) stu3 <- runif(10, 50, 100) stu4 <- runif(10, 50, 100) stu5 <- runif(10, 50, 100)
19 Task 2 For each student, compute the mean exam score after dropping the lowest score. Accomplish this task by writing a function called grade.
20 Goal: compute the mean exam score after dropping the lowest score. 1. Get something that works (sum(stu1) min(stu1)) / (length(stu1) 1)
21 Goal: compute the mean exam score after dropping the lowest score. 1. Get something that works 2. Turn that code into a func7on grade <- func7on(x) { (sum(x) min(x)) / (length(x) 1) } grade(stu1)
22 grade <- func7on(x) { (sum(x) min(x)) / (length(x) 1) } grade(stu1) grade(stu4) grade(stu2) grade(stu5) grade(stu3)
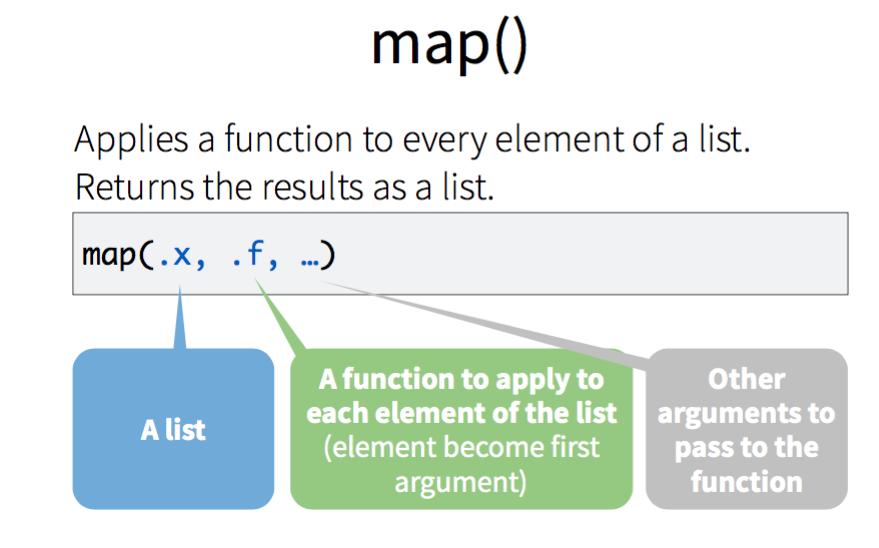
23 map()
24
25 exams <- list(stu1, stu2, stu3, stu4, stu5) map(exams, mean)

26
27
28 Task 3 Create a vector of type double that contains the grade (mean after removing the lowest score) for each student.
29 exams <- list(stu1, stu2, stu3, stu4, stu5) exams %>% map_dbl(grade)
30 Extra arguments exams <- list(stu1, stu2, stu3, stu4, stu5) exams %>% map_dbl(quan7le_diff)
31 Extra arguments exams <- list(stu1, stu2, stu3, stu4, stu5) exams %>% map_dbl(quan7le_diff, probs = c(0.25, 0.75))
32 operating on a selection of variables
33 Task 3 Write a function that computes the z-score for a numeric vector. Name the function zscore.
34 zscore <- func7on(x) { (x mean(x)) / sd(x) }
35 gapminder %>% mutate(gdppercap = zscore(gdppercap)) gapminder %>% mutate_at(vars(lifeexp:gdppercap), zscore) mutate_at() lets you select variables using the same syntax as the select() verb.
36 gapminder %>% mutate(gdppercap = zscore(gdppercap)) gapminder %>% mutate_if(is.numeric, zscore) mutate_if() lets you select variables based on a logical test (called the predicate).
37 The following data manipula7on verbs have *_at(), *_if(), and *_all() variants: mutate() transmute() summarise() filter() select() rename() arrange group_by()
38 dm <- 7bble(x = c(34, 145, 6544, 32, 129), y = c(345, 1452, 644, 312, 6129)) dm %>% mutate(z = sqrt(x))
39 dm <- 7bble(x = c(34, 145, 6544, 32, 129), y = c(345, 1452, 644, 312, 6129)) dm %>% mutate(z = reverse_int(x)) reverse_int <- func7on(x){ reverse <- 0 while (x!= 0){ rem <- x %% 10 reverse <- reverse * 10 + rem x <- x %/% 10 } reverse }
40 dm <- 7bble(x = c(34, 145, 6544, 32, 129), y = c(345, 1452, 644, 312, 6129)) dm %>% mutate(z = map_dbl(x, reverse_int)) reverse_int <- func7on(x){ reverse <- 0 while (x!= 0){ rem <- x %% 10 reverse <- reverse * 10 + rem x <- x %/% 10 } reverse }
The Average and SD in R
 The Average and SD in R The Basics: mean() and sd() Calculating an average and standard deviation in R is straightforward. The mean() function calculates the average and the sd() function calculates the
Day 4 Percentiles and Box and Whisker.notebook. April 20, 2018
 Day 4 Box & Whisker Plots and Percentiles In a previous lesson, we learned that the median divides a set a data into 2 equal parts. Sometimes it is necessary to divide the data into smaller more precise
DSCI 325: Handout 24 Introduction to Writing Functions in R Spring 2017
 DSCI 325: Handout 24 Introduction to Writing Functions in R Spring 2017 We have already used several existing R functions in previous handouts. For example, consider the Grades dataset. Once the data frame
Univariate Data - 2. Numeric Summaries
 Univariate Data - 2. Numeric Summaries Young W. Lim 2018-08-01 Mon Young W. Lim Univariate Data - 2. Numeric Summaries 2018-08-01 Mon 1 / 36 Outline 1 Univariate Data Based on Numerical Summaries R Numeric
Name Geometry Intro to Stats. Find the mean, median, and mode of the data set. 1. 1,6,3,9,6,8,4,4,4. Mean = Median = Mode = 2.
 Name Geometry Intro to Stats Statistics are numerical values used to summarize and compare sets of data. Two important types of statistics are measures of central tendency and measures of dispersion. A
Numeric Vectors STAT 133. Gaston Sanchez. Department of Statistics, UC Berkeley
 Numeric Vectors STAT 133 Gaston Sanchez Department of Statistics, UC Berkeley gastonsanchez.com github.com/gastonstat/stat133 Course web: gastonsanchez.com/stat133 Data Types and Structures To make the
Lecture 3: Basics of R Programming
 Lecture 3: Basics of R Programming This lecture introduces you to how to do more things with R beyond simple commands. Outline: 1. R as a programming language 2. Grouping, loops and conditional execution
Data wrangling. Reduction/Aggregation: reduces a variable to a scalar
 Data Wrangling Some definitions A data table is a collection of variables and observations A variable (when data are tidy) is a single column in a data table An observation is a single row in a data table,
3.3 The Five-Number Summary Boxplots
 3.3 The Five-Number Summary Boxplots Tom Lewis Fall Term 2009 Tom Lewis () 3.3 The Five-Number Summary Boxplots Fall Term 2009 1 / 9 Outline 1 Quartiles 2 Terminology Tom Lewis () 3.3 The Five-Number Summary
Lecture 6: Chapter 6 Summary
 1 Lecture 6: Chapter 6 Summary Z-score: Is the distance of each data value from the mean in standard deviation Standardizes data values Standardization changes the mean and the standard deviation: o Z
Chapter 3. built in functions help feature elementary math functions data analysis functions random number functions computational limits
 Chapter 3 built in functions help feature elementary math functions data analysis functions random number functions computational limits I have used resources for instructors, available from the publisher
Measures of Position. 1. Determine which student did better
 Measures of Position z-score (standard score) = number of standard deviations that a given value is above or below the mean (Round z to two decimal places) Sample z -score x x z = s Population z - score
Univariate Data - 2. Numeric Summaries
 Univariate Data - 2. Numeric Summaries Young W. Lim 2018-02-05 Mon Young W. Lim Univariate Data - 2. Numeric Summaries 2018-02-05 Mon 1 / 31 Outline 1 Univariate Data Based on Numerical Summaries Young
What is a Function? EF102 - Spring, A&S Lecture 4 Matlab Functions
 What is a Function? EF102 - Spring, 2002 A&S Lecture 4 Matlab Functions What is a M-file? Matlab Building Blocks Matlab commands Built-in commands (if, for, ) Built-in functions sin, cos, max, min Matlab
University of Washington CSE 140 Data Programming Winter Final exam. March 11, 2013
 University of Washington CSE 140 Data Programming Winter 2013 Final exam March 11, 2013 Name: Section: UW Net ID (username): This exam is closed book, closed notes. You have 50 minutes to complete it.
CSci 1113 Midterm 1. Name: Student ID:
 CSci 1113 Midterm 1 Name: Student ID: Instructions: Please pick and answer any 7 of the 9 problems for a total of 70 points. If you answer more than 7 problems, only the first 7 will be graded. The time
Lecture 3: Basics of R Programming
 Lecture 3: Basics of R Programming This lecture introduces how to do things with R beyond simple commands. We will explore programming in R. What is programming? It is the act of instructing a computer
Chapter 5: The standard deviation as a ruler and the normal model p131
 Chapter 5: The standard deviation as a ruler and the normal model p131 Which is the better exam score? 67 on an exam with mean 50 and SD 10 62 on an exam with mean 40 and SD 12? Is it fair to say: 67 is
/ / / x means sum of scores and n =/ f is the number of scores. J 14. Data. Knowing More. Mean, Median, Mode
 Mean, Median, Mode The mean of a data set is written as xr (pronounced x-bar ). It is the arithmetic average of the data set. sumofscores x x x r = or xr = = number of scores n f where x means sum of scores
Getting Started with SQL
 Getting Started with SQL TAMÁS BUDAVÁRI AUGUST 2016 Databases are easy: they consist of tables, which in turn have columns just like the files with which you are probably used to working. The difference
STAT 3743 PROBABILITY & STATISTICS FALL 2010 KERNS. Exam I
 STAT 3743 PROBABILITY & STATISTICS FALL 2010 KERNS Exam I Name: ANSWER KEY Note: the questions are randomly generated so these may (not) exactly match those on your paper. The answers below are for these
MATH& 146 Lesson 10. Section 1.6 Graphing Numerical Data
 MATH& 146 Lesson 10 Section 1.6 Graphing Numerical Data 1 Graphs of Numerical Data One major reason for constructing a graph of numerical data is to display its distribution, or the pattern of variability
Name: Date: Period: Chapter 2. Section 1: Describing Location in a Distribution
 Name: Date: Period: Chapter 2 Section 1: Describing Location in a Distribution Suppose you earned an 86 on a statistics quiz. The question is: should you be satisfied with this score? What if it is the
MATLAB Basics EE107: COMMUNICATION SYSTEMS HUSSAIN ELKOTBY
 MATLAB Basics EE107: COMMUNICATION SYSTEMS HUSSAIN ELKOTBY What is MATLAB? MATLAB (MATrix LABoratory) developed by The Mathworks, Inc. (http://www.mathworks.com) Key Features: High-level language for numerical
EPIB Four Lecture Overview of R
 EPIB-613 - Four Lecture Overview of R R is a package with enormous capacity for complex statistical analysis. We will see only a small proportion of what it can do. The R component of EPIB-613 is divided
What is Matlab? The command line Variables Operators Functions
 What is Matlab? The command line Variables Operators Functions Vectors Matrices Control Structures Programming in Matlab Graphics and Plotting A numerical computing environment Simple and effective programming
6. More Loops, Control Structures, and Bootstrapping
 6. More Loops, Control Structures, and Bootstrapping Ken Rice Timothy Thornotn University of Washington Seattle, July 2013 In this session We will introduce additional looping procedures as well as control
<excelunusual.com> Easy Zoom -Chart axis Scaling Using VBA - by George Lungu. <www.excelunusual.com> 1. Introduction: Chart naming: by George Lungu
 Easy Zoom -Chart axis Scaling Using VBA - by George Lungu Introduction: - In certain models we need to be able to change the scale of the chart axes function of the result of a simulation - An Excel chart
Excel Functions & Tables
 Excel Functions & Tables Fall 2014 Fall 2014 CS130 - Excel Functions & Tables 1 Review of Functions Quick Mathematics Review As it turns out, some of the most important mathematics for this course revolves
Handling Missing Values
 Handling Missing Values STAT 133 Gaston Sanchez Department of Statistics, UC Berkeley gastonsanchez.com github.com/gastonstat/stat133 Course web: gastonsanchez.com/stat133 Missing Values 2 Introduction
Understanding Statistical Questions
 Unit 6: Statistics Standards, Checklist and Concept Map Common Core Georgia Performance Standards (CCGPS): MCC6.SP.1: Recognize a statistical question as one that anticipates variability in the data related
Blackboard 9 - Creating Categories in the Grade Center
 University of Southern California Marshall Information Services Blackboard 9 - Creating Categories in the Grade Center Categories allow you to place Blackboard data columns (i.e. non-calculated columns)
Statistical Programming with R
 Statistical Programming with R Lecture 5: Simple Programming Bisher M. Iqelan biqelan@iugaza.edu.ps Department of Mathematics, Faculty of Science, The Islamic University of Gaza 2017-2018, Semester 1 Functions
Functions of Two Variables
 Functions of Two Variables MATLAB allows us to work with functions of more than one variable With MATLAB 5 we can even move beyond the traditional M N matrix to matrices with an arbitrary number of dimensions
Section 3.2 Measures of Central Tendency MDM4U Jensen
 Section 3.2 Measures of Central Tendency MDM4U Jensen Part 1: Video This video will review shape of distributions and introduce measures of central tendency. Answer the following questions while watching.
Answering Theoretical Questions with R
 Department of Psychology and Human Development Vanderbilt University Using R to Answer Theoretical Questions 1 2 3 4 A Simple Z -Score Function A Rescaling Function Generating a Random Sample Generating
Applied Calculus. Lab 1: An Introduction to R
 1 Math 131/135/194, Fall 2004 Applied Calculus Profs. Kaplan & Flath Macalester College Lab 1: An Introduction to R Goal of this lab To begin to see how to use R. What is R? R is a computer package for
Control Flow Structures
 Control Flow Structures STAT 133 Gaston Sanchez Department of Statistics, UC Berkeley gastonsanchez.com github.com/gastonstat/stat133 Course web: gastonsanchez.com/stat133 Expressions 2 Expressions R code
AP Statistics. Study Guide
 Measuring Relative Standing Standardized Values and z-scores AP Statistics Percentiles Rank the data lowest to highest. Counting up from the lowest value to the select data point we discover the percentile
Chapter 3. More Flow of Control. Copyright 2007 Pearson Education, Inc. Publishing as Pearson Addison-Wesley
 Chapter 3 More Flow of Control Overview 3.1 Using Boolean Expressions 3.2 Multiway Branches 3.3 More about C++ Loop Statements 3.4 Designing Loops Slide 3-3 Flow Of Control Flow of control refers to the
MATH NATION SECTION 9 H.M.H. RESOURCES
 MATH NATION SECTION 9 H.M.H. RESOURCES SPECIAL NOTE: These resources were assembled to assist in student readiness for their upcoming Algebra 1 EOC. Although these resources have been compiled for your
CIS 110 Introduction To Computer Programming. November 21st, 2011 Exam 2
 CIS 110 Introduction To Computer Programming November 21st, 2011 Exam 2 Name and section # Pennkey (# and username): My signature below certifies that I have complied with the University of Pennsylvania
STAT 113: R/RStudio Intro
 STAT 113: R/RStudio Intro Colin Reimer Dawson Last Revised September 1, 2017 1 Starting R/RStudio There are two ways you can run the software we will be using for labs, R and RStudio. Option 1 is to log
Statistics 120 Statistical Computing With R. First Prev Next Last Go Back Full Screen Close Quit
 Statistics 120 Statistical Computing With R First Prev Next Last Go Back Full Screen Close Quit The R System This course uses the R computing environment for practical examples. R serves both as a statistical
Chapter 3. Descriptive Measures. Slide 3-2. Copyright 2012, 2008, 2005 Pearson Education, Inc.
 Chapter 3 Descriptive Measures Slide 3-2 Section 3.1 Measures of Center Slide 3-3 Definition 3.1 Mean of a Data Set The mean of a data set is the sum of the observations divided by the number of observations.
CS 455 Midterm Exam 1 Fall 2017 [Bono] Thursday, Sep. 28, 2017
![CS 455 Midterm Exam 1 Fall 2017 [Bono] Thursday, Sep. 28, 2017](/thumbs/95/124125387.jpg "CS 455 Midterm Exam 1 Fall 2017 [Bono] Thursday, Sep. 28, 2017") Name: USC NetID (e.g., ttrojan): CS 455 Midterm Exam 1 Fall 2017 [Bono] Thursday, Sep. 28, 2017 There are 6 problems on the exam, with 55 points total available. There are 10 pages to the exam (5 pages
Name: USC NetID (e.g., ttrojan): CS 455 Midterm Exam 1 Fall 2017 [Bono] Thursday, Sep. 28, 2017 There are 6 problems on the exam, with 55 points total available. There are 10 pages to the exam (5 pages
Section 6.3: Measures of Position
 Section 6.3: Measures of Position Measures of position are numbers showing the location of data values relative to the other values within a data set. They can be used to compare values from different
Data 8 Final Review #1
 Data 8 Final Review #1 Topics we ll cover: Visualizations Arrays and Table Manipulations Programming constructs (functions, for loops, conditional statements) Chance, Simulation, Sampling and Distributions
Introduction to the R Language
 Introduction to the R Language Loop Functions Biostatistics 140.776 1 / 32 Looping on the Command Line Writing for, while loops is useful when programming but not particularly easy when working interactively
1.3 Graphical Summaries of Data
 Arkansas Tech University MATH 3513: Applied Statistics I Dr. Marcel B. Finan 1.3 Graphical Summaries of Data In the previous section we discussed numerical summaries of either a sample or a data. In this
Introduction to Computer Science Midterm 3 Fall, Points
 Introduction to Computer Science Fall, 2001 100 Points Notes 1. Tear off this sheet and use it to keep your answers covered at all times. 2. Turn the exam over and write your name next to the staple. Do
Measures of Central Tendency:
 Measures of Central Tendency: One value will be used to characterize or summarize an entire data set. In the case of numerical data, it s thought to represent the center or middle of the values. Some data
Box and Whisker Plot Review A Five Number Summary. October 16, Box and Whisker Lesson.notebook. Oct 14 5:21 PM. Oct 14 5:21 PM.
 Oct 14 5:21 PM Oct 14 5:21 PM Box and Whisker Plot Review A Five Number Summary Activities Practice Labeling Title Page 1 Click on each word to view its definition. Outlier Median Lower Extreme Upper Extreme
VEX/RobotC Video Trainer Assignments
 VEX/RobotC Video Trainer Assignments Mr. Holmes Mechatronics I To view the VEX videos assigned for homework, click on the following link to access the Vex Video Trainer: http://www.education.rec.ri.cmu.edu/products/teaching_robotc_cortex/
Transform Data! The Basics Part I continued!
 Transform Data! The Basics Part I continued! arrange() arrange() Order rows from smallest to largest values arrange(.data, ) Data frame to transform One or more columns to order by (addi3onal columns will
Lecture Transcript While and Do While Statements in C++
 Lecture Transcript While and Do While Statements in C++ Hello and welcome back. In this lecture we are going to look at the while and do...while iteration statements in C++. Here is a quick recap of some
Introduction to R. Course in Practical Analysis of Microarray Data Computational Exercises
 Introduction to R Course in Practical Analysis of Microarray Data Computational Exercises 2010 March 22-26, Technischen Universität München Amin Moghaddasi, Kurt Fellenberg 1. Installing R. Check whether
Chapters 6-7. User-Defined Functions
 Chapters 6-7 User-Defined Functions User-Defined Functions, Iteration, and Debugging Strategies Learning objectives: 1. Write simple program modules to implement single numerical methods and algorithms
appstats6.notebook September 27, 2016
 Chapter 6 The Standard Deviation as a Ruler and the Normal Model Objectives: 1.Students will calculate and interpret z scores. 2.Students will compare/contrast values from different distributions using
NAME: DIRECTIONS FOR THE ROUGH DRAFT OF THE BOX-AND WHISKER PLOT
 NAME: DIRECTIONS FOR THE ROUGH DRAFT OF THE BOX-AND WHISKER PLOT 1.) Put the numbers in numerical order from the least to the greatest on the line segments. 2.) Find the median. Since the data set has
Averages and Variation
 Averages and Variation 3 Copyright Cengage Learning. All rights reserved. 3.1-1 Section 3.1 Measures of Central Tendency: Mode, Median, and Mean Copyright Cengage Learning. All rights reserved. 3.1-2 Focus
Numerical Summaries of Data Section 14.3
 MATH 11008: Numerical Summaries of Data Section 14.3 MEAN mean: The mean (or average) of a set of numbers is computed by determining the sum of all the numbers and dividing by the total number of observations.
10.4 Measures of Central Tendency and Variation
 10.4 Measures of Central Tendency and Variation Mode-->The number that occurs most frequently; there can be more than one mode ; if each number appears equally often, then there is no mode at all. (mode
10.4 Measures of Central Tendency and Variation
 10.4 Measures of Central Tendency and Variation Mode-->The number that occurs most frequently; there can be more than one mode ; if each number appears equally often, then there is no mode at all. (mode
Today Function. Note: If you want to retrieve the date and time that the computer is set to, use the =NOW() function.
 function.") Today Function The today function: =TODAY() It has no arguments, and returns the date that the computer is set to. It is volatile, so if you save it and reopen the file one month later the new, updated
Today Function The today function: =TODAY() It has no arguments, and returns the date that the computer is set to. It is volatile, so if you save it and reopen the file one month later the new, updated
MATH 112 Section 7.2: Measuring Distribution, Center, and Spread
 MATH 112 Section 7.2: Measuring Distribution, Center, and Spread Prof. Jonathan Duncan Walla Walla College Fall Quarter, 2006 Outline 1 Measures of Center The Arithmetic Mean The Geometric Mean The Median
Prepare a stem-and-leaf graph for the following data. In your final display, you should arrange the leaves for each stem in increasing order.
 Chapter 2 2.1 Descriptive Statistics A stem-and-leaf graph, also called a stemplot, allows for a nice overview of quantitative data without losing information on individual observations. It can be a good
Principles of Algorithm Design
 Principles of Algorithm Design When you are trying to design an algorithm or a data structure, it s often hard to see how to accomplish the task. The following techniques can often be useful: 1. Experiment
Transform Data! The Basics Part I!
 Transform Data! The Basics Part I! arrange() arrange() Order rows from smallest to largest values arrange(.data, ) Data frame to transform One or more columns to order by (addi3onal columns will be used
MATH& 146 Lesson 8. Section 1.6 Averages and Variation
 MATH& 146 Lesson 8 Section 1.6 Averages and Variation 1 Summarizing Data The distribution of a variable is the overall pattern of how often the possible values occur. For numerical variables, three summary
Chapter 3 Analyzing Normal Quantitative Data
 Chapter 3 Analyzing Normal Quantitative Data Introduction: In chapters 1 and 2, we focused on analyzing categorical data and exploring relationships between categorical data sets. We will now be doing
Normal Distribution. 6.4 Applications of Normal Distribution
 Normal Distribution 6.4 Applications of Normal Distribution 1 /20 Homework Read Sec 6-4. Discussion question p316 Do p316 probs 1-10, 16-22, 31, 32, 34-37, 39 2 /20 3 /20 Objective Find the probabilities
Measures of Dispersion
 Measures of Dispersion 6-3 I Will... Find measures of dispersion of sets of data. Find standard deviation and analyze normal distribution. Day 1: Dispersion Vocabulary Measures of Variation (Dispersion
Statistics 133 Midterm Exam
 Statistics 133 Midterm Exam March 2, 2011 When I ask for an R program, I mean one or more R commands. Try your best to make your answers general, i.e. they shouldn t depend on the specific values presented
Lecture 27: Nov 26, S3 Programming. OOP S3 Objects Unpaired (Two Sample) t-test. James Balamuta STAT UIUC
 t-test. James Balamuta STAT UIUC") Lecture 27: Nov 26, 2018 S3 Programming OOP S3 Objects Unpaired (Two Sample) t-test James Balamuta STAT 385 @ UIUC Announcements Group Project Final Report, Demo Video, and Peer Evaluation due Tuesday,
Lecture 27: Nov 26, 2018 S3 Programming OOP S3 Objects Unpaired (Two Sample) t-test James Balamuta STAT 385 @ UIUC Announcements Group Project Final Report, Demo Video, and Peer Evaluation due Tuesday,
CS 151 Final. Q1 Q2 Q3 Q4 Q5 Total Credit Score. Instructions: Student ID. (Last Name) (First Name) Signature
 (First Name) Signature") CS 151 Final Name Student ID Signature :, (Last Name) (First Name) : : Instructions: 1. Please verify that your paper contains 15 pages including this cover. 2. Write down your Student-Id on the top of
CS 151 Final Name Student ID Signature :, (Last Name) (First Name) : : Instructions: 1. Please verify that your paper contains 15 pages including this cover. 2. Write down your Student-Id on the top of
STAT 545A Class meeting #3 Wednesday, September 11, 2013
 STAT 545A Class meeting #3 Wednesday, September 11, 2013 Dr. Jennifer (Jenny) Bryan Department of Statistics and Michael Smith Laboratories any questions from tutorial re: Basic care and feeding of data
Computer 2 App1. App3 API Library. App3. API Library. Local Clipboard
 System Programming (MEEC/MEAer) Project Assignment 2016/2017 In this project the students will implement a simple distributed clipboard. Applications can copy and past to/from the distributed clipboard
Looping Subtasks. We will examine some basic algorithms that use the while and if constructs. These subtasks include
 1 Programming in C Looping Subtasks We will examine some basic algorithms that use the while and if constructs. These subtasks include Reading unknown quantity of data Counting things Accumulating (summing)
Part I { Getting Started & Manipulating Data with R
 Part I { Getting Started & Manipulating Data with R Gilles Lamothe February 21, 2017 Contents 1 URL for these notes and data 2 2 Origins of R 2 3 Downloading and Installing R 2 4 R Console and Editor 3
1.2. Pictorial and Tabular Methods in Descriptive Statistics
 1.2. Pictorial and Tabular Methods in Descriptive Statistics Section Objectives. 1. Stem-and-Leaf displays. 2. Dotplots. 3. Histogram. Types of histogram shapes. Common notation. Sample size n : the number
CHAPTER 2: SAMPLING AND DATA
 CHAPTER 2: SAMPLING AND DATA This presentation is based on material and graphs from Open Stax and is copyrighted by Open Stax and Georgia Highlands College. OUTLINE 2.1 Stem-and-Leaf Graphs (Stemplots),
3.2-Measures of Center
 3.2-Measures of Center Characteristics of Center: Measures of center, including mean, median, and mode are tools for analyzing data which reflect the value at the center or middle of a set of data. We
Midterm Exam with solutions
 Midterm Exam with solutions CS227-Introduction to Scientific Computation November 8, 2011 1. The following is a transcript of a MATLAB session. >> x=1/62.5 x = 0.016000000000000 >> y=(1+x)-1 y = 0.016000000000000
Numerical Methods 5633
 Numerical Methods 5633 Lecture 1 Marina Krstic Marinkovic marina.marinkovic@cern.ch School of Mathematics Trinity College Dublin Marina Krstic Marinkovic 1 / 15 5633-Numerical Methods R programming https://www.r-project.org/
Chapter 2 Exploring Data with Graphs and Numerical Summaries
 Chapter 2 Exploring Data with Graphs and Numerical Summaries Constructing a Histogram on the TI-83 Suppose we have a small class with the following scores on a quiz: 4.5, 5, 5, 6, 6, 7, 8, 8, 8, 8, 9,
Chapter 3. More Flow of Control. Copyright 2008 Pearson Addison-Wesley. All rights reserved.
 Chapter 3 More Flow of Control Overview 3.1 Using Boolean Expressions 3.2 Multiway Branches 3.3 More about C++ Loop Statements 3.4 Designing Loops Slide 3-3 Flow Of Control Flow of control refers to the
Definition: A data structure is a way of organizing data in a computer so that it can be used efficiently.
 The Science of Computing I Lesson 4: Introduction to Data Structures Living with Cyber Pillar: Data Structures The need for data structures The algorithms we design to solve problems rarely do so without
Week 4: Describing data and estimation
 Week 4: Describing data and estimation Goals Investigate sampling error; see that larger samples have less sampling error. Visualize confidence intervals. Calculate basic summary statistics using R. Calculate
CS264: Homework #1. Due by midnight on Thursday, January 19, 2017
 CS264: Homework #1 Due by midnight on Thursday, January 19, 2017 Instructions: (1) Form a group of 1-3 students. You should turn in only one write-up for your entire group. See the course site for submission
Python Programming Exercises 3
 Python Programming Exercises 3 Notes: These exercises assume that you are comfortable with the contents of the two previous sets of exercises including variables, types, arithmetic expressions, logical
Grammar of data. dplyr. Bjarki Þór Elvarsson and Einar Hjörleifsson. Marine Research Institute. Bjarki&Einar (MRI) R-ICES 1 / 29
 R-ICES 1 / 29") dplyr Bjarki Þór Elvarsson and Einar Hjörleifsson Marine Research Institute Bjarki&Einar (MRI) R-ICES 1 / 29 Working with data A Reformat a variable (e.g. as factors or dates) B Split one variable into
dplyr Bjarki Þór Elvarsson and Einar Hjörleifsson Marine Research Institute Bjarki&Einar (MRI) R-ICES 1 / 29 Working with data A Reformat a variable (e.g. as factors or dates) B Split one variable into
Python Activity 5: Boolean Expressions and Selection Statements
 Python Activity 5: Boolean Expressions and Selection Statements "True or False and making choices" Learning Objectives Students will be able to: Content: Explain the three types of programming structures
Density Curve (p52) Density curve is a curve that - is always on or above the horizontal axis.
 Density curve is a curve that - is always on or above the horizontal axis.") 1.3 Density curves p50 Some times the overall pattern of a large number of observations is so regular that we can describe it by a smooth curve. It is easier to work with a smooth curve, because the histogram
1.3 Density curves p50 Some times the overall pattern of a large number of observations is so regular that we can describe it by a smooth curve. It is easier to work with a smooth curve, because the histogram
R Workshop Daniel Fuller
 R Workshop Daniel Fuller Welcome to the R Workshop @ Memorial HKR The R project for statistical computing is a free open source statistical programming language and project. Follow these steps to get started:
simpler Using R for Introductory Statistics
 John Verzani y 2e+05 4e+05 6e+05 8e+05 20000 40000 60000 80000 120000 160000 Preface page i These notes are an introduction to using the statistical software package R for an introductory statistics course.
Midterm Exam 2 Solutions C Programming Dr. Beeson, Spring 2009
 Midterm Exam 2 Solutions C Programming Dr. Beeson, Spring 2009 April 16, 2009 Instructions: Please write your answers on the printed exam. Do not turn in any extra pages. No interactive electronic devices
EXAM Computer Science 1 Part 1
 Maastricht University Faculty of Humanities and Science Department of Knowledge Engineering EXAM Computer Science 1 Part 1 Block 1.1: Computer Science 1 Code: KEN1120 Examiner: Kurt Driessens Date: Januari
The KSU R Reference Manual: A Gentle Overview of R for Undergraduate & Graduate Students
 : A Gentle Overview of R for Undergraduate & Graduate Students D. Yanosky Last Updated: 12/19/11 Note to readers: This R reference manual is a chapter excerpt from a larger work. Therefore, this manual
CSE505, Fall 2012, Midterm Examination October 30, 2012
 CSE505, Fall 2012, Midterm Examination October 30, 2012 Rules: The exam is closed-book, closed-notes, except for one side of one 8.5x11in piece of paper. Please stop promptly at Noon. You can rip apart