Hands on practices on products and applications.
|
|
|
- Candice Hoover
- 5 years ago
- Views:
Transcription
1 Hands on practices on products and applications. Karol Paradowski Senior Specialist Institute of Geodesy and Cartography Modzelewskiego 27 Street Warsaw Poland 1


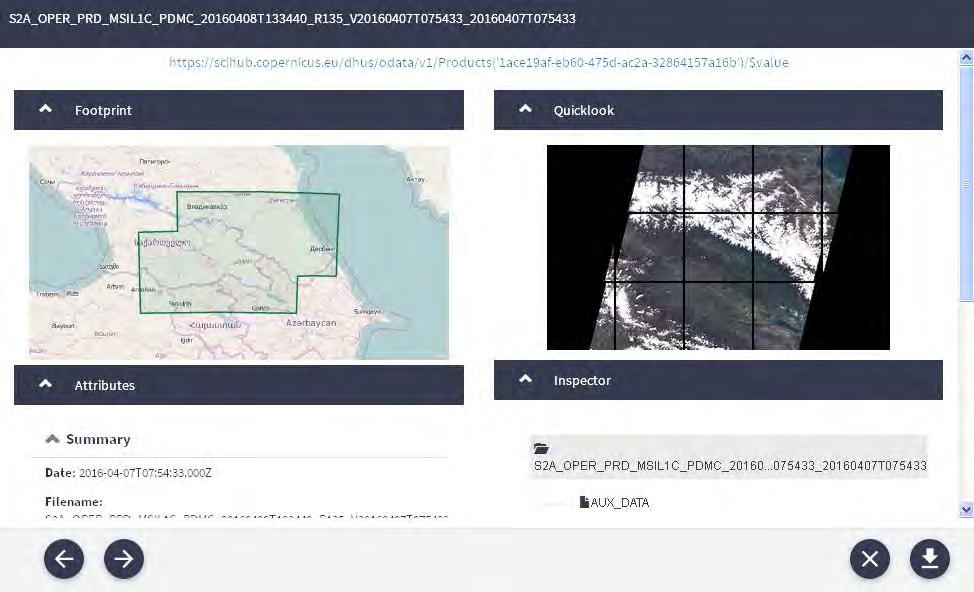
2 Presentation overview Download Sentinel-1 and Sentinel-2 data SNAP download Exercise 1 Sentinel-1 preprocessing and data fusion (SNAP) Sen2Cor download Exercise 2 Sentinel-2 atmospheric correction and NDVI index (Sen2Cor, SNAP) 2

3 Download Sentinel-1 and Sentinel-2 data Scientific Hub 3

4 Download Sentinel-1 and Sentinel-2 data 1 2 4
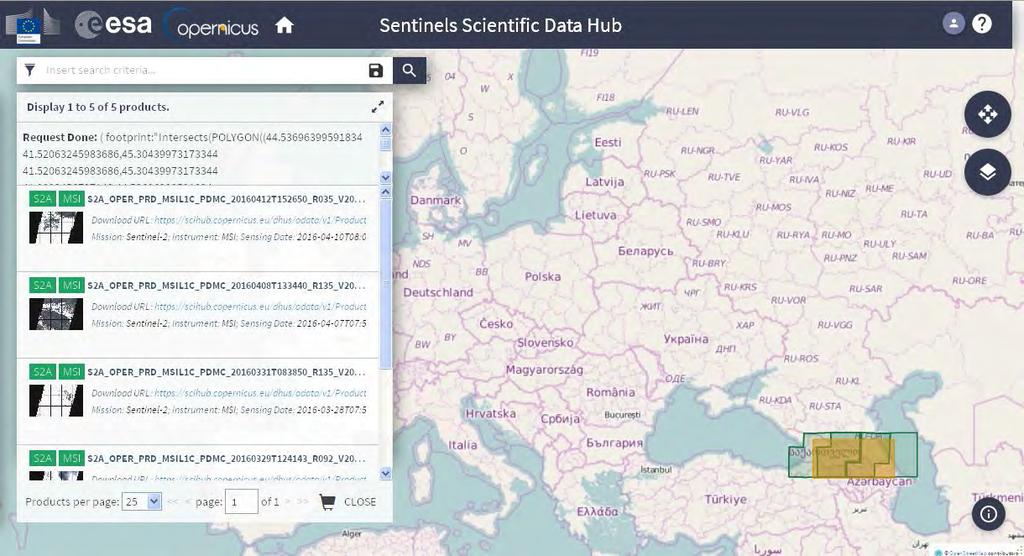

5 Download Sentinel-1 and Sentinel-2 data 1 2 5

6 SNAP: Sentinel Application Platform 6

7 Exercise 1 Sentinel-1 preprocessing and data fusion (SNAP) -> File -> Import -> SAR Sensors -> SENTINEL-1 Navigate to first of three Sentinel-1 data folder, select manifest.safe and confirm with Import Product button. 7

8 1 Exercise 1 Sentinel-1 preprocessing and data fusion (SNAP) 2 Data navigation panel 1 In Product Exporer panel navigate to Bands and doubleclick on Intensity_VV to visulize the data with VV polarization. 2 In Colour Manipulation panel click on Switch to logarithmic display and use black, grey and white sliders to stretch image histogram. 8

9 Exercise 1 Sentinel-1 preprocessing and data fusion (SNAP) Click on Graph Builder icon to open empty graph. 2 Select Sentinel-1 image from dropdown list of open layers. 3 Right-click on the empty canvas and navigate to Subset tool (Add -> Raster - > Geometric -> Subset). A new TAB appears below the canvas. 9

10 Exercise 1 Sentinel-1 preprocessing and data fusion (SNAP) In the same way as Subset tool add Speckle-Filter, Calibration and Terrain- Correction tools to the canvas. o Speckle-Filter Add -> Radar -> Speckle Filtering -> Speckle-Filter o Calibration Add -> Radar -> Radiometric -> Calibration o Terrain-Correction Add -> Radar -> Geometric -> Terrain Correction -> Terrain-Correction Right-click on the canvas and click Connect Graph or connect tools manually by dragging arrows - starting from the right border of each element 10
 and size (Width, height) of the desired subset.")
. Open Speckle-Filter tab and define Filter (e.g.")
11 Exercise 1 Sentinel-1 preprocessing and data fusion (SNAP) Open Subset tab and define in pixel coordinates upper left corner (X, Y) and size (Width, height) of the desired subset. If Source Bands: window is empty simple switch between different tabs to refresh the view. Select two Intensity layers only (with Ctrl button). Open Speckle-Filter tab and define Filter (e.g. Gamma Map) and Filter Size X and Y (e.g. 7). Select two Intensity layers only (with Ctrl). 11
 Leave Calibration")


12 Exercise 1 Sentinel-1 preprocessing and data fusion (SNAP) Leave Calibration tab options without changing anything. In Terrain-Correction tab change Image Resampling Method to NEAREST_NEIGHBOUR and Map Projection to desired projection. 12

13 Exercise 1 Sentinel-1 preprocessing and data fusion (SNAP) Open Write tab and define processed file name (you can leave it default), file format (BEAM-DIMAP as default), and saving location. Click on Save button to save created Graph and hit Run to execute workflow. The processed image will appear in Product Explorer window. Repeat the procedure to generate preprocessed subsets for two other data sets from different acquisition dates: import Sentinel-1 data into SNAP use Graph Builder to load and execute previously saved workflow. 13
14 Exercise 1 Sentinel-1 preprocessing and data fusion (SNAP) Generated Sentinel-1 subsets for three different aquisitiondates. Navigate to: -> Radar -> Coregistration -> Stack Tools -> Create Stack to open stack creation tool. 14


15 Exercise 1 Sentinel-1 preprocessing and data fusion (SNAP) In 1-ProductSet-Reader tab use plus symbol to open Add Product dialog. Navigate to and select three Sentinel-1 subsets (with Ctrl button). Press ok button to add files to the list. 15

 product name and")
16 Exercise 1 Sentinel-1 preprocessing and data fusion (SNAP) In 2-CreateStack tab change Resampling Type: to NEAREST_NEIGHBOUR and Output Extents: to Minimum. Go to 3-Write tab and modify (or leave default values) product name and output directory. Execute tool by pressing Run button. 16

17 Exercise 1 Sentinel-1 preprocessing and data fusion (SNAP) Right-click on the newly created stack and select Open RGB Image Window. From drop-down list select VV bands (three different dates) for red, green and blue and press OK to create RGB composition. 17

18 Exercise 1 Sentinel-1 preprocessing and data fusion (SNAP) A new Image Window will appear with RGB composition. If needed, adjust histogram stretching for each layer (red, green, blue) 18

19 Exercise 1 Sentinel-1 preprocessing and data fusion (SNAP) Make sure that stacked image is selected in Product Explorer window Navigate to: -> File -> Export -> GeoTIFF to open SNAP Export Product tool. Specify file name and location and press Export Product button. 19

20 Sen2Cor: Sentinel-2 Level 2A Atmospheric Correction Processor 20
 o http://continuum.io/downloads Sen2Cor Installation o In the command line utility navigate to the sen2cor-2.2.1 folder, type python setup.")
21 Exercise 2 Sentinel-2 atmospheric correction and NDVI index (sen2cor, SNAP) Sentinel-2 MSI Level-2A Prototype Processor Installation and User Manual CHAPTER 3 CONFIGURATION AND INSTALLATION (page 35) Setting up the Runtime Environment (Anaconda Upgrade/Installation) o Sen2Cor Installation o In the command line utility navigate to the sen2cor folder, type python setup.py install and follow the instructions. The setup will install the Sen2Cor application and all its dependencies under the Anaconda python distribution. 21
.")
22 Exercise 2 Sentinel-2 atmospheric correction and NDVI index (sen2cor, SNAP) Sen2Cor installation script will use internet connection to download all needed packages. User will be asked to press y and Enter to finish the configuration of environment settings and confirm location of sen2cor home directory (which will store e.g. sen2cor configuration file). 22

23 Exercise 2 Sentinel-2 atmospheric correction and NDVI index (sen2cor, SNAP) Use L2A_Process --help command to display help screen with possible options. 23
24 Exercise 2 Sentinel-2 atmospheric correction and NDVI index (sen2cor, SNAP) In case of environment variables error (on Windows OS) use following commands to set them correctly: SET SEN2COR_HOME=C:\Anaconda2\Lib\site-packages\sen2cor py2.7.egg\sen2cor SET SEN2COR_BIN=C:\Anaconda2\Lib\site-packages\sen2cor py2.7.egg\sen2cor If needed adjust both paths to point to the sen2cor folder within Anaconda installation folder. 24
 and in the cfg folder open L2A_GIPP.xml file with appropriate editor (like Notepad++).")
25 Exercise 2 Sentinel-2 atmospheric correction and NDVI index (sen2cor, SNAP) In order to include DEM data in data correction go to the sen2cor home folder (usually in user s Documents folder, e.g. C:\Users\<user-name>\Documents\sen2cor ) and in the cfg folder open L2A_GIPP.xml file with appropriate editor (like Notepad++). In the line with DEM_Directory tags change NONE to any other name (e.g. DEM ). 25
26 Exercise 2 Sentinel-2 atmospheric correction and NDVI index (sen2cor, SNAP) To start data processing use the following command: L2A_PROCESS <unzipped image data folder path> <optional parameters> e.g. L2A_PROCESS D:\S2A_OPER_PRD_MSIL1C_PDMC_ T133440_R135_V T075433_ T resolution 10 INPUT FOLDER: S2A_OPER_PRD_MSIL1C_PDMC_ T133440_R135_V T075433_ T OUTPUT FOLDER: S2A_USER_PRD_MSIL2A_PDMC_ T133440_R135_V T075433_ T
27 Exercise 2 Sentinel-2 atmospheric correction and NDVI index (sen2cor, SNAP) In SNAP navigate to: -> File -> Import -> Optical Sensors -> SENTINEL-2 -> S2-MSI-L2A e.g. subfolder: \GRANULE\S2A_USER_MSI_L2A_TL_SGS T115443_A004136_T38TMM_N02.01 Navigate to processed Sentinel-2 main data folder (whole scene import) or single granule folder (specific granule import), select <image-name>.xml file and use Import Product. 27
 In SNAP -")

![..] option or select [...] Resampled [.](/docs-images/86/94479465/images/28-3.jpg "..] to resample all bands to a specific")
28 Exercise 2 Sentinel-2 atmospheric correction and NDVI index (sen2cor, SNAP) In SNAP - Multiple Readers Available window from dropdown list choose [...] Native resolutions [...] option or select [...] Resampled [...] to resample all bands to a specific resolution (10, 20 or 60m). 28


29 Exercise 2 Sentinel-2 atmospheric correction and NDVI index (sen2cor, SNAP) In Product Explorer window right-click on the newly added data and select Open RGB Image Window tool. In Select RGB-Image Channels window select B4 band as red, B3 as Green and B2 as Blue to create Natural Colors composition. Confirm with OK. A new Image Window will appear. 29

30 Exercise 2 Sentinel-2 atmospheric correction and NDVI index (sen2cor, SNAP) Manipulate with sliders for Red, Green and Blue bands in the Colour Manipulation panel to strech the image histogram. 30
 From menu Raster select Band")
 and select Edit Expression.")

31 Exercise 2 Sentinel-2 atmospheric correction and NDVI index (sen2cor, SNAP) From menu Raster select Band Maths.... In Band Maths dialog define name (e.g. NDVI ) and select Edit Expression... button. In Band Maths Expression Editor define expression as: (B8 B4)/(B8 + B4) and press OK. Confirm with OK in Band Maths window. 31

32 Exercise 2 Sentinel-2 atmospheric correction and NDVI index (sen2cor, SNAP) A new Image Window with calculated NDVI in grey scale will appear. Switch to Pixel Info tab to inspect NDVI values updated from the current cursor position. 32
 In Colour Manipulation panel switch to Table")

33 Exercise 2 Sentinel-2 atmospheric correction and NDVI index (sen2cor, SNAP) In Colour Manipulation panel switch to Table view and set red, yellow and green colors in Colour column. Go to Sliders view and adjust histogram to improve clarity of the data. 33

34 Exercise 2 Sentinel-2 atmospheric correction and NDVI index (sen2cor, SNAP) In menu Window select Tile Horizontally. In Navigation tab make sure that both synchronize views and cursor positions buttons are selected. 34
 Use on-screen navigation buttons to inspect the")
35 Exercise 2 Sentinel-2 atmospheric correction and NDVI index (sen2cor, SNAP) Use on-screen navigation buttons to inspect the data. 35
36 Thank you for your attention. Karol Paradowski Senior Specialist Institute of Geodesy and Cartography Modzelewskiego 27 Street Warsaw Poland 36
Hands on practices on products and applications.
 Hands on practices on products and applications. Karol Paradowski Senior Specialist Institute of Geodesy and Cartography Modzelewskiego 27 Street 02-679 Warsaw Poland karol.paradowski@igik.edu.pl www.igik.edu.pl
URBAN FOOTPRINT MAPPING WITH SENTINEL-1 DATA
 URBAN FOOTPRINT MAPPING WITH SENTINEL-1 DATA Data: Sentinel-1A IW SLC 1SSV: S1A_IW_SLC 1SSV_20160102T005143_20160102T005208_009308_00D72A_849D S1A_IW_SLC 1SSV_20160126T005142_20160126T005207_009658_00E14A_49C0
SENTINEL-2 PROCESSING IN SNAP
 SENTINEL-2 PROCESSING IN SNAP EXERCISE 1 (exploring S2 data) Data: Sentinel-2A Level 1C: S2A_MSIL1C_20170316T094021_N0204_R036_T33SVB_20170316T094506.SAFE 1. Open file 1.1. File / Open Product 1.2. Browse
FLOOD MONITORING WITH SENTINEL-1 USING S-1 TOOLBOX - JANUARY 2015, MALAWI
 TRAINING KIT HAZA01 FLOOD MONITORING WITH SENTINEL-1 USING S-1 TOOLBOX - JANUARY 2015, MALAWI Table of Contents 1 Introduction to RUS... 2 2 Training... 2 2.1 Data used... 2 2.2 Software in RUS environment...
NEST (Next ESA SAR Toolbox) 2C release demonstration
 2C release demonstration") NEST (Next ESA SAR Toolbox) 2C release demonstration Andrea Minchella 1 July 2009 D3l1b CONTENTS - Brief introduction to the NEST project - Basic concepts 1. How accessing data: Product readers, Open Raster
NEST (Next ESA SAR Toolbox) 2C release demonstration Andrea Minchella 1 July 2009 D3l1b CONTENTS - Brief introduction to the NEST project - Basic concepts 1. How accessing data: Product readers, Open Raster
CROP MAPPING WITH SENTINEL-2 JULY 2017, SPAIN
 _p TRAINING KIT LAND01 CROP MAPPING WITH SENTINEL-2 JULY 2017, SPAIN Table of Contents 1 Introduction to RUS... 3 2 Crop mapping background... 3 3 Training... 3 3.1 Data used... 3 3.2 Software in RUS environment...
Ice surface velocities using SAR
 Ice surface velocities using SAR Thomas Schellenberger, PhD ESA Cryosphere Remote Sensing Training Course 2018 UNIS Longyearbyen, Svalbard 12 th June 2018 thomas.schellenberger@geo.uio.no Outline Data
Automating a Radiometric Terrain Correction Process Chain Using a Sentinel-1 Toolbox Graph
 Making remote-sensing data accessible since 1991 Automating a Radiometric Terrain Correction Process Chain Using a Sentinel-1 Toolbox Graph Source: ASF Staff In this document you will find: A. Background
Generate Glacier Velocity Maps with the Sentinel-1 Toolbox
 Making remote-sensing data accessible since 1991 Generate Glacier Velocity Maps with the Sentinel-1 Toolbox Adapted from the European Space Agency s STEP community platform In this document you will find:
Sema Foundation ICT Department. Lesson - 18
 Lesson - 18 1 Manipulating Windows We can work with several programs at a time in Windows. To make working with several programs at once very easy, we can change the size of the windows by: maximize minimize
URBAN CLASSIFICATION WITH SENTINEL-1 Case Study: Germany, 2018
 _p TRAINING KIT LAND06 URBAN CLASSIFICATION WITH SENTINEL-1 Case Study: Germany, 2018 Research and User Support for Sentinel Core Products The RUS Service is funded by the European Commission, managed
OIL SPILL MAPPING WITH SENTINEL-1 AUGUST 2017, KUWAIT
 _p TRAINING KIT OCEA03 OIL SPILL MAPPING WITH SENTINEL-1 AUGUST 2017, KUWAIT Table of Contents 1 Introduction to RUS... 3 2 Oil spill mapping background... 3 3 Training... 3 3.1 Data used... 3 3.2 Software
Sentinel-1 Toolbox. Offset Tracking Tutorial Issued August Jun Lu Luis Veci
 Sentinel-1 Toolbox Offset Tracking Tutorial Issued August 2016 Jun Lu Luis Veci Copyright 2016 Array Systems Computing Inc. http://www.array.ca/ http://step.esa.int Offset Tracking Tutorial The goal of
Generating a Radiometrically Terrain Corrected (RTC) Image using the Sentinel Toolbox
 Image using the Sentinel Toolbox") Making remote-sensing data accessible since 1991 Generating a Radiometrically Terrain Corrected (RTC) Image using the Sentinel Toolbox This data recipe is for users who wish to generate an RTC image from
Making remote-sensing data accessible since 1991 Generating a Radiometrically Terrain Corrected (RTC) Image using the Sentinel Toolbox This data recipe is for users who wish to generate an RTC image from
Introduction to SAGA GIS
 GIS Tutorial ID: IGET_RS_001 This tutorial has been developed by BVIEER as part of the IGET web portal intended to provide easy access to geospatial education. This tutorial is released under the Creative
button in the lower-left corner of the panel if you have further questions throughout this tutorial.
 Mosaic Tutorial: Simple Workflow This tutorial demonstrates how to use the Seamless Mosaic tool to mosaic six overlapping digital aerial scenes. You will learn about displaying footprints and image data
SHIP DETECTION WITH SENTINEL-1 USING SNAP S-1 TOOLBOX - GULF OF TRIESTE, ITALY
 TRAINING KIT - OCEA01 SHIP DETECTION WITH SENTINEL-1 USING SNAP S-1 TOOLBOX - GULF OF TRIESTE, ITALY Table of Contents 1 Introduction... 3 2 Training... 3 2.1 Data used... 3 2.2 Software in RUS environment...
LAND SUBSIDENCE WITH SENTINEL-1 using SNAP
 _p TRAINING KIT HAZA03 LAND SUBSIDENCE WITH SENTINEL-1 using SNAP Table of Contents 1 Introduction... 2 2 Training... 2 2.1 Data used... 2 2.2 Software in RUS environment... 2 3 Step by step... 3 3.1 Data
ALOS PALSAR. Orthorectification Tutorial Issued March 2015 Updated August Luis Veci
 ALOS PALSAR Orthorectification Tutorial Issued March 2015 Updated August 2016 Luis Veci Copyright 2015 Array Systems Computing Inc. http://www.array.ca/ http://step.esa.int ALOS PALSAR Orthorectification
Sentinel-1 Toolbox. Interferometry Tutorial Issued March 2015 Updated August Luis Veci
 Sentinel-1 Toolbox Interferometry Tutorial Issued March 2015 Updated August 2016 Luis Veci Copyright 2015 Array Systems Computing Inc. http://www.array.ca/ http://step.esa.int Interferometry Tutorial The
Creating a T-Spline using a Reference Image
 1 / 17 Goals Learn how to create a T-Spline using a Reference Image. 1. Insert an image into the workspace using Attach Canvas. 2. Use Calibrate to set the proper scale for the reference image. 3. Invoke
DEFORESTATION MONITORING WITH SENTINEL-1 Case Study: Paraguay, 2018
 _p TRAINING KIT LAND07 DEFORESTATION MONITORING WITH SENTINEL-1 Case Study: Paraguay, 2018 Research and User Support for Sentinel Core Products The RUS Service is funded by the European Commission, managed
SNAP-Sentinel-1 in a Nutshell
 SNAP-Sentinel-1 in a Nutshell Dr. Andrea Minchella 21-22/01/2016 ESA SNAP-Sentinel-1 Training Course Satellite Applications Catapult - Electron Building, Harwell, Oxfordshire What is SNAP? Credit: SNAP
Interferometry Tutorial with RADARSAT-2 Issued March 2014 Last Update November 2017
 Sentinel-1 Toolbox with RADARSAT-2 Issued March 2014 Last Update November 2017 Luis Veci Copyright 2015 Array Systems Computing Inc. http://www.array.ca/ http://step.esa.int with RADARSAT-2 The goal of
By Colin Childs, ESRI Education Services. Catalog
 s resolve many traditional raster management issues By Colin Childs, ESRI Education Services Source images ArcGIS 10 introduces Catalog Mosaicked images Sources, mosaic methods, and functions are used
CS-Studio Display Builder
 CS-Studio Display Builder Tutorial presented: Spring 2017 EPICS Collaboration Meeting at KURRI, Osaka, Japan Megan Grodowitz, Kay Kasemir (kasemir@ornl.gov) Overview Display Builder replaces OPI Builder
Terrain Analysis. Using QGIS and SAGA
 Terrain Analysis Using QGIS and SAGA Tutorial ID: IGET_RS_010 This tutorial has been developed by BVIEER as part of the IGET web portal intended to provide easy access to geospatial education. This tutorial
Report Generator for DPOPWR
 Online Help Report Generator for DPOPWR Adapted from the Report Generator for DPOPWR Online Help www.tektronix.com Copyright Tektroni x. All rights reserved. Licensed software products are owned by Tektronix
Import and preprocessing of raw spectrum data
 BioNumerics Tutorial: Import and preprocessing of raw spectrum data 1 Aim Comprehensive tools for the import of spectrum data, both raw spectrum data as processed spectrum data are incorporated into BioNumerics.
Training - ADONIS Modeller
 Training - ADONIS Modeller ADONIS NP Business Process Management BOC Asset Management GmbH Operngasse 20b 1040 Vienna Website: www.boc-group.com Table of Contents 1 Introduction to the Tool 2 Documentation
Crop Counting and Metrics Tutorial
 Crop Counting and Metrics Tutorial The ENVI Crop Science platform contains remote sensing analytic tools for precision agriculture and agronomy. In this tutorial you will go through a typical workflow
Files Used in this Tutorial
 RPC Orthorectification Tutorial In this tutorial, you will use ground control points (GCPs), an orthorectified reference image, and a digital elevation model (DEM) to orthorectify an OrbView-3 scene that
Importing and processing a DGGE gel image
 BioNumerics Tutorial: Importing and processing a DGGE gel image 1 Aim Comprehensive tools for the processing of electrophoresis fingerprints, both from slab gels and capillary sequencers are incorporated
ENGL 323: Writing for New Media Repurposing Content for the Web Part Two
 ENGL 323: Writing for New Media Repurposing Content for the Web Part Two Dr. Michael Little michaellittle@kings.edu Hafey-Marian 418 x5917 Using Color to Establish Visual Hierarchies Color is useful in
Objectives Learn how free online map data can quickly and easily be used to dynamically update background maps and aerial photography in GMS.
 v. 10.1 GMS 10.1 Tutorial Using free, dynamic, online map data in GMS Objectives Learn how free online map data can quickly and easily be used to dynamically update background maps and aerial photography
Files Used in this Tutorial
 RPC Orthorectification Tutorial In this tutorial, you will use ground control points (GCPs), an orthorectified reference image, and a digital elevation model (DEM) to orthorectify an OrbView-3 scene that
Quick Guide for Photoshop CC Basics April 2016 Training:
 Photoshop CC Basics Creating a New File 1. Click File > New 2. Keep Default Photoshop Size selected in the Preset drop-down list. 3. Click OK. Showing Rulers 1. On the Menu bar, click View. 2. Click Rulers.
SENTINEL-1 Toolbox. SAR Basics Tutorial Issued March 2015 Updated August Luis Veci
 SENTINEL-1 Toolbox SAR Basics Tutorial Issued March 2015 Updated August 2016 Luis Veci Copyright 2015 Array Systems Computing Inc. http://www.array.ca/ http://step.esa.int SAR Basics Tutorial The goal
Unit 21 - Creating a Navigation Bar in Macromedia Fireworks
 Unit 21 - Creating a Navigation Bar in Macromedia Fireworks Items needed to complete the Navigation Bar: Unit 21 - House Style Unit 21 - Graphics Sketch Diagrams Document ------------------------------------------------------------------------------------------------
PurVIEW. for ESRI ArcGIS 9 AT A GLANCE. PurVIEW Toolbar. Stereoscopic image model display with geodatabase objects superimposed.
 PurVIEW Toolbar AT A GLANCE Stereoscopic image model display with geodatabase objects superimposed. Real-time XYZ coordinate 2 Installing the software Prerequisites: Must have the English version of Windows
Files Used in this Tutorial
 Generate Point Clouds and DSM Tutorial This tutorial shows how to generate point clouds and a digital surface model (DSM) from IKONOS satellite stereo imagery. You will view the resulting point clouds
NEST 4C-1.1: an ESA toolbox for scientific exploitation of SAR data
 NEST 4C-1.1: an ESA toolbox for scientific exploitation of SAR data Andrea Minchella RSAC c/o European Space Agency ESRIN EO Science, Applications and New Technologies Department Exploitation & Services
Import, view, edit, convert, and digitize triangulated irregular networks
 v. 10.1 WMS 10.1 Tutorial Import, view, edit, convert, and digitize triangulated irregular networks Objectives Import survey data in an XYZ format. Digitize elevation points using contour imagery. Edit
Volocity ver (2013) Standard Operation Protocol
 Standard Operation Protocol") Faculty Core Facility Volocity 6.3.0 (2013) SOP A-1 Volocity ver. 6.3.0 (2013) Standard Operation Protocol Faculty Core Facility Volocity 6.3.0 (2013) SOP A-2 A. Content Overview. 3 Start up. 3 Change
Faculty Core Facility Volocity 6.3.0 (2013) SOP A-1 Volocity ver. 6.3.0 (2013) Standard Operation Protocol Faculty Core Facility Volocity 6.3.0 (2013) SOP A-2 A. Content Overview. 3 Start up. 3 Change
Solo 4.6 Release Notes
 June9, 2017 (Updated to include Solo 4.6.4 changes) Solo 4.6 Release Notes This release contains a number of new features, as well as enhancements to the user interface and overall performance. Together
SHIP DETECTION IN SENTINEL-1 OCTOBER 2016, GULF OF TRIESTE
 TRAINING KIT SHIP DETECTION IN SENTINEL-1 OCTOBER 2016, GULF OF TRIESTE Table of Contents 1 Introduction... 2 2 Barcolana Regatta - Gulf Of Trieste, 9 October 2016... 2 3 Training... 3 3.1 Data used...
How to...create a Video VBOX Gauge in Inkscape. So you want to create your own gauge? How about a transparent background for those text elements?
 BASIC GAUGE CREATION The Video VBox setup software is capable of using many different image formats for gauge backgrounds, static images, or logos, including Bitmaps, JPEGs, or PNG s. When the software
Education and Training CUFMEM14A. Exercise 2. Create, Manipulate and Incorporate 2D Graphics
 Education and Training CUFMEM14A Exercise 2 Create, Manipulate and Incorporate 2D Graphics Menu Exercise 2 Exercise 2a: Scarecrow Exercise - Painting and Drawing Tools... 3 Exercise 2b: Scarecrow Exercise
Getting Started. The main tasks described in this section are the following:
 Getting Started Getting Started Before getting into the detailed instructions for using Interactive Drafting workbench, the following tutorial aims at giving you a feel of what you can do with the product.
ENGL 323: Writing for New Media Building a Blog Reader Using Links, Tables, Images, and Frames
 ENGL 323: Writing for New Media Building a Blog Reader Using Links, Tables, Images, and Frames Dr. Michael Little michaellittle@kings.edu Hafey-Marian 418 x5917 Office hours: MW 11-12, 1-2, F 11-12; TTh
REMEMBER TO BRING YOUR MEMORY STICK TO EVERY LAB!
 CS 1033 Multimedia and Communications Lab 07: Introduction to Animation using Photoshop REMEMBER TO BRING YOUR MEMORY STICK TO EVERY LAB! LAB #7 - Exercise 1 Objectives: Upon completion of Exercise 1 you
DDX-R Quick Start Guide
 DDX-R Quick Start Guide Imaging Support 1-855-726-9995 www.scilvet.com Contents USING DDX-R... 2 Opening a Patient File... 2 Opening a New Patient File... 3 Screen Layout... 3 ACQUIRING IMAGES ON A PATIENT...
GGR 375 QGIS Tutorial
 GGR 375 QGIS Tutorial With text taken from: Sherman, Gary E. Shuffling Quantum GIS into the Open Source GIS Stack. Free and Open Source Software for Geospatial (FOSS4G) Conference. 2007. Available online
Create Sponsor Scroll
 Appendix B Create Sponsor Scroll TABLE OF CONTENTS... 1 CREATE, ANIMATE AND UPLOAD SPONSOR LOGOS Create... 2 Animate... 5 Upload... 6 Please note, this process requires two different programs, which should
Mapping 2001 Census Data Using ArcView 3.3
 Mapping 2001 Census Data Using ArcView 3.3 These procedures outline: 1. Mapping a theme (making a map) 2. Preparing the layout for printing and exporting the map into various file formats. In order to
Working with PDF s. To open a recent file on the Start screen, double click on the file name.
 Working with PDF s Acrobat DC Start Screen (Home Tab) When Acrobat opens, the Acrobat Start screen (Home Tab) populates displaying a list of recently opened files. The search feature on the top of the
Imagine. Create. Discover. User Manual. TopLine Results Corporation
 Imagine. Create. Discover. User Manual TopLine Results Corporation 2008-2009 Created: Tuesday, March 17, 2009 Table of Contents 1 Welcome 1 Features 2 2 Installation 4 System Requirements 5 Obtaining Installation
Classification of vegetation types with Sentinel-1 radar data C
 Classification of vegetation types with Sentinel-1 radar data C Pierre-Louis FRISON (UPEM / IGN) Cédric Lardeux (ONFI) pierre-louis.frison@u-pem.fr cedric.lardeux@onfinternational.com This document is
New! Analysis Ready Data Tools Add-on package for image preprocessing for multi-temporal analysis. Example of satellite imagery time series of Canada
 Highlights New! Analysis Ready Data Tools Add-on package for image preprocessing for multi-temporal analysis Rigorous scientific preprocessing Example of satellite imagery time series of Canada A new industry
CHAPTER 5 DIGITAL ELEVATION MODEL AND 3D VISUALIZATION
 CHAPTER 5 DIGITAL ELEVATION MODEL AND 3D VISUALIZATION A digital elevation model (DEM) is a digital model or 3D representation of a terrain's surface. A DEM can be represented as a raster (a grid of squares,
EXERCISE 2: GETTING STARTED WITH FUSION
 Document Updated: May, 2010 Fusion v2.8 Introduction In this exercise, you ll be using the fully-prepared example data to explore the basics of FUSION. Prerequisites Successful completion of Exercise 1
GIMP WEB 2.0 BUTTONS
 GIMP WEB 2.0 BUTTONS Web 2.0 Navigation: Web 2.0 Button with Navigation Arrow GIMP is all about IT (Images and Text) WEB 2.0 NAVIGATION: BUTTONS_WITH_NAVIGATION_ARROW This button navigation will be designed
Server Usage & Third-Party Viewers
 Server Usage & Third-Party Viewers October 2016 HiPER LOOK Version 1.4.16.0 Copyright 2015 PIXIA Corp. All Rights Reserved. Table of Contents HiPER LOOK Server Introduction... 2 Google Earth... 2 Installation...2
SNAP-Sentinel-1 in a Nutshell
 SNAP-Sentinel-1 in a Nutshell Dr. Andrea Minchella 1 st ESA Advanced Training Course on Remote Sensing of the Cryosphere 13 September 2016, University of Leeds, Leeds, UK What is SNAP? Credit: SNAP The
Getting Started with Python and the PyCharm IDE
 New York University School of Continuing and Professional Studies Division of Programs in Information Technology Getting Started with Python and the PyCharm IDE Please note that if you already know how
Marten - Hello World Example
 Marten - Hello World Example This document will give you a quick introduction to the Marten integrated software development environment (IDE) by showing you how to create an application that displays the
HTML Exercise 21 Making Simple Rectangular Buttons
 HTML Exercise 21 Making Simple Rectangular Buttons Buttons are extremely popular and found on virtually all Web sites with multiple pages. Buttons are graphical elements that help visitors move through
Geomatica Modeler. User Guide. Version 10.1
 User Guide Version 10.1 2007 Enterprises Inc.. All rights reserved. COPYRIGHT NOTICE Software copyrighted by, 50 West Wilmot St., Suite 200, Richmond Hill, ON CANADA L4B 1M5 Telephone number: (905) 764-0614
GIMP WEB 2.0 ICONS. GIMP is all about IT (Images and Text) OPEN GIMP
 OPEN GIMP") GIMP WEB 2.0 ICONS or WEB 2.0 ICONS: MEMO Web 2.0 Icons: Memo GIMP is all about IT (Images and Text) OPEN GIMP Step 1: To begin a new GIMP project, from the Menu Bar, select File New. At the Create a New
GIMP WEB 2.0 ICONS or WEB 2.0 ICONS: MEMO Web 2.0 Icons: Memo GIMP is all about IT (Images and Text) OPEN GIMP Step 1: To begin a new GIMP project, from the Menu Bar, select File New. At the Create a New
CODE-DE.org Copernicus Data and Exploitation Platform Deutsch. CODE-DE Processing Integration Workshop. 25. & 26. June 2018 DLR Oberpfaffenhofen
 CODE-DE.org Copernicus Data and Exploitation Platform Deutsch CODE-DE Processing Integration Workshop 25. & 26. June 2018 DLR Oberpfaffenhofen DLR.de Folie 3 Outline Purpose of the CODE-DE processing portal
GLACIER VELOCITY WITH SENTINEL-1 USING SNAP S-1 TOOLBOX PETERMAN GLACIER, GREENLAND
 TRAINING KIT CRYO02 GLACIER VELOCITY WITH SENTINEL-1 USING SNAP S-1 TOOLBOX PETERMAN GLACIER, GREENLAND Research and User Support for Sentinel Core Products The RUS Service is funded by the European Commission,
How to prepare your files for competition using
 How to prepare your files for competition using Many thanks to Margaret Carter Baumgartner for the use of her portrait painting in this demonstration. 2016 Christine Ivers Before you do anything! MAKE
hdalbum User Designer Guide Collect Create Share Designer V 1.2
 hdalbum User Designer Guide 2017 Collect Create Share Designer V 1.2 Table of Contents Contents Welcome to the hdalbum Designer... 2 Features... 2 System Requirements... 3 Supported File Types... 3 Installing
Quick & Simple Imaging. User Guide
 Quick & Simple Imaging User Guide The Quick & Simple Imaging software package provides the user with a quick and simple way to search and find their documents, then view, print, add notes, or even e- mail
ME30_Lab1_18JUL18. August 29, ME 30 Lab 1 - Introduction to Anaconda, JupyterLab, and Python
 ME30_Lab1_18JUL18 August 29, 2018 1 ME 30 Lab 1 - Introduction to Anaconda, JupyterLab, and Python ME 30 ReDev Team 2018-07-18 Description and Summary: This lab introduces Anaconda, JupyterLab, and Python.
Norwegian Polar Institute, February 2018 Project website: quantarctica.npolar.no
 Get started with Quantarctica 3 Norwegian Polar Institute, February 2018 Project website: quantarctica.npolar.no Quantarctica is the result of an initiative by the Norwegian Polar Institute (NPI) to develop
Import / Object modes: 5 Layers for organising your scene are available at the top of the screen.
 LUMION 1 VS LUMION 2 SCENES - In Lumion 2, the sky, clouds, fog, material settings, ambient shadows and reflections have been overhauled, so don't expect your Lumion 1 scenes to look identical when you
Getting Started with GIS using ArcGIS 10.6 What is GIS? and - Module 1 Creating a map document
 Getting Started with GIS using ArcGIS 10.6 What is GIS? and - Module 1 Creating a map document Marcel Fortin Map & Data Library mdl@library.utoronto.ca 2018 http://mdl.library.utoronto.ca This workshop
Report Generator Advanced Template. Chemwatch REPORT GENERATOR ADVANCED TEMPLATE
 V1 Report Generator Advanced Template Chemwatch REPORT GENERATOR ADVANCED TEMPLATE RELEASE UPDATE MAY 2018 Table of Contents Overview... 3 Formatted Advanced Template... 4 What Are These Reports?... 5
Generations Monograms + Monogramming Masterpieces By Bernadette Griffith Generations Software
 Creating monograms in Generations Monograms+ is a snap. Just select one of the build in monogram templates, a True Type Font lettering style and one of the decorative borders and frames included in the
Lesson 6 Adding Graphics
 Lesson 6 Adding Graphics Inserting Graphics Images Graphics files (pictures, drawings, and other images) can be inserted into documents, or into frames within documents. They can either be embedded or
Elixir Repertoire Designer
 Aggregation and Transformation Intelligence on Demand Activation and Integration Navigation and Visualization Presentation and Delivery Activation and Automation Elixir Repertoire Designer Tutorial Guide
CoSign Quick Guide Virtual Signing with CoSign
 CoSign Quick Guide Virtual Signing with CoSign Table of Contents Launching OmniSign 1 Launching OmniSign with a PDF file 1 Launching OmniSign with a non-pdf file 1 Getting Started with OmniSign 2 Creating
Map Preparation. Using QGIS
 Map Preparation Using QGIS Tutorial ID: IGET_GIS_006 This tutorial has been developed by BVIEER as part of the IGET web portal intended to provide easy access to geospatial education. This tutorial is
OPERATION MANUAL. MV-410HS Layout Editor. Version higher. Command
 OPERATION MANUAL MV-410HS Layout Editor Version 3.0 - higher Command Command Table of Contents 1. Setup... 1 1-1. Overview... 1 1-2. System Requirements... 1 1-3. Operation Flow... 1 1-4. Installing MV-410HS
If the workshop is being performed on a laptop provided by Nordcad there is no need to install the workshop files.
 3D PCB workshop This workshop walks through some of the 3D features that are built into all OrCAD/Allegro PCB Design solutions. No extra software or options are required. Table of Contents 3D PCB workshop...
De novo genome assembly
 BioNumerics Tutorial: De novo genome assembly 1 Aims This tutorial describes a de novo assembly of a Staphylococcus aureus genome, using single-end and pairedend reads generated by an Illumina R Genome
Airis User Guide. Version 3.3
 Airis User Guide Version 3.3 Contents 1 Introduction... 2 2 Using Airis... 2 2.1 Creating a Client... 2 2.2 Creating a Process... 6 2.3 Process Analysis... 7 2.3.1 Process Efficiency... 7 2.3.2 Adding
Mosaic Tutorial: Advanced Workflow
 Mosaic Tutorial: Advanced Workflow This tutorial demonstrates how to mosaic two scenes with different color variations. You will learn how to: Reorder the display of the input scenes Achieve a consistent
Unit 21 - Creating a Button in Macromedia Flash (simplified)
") Unit 21 - Creating a Button in Macromedia Flash (simplified) Items needed to complete the Navigation Bar: Unit 21 - House Style Unit 21 - Graphics Sketch Diagrams Document ------------------------------------------------------------------------------------------------
Unit 21 - Creating a Button in Macromedia Flash (simplified) Items needed to complete the Navigation Bar: Unit 21 - House Style Unit 21 - Graphics Sketch Diagrams Document ------------------------------------------------------------------------------------------------
CS Multimedia and Communications REMEMBER TO BRING YOUR MEMORY STICK TO EVERY LAB! Lab 02: Introduction to Photoshop Part 1
 CS 1033 Multimedia and Communications REMEMBER TO BRING YOUR MEMORY STICK TO EVERY LAB! Lab 02: Introduction to Photoshop Part 1 Upon completion of this lab, you should be able to: Open, create new, save
Objectives Learn how free online map data can quickly and easily be used to dynamically update background maps and aerial photography in GMS.
 v. 10.4 GMS 10.4 Tutorial Using free, dynamic, online map data in GMS Objectives Learn how free online map data can quickly and easily be used to dynamically update background maps and aerial photography
IDERA ER/Studio Software Architect Evaluation Guide. Version 16.5/2016+ Published February 2017
 IDERA ER/Studio Software Architect Evaluation Guide Version 16.5/2016+ Published February 2017 2017 IDERA, Inc. All rights reserved. IDERA and the IDERA logo are trademarks or registered trademarks of
Zeiss Efficient Navigation (ZEN) Blue Edition Standard Operation Protocol
 Blue Edition Standard Operation Protocol") Faculty Core Facility ZEN BLUE 2.3 SOP A-1 Zeiss Efficient Navigation (ZEN) Blue Edition Standard Operation Protocol Faculty Core Facility ZEN BLUE 2.3 SOP A-2 A. Content Overview. 3 Start up. 4 Display
Faculty Core Facility ZEN BLUE 2.3 SOP A-1 Zeiss Efficient Navigation (ZEN) Blue Edition Standard Operation Protocol Faculty Core Facility ZEN BLUE 2.3 SOP A-2 A. Content Overview. 3 Start up. 4 Display
Making Backgrounds With Paint Shop Pro
 Making Backgrounds With Paint Shop Pro A good Web site deserves a good background. Whether you decide on a single color, a faded repeated logo, a textured tile, or a border, the background of your Web
Objectives Learn how free online map data can quickly and easily be used to dynamically update background maps and aerial photography in GMS.
 v. 10.3 GMS 10.3 Tutorial Using free, dynamic, online map data in GMS Objectives Learn how free online map data can quickly and easily be used to dynamically update background maps and aerial photography
In this lesson you will learn how to:
 LESSON 5: CREATING BUTTON STATES OBJECTIVES In this lesson you will learn how to: use FreeHand layers to create navigation buttons export layers from FreeHand to Flash create and edit symbols and instances
OS OpenData masterclass 2013 Cartographic Design workshop
 OS OpenData masterclass 2013 Cartographic Design workshop 1 Quantum GIS Quantum GIS (QGIS) is a user-friendly Open Source Geographic Information System (GIS,) licensed under the GNU General Public License.
A Practical Guide to Using QGIS
 A Practical Guide to Using QGIS 1.1 INTRODUCTION Quantum GIS (QGIS) is a useful mapping software that enables the compilation and displaying of spatial data in the form of a map. Gaining experience in
SENTINEL-2 SEN2COR: L2A PROCESSOR FOR USERS
 SENTINEL-2 SEN2COR: L2A PROCESSOR FOR USERS Jérôme Louis (1), Vincent Debaecker (1), Bringfried Pflug (2), Magdalena Main-Knorn (2), Jakub Bieniarz (2), Uwe Mueller-Wilm (3), Enrico Cadau (4), Ferran Gascon