Special Eurobarometer 438. Report. E-Communications and the Digital Single Market
|
|
|
- Angel Harper
- 5 years ago
- Views:
Transcription


1 E-Communications and the Digital Single Market Survey requested by the European Commission, Directorate-General for Communications Networks, Content & Technology and co-ordinated by the Directorate-General for Communication This document does not represent the point of view of the European Commission. The interpretations and opinions contained in it are solely those of the authors. Fieldwork Publication May 2016 Wave TNS opinion & social
2 E-Communications and the Digital Single Market Survey conducted by TNS political & social at the request of the European Commission, Directorate General for Communications Networks, Content & Technology Survey co-ordinated by the European Commission, Directorate-General for Communication (DG COMM Strategy, Corporate Communication Actions and Eurobarometer Unit)
3 Project title - E-Communications and the Digital Single Market Linguistic version EN Catalogue number KK EN-N ISBN doi: / European Union,
4 TABLE OF CONTENTS INTRODUCTION 3 I. SNAPSHOTS AND MAIN FINDINGS 6 II. USE OF COMMUNICATION SERVICES 11 1 Experience of using different communication services 11 2 Most important communication services 22 3 Use of paid services over the Internet 33 III. TELEPHONE ACCESS 38 1 Overall telephone access 38 2 Fixed telephony 41 3 Mobile telephony 45 a. Access to mobile telephone 45 b. Household with only mobile telephone access 47 IV. INTERNET ACCESS 50 1 Internet access in households 50 2 Mobile Internet access in households 55 V. TELEVISION ACCESS 61 1 Overall access to television 61 2 Means of reception 61 VI. SERVICE PACKAGES 68 1 Overall penetration of service packages 68 VII. PURCHASING AND SWITCHING SERVICES 76 1 Factors when subscribing to an Internet connection 76 2 Ease of price comparisons of bundled offers 83 3 Switching bundle provider 85 VIII. CONSUMER PROTECTION AND COMMUNICATION SERVICES 95 1 Consumer protection when using digital services 95 2 Keeping telephone numbers and addresses when switching provider 98 3 Ease of controlling and monitoring communication services 101 IX. COMMUNICATION SERVICE CONTRACTS Experience of signing a contract in the last three years Experience of reading the terms and conditions The quality of the information Longer Internet contract in exchange for much higher speed and enhanced quality 116 1
5 X. KNOWLEDGE OF THE EUROPEAN EMERGENCY NUMBER Calling the emergency number in one s own country Calling the emergency number anywhere in the EU 123 ANNEXES Technical specifications Questionnaire Tables 2
6 INTRODUCTION The digital communications landscape in Europe continues to evolve at a rapid pace, driven by ongoing technological change and market developments. In order to monitor market trends and new usages, The European Commission's Directorate General for Communications Networks, Content & Technology regularly conducts opinion surveys on the topic of electronic communications. These surveys also provide an assessment of how EU citizens and households derive benefits from their competitive and innovative digital environment. The Commission recognises the opportunities offered by digital technologies, and particularly those in the communications sphere. A single connected digital market across Europe could deliver more than 415 billion per year to the EU economy, creating jobs and new sources of employment, as well as boosting growth, competition, investment and innovation. A single digital market could also create opportunities for innovative start-ups, and allow existing companies to grow and profit within a market of over 500 million people. Working to deliver a Digital Single Market (DSM) is a key objective for the Commission 1. In order for citizens, businesses and public administrations to take advantage of all the opportunities offered by a digital single market, Europe must have well-functioning markets that deliver access to secure and reliable high performance fixed and wireless broadband infrastructures. To facilitate this, in 2016 the Commission will adopt legislative proposals for the review of the regulatory framework for electronic communications, in order to ensure that EU rules are fit for purpose in a fast evolving technological and market environment. This Eurobarometer helps the Commission to better understand the attitude of EU citizens towards new Internet-based communications services, and to measure the related expectations and needs for consumer protection. This year s edition of the report focusses on citizen s use of new and innovative services, such as mobile Internet, instant messaging and social media, along with traditional communications services such as fixed telephony, and the more established mobile telephony and SMS. A second theme for the current edition is contracts and consumer protection. The proportion of consumers that read telecommunications contracts, as well as their satisfaction with the information they contain will be assessed in this report. Citizens opinions about the kinds of protections newer digital communication services should attract will also be explored. Other key areas investigated in the report include: Mobile and fixed telephone access Fixed and mobile Internet access Means of access to television Penetration of communications bundles Selection criteria when choosing an Internet provider Ease of comparing bundles and ease of switching providers Awareness of the single European emergency service number 112 This survey follows on from those carried out in January , February/March , December , February/March , November/December , November/December , November/December , and December 2005/January
7 The results reported cover all 28 Member States, and where possible, comparisons are made with previous surveys. The data have been weighted on individuals over 15 years of age or EU households, depending on the nature of the question. Indicators, such as telephone and Internet access are presented at household level whereas opinion questions are based on individuals and have been made representative of the individuals over 15 years of age. This survey was carried out by the TNS Opinion & Social network in the 28 Member States of the European Union between 17 and ,822 EU citizens from different social and demographic categories were interviewed face-to-face at home in their native language on behalf of the Directorate-General for Communications Networks, Content & Technology. The methodology used is that of Eurobarometer surveys as carried out by the Directorate-General for Communication ( Strategy, Corporate Communication Actions and Eurobarometer Unit). A technical note on the manner in which the interviews were conducted by the institutes within the TNS Opinion & Social network is included in an appendix to this report. Also included are the interview methods and the confidence intervals
8 Note: In this report, countries are referred to by their official abbreviation. The abbreviations used in this report correspond to: Belgium BE Lithuania LT Bulgaria BG Luxembourg LU Czech Republic CZ Hungary HU Denmark DK Malta MT Germany DE The Netherlands NL Estonia EE Austria AT Ireland IE Poland PL Greece EL Portugal PT Spain ES Romania RO France FR Slovenia SI Croatia HR Slovakia SK Italy IT Finland FI Republic of Cyprus CY * Sweden SE Latvia LV United Kingdom UK European Union weighted average for the 28 Member States EU28 BE, IT, FR, DE, LU, NL, DK, UK, IE, PT, ES, EL, AT, SE, FI EU15 ** BG, CZ, EE, HR, CY, LT, LV, MT, HU, PL, RO, SI, SK NMS13 *** * Cyprus as a whole is one of the 28 European Union Member States. However, the acquis communautaire has been suspended in the part of the country which is not controlled by the government of the Republic of Cyprus. For practical reasons, only the interviews carried out in the part of the country controlled by the government of the Republic of Cyprus are included in the CY category and in the EU28 average. ** EU15 refers to the 15 countries forming the European Union before the enlargements of 2004 and *** The NMS13 are the 13 new Member States which joined the European Union during the 2004, 2007 and 2013 enlargements. We wish to thank the people throughout the European Union who have given their time to take part in this survey. Without their active participation, this study would not have been possible. 5

9 I. SNAPSHOTS AND MAIN FINDINGS *Question on mobile telephone access at household level (QA1.1) was not asked in survey EB79.1 ** Computing device includes desk computer, laptop, tablet, and smartphone in the current and previous survey. This item was described as "personal computer" in the previous surveys. 6
10 Mobile phone calls are the dominant communication service in Europe and mobiles are the most important service for the majority. More than nine out of ten respondents (93%) make or receive mobile phone calls, while 75% send or receive SMS. Almost seven out of ten (69%) send s, while 67% make or receive landline calls. Over half use an Internet messaging service (53%). Across the EU 62% make or receive mobile calls several times a day, and at least 60% in every Member State uses a mobile daily for calls. Making or receiving mobile phone calls, and sending and receiving SMS messages are in the top three communications activities for all age groups. There seems to be generational gap in the use of new and more established communications services. Older respondents, and in particular those aged 55+ are less likely to have embraced the use of new services such as Internet telephony and instant messaging. They are also less likely to use some of the more established services such as and even mobile telephony. This generational gap is also quite significant in the use of social networks, with an EU average of 44% for the year old respondents posting daily on social networks against 18% for year old and just 5% of those aged 55+. Even more striking is the fact that there is more difference between EU countries in the use of social networks for all ages groups than between EU countries for the group year old. This suggests that the digital single market is less fragmented among young people in the EU when it comes to the use of social networks. Mobile telephony is by far the most important communication service in respondent s daily life (74%), followed by mobile Internet (34%) and fixed telephony (32%). At least two thirds of respondents in every Member State say mobile telephony is the most important service. Moreover, Internet connections (52%) and online communication services (46%) are the most important services in the daily life of around half of Europeans. There is also a generational gap in perception of the most important services in respondents daily lives, with the youngest respondents (aged 15-24) far more likely to mention online communications services as the most important than those aged 55+ (66% vs. 26%). There is also a clear age divide on the importance given to mobile Internet: 62% of vs. only 12% of 55+. Almost one third (32%) of those with Internet access have used at least one paid service online, with music (14%) or movie and documentary services (12%) being the most common. There are significant country differences in the use of paid services, ranging from 69% of users in Sweden to 14% in Lithuania. There is a pronounced generational gap between the youngest and oldest respondents in the use of paid online music services (25% vs. 4%) and paid movie/documentary services (20% vs. 5%). Mobile Internet access continues to increase significantly. Telephone access is almost universal (98%), with 59% living in households with fixed and mobile access and 33% living in mobile only households. The proportion of mobile only households continues to increase up 15 percentage points since December 2005/January 2006 (18%). Respondents aged 29 or younger living in single person households (58%) are more likely than those aged (42%) or 60+ (23%) to only have mobile phone access. 7
11 Almost two thirds of households (65%) have fixed line telephone access. This figure masks a wide discrepancy across Member States: 93% of households in Malta have fixed line access, compared to 13% in Finland and 14% in the Czech Republic. However, no more than 10% in all Member States, except Greece (17%), only have fixed line telephone access. 93% of European households have mobile access via at least one mobile telephone, and at least 88% in every Member State has mobile access. Just over two thirds of households have internet access at home (67%), but penetration in individual Member States varies widely from 41% in Italy to 96% in the Netherlands. At the EU level, household Internet penetration has increased by 10 points since However, it is worth noting the decline of Internet access at home observed in ten Member States since This decrease relatively small in most countries can be explained partly by the overall rise of mobile Internet access. Mobile Internet access has increased significantly since the last survey up 23 points to 75% of households with mobile phone access. Overall, this means that in 69% of the EU households have at least one of its members with Internet access on their mobile. Mobile Internet access has also increased in every Member State, and the proportion of households with mobile Internet access now ranges from 91% in Denmark (up 16 points since 2014) to 64% in Greece (up 35 points). Almost all EU households have access to television (96%), with digital terrestrial television (38%), satellite (24%) and digital cable (20%) the most common means of reception - although TV access through the telephone network is growing (up 5 points since 2014 to 12%). At a country level access to digital terrestrial television ranges from 90% in Spain to 5% in Slovenia. It is important to note that in spite of the constant growth of Internet access, telephony services (fixed and mobile) remain the most important in respondents daily life: almost nine in ten Europeans (89%) consider fixed or mobile telephony the most important, in comparison with slightly over a half of Europeans (52%) who consider fixed or mobile Internet the most important. Half of all households have bundled communications services The purchase of bundled communications services continues to increase up from 38% in 2009 to 50% in the current survey. Bundles that include Internet access are most common (80%, -11 points), followed by those with fixed telephony (65%, -15 points), television channels (53%, -1 point) and mobile telephony (45%, +16 points). This sharp increase of mobile uptake in bundles is a good indicator of the fixed-mobile convergence trend in the market place. Indeed, now 25% of EU households have a bundle including a mobile phone which represents an increase of 10 points since Bundles that include two services (double play) are more common than in 2014 (+6 points to 31%), while triple play bundles are less common (down three points to 13%). Just 5% have quadruple play bundles. It is worth noting that the majority of households with Internet access (60%) have included Internet access as part of a bundle. Price remains the main factor when subscribing to an Internet connection (69%), followed by the maximum download or upload speed (48%) and the maximum amount of data that can be downloaded or uploaded (32%). Overall, cost related criteria are the most important (79%), followed by quality related criteria (70%) and service related criteria (51%). 8
12 Quality-related factors are becoming more important when subscribing to an Internet connection: the maximum download or upload speed (+7 points), and amount of data that can be downloaded or uploaded (+6 points) are now more mentioned than they were in January In 23 Member States, cost-related criteria are the most important factors when subscribing to an Internet service. In Austria, Germany, Estonia and Malta quality-related criteria are the most mentioned as the main factor. Portugal is the only country where service related criteria are the most mentioned. Almost seven out of ten (69%) agree it is easy to compare services and prices offered by their current bundle with other bundled offers. Furthermore, 57% live in households where someone has changed bundle provider at least once a 12 point increase since the previous survey in In 21 Member States, the majority have changed bundle provider at least once. Amongst those who have not changed bundle providers (41% of the household who have a bundle), 61% have never considered it, while 32% have. However, in all but one Member State the proportion that have not considered switching has declined from 2 percentage points in Germany to a decline of 35 points in Ireland. Sweden is the exception, where there has been a 17 point increase in the proportion who have not considered switching. Amongst those who have never changed bundle providers, consumers are much more likely to be inertial, than to be hindered by some external issue 10 (82% vs. 15%). However, it is worth noting that the proportion of hindered switchers has increased in a number of Member States, particularly in Cyprus (+22 percentage points) and Ireland (+18 pp). Almost half have signed a communications contract in the last three years but only 22% of them have read the terms and conditions entirely. 86% agree the same level of consumer protection that applies for traditional communication services should also apply to online communication services, with 58% in total agreement. More than two thirds in every Member State agree. It is important for consumers to be able to keep phone numbers, s or online content when switching providers: 89% say it would be important to keep their mobile number, 82% say this about their fixed line number, and 78% about their s or other online content stored by their provider. The majority say it is easy to monitor and control their use of a range of communication services: mobile telephone services (78%), fixed telephone services (71%), mobile Internet (69%) and fixed Internet (67%). Almost half have signed a communications service contract in the past three years (49%), with mobile phone contracts the most common (29%). Amongst those who have signed a contract in the past three years, 22% read the terms of the contract about user rights entirely, while 40% read these partly. At least one third of respondents in Lithuania, Latvia (both 35%), the Czech Republic, and Cyprus (both 34%) say they read the user rights terms in the contract entirely, compared to 10% in Sweden and France. 10 Households with hindered switchers are those where respondents considered switching but there are no other bundle providers in the area where they live, there are no other bundle providers which would provide good value for money, they are currently bound by a contract with their current provider, they didn t want to take the risk of a temporary loss of service during the switching process, they didn t want to take the risk of having to pay two providers during the switching process, it was not clear what steps they would need to take to switch, they did not want to lose their current address(es) or webpage(s) hosted on the provider's server, or that some services of the bundle could not be cancelled at the same time. 9
13 More than eight in ten agree the contract had sufficient and clear information about the duration and renewal or roll over conditions (84%), 83% agree there was sufficient and clear information about the quality of services subscribed to and 79% agree there was sufficient and clear information about the termination of the contract. Most of the respondents (68%) who had read their last communications contract had a high level of satisfaction with the information it contained regarding all three aspects analysed. However, this varies across Member States: from 82% in Slovakia to 49% in the Netherlands. The majority of respondents who have an Internet connection at home said they would be not be willing to sign a communications contract longer than two years in exchange for much higher speed and enhanced quality of service (55%). Nearly half of the youngest respondents who have Internet would be willing to sign a longer contract in exchange for much higher speed and enhance quality of service (46%). This compares to only 29% among those aged 55+. Awareness of the 112 emergency number continues to increase More than six in ten would call 112 in the event of an emergency in their country (61%) an increase of three points since Almost all respondents in Finland (99%), the Netherlands (98%), Portugal, and Sweden (both 97%) would call 112, compared to 6% of respondents in Greece, 9% in the UK and 19% in France. Since 2014, the proportion of respondents that would call 112 has mostly increased amongst respondents in Cyprus (+20 pp), Malta (+9 pp), Hungary and Poland (both +7 pp). On the other hand, the proportion that would call 112 in the Czech Republic and Croatia has decreased by six points. Almost half 46% correctly identify 112 as the only number to call in the event of an emergency anywhere in the EU, an increase of six points since Respondents in Poland (82%), Luxembourg (78%) and Slovakia (70%) are the most likely to only identify 112, while those in Greece (13%) and the UK (22%) are the least likely to do so. Since 2014, the proportion of respondents in Cyprus that only give 112 as their answer has increased by 20 percentage points, followed by respondents in Germany (+18 pp), Hungary (+17 pp), Portugal (+17 pp), and Estonia (+17 pp). In contrast, the proportion of respondents in Romania (-9 pp) and Bulgaria (-9 pp) that only give 112 as their answer has decreased. 10
14 II. USE OF COMMUNICATION SERVICES 1 Experience of using different communication services - Mobile calls are by far the most frequent communication activity - Respondents were asked how frequently they carried out a range of communication activities 11. More than nine out of ten respondents (93%) make or receive mobile phone calls, while 75% send or receive SMS. Almost seven out of ten (69%) send s, while 67% make or receive landline calls. Just over half use an Internet messaging service (53%), while 46% post content on social media. Making phone or video calls via Internet applications is least common, at 37%. When considering the most frequent activities, again making or receiving mobile calls is by far the most common: 62% do this several times a day, while a further 10% make or receive mobile calls once a day. More than one third (38%) send or receive SMS several times a day, while 30% use an instant messaging service more than once a day. Also it is worth noting that a higher proportion of respondents use instant messaging service a relatively newer service several times per day rather than sending s or making phone calls over a landline phone (30% vs. 27%). Just over a quarter make or receive landline calls, or send s several times a day (both 27%). Posting to social media (13%), or phone or video calls via Internet applications (7%) are less likely to happen several times a day. As this is a new question, no trend data is available. Base: All respondents (n = 27822) 11 QA4 How often do you do any of the following? Make or receive phone calls over a landline phone; Make or receive phone calls over a mobile phone; Send or receive SMS; Use an instant messaging service on the Internet; Make phone calls via Internet applications, including video calls; Send s; Post content on online social media. 11
 are the most likely to do this, followed by those in Cyprus (88%), Lithuania (86%), Estonia, Slovenia and the Czech Republic (all 85%).")
 There is much wider variation across Member States in the proportion of respondents that send or receive SMS daily - although in 18 Member States at least half of")
15 At least six out of ten respondents in every Member State make or receive mobile phone calls daily 12. Respondents in Latvia (91%) are the most likely to do this, followed by those in Cyprus (88%), Lithuania (86%), Estonia, Slovenia and the Czech Republic (all 85%). At the other end of the scale, 60% of respondents in the Netherlands and 62% in Germany make ore receive mobile phone calls daily. Base: All respondents (n = 27822) There is much wider variation across Member States in the proportion of respondents that send or receive SMS daily - although in 18 Member States at least half of all respondents do this daily. Three quarters of respondents in Ireland and Denmark send or receive SMS daily (both 75%), as do 68% in the UK and Sweden. In a stark contrast, just 6% of respondents in Spain send or receive SMS daily - in fact, 62% say they never do this. This should be seen against the higher usage of instant messaging in this country (see QA4.4 results below). Base: All respondents (n = 27822) 12 Daily usage = Several times a day + Once a day Regular usage = Several times a week + Once a week Occasional usage = Once a month + Less than monthly 12

 In most Member States fewer than four in ten use their landline daily to make or receive calls.")
16 In four Member States at least half of all respondents send s daily: the Netherlands (66%), Sweden (54%), Denmark (52%), and Belgium (50%). Furthermore, the Netherlands, Sweden and Denmark are the only countries where fewer than one in ten never send s. Respondents in Greece (12%) and Bulgaria (13%) are the least likely to send s daily in fact at least half of all respondents in these countries, as well as in Romania, never send s. Base: All respondents (n = 27822) In most Member States fewer than four in ten use their landline daily to make or receive calls. Respondents in Greece are the most likely to use their landline daily (69%), followed by 64% of those in Germany and 57% in Malta. It is worth noting that Germany is the only Member State where daily landline use is more common than daily mobile use (64% vs. 62%). At the other end of the scale, 4% of respondents in Finland, 6% in the Czech Republic and 8% in Latvia make or receive landline calls daily. Base: All respondents (n = 27822) 13

17 Spain (57%), the Netherlands and Italy (both 50%) are the only countries where at least half use instant messaging services daily. This compares to 11% in the Czech Republic and 16% in Lithuania and Greece. It is interesting to note that Spain, with the highest level of daily Internet messaging use, has the lowest level of SMS use. Furthermore 33% of respondents in Spain never send an instant message, compared to 62% that never send or receive SMS. Base: All respondents (n = 27822) 14
.")
18 An additional analysis was performed to assess whether there is a link between the daily use of SMS and the daily use of instant messages. A correlation test between these two variables shows no relation between the two dimensions (Pearson coefficient=0.12). For most countries, there is no clear link between the daily use of SMS and of instant messaging: the daily usage of instant messaging does not seem to replace the daily use of SMS. There are, however, a few exceptions. Spain, with the highest level of daily instant messaging use, has the lowest level of SMS use. More than half of respondents in Spain (57%) send and receive instant messages daily, compared to only 6% that send or receive SMS daily. Conversely, respondents in the Czech Republic and Lithuania have the lowest use of instant messaging on the Internet and relatively high level of SMS use. 15

 Respondents in Cyprus (21%), Croatia and Ireland (both 20%) are the most likely to make daily calls using Internet applications, compared to 6% in Portugal.")
19 Daily posting on social media is generally less common in all Member States 13. Respondents in Denmark are the most likely to post daily (43%), followed by those in Ireland (31%) and the UK (30%). This compares to 9% in Germany and 11% in Latvia and Slovenia. Respondents in Denmark (77%) and Sweden (66%) are the most likely to post on social media at least occasionally, although those in Sweden are far less likely to be daily users (15%). Base: All respondents (n = 27822) Respondents in Cyprus (21%), Croatia and Ireland (both 20%) are the most likely to make daily calls using Internet applications, compared to 6% in Portugal. In fact, in most Member States the majority of respondents never do this. Base: All respondents (n = 27822) 13 It is important to note that this question only measures the active usage of online social media, and does not cover passive user behaviour, such as checking messages received or posted by other users. 16
20 There are a range of interesting differences in the socio-demographic analysis, although relatively few are based on gender. Men are more likely than women to make or receive daily calls on their mobile (75% vs. 70%), or to send s daily (39% vs 32%). Women are more likely than men to say they never send s (33% vs. 27%). There are no significant differences between men and women regarding daily usage of online instant messaging (37% vs. 35%), Internet calls (12% vs. 10%), and online social media (19% vs. 19%), suggesting that these emerging communication services tend to be more gender-neutral. There are a number of age-related differences in the use of services, although broadly speaking the younger the respondent, the more likely they are to do most of these activities daily: The older the respondent, the more likely they are to make or receive daily landline calls: 46% do this compared to 23% of those aged and 27% of those aged More than eight out of ten respondents younger than 55 make or receive daily mobile phone calls. Respondents aged are the most likely to do this (89%), followed by those aged (83%) and those aged (82%) significantly higher than those aged 55+ (53%). 71% of the youngest respondents send or receive SMS daily, compared to 63% of those aged 25-39, 53% of those aged 40-54, and 23% of those aged 55+. At least half of those aged 39 or younger use instant messaging daily, with 68% of the youngest respondents making daily use of these services. This compares to 39% of year olds, and just 12% of those aged 55+. Almost one quarter of the youngest respondents make daily phone calls using Internet applications (24%), compared to just 3% of those aged 55+. Daily use is most widespread amongst those aged (50%), followed by year olds (45%) and year olds (40%). Daily use is considerably lower amongst those aged 55+. The youngest respondents are by far the most active daily active users of social media (posting on social media): 44% post daily, compared to 29% of year olds, 18% of year olds, and just 5% of those aged 55+ In addition to being the least frequent daily users of most of these services and applications, the oldest respondents are also the most likely to say they never use each of these services with the exception of making or receiving landline calls. For example, 83% never post on social media, compared to 14% of those aged These age results highlight a generational gap in the use of new and more established communications services. Older respondents, and in particular those aged 55+, are less likely to have embraced the use of new services such as Internet telephony and instant messaging. Furthermore, they are still less likely to use some of the more established services such as and even mobile telephony. 17
21 Base: All respondents (n = 27822) 18
22 A broader view of the services used by age group shows making or receiving mobile phone calls is the most common daily activity for all, even though the proportions vary by age. Also in the top three most common activities is sending or receiving SMS. For those aged 39 or younger, using an instant messaging services is the other top three daily activity, while for year olds this is sending . For those aged 55+ the top three daily activities are making or receiving mobile calls, making or receiving landline calls, and sending or receiving SMS. It is also interesting to note that the difference in the use of the top three services is less noticeable in the younger age group (68%-71%-83%) than in the group of respondents aged years (45%-53%-82%), indicating a generational gap in the uptake of new service and in the latency of old service usage (landline phone calls). Top 3 daily activities by age group Make or receive mobile phone calls (83%) Send or receive SMS (71%) Use an Instant messaging service (68%) Make or receive mobile phone calls (89%) Send or receive SMS (63%) Use an Instant messaging service (55%) Make or receive mobile phone calls (82%) Send or receive SMS (53%) Send (45%) Make or receive mobile phone calls (53%) Make or receive landline phone calls (46%) Send or receive SMS (23%) 19
23 The following two graphs show the country results for the overall use of online social media: first for all respondents surveyed, and then for respondents aged It is interesting to note that the gap in results at a country level for respondents aged is 25 points considerably lower than the gap for all respondents (43 points). This suggests a less fragmented single market amongst young people in the European Union when it comes to posting on social media. This is further illustrated by the fact that in all countries, at least three-quarters of young people (15-24) post content on social media. In contrast, when all respondents are considered, there are 18 countries where less than half post content on social media. RESPONDENTS AGED 15+ QA4.7 How often do you do any of the following? - Post content on online social media - % of "At least once" 77% 66% 60% 58% 57% 56% 55% 52% 51% 50% 48% 48% 47% 46% 46% 46% 45% 44% 43% 43% 42% 41% 40% 39% 39% 38% 37% 35% 34% DK SE NL FI UK IE AT BE IT PT LU MT HU EE EU28 HR PL CY SK ES BG LT SI FR EL LV CZ DE RO RESPONDENTS AGED QA4.7 How often do you do any of the following? - Post content on online social media - % of "At least once" 97% 96% 94% 94% 93% 93% 93% 92% 92% 91% 90% 90% 90% 89% 89% 88% 88% 87% 86% 85% 84% 83% 83% 82% 81% 77% 77% 75% 72% UK HR LT SE EE NL FI AT IT MT DK IE PT BE SI EL LU PL BG EU28 ES CY HU LV CZ RO FR SK DE 20
24 Managers and white collar workers are the most likely to send or receive SMS daily (65% and 63% respectively) and along with the self-employed are the most likely to use instant messaging daily (47%-48%). Current workers are the most likely to send daily, with managers the most likely (69%), particularly compared to manual workers (31%). Not surprisingly, daily Internet users are the most likely be daily users of instant messaging, Internet phone applications, and daily posters to social media. For instance, 28% of daily Internet users post to social media daily, compared to 5% of less frequent users. Respondents living in households with mobile phone access (either mobile only or mobile plus landline) are much more likely to do each of these activities daily with the exception of landline calls. For example, 38% in mobile only households and 39% in households with landline and mobile access use instant messaging daily, compared to 6% in landline only households. 21
25 2 Most important communication services - Mobile phones are much more important to respondents than other communication services - Respondents were asked for their most important communication service or applications in their daily life 14. The results show mobile telephony is by far the most important service: almost half of all respondents said this is the most important (46%). Fixed line telephony is the next most mentioned, but just 17% consider it the most important. One in ten (10%) say mobile Internet is the most important in their daily life. All the other services and applications were considered the most important by less than one in ten ranging from 7% for fixed line Internet, to 2% for free phone or video call services or online social media services. As this is a new question, no trend data is available. Base: All respondents (n = 27822) 14 QA5a Which of the following services and applications do you consider the most important in your daily life? Firstly? QA5b And then? Landline telephone; Mobile telephone; SMS; Instant messaging service on the Internet; Free phone or video call service; Fixed line Internet; Mobile Internet; service; Online social media service; Other (SP.); None (SP.); Don't know. 22
26 A socio-demographic analysis of the single service or application considered the most important in daily life provides a number of interesting variations. Young people are the most likely to say mobile Internet or SMS are the most important to their daily life, but they are less likely to mention mobile telephony than those aged (41% vs. 53%). Furthermore, the older the respondent, the less likely they are to say mobile Internet is the most important in their daily life: 20% of year olds say this, compared to 3% of those aged 55+. A cross tabulation of the communication services and applications used with the most important services also highlights some interesting patterns. For instance, those who make daily use of a landline phone to make or receive calls are almost equally likely to say a mobile telephony (34%) or fixed line telephony (33%) is the most important in their daily life. However, the less regularly a respondent makes or receives landline calls, the more likely they are to say a mobile phone is most important: 60% that never make or receive landline calls say a mobile telephone is the most important in their daily life. In general, respondents that never do actions that involve a mobile (send/receive SMS) or mobile or fixed line Internet (Internet calls, messaging, posting to social media or sending s) are the most likely to say fixed line telephony is the most important in their daily life. Interestingly, respondents that make daily phone calls via the Internet are more likely to nominate mobile Internet (19%) than fixed line Internet (9%) as the most important. The same pattern applies for those that use instant messaging services on the Internet daily. 23

27 Base: All respondents (n = 27822) 24
28 As well as being asked their most important service and application, respondents were able to nominate up to three more they considered important in their daily life 1. As it was the case in the previous analysis, mobile telephony is by far the most important communication service in respondents daily life (74%). Around one third say mobile Internet (34%) or fixed telephony (32%) are most important, while at least one quarter mention fixed line Internet (27%), SMS (26%), or (25%). Instant messaging (14%), online social media (11%), or free phone or video calls (9%) are least likely to be considered important. Taking a broader view, the most important communication service category 15 is fixed or mobile telephony (89%), followed by fixed or mobile Internet (52%) and other online communications services (46%) 16. Base: All respondents (n = 27822) 15 Fixed or mobile telephony = Fixed telephony + Mobile telephony + SMS Fixed or mobile Internet = Fixed line Internet + Mobile Internet Online communication services = Instant messaging service on the Internet + Free phone or video call service + service + Online social media service 16 It is important to note that the question was addressed to all respondents, regardless of their current access to the different communication services asked about. 25
29 The country level analysis shows respondents in each Member State are most likely to consider mobile telephony the most important in their daily life in fact at least two-thirds in each Member State say this. Respondents in Finland (92%), Latvia (89%), the Czech Republic (88%) and Cyprus (87%) are the most likely to say mobile telephony is most important, compared to 66% of those in Germany and 67% in the Netherlands. Respondents in Luxembourg (46%), Spain and the Netherlands (both 45%) are the most likely to say mobile Internet is the most important in their daily life, compared to 19% of those in Poland and 24% in Hungary. Overall, at least one quarter of the respondents in 26 Member States say mobile Internet is the most important in their daily life. Greece (59%) and Germany (54%) are the only Member States where at least half say their fixed line telephony is most important in their daily life, although 44% of those in Malta and 36% in France say the same. This compares to 6% in Finland and the Czech Republic. It is worth noting that Finland and the Czech Republic also have the lowest proportion of households with a fixed line telephone 17. Fixed line Internet is generally less likely to be considered most important: 39% of respondents in the Netherlands say it is important in their daily life, as do 38% of those in Belgium, Hungary and Finland. At the other end of the scale 9% of respondents in Slovakia and Cyprus say the same. There is a large variation across Member States in the proportions that consider SMS most important in their daily life. At least half of all respondents in Denmark (62%), Sweden and Luxembourg (both 51%) say this, compared to just 2% in Spain. The result for Spain is not related to the proportion of respondents with a mobile phone, which is more than 90%. There is also a large variation when it comes to . Respondents in the Netherlands (56%) and Denmark (55%) say this is most important, compared to 5% of those in Romania and 6% in Bulgaria. Overall, however, at least one in five in 19 Member States says is most important in their daily lives. At least one quarter of respondents in Spain (34%), the Netherlands (27%) and Finland (25%) say instant messaging is most important in their daily lives, compared to 3% in the Czech Republic and 4% in Romania. It is worth also mentioning that in Spain, the Netherlands and Italy a higher proportion of respondents say that instant messaging is one of the most important communication services than SMS is. Online social media is most important to those in Denmark (27%), the Netherlands, Austria and Portugal (all 19%), and least likely to be important to respondents in Slovenia (3%). Respondents in Lithuania are the most likely to say free phone of video services are most important in their daily lives (17%), followed by those in the Netherlands, Croatia and Hungary (all 14%). This compares to just 4% of respondents in Romania and Malta. Taking a broader view shows that telephony (fixed or mobile) is most important in the daily lives of respondents, with at least eight out of ten in every Member State saying this. The Internet (fixed or mobile) is most likely to be important to those in the Netherlands (71%), Sweden (67%), Finland and Luxembourg (both 66%), and least likely to be important to those in Cyprus (32%) and Slovakia (39%). Online communication services ( , phone apps, messaging) are most likely to be important to respondents in the Netherlands (79%), Denmark (75%) and Finland (73%), and least likely to be considered important by those in Romania (19%). The Netherlands is unusual amongst Member States because there is relatively little difference in the proportion of respondents that say telephony (84%), online communication services (79%) or the Internet (71%) are important. The discrepancy between the results for these three types of communication services is much wider in other Member States. 17 See section 3.2 for full details of these results. 26
30 Base: All respondents (n = 27822) 27
31 The socio-demographic analysis provides a number of interesting variations. Women are more likely than men to say fixed telephony is the most important in their daily life (35% vs. 28%), while men are more likely than women to nominate mobile Internet (37% vs. 30%) or fixed line Internet (30% vs. 24%). There are a number of interesting variations based on age. Young people are the most likely to say mobile Internet, SMS, instant messaging or online social media are the most important to their daily life. For example 29% mention online social media, compared to 17% of year olds, 10% of year olds and 3% of those aged 55+. The youngest respondents are also the least likely to mention fixed telephony (7%), and they are less likely to mention mobile telephony than those aged At least eight out of ten respondents aged say mobile telephony is most important, compared to 74% of year olds and 65% of those aged 55+. Finally, the older the respondent, the less likely they are to say mobile Internet is the most important in their daily life: 62% of year olds say this, compared to 12% of those aged 55+. Compared to households with one or two people, respondents living in households of three or more people are more likely to say mobile telephony or mobile Internet are the most important. They are also less likely than those in smaller households to mention fixed line telephony. For example, 37% of those in single person households, and 40% in 2 person households say fixed telephony is the most important, compared to 25% of respondents living in three person households and 23% of those living in households with four or more. Respondents who use the Internet are the most likely to say that mobile telephony, mobile Internet, fixed line internet, SMS, or an Internet phone/video service are most important in their daily life. For example, 78% of those that use the Internet say mobile telephony is most important, compared to 61% of respondents who never use the Internet. In addition, daily Internet users are the most likely to nominate instant messaging or online social media as most important. For instance, 20% of daily Internet users say instant messaging is most important in their daily life, compared to 9% of less regular Internet users. Finally, desktop owners are more likely than respondents owning other computing devices to say fixed telephone is most important in their daily life (32%). Smartphone owners are the most likely to say mobile Internet is most important (50%), followed by tablet owners (47%), laptop owners (45%) and desktop owners (38%). 28

32 Base: All respondents (n = 27822) 29
33 A cross tabulation of the results for this question with questions about the use of communication services highlights some interesting patterns. The less frequently a respondent uses their landline, the more likely they are to say mobile telephony, mobile Internet or SMS are important in their daily lives. For example, the less regularly a respondent makes or receives landline calls, the more likely they are to say mobile telephony is most important: 80% that never make or receive landline calls say mobile telephony is the most important in their daily life compared to 69% of daily users. The more frequently a respondent makes or receives mobile calls, the more likely they are to nominate mobile telephony as most important, and the less likely they are to nominate fixed line telephony. For example, 83% of those that make or receive mobile calls daily say mobile telephony is most important, compared to 40% that occasionally make or receive mobile calls. Just 23% of daily mobile phone users say fixed telephony is most important, compared to 67% of occasional mobile callers. The more often respondents send or receive SMS, the more likely they are to nominate mobile Internet as most important, and the less likely they are to nominate fixed telephony. For example, 45% of those that send or receive SMSs daily say mobile Internet is most important, compared to 31% that send or receive SMSs occasionally. One third of respondents that use instant messaging on a daily basis say this application is the most important in their daily lives, compared to 13% of regular and just 5% of occasional users. The more regularly a respondent uses instant messaging applications, the more likely they are to nominate mobile Internet as most important: 57% of daily users say this, compared to 31% of those that occasionally use instant messaging. Interestingly, respondents that make daily phone calls via the Internet are more likely to nominate mobile Internet (58%) than fixed line Internet (30%) as the most important. The same pattern applies for those that regularly or occasionally make Internet phone calls. In general, respondents that never do actions that involve a mobile phone (send/receive SMS) or mobile or fixed line Internet (Internet calls, messaging, posting to social media or sending s) are the most likely to say fixed telephony is the most important in their daily life. For example, 48% of respondents that never send s say fixed telephony is the most important in their daily life, compared to 30% that send mails occasionally or regularly, and 19% that send them daily. 30

34 Base: All respondents (n = 27822) 31
35 The following chart shows that most communication services and applications are seen as relatively equal in terms of importance and use in respondents daily life. Mobile telephony is the most important and most used service by a considerable margin. It is interesting to note that although SMS is considered less important than fixed telephony, it is in daily use by a higher proportion of respondents than fixed telephony. In contrast, instant messaging is one of the most used communication services, but it is considered to be less important than most other communication services. 32
36 3 Use of paid services over the Internet - Almost one third have used a paid Internet services - Respondents with home or mobile Internet connections were asked about paid services they have used 18. Overall, 32% of respondents have used at least one of these paid for Internet services, but the results also highlight the use of individual paid for online services is generally limited. Respondents are most likely to have used a paid service for music (14%), or one that gives them access to movies or documentaries (12%), but even in these cases only a little over one in ten have used these services. Even fewer have used a cloud service for storing content from their computer (8%), a paid service to access digital books or newspapers, or a paid service for watching sports events (both 7%). Just 6% have used a paid service for making phone calls over the Internet. As this is a new question, no trend data is available. Base: Respondents with Internet connection in the household (n = 23395) (MULTIPLE ANSWERS POSSIBLE) 18 QA6 Which of the following paid services that you can access via the Internet, have you used? A paid service for accessing music; A paid service for accessing movies or documentaries; A paid service for accessing digital books or newspapers; A paid service for watching sports events; A paid service for making phone calls over the Internet; A cloud service for storing content from your computer; Other (SPONTANEOUS); None (SPONTANEOUS); Don t know. 33
37 In 12 countries, respondents are most likely to say they have used a paid music service in fact in Sweden almost half say this (47%) 19. More than one quarter of respondents in the UK have also used a paid music service online (27%), as have 22% in the Netherlands. Although not the most mentioned service in Denmark, almost one third of respondents there have used a paid music service (32%). Use of paid music services is least common in Lithuania (3%), Bulgaria and Greece (both 5%). Respondents in Sweden are also the most likely to say they have used a paid service for online access to movies or documentaries (37%), followed by those in Denmark (36%), and Finland (30%). This kind of service is least likely to have been used by respondents in Lithuania, Latvia, Italy and Bulgaria (all 5%). Paid movie or documentary services are the most mentioned in 14 Member States. Once again it is respondents in Sweden that are the most likely to have used a cloud service for storing content from their computer (23%), although 19% of those in Denmark and 17% in the UK have also used this kind of service. In contrast, just 4% in Croatia, Greece, Spain and Lithuania have done so. Respondents in Sweden (20%), Denmark (16%), Malta (16%) and the UK (15%) are the most likely to have user a paid service for accessing digital books or newspapers. This compares to 2% of respondents in Lithuania and Greece. Respondents in Finland (15%), the UK (14%) and Ireland (13%) are the most likely to have used a paid service for watching sport online, while those in Cyprus (15%), Ireland and Austria (both 12%) are the most likely to have used a paid service for making phone calls online. Overall, respondents in Sweden (69%), Denmark (60%), the UK (55%) and the Netherlands (50%) are the most likely to have used at least one of these paid online services. 19 It is important to note that international access to a paid service for digital content online depends on the commercial conditions from the provider. 34
38 Base: Respondents with Internet connection in the household (n = 23395) (MULTIPLE ANSWERS POSSIBLE) 35
39 The socio-demographic analysis highlights the following: The younger the respondent, the more likely they are to have used each of these paid online services, and this trend is most pronounced for music services and those offering movies or documentaries. For example, 25% of year olds have use a paid music service, compared to 19% of those aged 25-39, 12% of year olds and just 4% of those aged 55+. Overall, almost half of those aged have used at least one of these services (47%), compared to 18% of those aged 55+. The higher a respondent s education level, the more likely they are to have used each service. This trend is most notable for music, movie/documentary, book/newspaper and cloud services. For instance, 2% of those with the lowest education level have paid to access books or newspapers online, compared to 11% of those with the highest levels. The larger the town a respondent lives in, the more likely they are to have accessed at least one paid service: 27% of those in rural villages have done so, compared to 33% in small/mid-sized towns, and 37% in large towns. Daily Internet users are the most likely to have used each of these services, particularly music (17%), movies/documentaries (15%) and cloud storage services (10%). Respondents in a household with mobile phone access are more likely to have used at least one of these services than landline only households: 34% of those in mobile only households have used at least one of these paid services, compared to 32% in households with landline and mobile access, and 18% of those in landline only households. Tablet owners are the most likely to have used at least one of these services (45%), particularly compared to desktop owners (34%). 36
 (MULTIPLE ANSWERS POSSIBLE)")
40 Base: Respondents with Internet connection in the household (n = 23395) (MULTIPLE ANSWERS POSSIBLE) 37
41 III. TELEPHONE ACCESS 1 Overall telephone access - Telephone access is almost universal Almost all respondents (98%) live in households with telephone access via at least one device (mobile or fixed line). Access is also almost universal in each Member State: Ranging from 100% in Belgium, Cyprus, Denmark, Estonia, Finland, France, Ireland, Luxembourg, Malta, Sweden and the United Kingdom to 94% in Romania. Nearly six out of ten respondents in the EU have both fixed and mobile telephone access in the household (59%). One third (33%) only have mobile telephone access, while just 6% have fixed telephone access but no mobile access. Two percent have no telephone access at all. The proportion of households with combined fixed and mobile access has declined slightly since 2014 (-2 percentage point), although over the longer term the proportion with this kind of access has remained relatively steady. The proportion of respondents living in mobile only households, on the other hand, has continued to increase. It has risen two points since 2014, and 15 points since the end of 2005/early During the same period the proportion of households with fixed line only access has fallen from 18% to 6% (-12 points). Base: All respondents (n = 27822) 38

42 The chart below shows that although almost all households in each Member State have some kind of telephone access, the type varies. Most of this variation is between households with fixed and mobile access, and those with mobile only. For example, households in Malta (88%) and the Netherlands (82%) have the highest proportion of households with mobile and fixed line telephone access, but low proportions of households with mobile only access. On the other hand, the large majority of households in Finland (87%) and the Czech Republic (84%) are mobile only. In both of these countries only 12% of households have both fixed line and mobile access. Greece is the only Member State where more than one in ten households (11%) only have fixed line access. Base: All respondents (n = 27822) Since 2014 there have generally been relatively small changes in the distribution of different kinds of telephone access within each Member State. In Sweden, there has been a large increase of the households having a mobile phone access but not fixed telephone access. This reflects the Swedish telephony market but is also explained by a change in the fieldwork methodology with prerecruitment in Sweden using registers which include mobile phone numbers whereas in the past they only included fixed phone numbers. This change in the methodology also strongly influences the measure of mobile only households as now there is a chance that pre-recruited interviewees only have a mobile phone. The next largest changes are, by comparison, considerably smaller: The proportion of households with both fixed line and mobile access has increased 13 points in Portugal and 11 points in Ireland, but has decreased 8 points in Cyprus. The largest increase in households with only fixed line access is observed in Greece (+6 pp), while the largest decrease is observed in Malta and Romania (-4 pp). After the observation in Sweden, the largest increase in the proportion of mobile only households is observed in Cyprus (+9 pp), Croatia, Germany and Romania (+7 pp), while the largest declines were amongst households in Ireland (-7 pp), Latvia (-6 pp) and Belgium (-6 pp). Households in Portugal recorded the largest decrease in the proportion of households with neither fixed line nor mobile access (-5 pp). 39
43 Base: All respondents (n = 27822) 40
44 2 Fixed telephony - The majority have access to a fixed line telephone in their household, although the proportion continues to decline - Almost two thirds of respondents live in a household with a fixed line telephone (65%) 20. However, underlying this figure is a large disparity in fixed line access across the EU. Malta is the only country where at least nine out of ten have fixed line access (93%), followed by 85% in Germany, Luxembourg and the Netherlands, 83% in Greece and 81% in France. In a stark contrast, just 13% of respondents in Finland and 14% in the Czech Republic have access to a fixed line telephone in their household. Overall, there is a range of 80 percentage points between the Member States with the highest and lowest levels of fixed line access. The map illustrates the highest concentration of households with fixed line telephone access is in Central and Western Europe. Base: All respondents (n = 27822) 20 D43a.1 Do you own a fixed telephone in your household? Yes; No. 41
 and Croatia (-8 pp).")
45 At the overall EU level, the proportion of respondents living in households with fixed line access has declined by three percentage points since 2014, but there have been much larger variations in individual Member States. For instance, there has been a large decrease in Cyprus (-9 pp) and Croatia (-8 pp). On the other hand, in six Member States the proportion of households with fixed telephone access has increased by at least three points, Portugal (+10 pp), Ireland (+8 pp), Belgium (+7 pp), Slovakia (+6 pp), Estonia and Latvia (both +3 pp). It is worth noting that in all these countries households are also more likely than in 2014 to own a bundle including fixed telephony. For instance, households in Ireland 44% (+18 pp) are much more likely to own a bundle including fixed telephony, as are those in Portugal (54%, +9 pp). Base: All respondents (n = 27822) 42
46 The chart below shows the longer-term trend in the proportion of households with fixed telephone line access. In most Member States, there has been a decline in fixed line telephone access since 2009, although the rate and degree of decline varies. For instance, in Austria the proportion of households with fixed line access has decreased from 54% in 2009 to 40% in 2015, and in Cyprus the proportions have gone from 84% in 2009 to 59% in the current survey. Portugal and Belgium, on the other hand present a different picture. In Portugal, the proportion of households with fixed telephone access has increased by 17 percentage points since 2009, while in Belgium the increase is nine points. Fixed line penetration in Malta, Germany, the Netherlands, Greece, the UK, and Spain has remained relatively stable since Base: All respondents (n = 27822) 43
47 Households in EU15 countries are much more likely to have fixed telephone access than those in the new Member States (NMS13) (73% vs. 33%). The socio-demographic analysis shows that urbanisation has no impact on fixed line telephone access, with rural households (67%) just as likely to have access as households in small/mid (65%) and large towns (64%). Focussing on single person households reveals the older the resident, the more likely they are to have fixed line telephone access. More than seven out of ten aged 60+ living in single households have a fixed line telephone (72%), compared to 41% of those aged 29 or younger. The older the respondent, the more likely they are to live in a household with fixed line telephone access: 54% of those aged do so, compared to 74% of those aged 55+. Amongst those aged 55+, the oldest respondents are the more likely to live in a household with fixed line access: 84% of those aged 75+ live in such a household, compared to 70% of those aged and 71% of those aged
48 3 Mobile telephony a. Access to mobile telephone - More than nine in ten households have mobile phone access - Mobile phone ownership is much higher than fixed line telephone access 93% of households have access to a mobile phone. Mobile access is almost universal in Finland and Sweden (both 99%), Denmark and the Netherlands (both 98%). In all but two Member States at least nine in ten respondents live in households with mobile phone access. The exceptions are Bulgaria and Greece (88% for both), but even there the proportions are high. Mobile phone access is highest in Northern areas of Europe. Base: All respondents (n = 27822) 45

49 At an overall EU level there has been relatively no change in mobile access in the household since the last survey in 2014 (+1 pp), and there are generally only small changes at a country level. The biggest change was an eight-percentage point increase in the proportion of households in Portugal with mobile phone access, and a seven-point decrease in Greece. Base: All respondents (n = 27822) 46

50 b. Household with only mobile telephone access - One third of households only have mobile telephone access - As noted in an earlier section, the proportion of respondents living in households with only mobile telephone access has grown by 15 percentage points since December 2005/January 2006, and now sits at 33%. As is the case for landline access, the proportion of households with mobile only access varies widely between countries. At least eight out of ten households in Finland (87%) and the Czech Republic (84%) are mobile only, as are 71% in Lithuania and 70% in Slovakia. In contrast, 7% of households in Malta and 15% in Germany, Luxembourg, and the Netherlands only have mobile telephone access. Mobile only households are most likely to be found in Northern and Eastern parts of the EU. Base: All respondents (n = 27822) 47
.")
51 Since 2014, the largest increase is observed amongst households in Cyprus (+9 pp), followed by a seven point increase for households in Germany, Croatia and Romania. There is also a large increase observed in the proportion of households with mobile only in Sweden (47%, +45 points). This increase is explained by the methodological change in pre-recruitment of respondents in Sweden. As explained earlier in the report (p.39), the database for pre-recruitment in Sweden used to only contain fixed phone numbers and now includes mobile phone numbers also which ultimately increase the chance to interview households with mobile phone only. Conversely, the proportion of mobile only households has fallen in Ireland (-7 pp), Latvia and Belgium (both -6 pp). Base: All respondents (n = 27822) 48
 are much more likely to live in a household with only mobile phone access compared to older respondents and in")

52 Households in new Member States (NMS13) are much more likely to be mobile only compared to their EU15 counterparts (64% vs. 26%). Respondents aged (46%-47%) are much more likely to live in a household with only mobile phone access compared to older respondents and in particular to those aged 55+ (24%). In addition, just 13% of respondents aged 75+ only have mobile phone access, compared to more than one quarter of those aged Respondents aged 29 or younger living in single person households (58%) are more likely than those aged (42%) or 60+ (23%) to only have mobile phone access. 49
53 IV. INTERNET ACCESS 1 Internet access in households Just over two thirds of EU households have Internet access at home 67% of European households have Internet access at home a slight increase since 2014 (+2 percentage points) 21,22. However, Internet access is not uniformly high across all Member States. It is almost universal amongst households in the Netherlands (96%) and Denmark (94%), and at least eight out of ten households in Sweden (89%), Finland (83%) and Luxembourg (82%) have Internet access. However, the proportion is much lower (41%) in Italy, the only European Member State where less than half of the households have Internet at home. Households with home Internet access are most likely found in Northern and Central Western areas of the EU. Base: All respondents (n = 27822) 21 D46. Which of the following goods do you have? An Internet connection at home. 22 It is important to note that given the recent growth of mobile Internet access, an Internet connection at home may refer to either fixed or mobile Internet connections. 50
, Croatia (-9 pp) and Germany (-5 pp).")
54 Since 2014 the proportion of households with Internet access has grown the most in Portugal (+16 percentage points), Ireland and Poland (both +11pp). On the other hand, household access has declined notably in Cyprus (-10 pp), Croatia (-9 pp) and Germany (-5 pp). Base: All respondents (n = 27822) 51
55 The longer term trend shows that at EU level, household Internet penetration has increased by 10 percentage points since The largest increases in household Internet access during this period are observed in Romania (+25pp), Portugal (+23 pp), Latvia (+21 pp), Belgium (+19 pp) and Greece (+19 pp). In the case of Portugal, almost all of this increase occurred between 2013 and Some Member States are showing declining household Internet access. In Lithuania household Internet access has declined since 2013 (-5 pp), while in Italy the proportion of households with Internet has continued to decline, after a large drop between 2013 and It is worth noting a decline of Internet access at home observed in ten Member States since 2014: Cyprus (53%, -10 points), Croatia (61%, -9 points), Germany (71%, -5 points), France (75%, -3 points), The Czech Republic (62%, -3 points), Lithuania (57%, -3 points), Bulgaria (50%, -3 points), Italy (41%, -3 points), Sweden (89%, -2 points) and Slovenia (71%, -2 points). This decrease, although relatively small in most countries, can be explained partly by the overall rise of mobile Internet access analysed later in the report. 52

56 Base: All respondents (n = 27822) The socio-demographic analysis shows respondents aged 54 or younger are much more likely to live in a household with Internet access than those aged 55+: 49% of those aged 55 or older live in a household with Internet access, compared to 83% of those aged Focussing just on those aged 55+ shows the older the respondent, the less likely they are to live in a household with Internet access: 69% of those aged do so, compared to 24% of those aged
57 Larger households are more likely to have Internet access. Just over half (51%) of all one person households have access, compared to 66% of two person households, and 81-83% of those with three or more people. Focussing on single person households shows the younger the occupant, the more likely they are to have Internet access: 35% of those aged 60+ do, compared to 79% of those aged 29 or younger. Urbanisation also has an impact. Those living in rural villages (64%) are the least likely to have household Internet access, followed by those in small/mid-sized towns (67%) and those in large towns (72%). Respondents living in households that only have a landline (21%) are much less likely to have Internet at home than those living in mobile-only households (57%), or those in households with both mobile and landline access (81%). 54
58 2 Mobile Internet access in households - Mobile Internet access continues to grow strongly - Three quarters of respondents with mobile phone access say at least one person in their household has a mobile subscription or pre-paid arrangement that included Internet access (75%) 23. This is an increase of 23 percentage points since 2014, and 39 points since Overall, 69% of the EU households have at least one mobile Internet access. This is an increase of 21 percentage points since Base: Respondents who have at least one member in their household with mobile phone access (n = 25825) 23 QA1.2 Thinking about all household members, including yourself, please indicate for each of the following how many of them are available in your household: Mobile phone subscriptions or pre-paid arrangements giving access to the Internet, e.g. for playing or downloading audio or video content or sending and receiving s. 55

59 Mobile Internet access is present in at least nine out of ten households in Denmark (91%), the Netherlands and Sweden (both 90%). In fact, in all Member States at least six out of ten respondents live in this kind of household. Since 2014, the proportion of households with a mobile phone subscription or pre-paid service that includes Internet access has increased in every Member State sometimes dramatically. For example, there has been a 39-percentage point increase in households in Romania with mobile Internet, a 38 points increase in Portugal and 36 points increase in Bulgaria. At the other end of the scale, the proportion of households with Mobile Internet increased by seven points in the UK and 8 in Latvia. Base: Respondents who have at least a member in their household with mobile phone access (n = 25825) 56
60 The chart below clearly illustrates the rise of mobile Internet in European households since January Overall, almost seven in ten households now have mobile Internet access (69%) - an increase of 21 percentage points. Looking in more detail, the proportion of households with a home Internet connection and mobile Internet has increased 15 points to 56%, while the proportion of mobile Internet only households has also increased (+6 pp, now 13%). During the same period, the proportion of households with home access but no mobile access declined 13 points and now sits at 11%. Two in ten households have no Internet access (20%) a decline of eight percentage points. Base: All respondents (n = 27822) 57
61 European households are considerably more likely than in 2011 to have access to mobile Internet. The proportion of households with a mobile Internet connection has more than doubled in the last four years (69%, +36 pp). This is more likely to be a consequence of increased access to mobile Internet in addition to fixed Internet, as households are less likely to have only fixed Internet (11%, - 24 pp). It is therefore less likely a result of increased overall Internet access (-12 pp in the proportion of households without any Internet access). Base: All respondents (n = 27822) 58
62 The EU level trend since 2014 is repeated across all Member States increases in the proportion of households with mobile Internet access range from 6 percentage points in Latvia and the UK, to 37 points in Portugal, 35 points in Romania, 32 points in Hungary, and 31 points in Bulgaria. Base: All respondents (n = 27822) Taking a more detailed view on the trend since 2014, across all member States the proportion of households with household Internet access but no mobile access has decreased, while the proportion of households with home and mobile access has increased. For example, there has been a growth of 28 percentage points in the proportion of households in Portugal with home and mobile Internet access, and a 12 point decrease in the proportion of households with home but no mobile access. 59
63 Similarly, in Poland the proportion of households with home and mobile Internet access has increased (+27 pp) while the proportion with home access only has decreased (-16 pp). The changes are even more in line between the different types of access in the case of Hungary (+26 pp in combined Internet access, and -24 pp in fixed only Internet access). In most countries, the proportion of households that only have mobile Internet access has also increased. This increase has been largest amongst households in Cyprus (+17 pp) and Italy (+14 pp). The exceptions are Luxembourg, where there has been a slight decrease (-2 pp) and the Netherlands and Malta, where there has been no change. In all Member States the proportion of households with no Internet access has declined since 2014, most notably amongst those in Portugal (-25 pp). Base: All respondents (n = 27822) 60
64 V. TELEVISION ACCESS 1 Overall access to television Television access is almost universal Almost all EU households have access to a television (96%) 24. This proportion is in line with that of 2014 (96%), 2013 (97%), 2011 (97%) and 2009 (98%). At a country level, television access ranges from 100% in Cyprus to 86% in Sweden. Sweden is the only country where fewer than nine out of ten have television access. 2 Means of reception Respondents with a television in the household are most likely to receive their television via a digital terrestrial television (DTT) (38%), while 7% receive television via an aerial. Almost one quarter of households have satellite TV (24%). One in five (20%) receive their TV via digital cable ( a cable TV network + decoder ), while a further 9% receive analogue cable ( a cable TV network (analogue = directly connected to the TV set) ). Relatively few receive their television via the telephone network (12%). Overall 43% of respondents live in households with aerial or DTT TV access 25, while 29% have cable. There have been few changes since The most notable is a five percentage point increase in the proportion of respondents that receive television via the telephone network. Base: Respondents who have television in the household (n = 26680) 24 D46 Which of the following goods do you have? A television. 25 TV cable = A cable TV network (analogue = directly connected to the TV set) + A cable TV network + decoder (digital TV) Aerial or DTT = An aerial (e.g. on the roof or on the top of the TV set) + Digital Terrestrial Television (aerial + decoder). 61
65 The longer term trends show that digital terrestrial television penetration has stabilised, after declining slightly between 2013 and Cable and satellite connections have remained stable. In fact, the only sector to show notable growth in the past two years is television access via the telephone network (+6 percentage points). Base: Respondents who have television in the household (n = 26680) The means used to access television varies widely across Member States 26. Digital terrestrial television is the most common means of access in nine countries, especially Spain (90%), Italy (87%) and Croatia (65%). On the other hand, just 5% of respondents in Slovenia and 7% in Germany and Belgium access television using this method. Television access via satellite is the most common method of television access in six Member States: Ireland (55%), Germany (50%), Slovakia (44%), Austria (43%), Poland (39%) and the UK (36%). In contrast, no households in Lithuania and just 2% in the Netherlands access TV this way. Digital cable TV is the most common means of access in eight Member States, particularly in Belgium (62%), the Netherlands (54%) and Finland (50%). This compares to just 9% of households in Cyprus, Italy, France and Spain. Almost half of all TV owning households in France have television access TV via the telephone network (45%), as do 41% of households in Slovenia and 32% in Portugal. Access via the telephone network is also the most common form of TV access in Slovenia and Portugal. In contrast, no households in Romania and just 2% in Poland and Ireland access TV this way. Analogue cable TV is the most common kind of connection in Romania (54%), and it is also widely used in Latvia (30%) and Hungary (28%). Although rare or non-existent in most Member States, television delivered via an aerial is the most access method in Cyprus (67%) and Lithuania (32%), and this method is also used by 45% of TV owning households in Greece. 26 Some means of receiving television are not available in some countries, as follows: An aerial (for example on the roof or on the top of the TV set): Austria, Belgium, Bulgaria, Czech Republic, Germany, Denmark, Estonia, Spain, Finland, France, Croatia, Hungary, Italy, Luxembourg, Latvia, the Netherlands, Portugal and Sweden; A cable TV network (analogue = directly connected to the TV set): Spain, Finland, France, Croatia, Italy. 62
66 Base: Respondents who have television in the household (n = 26680) 63
, Greece (+53 pp), Latvia (+34 pp) and Spain (+30 pp).")
67 The longer term trend shows that in most Member States the proportion of households with digital terrestrial television is the highest it has been since The largest increases in this period are observed amongst households in Italy (+54 percentage points), Greece (+53 pp), Latvia (+34 pp) and Spain (+30 pp). However, some countries show a different pattern. For example, digital TV access in Ireland has been falling steadily since 2013 (-9 pp), and the same applies in the UK (-9 pp) and Lithuania (-10 pp). In the shorter term - since access via digital terrestrial television increased notably in Italy (+17 pp), The Czech Republic (+8 pp) and Croatia (+7 pp), but declined in Portugal (-16 pp), France (-12 pp), Malta (-10 pp) and Luxembourg and Cyprus (both -8 pp). Base: Respondents who have television in the household (n = 26680) 64
68 In general, satellite TV access has remained relatively stable in most Member States in the period The exceptions are increases amongst households in Bulgaria (+22 pp), Slovakia (+19 pp), Ireland (+13 pp) and Poland (+12 pp), and decreases amongst those in France, Denmark (both - 11), Cyprus (-10 pp) and Italy (-8 pp). Base: Respondents who have television in the household (n = 26680) 65
69 Across the EU, digital cable TV has enjoyed only small growth since February/March 2011 (+4 percentage points). However, growth has been more substantial amongst households in Belgium (+28 pp), Hungary (+25 pp), the Netherlands, Austria (both +23 pp), Bulgaria and Greece (both +21 pp), and Portugal (+18 pp). However, during the same period the proportion of households with digital cable access has decreased 7 points in Luxembourg. Since 2014 there have been notable decreases in the proportion of households in Slovakia (-9 pp), Malta and Slovenia both (-6 pp) with digital cable access. Base: Respondents who have television in the household (n = 26680) 66
70 The use of analogue cable TV continues to decline across the EU, and within almost all Member States. Since February/March 2011 the decline at EU level has been 10 percentage points, but it has been much larger amongst households in Belgium and the Netherlands (both -29 pp), Hungary (-26 pp), Austria and Estonia (both -24 pp), Slovenia (-21 pp, Slovakia (-19 pp), Bulgaria and Lithuania (both -18 pp), Poland (-17 pp), and Germany (-15 pp). Since the last survey in 2014 analogue cable access has increased in Malta by 12 points. Base: Respondents who have television in the household (n = 26680) 67
71 VI. SERVICE PACKAGES 1 Overall penetration of service packages - The purchase of bundled communications services continues to increase Half of all EU households purchase bundled communication services packages that combine two or more services for one overall price 27. This is an increase of four percentage points since the survey in 2014, and a 12 point increase since Base: All respondents (n = 27822) 27 QA7 By bundle, we mean a package offering a combination of electronic communication services (or a combination with other services such as TV channels) from the same provider at an overall price. Has your household subscribed to two or more of the following services as part of a bundle? No, we have not bought services as part of a bundle; Yes, fixed line telephone; Yes, mobile telephone; Yes, fixed or mobile Internet access; Yes, television channels; Other (SPONTANEOUS); Don t know. 68

72 Households in the Netherlands (87%) and Malta (78%) are the most likely to have purchased bundled services, as have at least half of all households in 19 other Member States. At the other end of the scale, 31% of households in Italy, 32% in the Czech Republic and 34% in Lithuania have purchased bundled communications services. Since 2014, household bundle subscriptions have increased most in Ireland (+28 percentage points), Finland (+24 pp) and Malta (+20 pp), and in most countries subscriptions to bundles have increased since the last survey. In contrast, bundle subscriptions have decreased in Germany by 16 points. Base: All respondents (n = 27822) 69
73 The chart below provides more detail about the proportion of households with various bundled service combinations. A bundle with fixed telephone and Internet is the most common (10%), followed by bundles with television, fixed telephone and Internet (7%). Almost as many have a bundle with television and Internet, or with mobile telephone and Internet (both 6%) while one in twenty have a bundle that covers television, fixed and mobile telephony and Internet (5%). Other bundle combinations are less common, particularly television with fixed and mobile telephony, or television, mobile telephony and Internet (both 1%). Overall, more than two in ten European households now have a bundle with mobile phone (22%). This represents an increase of ten percentage points since 2014 and reflects the gradual convergence of mobile telephony and fixed services in the market place. Since 2014 the proportion with a bundle including mobile telephony and Internet has increased four percentage points, while the proportion bundling fixed telephony and Internet, or television, fixed telephony and Internet has decreased (both -4 pp). Base: All respondents (n = 27822) 70
74 For households with a bundle, their bundle is most likely to include Internet access (80%), followed by fixed telephony (65%) and television (53%). Mobile telephone is included in the bundle for 45% of the respondents households (+16 points). This dramatic uptake of mobile in bundles is a good indicator of the fixed-mobile convergence trend in the market place. Compared to 2014, households are much more likely to have a bundle that includes mobile telephony (+16 pp), but are less likely to have one that includes fixed telephony (-15 pp) or Internet access (-11 pp). This tends to show a certain substitution between fixed Internet subscription and mobile Internet. Base: Respondents who have a bundle (n = 14766) 71

75 In the period from households with Internet access were increasingly likely to have included this access as part of a bundle. However, in the past year this trend has reversed. Between 2014 and 2015 there has been a four point drop in the proportion of households with Internet access who have a bundle that includes this access. The same trend change applies for fixed telephone access. The proportion of households with fixed telephone access that bundle this service has declined by five points in the past year. These results are supported by those in the previous section that show a decline in bundling of Internet or fixed line telephone services. This, combined with only a minor decline in fixed line access, and a small increase in Internet penetration suggests these changes are predominantly due to changes in the characteristics of bundles, rather than a decline in access to individual services. Base: Respondents who have Internet access (n = 18718) Base: Respondents who have fixed telephony (n = 18182) 72
76 Since 2014 double play bundles have increased by six percentage points, while triple play bundles have decreased by three points. Base: All respondents (n = 27822) In every Member State, households are more likely to have a bundle that includes a mobile phone than they were in The largest increases in the proportion of households with a bundle including mobile telephony are observed in Cyprus, Portugal (both +23 pp), Romania (+22 pp), Spain and Finland (both +19pp). In the case of other services, trends are more variable between Member States. Households in Finland (+20 pp), Portugal (+17 pp), Poland (+13 pp), Malta and Austria (both +12 pp) are more likely than they were in 2014 to have a bundle including fixed or mobile Internet access. Conversely, those in Germany (-19 pp), Croatia (-17pp), Sweden and the UK (both -11 pp) are less likely to be bundling Internet access. Households in Ireland are more likely than they were in 2014 to have a bundle including fixed telephony (+18 pp), as are those in Malta (+10 pp) and Portugal (+9 pp). In contrast, households in Germany (-21 pp), Sweden (-19 pp) and France (-12 pp) are less likely to do so. The largest increases in the proportion of households who are bundling television channels are observed in Denmark, Portugal (both +15 pp), Romania (+14 pp), Ireland and Finland (both +12 pp). The largest decrease is observed in Germany (-5 pp). There have been large decreases in the proportion of households in Ireland (-30 pp), Finland (-25 pp) and Cyprus (-20 pp) that say they are not bundling services. In contrast, the proportion in Germany (+14 pp) and Sweden (+7) has increased. 73
77 Base: All respondents (n = 27822) 74
 are the most likely to have a bundle, particularly compared to those aged 55+ (39%).")
78 Households in EU15 countries are slightly more likely to have a bundle, compared to those in the newer Member States (NMS13) (51% vs. 46%). Socio-demographic analysis shows respondents aged (59%-61%) are the most likely to have a bundle, particularly compared to those aged 55+ (39%). This pattern is also repeated within the oldest respondents: those aged (52%) are more likely to have a bundle than those aged (38%) and those aged 75+ (23%). The largest households are also the most likely to have a bundle. At least six out of ten in households with three or more people say they have a bundle (61%-62%), compared to 49% of two person households and 38% of single person households. Amongst single person households, those aged are the most likely to have a bundle (51%), followed by those aged 29 or younger (44%) and those aged 60+ (29%). Urbanisation also has an impact, with those in rural villages less likely to bundle (46%) compared to those in small/mid-size (52%) and large towns (54%). Finally, households with landline and mobile phone access are more likely to have a bundle (64%) than mobile only (36%) or landline only households (20%). 75
79 VII. PURCHASING AND SWITCHING SERVICES 1 Factors when subscribing to an Internet connection Cost-related criteria are the most important when subscribing to an Internet connection - Respondents with an Internet connection in the household were asked the main factors they consider when subscribing to this kind of service 28. Initially respondents were asked for their main factor: cost is clearly the most important (38%), followed by the maximum download or upload speed (17%). One in ten say the fact that the subscription is part of a bundle is the main factor they consider (10%) while 7% say the ability to use multiple connected devices at the same time without loss of quality or the maximum data they can download or upload is the main factor. Other factors are mentioned by 5% or less. Overall 47% of respondents in Internet households give a cost related criteria as the main factor they consider when subscribing to an Internet service, while 31% give a quality related criteria and 16% nominate a service related criteria QA3a When subscribing to an Internet connection what are the main factors you consider? Firstly? QA3b And then? The maximum download or upload speed; The maximum amount of data (MB, GB) you can download or upload; The price of the Internet subscription; The notice period to terminate the contract with the provider; The fact that the Internet subscription is part of a bundle; The customer service; The cost of the equipment; The cost of installation; The ability to use multiple connected devices at the same time without loss of quality; Other (SPONTANEOUS); Don't know. 29 Costs-related criteria = The price of the Internet subscription + The cost of the equipment + The cost of installation Quality-related criteria = The maximum download or upload speed + The maximum amount of data (MB, GB) you can download or upload + The ability to use multiple connected devices at the same time without loss of quality Service-related criteria = The notice period to terminate the contract with the provider + The fact that the Internet subscription is part of a bundle + The customer service 76
80 Base: Respondents with Internet connection in the household (n = 19642) 77
81 Respondents were also given the option to choose up to three additional main factors they considered when subscribing to an Internet service. Combining all the responses together further illustrates the importance of cost: 69% say this is a main factor when subscribing to an Internet connection, while 48% mention the maximum download or upload speed, and 32% the maximum amount of data that can be downloaded or uploaded. Taking all the factors together, cost related criteria are the most important (79%), followed by quality related criteria (70%) and service related criteria (51%). As this question has been modified since January 2014, a direct comparison of all answers cannot be made. However, looking at comparable individual items it shows respondents are more likely to consider quality criteria, such as maximum download or upload speed (+7 points), or maximum amount of data downloaded or uploaded (+6 points) than they were in Base: Respondents with Internet connection in the household (n = 19642) 78
82 Moreover, it is worth noting that in 2014 price was also by far the most mentioned factor (71%), followed by the maximum download speed (41%) and the ability to have the connection as part of a bundle (29%). In all but two Member States, price is the main factor respondents consider when subscribing to an Internet connection. Price is also mentioned by the majority in all but one country. Eight out of ten respondents in the Czech Republic nominate this as the main factor (80%), followed by 79% in Hungary and 78% in Belgium and the Netherlands. This compared to 48% of respondents in Malta. Respondents in Malta are most likely to say the maximum download or upload speed is the main factor (53%), although this criterion is also widely mentioned by those in Greece (62%), Romania, Slovakia (59%) and Spain (58%). This factor is less likely to be a main consideration for those in France (31%) and Belgium (36%). The maximum amount of data that can be downloaded or uploaded is most likely to be the main factor for respondents in Austria (51%), Slovakia (47%), Germany (42%) and Croatia (41%), and least likely to be a main factor for those in France (17%) and Cyprus (21%). At least four out of ten respondents in Cyprus (47%), Belgium (45%) and France (43%) say customer service is the main factor when subscribing to an Internet connection, compared to 10% of those in Hungary and Croatia. The ability to use multiple connected devices at the same time without loss of quality is most likely to be the most important factor for respondents in Portugal (46%), Finland (41%) and Italy (38%), and least likely to be the most important factor for those in Slovenia (12%). Having Internet access as part of a bundle is most likely to be an important factor for respondents in Portugal (60%), Greece (43%), Romania and Slovenia (both 36%). In fact, this is the most mentioned criteria by respondents in Portugal. It is much less likely to be the main factor for those in the Czech Republic (7%). Respondents in Cyprus (34%), Greece (33%), Hungary and Italy (both 32%) are the most likely to say the cost of installation is the main factor when subscribing to an Internet connection, while those in Sweden are least likely to do so (8%). The cost of the equipment is most likely to be the main factor for respondents in the Czech Republic (39%), Lithuania and Slovakia (both 31%), while the contract notice period is the main factor for 22% of those in Austria, 19% in the Netherlands, and 18% in Germany. Taking a broader view, in 23 Member States cost-related criteria 30 are the most important factors when subscribing to an Internet service. In Austria, Germany, Estonia and Malta quality-related criteria 31 are the most mentioned as the main factor. Portugal is the only country where service related criteria 32 are the most mentioned. 30 Price, cost of equipment and cost of installation. 31 Speed, data download/upload, the ability to use multiple devices without loss of quality. 32 Notice period, ability to bundle, customer service. 79
83 Base: Respondents with Internet connection in the household (n = 19642) 80
84 The socio-demographic analysis reveals a number of interesting differences: Men are more likely than women to say quality related criteria are a main factor when choosing an Internet connection (73% vs 67%). Older respondents are more likely to mention service related criteria, and are less likely to mention quality related criteria. For example, 55% of those aged 40-54, and 56% of those aged 55+ mention service related criteria, compared to 40% of those aged The longer a respondent remained in education, the more likely they are to mention quality related criteria: 52% with the lowest education levels do so, compared to 73% of those with the highest levels. In addition, those with the lowest education levels are the least likely to mention cost related criteria. Respondents living in larger households are more likely to consider quality-related criteria (76% of households with at least three members vs. 59% of single households), and in particular the maximum download or upload speed (52% vs. 41%), the maximum amount of data downloaded or uploaded (36% vs. 27%), and the ability to use multiple connected devices at the same time without loss of quality (31% vs. 17%). Respondents in large towns are the most likely to mention quality and cost criteria, particularly compared to those in rural villages. For example, 74% of those in large towns mention quality related criteria, compared to 67% in rural villages. Respondents that use the Internet every day are much more likely than less frequent users to mention quality related criteria as important factors (75% vs 53%) whereas there is little difference between these groups in terms of price related factors. 81

85 Base: Respondents with Internet connection in the household (n = 19642) 82
86 2 Ease of price comparisons of bundled offers - The majority in all but one Member State agree it is easy to compare bundle offers - Respondents living in a household with a bundle were asked if it was easy to compare their current bundle with other offers 33. More than two thirds (69%) agree that it is easy to make these comparisons in fact 29% totally agree. Almost one quarter disagree (24%), although they are more likely to tend to disagree (16%) than totally disagree (8%). There has been no notable change since the last survey in Base: Respondents who have a bundle (n = 14766) At least half of this group of respondents in all but one Member State agree it is easy to compare the services and prices of their current bundle with other bundled offers. Respondents in Italy (88%), Greece (84%) and Bulgaria (82%) are the most likely to agree. The exception is Denmark, where far fewer (31%) agree this comparison is easy. In fact, 33% of those in Denmark totally disagree with this statement. Although results at the EU level have virtually not changed since January 2014, at the country level there have been some notable trend changes. More specifically, respondents in Austria (+17 pp) and Romania (+ 16 pp) are more likely to say they can easily compare their bundle offer with other offers. On the other hand, respondents in Latvia (-14 pp), Denmark (-12 pp) and Malta (-11 pp) are less likely to say this. 33 QA8 Please tell me whether you agree or disagree with the following statement: You can easily compare the services and prices offered by your current bundle with other bundled offers. Totally agree; Tend to agree; Tend to disagree; Totally disagree; Don t know. 83

87 Base: Respondents who have a bundle (n = 14766) 84
88 3 Switching bundle provider - The majority live in households where someone has changed bundle provider - Amongst respondents living in households with bundled services, more than half live in households where someone has changed bundle providers at least once (57%) 34. In fact, 28% have done so in the last two years. This is a notable increase since 2014 when 45% (+12 pp) had changed bundle providers at least once. Base: Respondents who have a bundle (n = 14766) Amongst those with bundled services, households in Greece are the most likely to have changed bundle at least once (80%), followed by those in Finland (73%), Italy (70%), Spain (69%) and Austria (68%). In fact, in 21 Member States the majority has changed bundle provider at least once. At the other end of the scale, 40% of those with bundles in Malta, Luxembourg and Latvia have changed bundle provider. 34 QA9 Have you or someone in your household changed bundle service provider? Yes, within the last year: Yes, between one and two years ago; Yes, between two and five years ago; Yes, more than five years ago; No, never; Don t know. 85
, Portugal (-3 pp) and Slovakia (-1 pp).")
89 Respondents in Romania (+34 percentage points), Bulgaria (+32 pp) and Cyprus (+24 pp) are now much more likely to say they live in a household where someone has changed bundle provider at least once. In fact, in almost all Member States respondents are more likely to say this than they were in The exceptions are Latvia (-8 pp), Portugal (-3 pp) and Slovakia (-1 pp). Base: Respondents who have a bundle (n = 14766) 86
90 Socio-demographic analysis highlights the following: Those aged 55+ are least likely to have changed bundle provider at least once, particularly compared to those aged (51% vs. 63%). Households with at least three people are the most likely to have changed bundle provider at least once (62%-64%), particularly compared to single person households (52%). Those living in rural villages are the least likely to have changed bundle provider (54%), particularly compared to those in small/mid-sized towns (57%) and large towns (62%). Daily Internet users are the most likely to have changed bundle provider (59%), compared to 52% of less frequent users, and 50% of those that never use the Internet. Respondents living in households with mobile access are the most likely to have changed provider: 60% in mobile only households have done this, as have 58% in households with landline and mobile access, compared to 43% of those in households that only have landline access. 61% of those that agree it is easy to compare bundles have changed provider at least once, compared to 54% of those who disagree. 87

91 Base: Respondents who have a bundle (n = 14766) 88
92 Most respondents that live in households where no one has ever changed bundle providers say they have never considered doing so (61%) 35. Almost one third (32%) have considered changing bundle providers, although they have never actually done so. Compared to 2014, respondents are more likely to say they, or someone in their household, has considered changing bundle provider (+5 percentage points). Base: Respondents who have never changed their bundle provider (n =5722) Amongst those who have considered changing bundle provider, being satisfied with the service is the most common reason given for not switching (12%). There is little difference at EU level between the other reasons, which are mentioned by no more than 6% of respondents. In all but one Member State, respondents are most likely to say they have never considered changing bundle provider 36. Respondents in Malta (75%), Luxembourg (72%), Belgium and Germany (both 71%) are most likely to say this. Those in Croatia and Ireland are least likely to say they have never considered changing (both 28%). Ireland is the only country where respondents are most likely to say they considered switching, but they were satisfied with the service they were getting (29%). This is also widely mentioned by respondents in Greece (35%), Finland (23%), Italy and Croatia (both 22%), but least mentioned by those in Malta and Luxembourg (both 3%). Respondents in Ireland and the Netherlands are the most likely to say changing would take too much time and effort (both 14%), and respondents in the Netherlands are also the most likely to say they did not want to lose their current address(es) or web page(s) (8%). 35 QA10. Have you or someone in your household ever considered changing your bundle provider? No, you never considered it; Yes, but you are satisfied with the service you currently get; Yes, but there are no other bundle providers in the area where you live; Yes, but there are no other bundle providers which would provide good value for money; Yes, but you are currently bound by your contract with your current provider; Yes, but eventually your provider offered you better conditions and you decided not to switch; Yes, but you don't want to take the risk of a temporary loss of service during the switching process; Yes, but you don't want to take the risk of having to pay two providers during the switching process; Yes, but it is not clear what steps you would need to take to switch; Yes, but you do not want to lose your current address(es) or web page(s) hosted on the provider's server; Yes, but it takes too much effort and time to do it; Yes, but some services of the bundle could not be cancelled at the same time; Other (SPONTANEOUS); Don't know. 36 Due to low base sizes, results from the following countries should be considered with caution: BG (143), CZ (141), CY (141), FI (137), SK (131), PL (119), EL (110), IT (86). 89
93 Respondents in Greece, the Czech Republic and Slovakia are the most likely to say their provider offered them better conditions so they decided not to switch (12%). Those in the Czech Republic are also the most likely to say they did not want to risk having to pay two providers, along with respondents in Italy and Ireland (all 6%). Respondents in Cyprus are the most likely to say they considered changing, but are bound by their current contract (17%). Respondents in Croatia are the most likely to say there were no other providers that would give good value for money (14%), or that there are no other providers in their area (10%). Respondents in Italy are the most likely to say they did not want to risk a temporary loss of service (6%). Base: Respondents who have never changed their bundle provider (n =5722) 90
94 Sweden is the only Member State where respondents living in a household where no one has changed bundle provider are more likely to say they have never considered this, compared to 2014 (+17 percentage points). In contrast, large decreases are observed in the proportion that have never considered changing in Ireland (-35 pp), Slovakia (-34 pp) and Cyprus (-32 pp). Respondents in Greece (+23 pp), Slovakia, Hungary and Lithuania (all +14 pp) are more likely than they were in 2014 to say they considered changing but were satisfied with the service they currently get. Those in Sweden (-16 pp) and Bulgaria (-11 pp) are now less likely to say this. For the other reason for not changing bundles, most country-level changes are relatively small. The most notable being: A 13 points increase in the proportion of respondents in Ireland that say changing takes too much time and effort, and a 6 points increase in the proportion that say they didn t want to risk paying two providers. A 10 points increase in the proportion of respondents in Slovakia that say their provider offered them a better deal so they decided not to switch. A 15 points increase in the proportion of respondents in Cyprus that say they are bound by their current contract. A 9 points increase in the proportion of respondents in Croatia that say there are no other providers that over good value for money, and a 5 points increase in the proportion that say there are no other providers in their area. A 10 points increase in the proportion of respondents in Portugal that say they were not clear on the steps needed to switch. 91
95 Base: Respondents who have never changed their bundle provider (n = 5722) 92
96 Respondents who have never changed bundle provider can be categorised into two groups based on their responses: Households with inertial consumers are those where respondents say they never considered switching, they considered switching but are satisfied with the service they currently get, they considered switching but their provider eventually gave them better conditions so they decided not to change, or they considered switching but it takes too much time and effort to change. These respondents may also have selected other options (multiple answers to the question were possible). Households with hindered switchers are those where respondents considered switching but there are no other bundle providers in the area where they live, there are no other bundle providers which would provide good value for money, they are currently bound by a contract with their current provider, they didn t want to take the risk of a temporary loss of service during the switching process, they didn t want to take the risk of having to pay two providers during the switching process, it was not clear what steps they would need to take to switch, they did not want to lose their current address(es) or webpage(s) hosted on the provider's server, or that some services of the bundle could not be cancelled at the same time. These respondents may also have selected other options (multiple answers to the question were possible). The table below shows the proportion of respondents in each of these groups, both across the EU, and in each Member State. Inertial consumers can be found in 82% of EU households and hindered switchers are found in 15% of households. The proportion of inertial consumers has decreased by four percentage points since At least six out of ten respondents in each country are inertial consumers. At least nine out of ten in Belgium (92%) and Germany (90%) are inertial, as are 89% in the UK and 88% in Greece. This compares to 62% in Cyprus and Romania. Hindered consumers, on the other hand, are most likely to be found in Croatia (39%), Italy (31%) and Cyprus (30%), and least likely to be found in Belgium (8%), the UK and Germany (both 10%). In almost all Member States, respondents who have never changed bundle provider are less likely to be inertial consumers than they were in The proportion of inertial consumers has declined most in Cyprus (-26 percentage points), the Czech Republic and Italy (both -17pp). Inertial consumers have increased in Germany (+4 pp) and the UK (+3 pp). The proportion of hindered consumers has increased most notably in Cyprus (+22 pp), Ireland (+18 pp) and Italy (+16 pp). In fact, in 17 Member States the proportion of hindered consumers has increased by at least three percentage points. The largest declines in the proportion of hindered consumers are observed amongst respondents in Sweden (-11 pp), Slovenia and Germany (both -6 pp). 93
97 Base: Respondents who have never changed their bundle provider (n = 5722) 94

98 VIII. CONSUMER PROTECTION AND COMMUNICATION SERVICES 1 Consumer protection when using digital services - Almost nine in ten agree the same consumer protection should apply to both digital and traditional communication services - A large majority of respondents agree the same level of consumer protection that applies for traditional communication services should be applied to digital services as well 37 (86%). In fact, more than half (58%) totally agrees. Just 5% disagree. Base: All respondents (n = 27822) 37 QA11 Please tell me whether you agree or disagree with the following statement: The same level of consumer protection, including data protection and security, should be applied when using messaging services, services or phone service applications via the Internet as when using traditional communications services (such as phones or SMS). Totally agree; Tend to agree; Tend to disagree; Totally disagree; Don t know. 95
99 More than six out of ten respondents in each country agree the same level of consumer protection, including data protection and security, should be applied when using messaging services, services or phone service applications via the Internet as when using traditional communications services (such as phones or SMS). The proportions are highest amongst respondents in Ireland (93%), Cyprus (92%), Belgium, Denmark, and the Netherlands (all 91%), and lowest in Estonia (69%) and Latvia (76%). It is worth noting that in seven Member states at least seven out of ten respondents totally agrees: Cyprus, Denmark, Ireland, Germany, Sweden and the Netherlands. Furthermore, no more than 9% of respondents in any Member State disagree with this statement. Base: All respondents (n = 27822) Socio-demographic analysis reveals oldest respondents are the least likely to agree the same level of consumer protection should apply to these Internet services as to traditional communication services. More than nine out of ten respondents aged 54 or younger agree, compared to 77% of those aged 55+. Furthermore, this pattern also repeats within the group of oldest respondents: 87% of those aged agree the same level of consumer protection should apply, compared to 77% of those aged and 62% of those aged 75+. The longer a respondent remained in education, the more likely they are to agree: 72% of those with the lowest education level agree the same protection should apply, compared to 92% of those with the highest education level. Respondents living in households with mobile access are more likely to agree the same level of consumer protection should apply to these Internet services as to traditional communication services. For example, 90% of those living in households with mobile and landline access, and 85% of those living in mobile only households agree, compared to 61% of respondents that live in households that only have landline telephone access. Finally, it is perhaps not surprising that respondents who use messaging, or phone services on the Internet are more likely to agree the same level of consumer protection should apply, compared to those that never use these services. For example, 93% of respondents that use an instant messaging service at least occasionally say the same level or protection should apply, compared to 79% of those that never use this kind of service. 96

100 Base: All respondents (n = 27822) 97

101 2 Keeping telephone numbers and addresses when switching provider At least three quarters say it would be important to keep phone numbers, and online content when switching providers - Respondents were asked how important it would be to keep phone numbers, and other online content if they switched providers 38. Almost nine out of ten respondents with a mobile phone (89%) say it would be important to keep their mobile phone number, with 68% saying this would be very important. More than eight out of ten with a fixed line say it would be important to keep their number (82%), with 61% saying this would be very important. More than three quarters of those with a home Internet connection say being able to keep their e- mails, contacts, photos and any other personal content stored online by their communications service provider when switching would be important (78%), with 55% saying this would be very important. Base: Respondents with access to the respective communications service 38 QA12 If you were to switch your communications service provider, how important would it be to keep each of the following? 12a.1 Your fixed telephone number; 12a.2 Your mobile telephone number; 12a.3 Your s, contacts, photos and any other personal content stored online by your communications service provider. 98
, compared to 85% of those in Austria and Germany.")
102 More than eight out of ten respondents with access to a mobile telephone say it would be important to keep their phone number if they switched provider. Almost all respondents in Ireland, Finland and Latvia say this (all 96%), compared to 85% of those in Austria and Germany. Base: Respondents who have a mobile phone (n = 25684) At least half of all respondents with access to a fixed line telephone say it would be important to keep their phone number if they switched provider. Those in Greece (94%), Spain, Malta (both 89%) and Italy (87%) are the most likely to say this, compared to 59% in Denmark and 64% in Finland and Latvia 39. Base: Respondents who have a fixed phone (n = 18290) 39 Results from Finland should be interpreted with caution, due to low base size (125). 99
, as do 86% in the UK, and 84% in Belgium and Spain.")
103 At least half of all respondents with home or mobile Internet say they would want to keep s, contacts, photos and other online content if they changed provider. Almost nine out of ten respondents in Ireland say this (89%), as do 86% in the UK, and 84% in Belgium and Spain. Romania and Portugal are the only countries where less than seven out of ten say this would be important (68%). Base: Respondents who have Internet access (n = 23395) The main socio-demographic differences are age related: Respondents aged are the most likely to say it would be important to keep their mobile phone number (92%), compared to both the oldest (86%) and the youngest respondents (87%). The older the respondent, the more likely they are to say keeping their fixed line number would be important: 89% of those aged 55+ say this, compared to 70% of those aged Those aged 55+ are also the least likely to say it would be important to keep s or other content stored online if they switched providers. For example, 64% of those aged 55+ say this would be important, compared to 86% of those aged In addition, those that make or receive landline calls regularly or daily are more likely to say it would be important to keep their mobile or landline numbers, compared to those who only use a landline occasionally. For example, 89% of respondents that make or receive landline calls daily say it would be important to keep their landline number, compared to 62% of those who make or receive landline calls occasionally. If a respondent says keeping one of these is important, they are more likely to also say this about the other numbers or online content. For example: 84% of respondents that think it is important to keep their mobile number also think it would be important to keep their fixed line number, compared to 57% of those that say keeping their mobile number is not important. Not surprisingly, respondents that use online service such as , social media, instant messaging or calling are more likely to say that keeping s and other online content would be important if switching providers. For instance, 88% of those that use daily say keeping this kind of online content would be important, compared to 47% that never use
104 3 Ease of controlling and monitoring communication services - At least two thirds think it is easy to monitor and control their use of communications services - The majority of respondents say it is easy to monitor and control their use of a range of communication services 40. More than three quarters of mobile users say it is easy to monitor and control their mobile phone consumption (78%), with 40% saying this is very easy. Just over seven in ten (71%) say it is easy to monitor and control their fixed line telephone usage, with 37% saying this is very easy. Almost as many say it is easy to monitor their mobile Internet (69%), while 67% say this about fixed line Internet. For both of these Internet services 34% say it is very easy to monitor and control their consumption. Base: Respondents with access to the respective communications service 40 QA16 For each of the following services, please tell me whether you consider it is easy or not to monitor and control your consumption: 16.1 Fixed telephone services; 16.2 mobile telephone services; 16.3 Fixed Internet access services; 16.4 Mobile Internet access services. 101
, the UK (85%), Ireland (84%) and Slovenia (83%) are the most likely to say this, while those in Spain (62%) are the least likely.")
105 At least six out of ten respondents in each Member State say monitoring and controlling mobile phone consumption is easy. Those in Latvia (88%), the UK (85%), Ireland (84%) and Slovenia (83%) are the most likely to say this, while those in Spain (62%) are the least likely. Base: Respondents who have a mobile phone (n = 25684) Respondents in the UK and Ireland (both 80%) are the most likely to say it is easy to monitor and control their fixed telephone consumption, followed by those in Germany (77%) and Portugal (76%). At the other end of the scale, 51% in Denmark and 54% in Finland say the same 41. It is worth noting that at least one third of respondents in these two countries are unable to answer. Respondents in Greece are the most likely to say it is not easy to monitor and control their fixed telephone consumption (37%). Base: Respondents who have a fixed phone (n = 18290) 41 Care should be taken when interpreting the result for Finland, due to low base size (125). 102
106 The majority of respondents in all countries say it is easy to monitor and control their mobile Internet consumption, with those in the UK (78%), Ireland and Belgium (both 76%) the most likely to say this. The least likely to say this are respondents in Greece (56%) and Cyprus (57%). There is a particularly high level of uncertainty amongst respondents in Cyprus (29% Don t know ), Estonia (28%) and Slovenia (27%). Base: Respondents who have access to Internet on their mobile (n = 20469) Amongst respondents with fixed Internet, those in Latvia are the most likely to say monitoring and controlling consumption is easy (76%), followed by those in Ireland, Poland and the UK (75%), and in Belgium (74%). Respondents in Denmark (50%), Cyprus and Austria (both 51%) are the least likely to say this is easy. Base: Respondents who have Internet access at home (n = 19642) 103
107 The socio-demographic analysis illustrates a range of differences: Men are more likely than women to say monitoring and controlling fixed telephone (74% vs. 69%), fixed Internet (69% vs. 64%) or mobile Internet consumption (72% vs. 67%) is easy. Those aged are the most likely to say it is easy to monitor and control mobile phone and fixed Internet consumption. For example, 85% of year olds say it is easy to monitor and control mobile phone consumption, compared to 69% of those aged 55+. Those aged 55+ are the least likely to say it is easy to monitor mobile Internet (52%), particularly compared to the youngest respondents (81%). In addition, the most frequent service users are the most likely to say it is easy to monitor and control consumption: The more often a respondent uses the Internet, the more likely they are to say it is easy to monitor and control consumption of each of these services. For example, 76% of respondents that use the Internet every day say it is easy to monitor and control mobile internet consumption, compared to 59% of those that use it often/sometimes. Daily mobile phone users (80%) are more likely than less regular users (67%-70%) to say it is easy to monitor and control mobile consumption. Respondents that use Internet communications services such as messaging, , social media or phone applications are more likely than those that do not use these services to say it is easy to monitor and control fixed or mobile Internet. For example, 77% of those that send s daily say it is easy to monitor and control mobile Internet, compared to 43% of those that never send s. 104
108 IX. COMMUNICATION SERVICE CONTRACTS 1 Experience of signing a contract in the last three years In the last three years, almost half of the respondents have signed communications service contract Respondents were asked about their experience signing contracts for a range of communication or entertainment services in the last three years 42. Almost three in ten have signed a new, renewed or amended contract mobile phone in the last three years (29%), while 14% have done so for fixed Internet access and 12% for mobile Internet. Almost one in ten have signed a contract for a bundle (9%), while 8% have done so for television and 7% for a fixed phone. Overall 49% have signed a new, renewed or amended contract in the last three years, while 50% have not. Base: All respondents (n = 27822) 42 QA13 In the last three years, have you personally signed a new, renewed, or amended contract for any of the following services? Yes, fixed Internet access; Yes, mobile Internet access; Yes, mobile phone; Yes, fixed phone; Yes, for the television; Yes, a bundle; No; Don t know. 105
109 In all but two Member States, respondents are most likely to say they have signed a new, renewed or amended mobile phone contract in the last three years. Just over half of all respondents in Sweden have done this (51%), as have 48% in Denmark, 46% in Finland and 43% in Poland. In contrast, 12% in Portugal, 17% in Belgium and Greece, and 18% in Hungary say the same. Respondents in Greece are most likely to say they signed a new, renewed or amended fixed Internet contract (18%), although respondents in Sweden, Ireland (both 26%), Denmark (25%) and Finland (24%) are more likely to say they have done this. At the other end of the scale, 5% of respondents in Austria and 6% in Italy have signed a new, renewed or amended fixed Internet contract. Just over one third of respondents in Finland have signed a new, renewed or amended mobile Internet contract (34%), followed by 26% in Sweden and 23% in Denmark. This compares to 5% in Slovenia and 7% of respondents in Lithuania, Portugal and Hungary. One quarter of respondents in Portugal have a signed new, renewed or amended contract for a bundle, as have 20% in the Netherlands. In contrast, just 3% in Lithuania and Italy have also done this. Respondents in Denmark are the most likely to have signed a contract for television (19%), followed by 16% in Poland, Sweden and Hungary. Finally, respondents in Greece (14%) and Malta (13%) are the most likely to have signed a contract for a fixed phone service, compared to just 2% in Latvia, Lithuania, the Czech Republic and Finland. 106
110 Base: All respondents (n = 27822) 107
111 The socio-demographic analysis shows that those aged 55+ are the most likely to say they have not signed a new, renewed or amended contract for any of these services (64%), particularly compared to those aged (36%). Those in the age bracket are the most likely to have signed a contract for fixed or mobile Internet, a mobile phone, television or a bundle in the last three years. For example, 20% have signed a contract for mobile Internet access, compared to 15% of those aged 15-24, 14% of those aged 40-54, and 5% of those aged 55+. Respondents that use the Internet every day are more likely than less frequent users or non-users to have signed a contract in the last three years. For instance, 36% of daily users have signed a new, renewed or amended mobile phone contract in the last three years, compared to 23% of less frequent users, and 11% of respondents that never use the Internet. Base: All respondents (n = 27822) 108
112 2 Experience of reading the terms and conditions - Only 22% read the terms about user rights in communication services contracts entirely Respondents who had signed a new, renewed of amended contract in the last three years were asked if they had read the terms about user rights 43. Overall 62% say they read these, although just 22% had read them entirely, while 40% reading them in part. More than one third (37%) did not read these terms. Base: Respondents who have signed a communications contract (n = 13545) At least one third of respondents in Lithuania, Latvia (both 35%), the Czech Republic, and Cyprus (both 34%) say they read the user rights terms in the contract entirely. Respondents in Sweden and France (both 10%) are the least likely to say they read the terms of the contract entirely. Overall, at least half of all respondents in 25 Member States at least partly read the terms in their communications contract about user rights. Respondents in the Czech Republic (82%), Lithuania (79%), Latvia (76%) are the most likely to have read these terms. While those in France (41%), Denmark (47%) and Sweden (48%) are least likely to have done so. It is important to note that respondents who say they partly read the contract may have read only a very limited part of the content (e.g. the cover and the end page of the contract). 43 QA14 The last time you signed a contract for a communications service, did you read the terms of the contract about user rights? Yes, entirely; Yes, partly; No; Don t know. 109
.")
113 Base: Respondents who have signed a communications contract (n = 13545) The socio-demographic analysis reveals few notable differences. Those with the lowest education levels are the least likely to have read the user rights terms of their contract to any extent (54%). In particular, they are less likely to have read these terms in full (16% vs % of those with higher education levels). Respondents who say they read the contract terms last time they signed a contract for a communications service are more likely to say they can easily compare their current bundle offer with other offers (83% of those who read entirely and 75% of those who read in part vs. 64% of those who did not read). Moreover, respondents who read the contract are more likely to say they or someone in their household have changed bundle service provider at least once (76% of those who read entirely and 73% of those who read in part vs. 63% of those who did not read). Bundle owners who have never changed bundle provider, and who read the last communications contract they signed, are less likely to be inertial consumers (18% of those who read entirely and 21% of those who read in part vs. 28% of those who did not read) and more likely to be active consumers (76% of those who read entirely and 73% of those who read in part vs. 63% of those who did not read) when it comes to reasons for not changing their bundle provider. Respondents who read the last communications contract they signed entirely are more likely than those who only partly read it to agree it provided sufficient and clear information on the quality of services (88% vs. 79%), termination conditions (87% vs. 75%), and duration and renewal conditions (91% vs. 81%). 110
114 Base: Respondents who have signed a communications contract (n = 13545) 111
115 3 The quality of the information - Most have a high level of satisfaction with the information provided in telecommunications contracts - Respondents that had read their communications contract before signing it were asked the extent to which they agree with a three statements about the information it contained 44. More than eight in ten agree the contract had sufficient and clear information about the duration and renewal or roll over conditions (84%), while almost as many (83%) agree there was sufficient and clear information about the quality of services subscribed to. More than three quarters (79%) agree there was sufficient and clear information about the termination of the contract. In most cases there is a fairly even split between those that totally agree, and those that tend to agree. However, respondents are more likely to tend to agree (49%) the contract had sufficient and clear information about the quality of the services subscribed to, than they are to totally agree (34%). Base: Respondents who read the last communications contract they signed (n = 8486) 44 QA15 "Please tell me whether you agree or disagree with each of the following statements. The contract you signed provided sufficient and clear information on QA15.1 The quality of the services subscribed to (%); QA15.2The termination (including possible charges for early cancellation); QA15.3 Its duration and renewal or roll over conditions. 112
116 In each Member State, at least three quarters of respondents who had read their communications contract before signing it agree that the contract had sufficient and clear information about the duration and renewal or roll over conditions 45. Respondents in Cyprus, Lithuania (both 92%), Slovakia (91%), Romania and Greece (both 90%) are the most likely to agree, while those in Denmark are the least likely to do so (75%). Base: Respondents who read the last communications contract they signed (n = 8486) In each Member State, a large majority of respondents also agree the contract had sufficient and clear information about the quality of services subscribed to. In fact, in 18 Member States at least eight in ten agree 46. Those in Cyprus (94%), Ireland, Austria and Romania (all 90%) are the most likely to agree, compared to 65% in the Netherlands. Base: Respondents who read the last communications contract they signed (n = 8486) 45 Due to low base sizes, care should be taken when interpreting the results from Cyprus (143), Malta (133) and Luxembourg (132). 46 Due to low base sizes, care should be taken when interpreting the results from Cyprus (143), Malta (133) and Luxembourg (132). 113
117 At least nine out of ten respondents in Slovakia (90%) agree the contract had sufficient and clear information about the termination of the contract, followed by 86% of those in Greece, the UK and Austria. This compares to 67% in Luxembourg and 70% in France. Base: Respondents who read the last communications contract they signed (n = 8486) 114
 was not satisfied at all.")
118 Overall, most of the respondents who had read their last communications contract had a high level of satisfaction 47 with the information it contained (68%), 16% had a medium level of satisfaction, while 9% had low satisfaction. A small proportion (7%) was not satisfied at all. Base: Respondents who read the last communications contract they signed (n = 8486) In all but one Member State, the majority of respondents who read the last communications contract they signed have a high level of satisfaction with the information it contained. Respondents in Slovakia (82%), Cyprus (81%), Greece and Lithuania (both 78%) are the most likely to be highly satisfied, compared to 49% of those in the Netherlands. At least one in ten respondents in Spain, Portugal (both 13%), Denmark (11%), Poland and Luxembourg (both 10%) express no satisfaction with the information in their communications contract. Base: Respondents who read the last communications contract they signed (n = 8486) 47 High satisfaction = total agree with all 3 items; Medium satisfaction= total agree with 2 items; Low satisfaction = total agree with one item; No satisfaction = total agree with no item or don t know in any of the 3 items. 115
119 4 Longer Internet contract in exchange for much higher speed and enhanced quality - Most would not sign a longer communications service contract in exchange for faster speeds or improved quality - Respondents with an Internet connection in the household were asked whether they would be prepared to sign a contract for a period of more than two years in exchange for much higher speed and enhanced service quality 48. Almost four in ten (38%) say they would, although just 11% would certainly do this. A slight majority (55%) would not sign a longer contract under these conditions in fact, 29% say they certainly would not. Base: Respondents with Internet connection in the household (n = 19642) 48 QA17. The maximum duration of a communication services contract is currently two years. Would you be prepared to sign a contract with a provider for a longer period in exchange for a much higher speed and enhanced quality of service? Yes, certainly; Yes, probably; No, probably not; No, certainly not; Don't know. 116

120 In three Member States, at least half of all respondents would sign a longer contract in return for faster speeds and enhanced service: Estonia (56%), Denmark (53%) and Latvia (51%). In contrast, 27% of respondents in Spain and 28% in the Netherlands say the same. Cyprus (22%), Malta (21%) and Estonia (20%) are the only countries where at least one in five would certainly sign a contract for a period of more than two years in exchange for much higher speed and enhanced service quality. Base: Respondents with Internet connection in the household (n = 19642) The socio-demographic analysis highlights the following: The older the respondent, the less likely they are to be prepared to sign a contract for a period of more than two years in exchange for much higher speed and enhanced service quality: 46% of year olds would do this, compared to 29% of those aged 55+. The larger the household a respondent lives in, the more likely they are to be prepared to do this: 33% of respondents in one person households would do this, compared to 41% of those in households with four or more people. Respondents aged 60+ living in single person households (23%) are less likely than younger respondents living in single households (38% - 41%) to be prepared to do this. Respondents who say they have read the last communications contract they signed are more likely to be prepared to sign a longer contract than those who say they have not read it at all: almost half (46%) of those who read the contract entirely and 41% of those who read the contract partly would do this, compared to 35% who have not read it at all. Perhaps not surprisingly, the most regular users of the Internet are also the most likely to be prepared to sign a contract for a period of more than two years in exchange for these improvements. Four in ten daily users would be prepared to do this (40%), compared to 31% of occasional users and just 19% of those that never use the Internet. Furthermore, respondents that never undertake a range of communications activities such as using Internet instant messaging, or sending s are less likely to be willing to sign a longer contract, compared to those that do these things at least occasionally. For example, 26% of respondents that never send s would be prepared to sign a contract for a period of more than two years in exchange for much higher speed and enhanced service quality, compared to 39% of those who send s daily. 117

121 Base: Respondents with Internet connection in the household (n = 19642) 118
122 X. KNOWLEDGE OF THE EUROPEAN EMERGENCY NUMBER Calling the emergency number in one s own country - More than six in ten would call 112 in an emergency within their country - Respondents were asked the number they would call if they had an emergency in their country 49. Most (61%) would call 112, while 26% would call the national emergency number. Just over one in ten (13%) would call another number, while 6% do not know what number they would call. The proportion that would call 112 has increased slightly since 2014 (+3 percentage points), as has the proportion that would call the national number (+2 pp). The proportion mentioning other numbers has decreased by three points. Base: All respondents (n = 27822) The majority of respondents in 23 Member States would call 112 in the event of an emergency in their country. In fact, almost all respondents in Finland (99%), the Netherlands (98%), Portugal, and Sweden (both 97%) would do this. On the other hand, 6% of respondents in Greece, 9% in the UK and 19% in France would call 112. The majority of respondents in France (79%), Austria (55%), the UK and Greece (both 54%) would call their national number in the event of an emergency in their country. Respondents in Ireland (42%), the UK (36%) and Greece (31%) are the most likely to say they would call another number. More than one in five respondents in Cyprus (21%), as well as 17% in Malta, 12% in Spain, 11% in Greece and Hungary and 10% in Italy say they do not know what number they would call in an emergency in their country. 49 QA18 Can you tell me what telephone number you would call in the event of an emergency in (OUR COUNTRY); for example, if someone needs urgent medical assistance or if you need to contact the police or the fire brigade? 119
123 Base: All respondents (n = 27822) Since 2014, the proportion of respondents that would call 112 has increased by at least 3 points in eleven Member States. The increase has been particularly dramatic amongst respondents in Cyprus (+20 pp), followed by the increases observed in Malta (+9 pp), Hungary and Poland (both +7 pp). On the other hand, the proportion that would call 112 in the Czech Republic and Croatia has decreased by six points. 120
124 Respondents in Austria, the Czech Republic (both +13 pp) and Greece (+10 pp) are more likely to say they would call their national number than they were in The reverse is true in Cyprus (-12 pp) and Bulgaria (-10 pp). Respondents in the UK are less likely to mention other numbers than they were in 2014 (-11 pp), while those in Cyprus are more likely to do so (+9 pp). Base: All respondents (n = 27822) 121
125 The socio-demographic analysis shows the oldest respondents are the least likely to say they would call 112: 56% gave this number, compared to 63% of year olds, 65% of year olds, and 62% of year olds. In addition, the higher the respondent s education level, the more likely they are to say they would call 112. For example, 53% with the lowest education levels would call 112, compared to 66% of those who completed education aged 20+. Interestingly, respondents who only have access to a mobile phone (67%) are more likely than those who only have a landline (43%), or those that have landline and mobile access (59%) to say they would call 112. Base: All respondents (n = 27822) 122
126 2 Calling the emergency number anywhere in the EU Almost half correctly identify 112 as the single European emergency call number for anywhere in the Union Respondents were asked the telephone number that allows them to call emergency services anywhere in the EU 50. Almost half (46%) correctly identified 112 as the single number to call throughout the EU. Overall (48%) mentioned 112 (either alone, or along with another number), while 13% mentioned other numbers. Four in ten (40%) could not say what number to call. Awareness of 112 as the single number to call has increased by six percentage points since 2014, and mentions of 112 along with another number have increased by seven points. Base: All respondents (n = 27822) 50 QA19 Can you tell me what telephone number enables you to call emergency services anywhere in the EU? 123
127 In 16 Member States at least half of all respondents identify 112 as the single number to call anywhere in the EU in the event of an emergency. Respondents in Poland (82%), Luxembourg (78%) and Slovakia (70%) are the most likely to only identify 112, while those in Greece (13%) and the UK (22%) are the least likely to do so. Respondents in Ireland (30%), Italy (26%) and Austria (25%) are the most likely to mention other numbers to call, compared to 5% in Bulgaria and 6% in Estonia. More than six in ten respondents in Spain (64%), Greece (63%) and the UK (61%) say they do not know the number to call emergency services anywhere in Europe. Since 2014, the proportion of respondents in Cyprus that only give 112 as their answer has increased by 20 percentage points. There have also been considerable increases in awareness that 112 is the single number to call amongst respondents in Germany (+18 pp), Hungary, Portugal and Estonia (all +17 pp). In contrast, the proportion of respondents in Romania (-9 pp) and Bulgaria (-9 pp) that only give 112 as their answer has decreased. 124
128 Base: All respondents (n = 27822) 125
.")
129 Socio-demographic analysis highlights that men are more likely than women to give only the correct answer (112) (50% vs 43%). Those aged 55+ are least likely to give only the correct answer, particularly compared to those aged (39% vs 53%). The longer a respondent remained in education, the more likely they are to give 112 as their only answer: 31% of those with the lowest levels say this, compared to 55% who completed education aged 20+. Respondents that only have mobile phone access in their household are the most likely to correctly give 112 as their only answer (52%), compared to those with landline and mobile access (45%) and landline only access (26%). More than six in ten respondents who would call 112 in an emergency in their own country also know that 112 is the single European emergency number that can be used in any Member State (63%). Furthermore, only 32% of those that would call their national emergency number in their own country know that 112 is the single European emergency number. Base: All respondents (n = 27822) 126


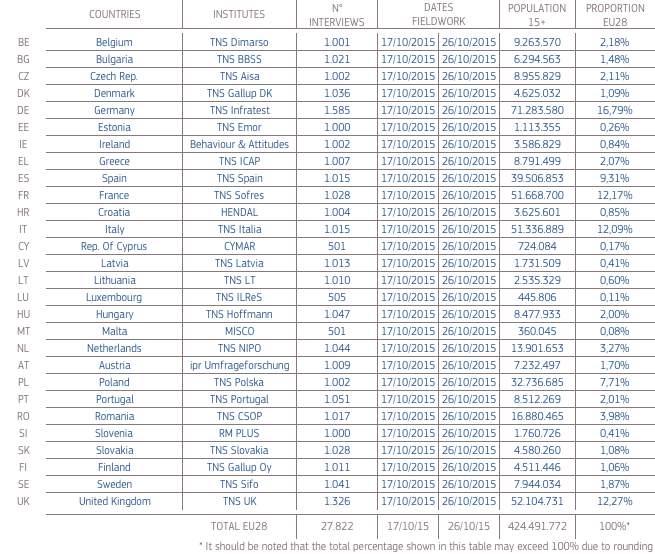
130


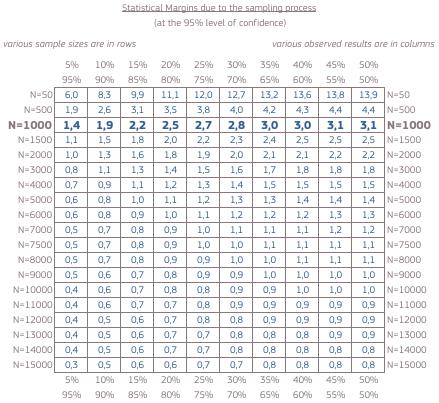
131
Flash Eurobarometer 468. Report. The end of roaming charges one year later
 The end of roaming charges one year later Survey requested by the European Commission, Directorate-General for Communications Networks, Content & Technology and co-ordinated by the Directorate-General
Flash Eurobarometer 443. e-privacy
 Survey conducted by TNS Political & Social at the request of the European Commission, Directorate-General for Communications Networks, Content & Technology (DG CONNECT) Survey co-ordinated by the European
E-COMMUNICATIONS HOUSEHOLD SURVEY
 Special Eurobarometer 396 E-COMMUNICATIONS HOUSEHOLD SURVEY SUMMARY Fieldwork: February - March 2013 Publication: November 2013 This survey has been requested by the European Commission, Directorate-General
E-Communications Household Survey
 Special Eurobarometer 293 European Commission E-Communications Household Survey Fieldwork November December 2007 Publication June 2008 Summary Special Eurobarometer 293 / Wave 68.2 TNS opinion & social
The 13 th Progress Report on the Single European Telecoms Market 2007: Frequently Asked Questions
 MEMO/08/17 Brussels, 19 March 2008 The 13 th Progress Report on the Single European Telecoms Market 2007: Frequently Asked Questions 1. What is the objective of the 13 th Progress Report on the Single
in focus Statistics Telecommunications in Europe Contents INDUSTRY, TRADE AND SERVICES 8/2005 Author Martti LUMIO
 Telecommunications in Europe Statistics in focus INDUSTRY, TRADE AND SERVICES 8/2005 Author Martti LUMIO Contents The main telephone lines are more and more subject to competition from the mobile telephone
Flash EB N o 251 Public attitudes and perceptions in the euro area. Analytical report. Fieldwork: September 2008 Publication: November 2008
 Flash Eurobarometer 241 The Gallup Organization Analytical Report Flash EB N o 1 Public attitudes and perceptions in the euro area Flash Eurobarometer European Commission Information society as seen by
BoR (10) 13. BEREC report on Alternative Retail Voice and SMS Roaming Tariffs and Retail Data Roaming Tariffs
 13. BEREC report on Alternative Retail Voice and SMS Roaming Tariffs and Retail Data Roaming Tariffs") BEREC report on Alternative Retail Voice and SMS Roaming Tariffs and Retail Data Roaming Tariffs March 2010 1. Background Regulation 544/2009 of 18 June 2009 on international roaming 1 requires all operators
BEREC report on Alternative Retail Voice and SMS Roaming Tariffs and Retail Data Roaming Tariffs March 2010 1. Background Regulation 544/2009 of 18 June 2009 on international roaming 1 requires all operators
BoR (11) 08. BEREC Report on Alternative Voice and SMS Retail Roaming Tariffs and Retail Data Roaming Tariffs
 08. BEREC Report on Alternative Voice and SMS Retail Roaming Tariffs and Retail Data Roaming Tariffs") BEREC Report on Alternative Voice and SMS Retail Roaming Tariffs and Retail Data Roaming Tariffs February 2011 1. Overview This BEREC Report on Alternative Retail Voice and SMS Roaming Tariffs and Retail
BEREC Report on Alternative Voice and SMS Retail Roaming Tariffs and Retail Data Roaming Tariffs February 2011 1. Overview This BEREC Report on Alternative Retail Voice and SMS Roaming Tariffs and Retail
E-Communications Household Survey. Summary
 Special Eurobarometer European Commission E-Communications Household Survey Fieldwork December 2005 January 2006 Publication July 2006 Summary Special Eurobarometer 249 / Wave 64.4 TNS Opinion & Social
1. Camera View. 2. First Time Use
 1. Camera View 1. USB Terminal 2. Micro SD Slot 3. Speaker 4. Lens 5. Microphone 6. Status Screen 7. Shutter Button 8. Power Button 9. Mode Button 10. Microphone 11. LED Indicator 12. Tripod Screw Hole
User Manual for the delivery of a new national Natura 2000 database to the Commission. Version 1.1
 User Manual for the delivery of a new national Natura 2000 database to the Commission Version 1.1 The Natura 2000 network of protected sites consists of the sites classified under the Birds Directive first
Origin and availability of On -Demand services in the European Union
 A publication of the European Audiovisual Observatory Origin and availability of On -Demand services in the European Union November 15 Gilles Fontaine and Agnes Schneeberger Director of publication Susanne
TMview - Euroclass Seminar on Community trade mark and design protection Sophia Bonne, ICLAD, OHIM Rospatent, Moscow, Russian Federation 7 March 2012
 TMview - Euroclass Seminar on Community trade mark and design protection Sophia Bonne, ICLAD, OHIM Rospatent, Moscow, Russian Federation 7 March 2012 TMview What is TMview? TMview is an online consultation
BoR (18) 41. BEREC preliminary analysis of intra-eu calls
 41. BEREC preliminary analysis of intra-eu calls") BEREC preliminary analysis of intra-eu calls 26 February, 2018 Contents Executive summary... 2 1. Background... 3 2. Data... 5 3. Preliminary analysis of derived metrics... 7 3.1. Intra-EU calls originating
BEREC preliminary analysis of intra-eu calls 26 February, 2018 Contents Executive summary... 2 1. Background... 3 2. Data... 5 3. Preliminary analysis of derived metrics... 7 3.1. Intra-EU calls originating
BROADBAND TAKE-UP DRAMATICALLY SLOWS ACROSS EUROPE. ECTA blames rise in monopolies
 Release Immediate BROADBAND TAKE-UP DRAMATICALLY SLOWS ACROSS EUROPE ECTA blames rise in monopolies Brussels, 01.02.07 The European Competitive Telecommunications Association (ECTA) has reported a significant
EUROPEAN COMMISSION EUROSTAT. Directorate G :Global Business Statistics Unit G-2: Structural business statistics and global value chains
 EUROPEAN COMMISSION EUROSTAT Directorate G :Global Business Statistics Unit G-2: Structural business statistics and global value chains MEETING OF THE BUSINESS DEMOGRAPHY WORKING GROUP 18 MAY 2015 BECH
BASIC PRICE LIST. The price of transportation is added toll in the amount of CZK 1,30 / kg and the current fuel surcharge.
 BASIC PRICE LIST Shipping weight Shipment to 1 kg 5 kg 10 kg 15 kg 20 kg 25 kg 30 kg 40 kg 50 kg Delivery time BE BELGIUM 445 700 720 760 830 860 890 1050 1120 2-3 days BG BULGARIA 520 915 1485 2050 2620
1 kg 5 kg 10 kg 15 kg 20 kg 25 kg 30 kg 40 kg 50 kg
 BASIC PRICE LIST Shipping weight Shipment to 1 kg 5 kg 10 kg 15 kg 20 kg 25 kg 30 kg 40 kg 50 kg Delivery time BE BELGIUM 445 700 720 760 830 860 890 1050 1120 2-3 days BG BULGARIA 520 915 1485 2050 2620
COMMUNICATIONS COMMITTEE
 EUROPEAN COMMISSION Directorate-General for Communications Networks, Content and Technology Electronic Communications Networks and Services Implementation of the Regulatory Framework Brussels, 10 February
European Cybersecurity cppp and ECSO. org.eu
 European Cybersecurity cppp and ECSO www.ecs org.eu ABOUT THE EUROPEAN CYBERSECURITY PPP A EUROPEAN PPP ON CYBERSECURITY The European Commission has signed on July 2016 a PPP with the private sector for
Broadband Coverage in Europe Final Report 2007 Survey Data as of 31 December 2006
 Broadband Coverage in Europe Final Report 2007 Survey Data as of 31 December 2006 DG INFSO October 2007 IDATE 1 Methodological Issues Table of contents 1. Methodological issues...5 2. Executive summary...7
Transparency through Information
 Transparency through Information Who we are Our Statute & Resources The European Audiovisual Observatory was created in 1992 and, as part of the Council of Europe, is based in Strasbourg, France. The budget
Autorità per le garanzie nelle comunicazioni
 Autorità per le garanzie nelle comunicazioni Quarterly munication Markets Observatory (*) - Updated to 30 September 2012 - (*) Data provided by operators and elaborated by Agcom. - 1 - Index Focus - LLU
Connectivity Broadband market developments in the EU
 Connectivity Broadband market developments in the EU Digital Agenda Scoreboard 215 The Digital Economy and Society Index (DESI) is a composite index that summarises relevant indicators on Europe s digital
Broadband Coverage in Europe Final Report 2008 Survey Data as of 31 December 2007
 Broadband Coverage in Europe Final Report 2008 Survey Data as of 31 December 2007 DG INFSO December 2008 IDATE 1 Table of contents 1. Methodological issues...5 2. Executive summary...7 3. European benchmark...10
BASIC PRICE LIST OF TRANSPORT TO BUSINESS ADDRESSES /B2B/
 BASIC PRICE LIST OF TRANSPORT TO BUSINESS ADDRESSES /B2B/ Shipping weight Shipment to 1 kg 5 kg 10 kg 15 kg 20 kg 25 kg 30 kg 40 kg Delivery time BE BELGIUM 445 700 720 760 830 860 890 1050 2-3 days BG
Cost Saving Measures for Broadband Roll-out
 Cost Saving Measures for Broadband Roll-out out Izmir, 22 February 2013 Petri Koistinen, DG CONNECT The views expressed in this presentation may not in any circumstances be regarded as stating an official
The Labour Cost Index decreased by 1.5% when compared to the same quarter in 2017
 Q1-11 Q1-09 Q2-09 Q3-09 Q4-09 Q1-10 Q2-10 Q3-10 Q4-10 Q1-11 Q2-11 Q3-11 Q4-11 Q1-12 Q2-12 Q3-12 Q4-12 Q1-13 Q2-13 Q3-13 Q4-13 Q1-14 Q2-14 Q3-14 Q4-14 Q1-15 Q1-12 Q1-13 Q1-14 Q1-15 Q1-16 Q1-17 Q1-18 Q1-11
MRP/DCP Tracking Table Description Version 1.0. May 2008
 MRP/DCP Tracking Table Description Version 1.0 May 2008 Document Control Change Record Version Date Author(s) Comments 0.1 (RC1) May, 2008 Laurent Desqueper Draft 0.1 (RC2) May, 2008 Laurent Desqueper
ehaction Joint Action to Support the ehealth Network
 Stakeholder Engagement - Consultation (22 August 2017) ehaction Joint Action to Support the ehealth Network 3 rd Joint Action to Support the ehealth Network Open Consultation 1 Participants of the 3 rd
Digital EAGLEs. Outlook and perspectives
 2016 Digital EAGLEs Outlook and perspectives Fixed and Mobile broadband adoption rates in the next decade Changes in Fixed-Broadband penetration 2014-25 Changes in Mobile-Broadband penetration 2014-25
European Hospital Survey: Benchmarking Deployment of e-health Services ( ) Country Reports
 Country Reports") European Hospital Survey: Benchmarking Deployment of e-health Services (2012 2013) Country Reports Author: Ramon Sabes-Figuera Editor: Fabienne Abadie 2 0 1 3 Report EUR 26357 EN European Commission Joint
European Hospital Survey: Benchmarking Deployment of e-health Services (2012 2013) Country Reports Author: Ramon Sabes-Figuera Editor: Fabienne Abadie 2 0 1 3 Report EUR 26357 EN European Commission Joint
Digital Dividend harmonisation in Europe
 Presentation to ATU Digital Migration and Spectrum Policy Summit Digital Dividend harmonisation in Europe Nairobi, 30 November 2011 Robert Schumann 2 Analysys Mason has conducted two major European studies
Framework for Universal Service in Poland. Eastern Partnership (EaP) workshop Vienna, October 7 th -8 th, 2010
 workshop Vienna, October 7 th -8 th, 2010") Framework for Universal Service in Poland Eastern Partnership (EaP) workshop Vienna, October 7 th -8 th, 2010 AGENDA: 1. Telecom market overview 2. Current status of Universal Service in Poland 3. Universal
Framework for Universal Service in Poland Eastern Partnership (EaP) workshop Vienna, October 7 th -8 th, 2010 AGENDA: 1. Telecom market overview 2. Current status of Universal Service in Poland 3. Universal
NATIONAL BROADBAND STRATEGY IN THE REGION OF CENTRAL AND SOUTH EAST EUROPE (overview, market structure, challenges, recommendations)
") NATIONAL BROADBAND STRATEGY IN THE REGION OF CENTRAL AND SOUTH EAST EUROPE (overview, market structure, challenges, recommendations) Boris Jevrić Agency for Electronic Communications and Postal Services
NATIONAL BROADBAND STRATEGY IN THE REGION OF CENTRAL AND SOUTH EAST EUROPE (overview, market structure, challenges, recommendations) Boris Jevrić Agency for Electronic Communications and Postal Services
THE STATE OF ONLINE VIDEO 2017
 EXPERIENCE FIRST MARKET RESEARCH THE STATE OF ONLINE VIDEO 2017 The State of Online Video is Limelight Networks latest in a series of surveys that explores consumer perceptions and behaviors around digital
EIAA European Mobile Internet Use Executive Summary
 EIAA European Mobile Internet Use Executive Summary January 2011 1 About the EIAA European Mobile Internet Use Executive Summary The EIAA European Mobile Internet Users Executive Summary reveals pan European
The Guide Everything you need to know about our mobile services
 The Guide Everything you need to know about our mobile services FREE Wi-Fi in store www.jtglobal.com Follow us, search JTsocial Why choose JT? SUPERFAST Enjoy faster, more reliable mobile data on the go
Country-specific notes on Waste Electrical and Electronic Equipment (WEEE)
") EUROPEAN COMMISSION EUROSTAT Directorate E: Sectoral and regional statistics E-2: Environmental Statistics and Accounts; Sustainable Development Country-specific notes on Waste Electrical and Electronic
EUROPEAN COMMISSION EUROSTAT Directorate E: Sectoral and regional statistics E-2: Environmental Statistics and Accounts; Sustainable Development Country-specific notes on Waste Electrical and Electronic
Friedrich Smaxwil CEN President. CEN European Committee for Standardization
 Friedrich Smaxwil CEN President CEN European Committee for Standardization www.cen.eu www.cencenelec.eu Friedrich Smaxwil, CEN President 1. Standards & standardization 2. CEN s role in European Standardization
Connectivity Broadband market developments in the EU. Digital Economy and Society Index Report 2018 Connectivity
 Connectivity Broadband market developments in the EU Digital Economy and Society Index Report 2018 Connectivity The Digital Economy and Society Index (DESI) is a composite index that summarises relevant
Consumer Preferences in Narrowband Communications Research Report
 Consumer Preferences in Narrowband Communications Research Report Research Document Publication date: 19 March 9 Main Heading Contents Section Page 1 Executive summary 1 2 Methodology 5 3 Market context
Connectivity Broadband market developments in the EU
 Connectivity Broadband market developments in the EU Europe's Digital Progress Report 2016 The digital economy and society index (DESI) is a composite index that summarises relevant indicators on Europe
REPORT FROM THE COMMISSION TO THE EUROPEAN PARLIAMENT AND THE COUNCIL
 EUROPEAN COMMISSION Brussels, XXX [ ](2017) XXX draft REPORT FROM THE COMMISSION TO THE EUROPEAN PARLIAMENT AND THE COUNCIL on the re-examination of the WEEE recovery targets, on the possible setting of
Corporate R&D The Case of ICT Companies
 ICT in Europe: a socio-economic approach 20-21 January 2011 1 Corporate R&D The Case of ICT Companies Main results from The 2010 Report on R&D in ICT in the European Union Paul Desruelle Institute for
Intrastat Online Form A user guide to the Intrastat Online Form submission service.
 A user guide to the Intrastat Online Form submission service. Further offline and online guidance can be found at www.uktradeinfo.com/intrastat/electronicsubmission August 2017 Index Description Page Internet
Section 10: BT Mobile Section 10b: BT Business Mobile Portfolio
 Subpart 2:BT Business Mobile Sharer - orders on or after 1st December 2016 and before the 15th June 2017 All charges are stated exclusive of VAT. The charges detailed in this BT Price List Entry apply
Council of the European Union Brussels, 12 May 2017 (OR. en)
") Council of the European Union Brussels, 12 May 2017 (OR. en) 9139/17 COVER NOTE From: date of receipt: 11 May 2017 To: TELECOM 118 MI 412 IND 123 COMPET 342 PI 58 RECH 137 DIGIT 135 Secretary-General of
Council of the European Union Brussels, 12 May 2017 (OR. en) 9139/17 COVER NOTE From: date of receipt: 11 May 2017 To: TELECOM 118 MI 412 IND 123 COMPET 342 PI 58 RECH 137 DIGIT 135 Secretary-General of
Data specifications: Annex D - Reporting format on the 'main results of the surveillance under Article 11 for Annex I Habitats Types
 Data specifications: Annex D - Reporting format on the 'main results of the surveillance under Article 11 for Annex I Habitats Types Xml schema: http://bd.eionet.europa.eu/schemas/art12art17_reporting_2013/art17_habitats.xsd
The flexible mobile subscription for Switzerland, almost all European countries, the USA and Canada (Region 1) Mobile Internet in Switzerland
 Mobile Internet in Switzerland") Business europe & US The flexible mobile subscription for Switzerland, almost all European countries, the USA and Canada (Region 1) Calls and SMS/MMS: - unlimited in Switzerland - unlimited from Switzerland
Business europe & US The flexible mobile subscription for Switzerland, almost all European countries, the USA and Canada (Region 1) Calls and SMS/MMS: - unlimited in Switzerland - unlimited from Switzerland
ICT Connectivity for Trade & Development
 Committed to Connecting the World WTO Symposium on the 20 th Anniversary of the Information Technology Agreement ICT Connectivity for Trade & Development Vanessa GRAY Head of LDCs, SIDS & Emergency Telecommunications
Unlimited UK mobile calls and unlimited UK texts Bolt On: Unlimited landlines Poland Bundle (400 minutes to mobiles & landlines) 3.
 3.") Unlimited UK mobile calls and unlimited UK texts 10.60 Bolt On: Unlimited landlines 3.60 Poland Bundle (400 minutes to mobiles & landlines) 3.00 1 GB Data 2 GB Data 5 GB Data 10 GB Data BES 1GB (Blackberry
Unlimited UK mobile calls and unlimited UK texts 10.60 Bolt On: Unlimited landlines 3.60 Poland Bundle (400 minutes to mobiles & landlines) 3.00 1 GB Data 2 GB Data 5 GB Data 10 GB Data BES 1GB (Blackberry
Business swiss unlimited
 Business swiss unlimited The flexible all-flat mobile subscription for Switzerland: calls in all networks in Switzerland SMS in Switzerland surfing with high speed 4G+ Internet Roaming cost protection
Business internet start, Business internet comfort, Business internet max giga. Internet can also be purchased separately without voice.
 Sunrise Office pro Sunrise Office pro is the flexible and needs-oriented Internet and landline network solution for small businesses. Sunrise Office pro overview Sunrise Office pro Internet (3 profiles)
Mapping of the CVD models in Europe
 Mapping of the CVD models in Europe TASK FORCE ON SW VULNERABILITY DISCLOSURE IN EUROPE Brussels, 29/11/2017 Gianluca Varisco Disclaimer This preliminary mapping has been put together by: reaching out
COMMUNICATIONS COMMITTEE
 EUROPEAN COMMISSION Information Society and Media Directorate-General Policy Coordination and Strategy Economic and Statistical Analysis Brussels, 19 December 2011 DG INFSO/C4 COCOM11-24 COMMUNICATIONS
86.1% of the population aged 16 to 74 have used the Internet in the last three months. 72.1% do it on a daily basis
 07 November 2018 Survey on Equipment and Use of Information and Communication Technologies (ICT) in Households. Year 2018 86.1% of the population aged 16 to 74 have used the Internet in the last. 72.1%
GDPR General Data Protection Regulation
 GDPR General Data Protection Regulation May 25, 2018 May 25, 2018 May 25, 2018 Before we get started: 1. Yes, we are recording this webinar and will post the webinar & slides in the Post Resource Center.
COMMISSION OF THE EUROPEAN COMMUNITIES
 COMMISSION OF THE EUROPEAN COMMUNITIES Brussels, 3.7.29 SEC(29)376/2 VOLUME 1 part1 CORRIGENDUM: This document replaces Volume 1 part 1 of the document SEC(29)376 of 24 March 29. Regards only EN version
Business swiss neighbors
 Business swiss neighbors The flexible mobile subscription for Switzerland and the neighboring countries Germany, France, Italy, Austria and Liechtenstein. Calls and SMS/MMS - unlimited in Switzerland -
BoR (14) 142. Presented by ECTA in relation to the public hearing on the draft BEREC Strategy and draft BEREC Work Programme 2015
 142. Presented by ECTA in relation to the public hearing on the draft BEREC Strategy and draft BEREC Work Programme 2015") BoR (14) 142 Presented by ECTA in relation to the public hearing on the draft BEREC Strategy 2015-2017 and draft BEREC Work Programme 2015 NGA investments are steadily increasing Source: Implementation
BoR (14) 142 Presented by ECTA in relation to the public hearing on the draft BEREC Strategy 2015-2017 and draft BEREC Work Programme 2015 NGA investments are steadily increasing Source: Implementation
MAVISE EXTRA: Linear and on-demand audiovisual media services in Europe 2015
 A publication of the European Audiovisual Observatory MAVISE EXTRA: Linear and on-demand audiovisual media services in Europe June 6 Agnes Schneeberger and Gilles Fontaine Director of publication: Susanne
The Potential of ICT for Creative Learning & Innovative Teaching
 IADIS International e-society 2011 1 The Potential of ICT for Creative Learning & Innovative Teaching IADIS International e-society 2011 Romina Cachia, Anusca Ferrari &Yves Punie Joint Research Centre
EU- Labour Force Survey December 2009 release. Setup for importing the Anonymised Quaterly Data Sets for 2007
 EU-Labour Force Survey Data Service German Microdata Lab German Microdata Lab EU- Labour Force Survey December 2009 release Setup for importing the Anonymised Quaterly Data Sets for 2007 Content I. Overview
Research Report: Voice over Internet Protocol (VoIP)
") Research Report: Voice over Internet Protocol (VoIP) Statement Publication date: 26 July 2007 Contents Section Page 1 Executive Summary 1 2 Background and research objectives 3 3 Awareness of VoIP 5 4
Research Report: Voice over Internet Protocol (VoIP) Statement Publication date: 26 July 2007 Contents Section Page 1 Executive Summary 1 2 Background and research objectives 3 3 Awareness of VoIP 5 4
STANDARD BROADBAND & FIBRE BROADBAND PLANS
 STANDARD BROADBAND & FIBRE BROADBAND PLANS Terms & Conditions for Consumer Customers Version 8.0 Date 24 th October 2017 1 General You can join one of our Standard Broadband or Fibre Broadband plans. To
Quick Start Guide _01
 Quick Start Guide 902173_01 1 Your device at a glance Before you start, let's take a look at your new device. To power on your device, press and hold the power button until the screen turns on. To power
Mobile Access July 7, 2010 Aaron Smith, Research Specialist.
 Mobile Access 2010 Six in ten Americans go online wirelessly using a laptop or cell phone; African-Americans and 18-29 year olds lead the way in the use of cell phone data applications, but older adults
Integration of Economic and Construction Outlooks: A Case Study. Lorenz Kleist Consultant October 6, 2009
 Integration of Economic and Construction Outlooks: A Case Study Lorenz Kleist Consultant October 6, 2009 The Client The European Rental Association (ERA) ERA is a young European association ERA represents
TELIA YHTEYS PUHELIMEEN SERVICE DESCRIPTION
 This service description tells you what your service includes. The service description is part of your Telia Yhteys puhelimeen agreement. Telia Yhteys puhelimeen (hereafter the subscription ) is a consumer
icims Browser & Version Support Policy
 icims Browser & Version Support Policy Last Updated Date: Page 1 Proprietary. Copyright 2018 icims, Inc. All rights reserved. Table of Contents Table of Contents... 2 Browser Support Policy for the icims
WFD Art. V groundwater body data gap analysis
 EEA/ADS/06/001 Water WFD Art. V groundwater body data gap analysis Version: 2.0 Date: 15 September, 2008 EEA activity: ETC/Water task.milestone.submilestone: Task 4.2 Prepared by / compiled by: Vit Kodes
Six million households have access to Internet, 6% more than in the first quarter of 2006
 30 of March of 2007 Survey on Equipment and Use of Information and Communication Technologies in Households. Second half of 2006 Six million households have access to Internet, 6% more than in the first
TERMS AND CONDITIONS FOR SIM ONLY PLANS ON EE 12 MONTH AND 30 DAY PLANS
 TERMS AND CONDITIONS FOR SIM ONLY PLANS ON EE 12 MONTH AND 30 DAY PLANS FROM 4 November 2016 Version 1.0 Date 04.11.16 To be eligible to join a SIM only plan on EE, you will need to pass our standard credit
Mobile Internet & Smartphone Adoption
 Mobile Internet & Smartphone Adoption New Insights into Consumer Usage of Mobile Devices, the Shift to Smartphones & the Emergence of Tablets United States (US), United Kingdom (UK), Germany (DE), France
SURVEY ON APPLICATION NUMBERING SYSTEMS
 Ref.: Examples and IPO practices page: 7..5.0 SURVEY ON APPLICATION NUMBERING SYSTEMS Editorial note by the International Bureau The following survey presents the information on various aspects of application
COMMISSION STAFF WORKING DOCUMENT. Europe's Digital Progress Report 2016
 EUROPEAN COMMISSION Brussels, 25.5.2016 SWD(2016) 187 final PART 1/5 COMMISSION STAFF WORKING DOCUMENT Europe's Digital Progress Report 2016 EN EN Europe s digital progress report 2016 Contents Introduction
EUROPE ERICSSON MOBILITY REPORT APPENDIX NOVEMBER
 EUROPE ERICSSON MOBILITY REPORT APPENDIX NOVEMBER 2014 MARKET OVERVIEW Key figures: Europe M 2014 2020 CAGR 2014 2020 Mobile subscriptions (million) Smartphone subscriptions (million) Total mobile traffic
Digital Agenda Scoreboard 2017 Electronic communications market indicators: Definitions, methodology and footnotes on Member State data
 Digital Agenda Scoreboard 2017 Electronic communications market indicators: Definitions, methodology and footnotes on Member State data Financial indicators, fixed and mobile telephony, broadcasting and
Assessing Broadband in America. By Phil Heidenreich
 Assessing Broadband in America By Phil Heidenreich In the American Recovery and Reinvestment Act passed by Congress and signed into law by President Obama earlier this year, a provision was made for a
Connecting O2 business customers all over the world. Anjuli Valera
 Connecting O2 business customers all over the world Anjuli Valera Roaming is not a positive subject in customer satisfaction There are 3 key reasons why roaming is an area of dissatisfaction with our customers
Results of the Energy Efficiency Watch Project: Progress in Energy Efficiency Policies in EU Member States
 Results of the Energy Efficiency Watch Project: Progress in Energy Efficiency Policies in EU Member States Dr. Stefan Thomas Director, Research Group Energy, Transport and Climate Policy for Climate, Environment
Costs Depending on the customer. Mobile Internet in Switzerland. 0.5 GB/month included
 Business swiss start The flexible mobile subscription for Switzerland: unlimited intra-company calls Unlimited calls on Sunrise mobile Unlimited calls to three numbers of your choice in other Swiss networks
WORKSHOP ON ALL WEEE FLOWS 14/02/17 Alberto Canni Ferrari ERP Italy Country General Manager
 WORKSHOP ON ALL WEEE FLOWS 14/02/17 Alberto Canni Ferrari ERP Italy Country General Manager ENGINEERING CIRCULAR ECONOMY www.landbell-group.com WORKSHOP ON ALL WEEE FLOWS ERP ITALY & THE LANDBELL GROUP
Business swiss calls. Mobile subscription. The flexible mobile subscription for Switzerland:
 Business swiss calls The flexible mobile subscription for Switzerland: Unlimited calls in all networks in Switzerland Unlimited SMS in Switzerland Unlimited surfing in Switzerland 4G+ high speed up to
STANDARD BROADBAND & FIBRE BROADBAND PLANS
 STANDARD BROADBAND & FIBRE BROADBAND PLANS Terms & Conditions for Consumer Customers Version 1.0 Date 26 th June 2018 1 General You can join one of our Standard broadband, Fibre broadband, Fibre Plus broadband,
IBM offers Software Maintenance for additional Licensed Program Products
 Announcement ZS10-0142, dated October 5, 2010 IBM offers Software Maintenance for additional Licensed Program Products Table of contents 1 Overview 3 Description 1 Key prerequisites 4 Prices 2 Planned
Inclusive Minute Business Plan Terms 7 th Oct General
 Inclusive Minute Business Plan Terms 7 th Oct 2010 General 1. With the exception of Simplicity Plans, Connection to an O2 Inclusive Minute Business Plan is subject to status, credit-check and the terms
Global Mobile Consumer Survey US results
 Global Mobile Consumer Survey US results Copyright 2017 Deloitte Development LLC. All rights reserved. Deloitte Global Mobile Consumer Survey, 2017 1 Deloitte Global Mobile Consumer Survey 2017 6 continents
Network performance through the eyes of customers
 ericsson.com/ mobility-report Network performance through the eyes of customers Extract from the Ericsson Mobility Report June 2018 2 Articles Network performance through the eyes of customers Understanding
Where is the EU in cloud security certification?: Main findings
 WE CAN DO SO MUCH TOGETHER Where is the EU in cloud security certification?: Main findings Certification schemes for cloud computing SMART 2016 / 0029 Leire Orue-Echevarria TECNALIA December 11 th, 2017
PAY MONTHLY ADDITIONAL SERVICES TERMS AND CONDITIONS
 4GEE PHONE PLANS ADDITIONAL SERVICES (ALL STANDARD 12, 18 AND 24 MONTH PLANS INCLUDING SIM ONLY PLANS) The following add-ons are available on your plan. We reserve the right to change the add-ons available
EU Countries mhealth App Market Ranking 2015
 EU Countries mhealth App Market Ranking 2015 Which EU countries are best for doing mhealth business www.mhealtheconomics.com A benchmarking analysis of 28 EU countries about their market readiness for
EXPOFACTS. Exposure Factors Sourcebook for Europe GENERAL
 EXPOFACTS Exposure Factors Sourcebook for Europe GENERAL 10.7.2006 This document describes the general structure of ExpoFacts Sourcebook, as well as the principles according to which data have been collected
testo CO/CO2 measuring instrument Instruction manual
 testo 315-3 CO/CO2 measuring instrument Instruction manual 2 1 Contents 1 Contents 1 Contents... 3 2 Safety and the environment... 4 2.1. About this document... 4 2.2. Ensure safety... 5 2.3. Protecting
COMMISSION OF THE EUROPEAN COMMUNITIES
 COMMISSION OF THE EUROPEAN COMMUNITIES Brussels, 19.3.2008 COM(2008) 153 final COMMUNICATION FROM THE COMMISSION TO THE EUROPEAN PARLIAMENT, THE COUNCIL, THE EUROPEAN ECONOMIC AND SOCIAL COMMITTEE AND
EUREKA European Network in international R&D Cooperation
 DLR-PT.de Chart 1 > EUREKA Andrea Hesse 2nd June 2016 EUREKA European Network in international R&D Cooperation DLR-PT - National EUREKA Bureau Andrea Hesse TRAINING DLR-PT.de Chart 2 > EUREKA Andrea Hesse
November 2016 G. Oscar Anderson, Senior Research Advisor AARP Research
 November 2016 G. Oscar Anderson, Senior Research Advisor AARP Research https://doi.org/10.26419/res.00140.001 AARP is a nonprofit, nonpartisan organization, with a membership of nearly 38 million that
Mobile Broadband: Commercial Accelerator - Regulatory Brake
 Mobile Broadband: Commercial Accelerator - Regulatory Brake Presentation to EETT Conference Next Generation Access Networks Athens, June 18, 2010 Eirini Nikolaidi, General Counsel, General Director of