SPC BENCHMARK 1 FULL DISCLOSURE REPORT DATACORE SOFTWARE CORPORATION DATACORE SANSYMPHONY-V 10.0 SPC-1 V1.14
|
|
|
- Horace Newman
- 6 years ago
- Views:
Transcription


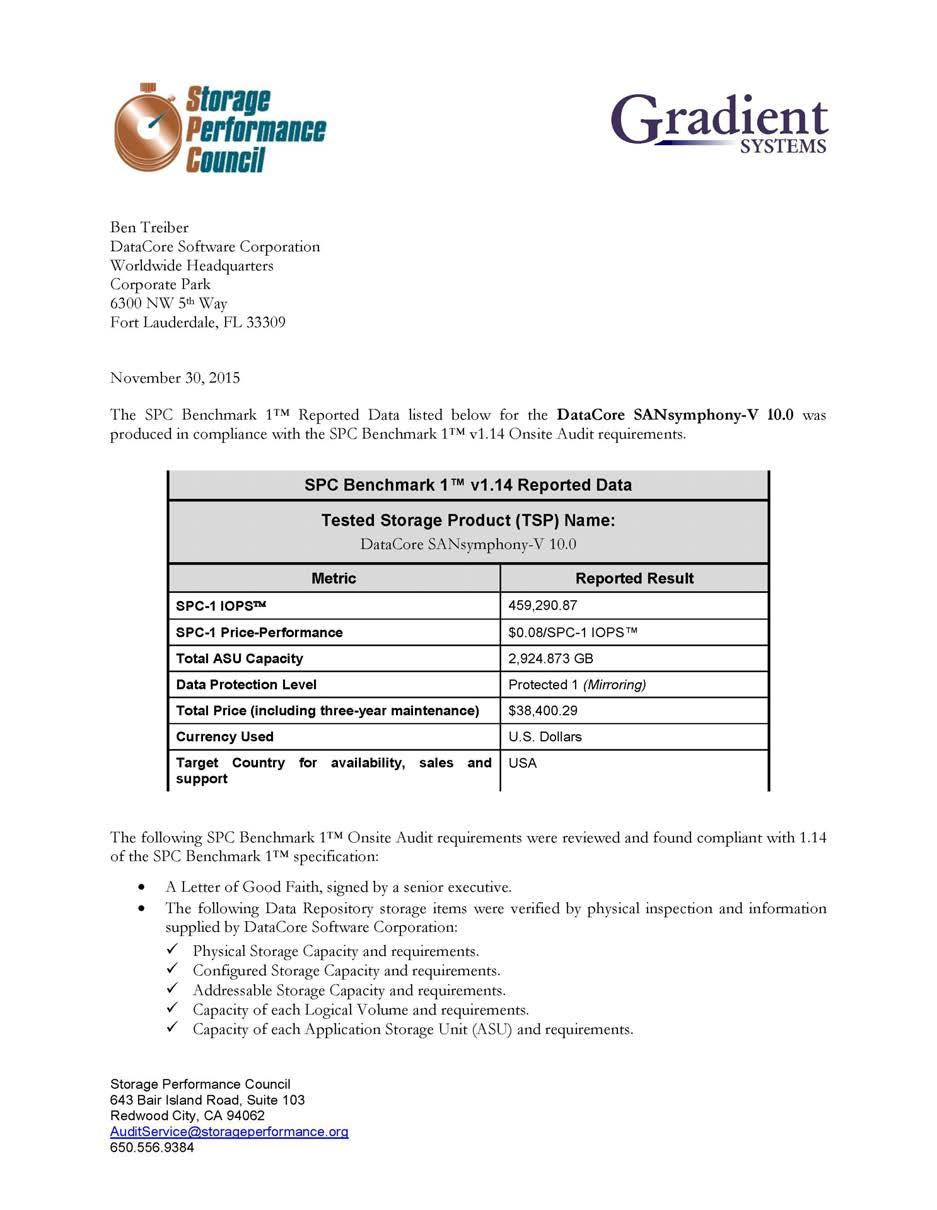
1 SPC BENCHMARK 1 FULL DISCLOSURE REPORT DATACORE SOFTWARE CORPORATION DATACORE SANSYMPHONY-V 10.0 SPC-1 V1.14 Submitted for Review: November 30, 2015 Submission Identifier: A00164
2 ii First Edition November 2015 THE INFORMATION CONTAINED IN THIS DOCUMENT IS DISTRIBUTED ON AN AS IS BASIS WITHOUT ANY WARRANTY EITHER EXPRESS OR IMPLIED. The use of this information or the implementation of any of these techniques is the customer s responsibility and depends on the customer s ability to evaluate and integrate them into the customer s operational environment. While each item has been reviewed by DataCore Software Corporation for accuracy in a specific situation, there is no guarantee that the same or similar results will be obtained elsewhere. Customers attempting to adapt these techniques to their own environment do so at their own risk. This publication was produced in the United States. DataCore Software Corporation may not offer the products, services, or features discussed in this document in other countries, and the information is subject to change with notice. Consult your local DataCore Software Corporation representative for information on products and services available in your area. Copyright DataCore Software Corporation All rights reserved. Permission is hereby granted to reproduce this document in whole or in part, provided the copyright notice as printed above is set forth in full text on the title page of each item reproduced. Trademarks SPC Benchmark-1, SPC-1, SPC-1 IOPS, SPC-1 LRT and SPC-1 Price-Performance are trademarks of the Storage Performance Council. DataCore, SANsymphony and the DataCore logo are trademarks or registered trademarks of DataCore Software Corporation. Other DataCore product or service names or logos referenced herin are trademarks of DataCore Software Corporation in the United States and other countries. All other brands, trademarks, and product names are the property of their respective owners.
3 iii Table of Contents Audit Certification... vii Audit Certification (cont.)... viii Letter of Good Faith... ix Executive Summary Test Sponsor and Contact Information Revision Information and Key Dates Tested Storage Product (TSP) Description Summary of Results Storage Capacities, Relationships, and Utilization Response Time Throughput Curve Response Time Throughput Data Priced Storage Configuration Pricing Differences between the Tested Storage Configuration (TSC) and Priced Storage Configuration Priced Storage Configuration Diagram Priced Storage Configuration Components Configuration Information Benchmark Configuration (BC)/Tested Storage Configuration (TSC) Diagram. 20 Storage Network Configuration Host System(s) and Tested Storage Configuration (TSC) Table of Components 20 Benchmark Configuration/Tested Storage Configuration Diagram Host System and Tested Storage Configuration Components Customer Tunable Parameters and Options Tested Storage Configuration (TSC) Description SPC-1 Workload Generator Storage Configuration ASU Pre-Fill SPC-1 Data Repository Storage Capacities and Relationships SPC-1 Storage Capacities SPC-1 Storage Hierarchy Ratios SPC-1 Storage Capacity Charts Storage Capacity Utilization Logical Volume Capacity and ASU Mapping SPC-1 Benchmark Execution Results SPC-1 Tests, Test Phases, and Test Runs... 30
4 iv Ramp-Up Test Runs Primary Metrics Test Sustainability Test Phase SPC-1 Workload Generator Input Parameters Sustainability Test Results File Sustainability Data Rate Distribution Data (MB/second) Sustainability Data Rate Distribution Graph Sustainability I/O Request Throughput Distribution Data Sustainability I/O Request Throughput Distribution Graph Sustainability Average Response Time (ms) Distribution Data Sustainability Average Response Time (ms) Distribution Graph Sustainability Response Time Frequency Distribution Data Sustainability Response Time Frequency Distribution Graph Sustainability Measured Intensity Multiplier and Coefficient of Variation Primary Metrics Test IOPS Test Phase SPC-1 Workload Generator Input Parameters IOPS Test Results File IOPS Test Run I/O Request Throughput Distribution Data IOPS Test Run I/O Request Throughput Distribution Graph IOPS Test Run Average Response Time (ms) Distribution Data IOPS Test Run Average Response Time (ms) Distribution Graph IOPS Test Run Response Time Frequency Distribution Data IOPS Test Run Response Time Frequency Distribution Graph IOPS Test Run I/O Request Information IOPS Test Run Measured Intensity Multiplier and Coefficient of Variation Primary Metrics Test Response Time Ramp Test Phase SPC-1 Workload Generator Input Parameters Response Time Ramp Test Results File Response Time Ramp Distribution (IOPS) Data Response Time Ramp Distribution (IOPS) Data (continued) Response Time Ramp Distribution (IOPS) Graph SPC-1 LRT Average Response Time (ms) Distribution Data SPC-1 LRT Average Response Time (ms) Distribution Graph SPC-1 LRT (10%) Measured Intensity Multiplier and Coefficient of Variation Repeatability Test SPC-1 Workload Generator Input Parameters Repeatability Test Results File Repeatability 1 LRT I/O Request Throughput Distribution Data Repeatability 1 LRT I/O Request Throughput Distribution Graph Repeatability 1 LRT Average Response Time (ms) Distribution Data... 50
5 v Repeatability 1 LRT Average Response Time (ms) Distribution Graph Repeatability 1 IOPS I/O Request Throughput Distribution Data Repeatability 1 IOPS I/O Request Throughput Distribution Graph Repeatability 1 IOPS Average Response Time (ms) Distribution Data Repeatability 1 IOPS Average Response Time (ms) Distribution Graph Repeatability 2 LRT I/O Request Throughput Distribution Data Repeatability 2 LRT I/O Request Throughput Distribution Graph Repeatability 2 LRT Average Response Time (ms) Distribution Data Repeatability 2 LRT Average Response Time (ms) Distribution Graph Repeatability 2 IOPS I/O Request Throughput Distribution Data Repeatability 2 IOPS I/O Request Throughput Distribution Graph Repeatability 2 IOPS Average Response Time (ms) Distribution Data Repeatability 2 IOPS Average Response Time (ms) Distribution Graph Repeatability 1 (LRT) Measured Intensity Multiplier and Coefficient of Variation Repeatability 1 (IOPS) Measured Intensity Multiplier and Coefficient of Variation Repeatability 2 (LRT) Measured Intensity Multiplier and Coefficient of Variation Repeatability 2 (IOPS) Measured Intensity Multiplier and Coefficient of Variation Data Persistence Test SPC-1 Workload Generator Input Parameters Data Persistence Test Results File Data Persistence Test Results Priced Storage Configuration Availability Date Pricing Information Tested Storage Configuration (TSC) and Priced Storage Configuration Differences Anomalies or Irregularities Appendix A: SPC-1 Glossary Decimal (powers of ten) Measurement Units Binary (powers of two) Measurement Units SPC-1 Data Repository Definitions SPC-1 Data Protection Levels SPC-1 Test Execution Definitions I/O Completion Types SPC-1 Test Run Components Appendix B: Customer Tunable Parameters and Options Windows 2008 Server Registry Settings SANsymphony-V Cache Settings for defined Virtual Disks... 66
6 vi SANsymphony-V Cache settings for defined specific Virtual Disks SANsymphony-V Poller settings SANsymphony-V settings for Pools SANsymphony-V settings for specific Pools Appendix C: Tested Storage Configuration (TSC) Creation ServeVD_jb_bal.ps Appendix D: SPC-1 Workload Generator Storage Commands and Parameters ASU Pre-Fill Primary Metrics, Repeatability and Persistence Tests Appendix E: SPC-1 Workload Generator Input Parameters RunBench.bat Persist2.bat Appendix F: Third-Party Quotation Priced Storage Configuration Priced Storage Configuration (continued) Priced Storage Configuration (continued)... 88
7 vii AUDIT CERTIFICATION
8 viii AUDIT CERTIFICATION (CONT.)
9 ix LETTER OF GOOD FAITH
10 EXECUTIVE SUMMARY Page 10 of 88 EXECUTIVE SUMMARY Test Sponsor and Contact Information Test Sponsor Primary Contact Test Sponsor Alternate Contact Auditor Test Sponsor and Contact Information DataCore Software Corporation Ben Treiber Worldwide Headquarters Corporate Park 6300 NW 5 th Way Ft. Lauderdale, FL Phone: (954) FAX: (954) DataCore Software Corporation Roni Putra roni.putra@datacore.com Worldwide Headquarters Corporate Park 6300 NW 5 th Way Ft. Lauderdale, FL Phone: (954) FAX: (954) Storage Performance Council Walter E. Baker AuditService@StoragePerformance.org 643 Bair Island Road, Suite 103 Redwood City, CA Phone: (650) FAX: (650) Revision Information and Key Dates Revision Information and Key Dates SPC-1 Specification revision number V1.14 SPC-1 Workload Generator revision number V2.3.0 Date Results were first used publicly November 30, 2015 Date the FDR was submitted to the SPC November 30, 2015 Date the Priced Storage Configuration is available for shipment to customers currently available Date the TSC completed audit certification November 30, 2015 Tested Storage Product (TSP) Description SANsymphony-V provides a flexible platform that has been proven in enterprise environments. Because it is designed from the outset as parallel storage software, SANsymphony-V is uniquely able to scale to its underlying hardware environment and to do so in both conventional storage topologies and in more recent converged environments.
11 EXECUTIVE SUMMARY Page 11 of 88 Summary of Results SPC-1 Reported Data Tested Storage Product (TSP) Name: Metric Reported Result SPC-1 IOPS 459, SPC-1 Price-Performance Total ASU Capacity Data Protection Level $0.08/SPC-1 IOPS 2, GB Protected 1 (Mirroring) Total Price $ Currency Used Target Country for availability, sales and support U.S. Dollars USA SPC-1 IOPS represents the maximum I/O Request Throughput at the 100% load point. SPC-1 Price-Performance is the ratio of Total Price to SPC-1 IOPS. Total ASU (Application Storage Unit) Capacity represents the total storage capacity available to be read and written in the course of executing the SPC-1 benchmark. A Data Protection Level of Protected 1 using Mirroring configures two or more identical copies of user data. Protected 1: The single point of failure of any storage device in the configuration will not result in permanent loss of access to or integrity of the SPC-1 Data Repository. Total Price includes the cost of the Priced Storage Configuration plus three years of hardware maintenance and software support as detailed on page 16. Currency Used is formal name for the currency used in calculating the Total Price and SPC-1 Price-Performance. That currency may be the local currency of the Target Country or the currency of a difference country (non-local currency). The Target Country is the country in which the Priced Storage Configuration is available for sale and in which the required hardware maintenance and software support is provided either directly from the Test Sponsor or indirectly via a third-party supplier.
12 EXECUTIVE SUMMARY Page 12 of 88 Storage Capacities, Relationships, and Utilization The following four charts and table document the various storage capacities, used in this benchmark, and their relationships, as well as the storage utilization values required to be reported.
13 EXECUTIVE SUMMARY Page 13 of 88
14 EXECUTIVE SUMMARY Page 14 of 88 SPC-1 Storage Capacity Utilization Application Utilization 29.02% Protected Application Utilization 58.05% Unused Storage Ratio 41.89% Application Utilization: Total ASU Capacity (2, GB) divided by Physical Storage Capacity (10, GB). Protected Application Utilization: (Total ASU Capacity (2, GB) plus total Data Protection Capacity (5, GB) minus unused Data Protection Capacity (2, GB)) divided by Physical Storage Capacity (10, GB). Unused Storage Ratio: Total Unused Capacity (4, GB) divided by Physical Storage Capacity (10, GB) and may not exceed 45%. Detailed information for the various storage capacities and utilizations is available on pages
15 EXECUTIVE SUMMARY Page 15 of 88 Response Time Throughput Curve The Response Time-Throughput Curve illustrates the Average Response Time (milliseconds) and I/O Request Throughput at 100%, 95%, 90%, 80%, 50%, and 10% of the workload level used to generate the SPC-1 IOPS metric. The Average Response Time measured at any of the above load points cannot exceed 30 milliseconds or the benchmark measurement is invalid. Response Time Throughput Data 10% Load 50% Load 80% Load 90% Load 95% Load 100% Load I/O Request Throughput 46, , , , , , Average Response Time (ms): All ASUs ASU ASU ASU Reads Writes
16 EXECUTIVE SUMMARY Page 16 of 88 Priced Storage Configuration Pricing Part ID Description Qty List Price Total List Price Curvature Price Total Price 5462AC1 IBM SYSTEM X3650 M5 2.5 SFF 8 BAY HOT SWAP 1 $ 3, $ 3, $ 2, $ 2, E5-2695V3 INTEL XEON PROCESSOR E V3 (2.30 GHZ/14- CORE/35MB/2133MHZ) 2 $ 3, $ 6, $ 2, $ 4, HEATSINK LENOVO HEATSINK 2 $ $ $ $ SYSTEM FAN LENOVO SYSTEM FAN 6 $ $ $ $ W0796 IBM 16GB TRUDDR4 MEMORY 2RX4 1.2V PC CL MHZ LP RDIMM 2 $ $ $ $ W GB (1X32GB), PC , DDR4, 1.2V, LRDIMM 16 $ $ 15, $ $ 11, MBF2300RC 300GB 10K SAS 2.5" 6G HDD 1 $ $ $ $ MZ-75E500B/AM SAMSUNG 850 EVO 500 GB 2.5" INTERNAL SOLID STATE DRIVE - SATA 1 $ $ $ $ HUC156030CSS200 HDD, 300GB, 12G, SAS, 15K, SFF, WESTERN DIGITAL 8 $ $ 2, $ $ 1, C9114 SERVER RAID M1215 SAS/SATA CONTROLLER 2 $ $ $ $ SANSYMPHONY-V VIRTUAL SAN HSX-EWR HS8 LICENSE F/ 1 SERVER W/ UP TO 8 TBS 1 $ 4, $ 4, $ 3, $ 3, WINDOWS SVR 2012 R2 STANDARD 4XI0E51561 ROK 2 CPUS/2 VMS (SEE NOTE 2) 1 $ $ $ $ YR SUP SANSYMPHONY-V HS8 VIRTUAL SAN HSX-EWR-TGD-008 LICS FOR 1 SERVER 1 $ 2, $ 2, $ 1, $ 1, LENOVO SYSTEM X 900W HIGH EFFICIENCY PLATINUM AC POWER SUPPLY 00FK W V AC, 230 V AC 2 $ $ $ $ NR851 LENOVO SERVICE/SUPPORT - 3 YEAR EXTENDED SERVICE SERVICE - 24 X 7 X 4 HOUR - ON-SITE - MAINTENANCE PARTS & LABOR - PHYSICAL SERVICE (SEE NOTE 3) 1 $ $ $ $ LENOVO REMOTE TECHNICAL SUPPORT 3 YEAR - 24 X 7 X 2 HOUR TECHNICAL - ELECTRONIC SERVICE 00LW731 (SEE NOTE 3) 1 $ 1, $ 1, $ 1, $ 1, LENOVO SYSTEM X3650 M5 PLUS 8X 00FK " HS HDD ASSEMBLY KIT WITH EXPANDER 1 $ $ $ $ FK676 LENOVO SYSTEM X3650 M5 PLUS 8X2.5' HDD ASSEMBLY KIT 1 $ $ $ $ FK658 LENOVO SYSTEM X3650 M5 REAR 2X2.5' HDD KIT 1 $ $ $ $ MZ-7KM480E SSD, 480GB, 6GB, SATA, SFF, SAMSUNG 16 $ $ 7, $ $ 5, E7600 L INCH SFF DRIVE TRAY CADDY FOR IBM/LENOVO X3650 M5 (SEE NOTE 4) 25 $ $ 2, $ $ 2, Net List Price: $ 52, Net Cost: $ 38, Tax: $ - Freight: $ - Grand Total: $ 38, The above pricing includes hardware maintenance and software support for three years, 7 days per week, 24 hours per day. The hardware maintenance and software support provides the following: Acknowledgement of new and existing problems within four (4) hours. Onsite presence of a qualified maintenance engineer or provision of a customer replaceable part within four (4) hours of the above acknowledgement for any hardware failure that results in an inoperative Price Storage Configuration that can be remedied by the repair or replacement of a Priced Storage Configuration component.
17 EXECUTIVE SUMMARY Page 17 of 88 Differences between the Tested Storage Configuration (TSC) and Priced Storage Configuration There were no differences between the Tested Storage Configuration and the Priced Storage Configuration.
18 EXECUTIVE SUMMARY Page 18 of 88 Priced Storage Configuration Diagram
19 EXECUTIVE SUMMARY Page 19 of 88 Priced Storage Configuration Components Priced Storage Configuration 1 Lenovo X3650 M5 Server, with: 2 Intel Xeon 2.30 GHz E V3 processors each with 14 cores, 35 MB Intel Smart Cache 544 GB main memory (418,652 MiB configured for SANsymphony-V 10.0) Windows 2008 R2 Enterprise Server w/sp1 PCIe 1 Server RAID M1215 SAS/SATA internal controller 2 Server RAID M1215 SAS/SATA Controllers (external) GB 10K SAS 2.5 6G HDD (system HDD) (connected to the internal controller) GB 2.5 SSD (page/swap) (Samsung 850 EVO MZ-75E500), (connected to the internal controller) GB, 6 Gb SATA SFF SSDs (Samsung SM863 MZ-7KM480E) (connected to external controller 1) GB 12Gb 15K SAS SFF HDDs (Utrastar C15K600) (connected to external controller 2)
20 CONFIGURATION INFORMATION Page 20 of 88 In each of the following sections of this document, the appropriate Full Disclosure Report requirement, from the SPC-1 benchmark specification, is stated in italics followed by the information to fulfill the stated requirement. CONFIGURATION INFORMATION Benchmark Configuration (BC)/Tested Storage Configuration (TSC) Diagram Clause A one page Benchmark Configuration (BC)/Tested Storage Configuration (TSC) diagram shall be included in the FDR The Benchmark Configuration (BC)/Tested Storage Configuration (TSC) is illustrated on page 21 (Benchmark Configuration/Tested Storage Configuration Diagram). Storage Network Configuration Clause If the TSC contains network storage, the diagram will include the network configuration. If a single diagram is not sufficient to illustrate both the Benchmark Configuration and network configuration in sufficient detail, the Benchmark Configuration diagram will include a highlevel network illustration as shown in Figure 9-8. In that case, a separate, detailed network configuration diagram will also be included as described in Clause Clause If a storage network was configured as a part of the Tested Storage Configuration and the Benchmark Configuration diagram described in Clause contains a high-level illustration of the network configuration, the Executive Summary will contain a one page topology diagram of the storage network as illustrated in Figure 9-9. The Tested Storage Configuration (TSC) was configured with direct-attached storage. Host System(s) and Tested Storage Configuration (TSC) Table of Components Clause The FDR will contain a table that lists the major components of each Host System and the Tested Storage Configuration (TSC). The Host System(s) and TSC table of components may be found on page 22 (Host System and Tested Storage Configuration Components).


21 CONFIGURATION INFORMATION Page 21 of 88 Benchmark Configuration/Tested Storage Configuration Diagram
22 CONFIGURATION INFORMATION Page 22 of 88 Host System and Tested Storage Configuration Components Priced Storage Configuration 1 Lenovo X3650 M5 Server, with: 2 Intel Xeon 2.30 GHz E V3 processors each with 14 cores, 35 MB Intel Smart Cache 544 GB main memory (418,652 MiB configured for SANsymphony-V 10.0) Windows 2008 R2 Enterprise Server w/sp1 PCIe 1 Server RAID M1215 SAS/SATA internal controller 2 Server RAID M1215 SAS/SATA Controllers (external) GB 10K SAS 2.5 6G HDD (system HDD) (connected to the internal controller) GB 2.5 SSD (page/swap) (Samsung 850 EVO MZ-75E500), (connected to the internal controller) GB, 6 Gb SATA SFF SSDs (Samsung SM863 MZ-7KM480E) (connected to external controller 1) GB 12Gb 15K SAS SFF HDDs (Utrastar C15K600) (connected to external controller 2)
23 CONFIGURATION INFORMATION Page 23 of 88 Customer Tunable Parameters and Options Clause All Benchmark Configuration (BC) components with customer tunable parameter and options that have been altered from their default values must be listed in the FDR. The FDR entry for each of those components must include both the name of the component and the altered value of the parameter or option. If the parameter name is not self-explanatory to a knowledgeable practitioner, a brief description of the parameter s use must also be included in the FDR entry. Appendix B: Customer Tunable Parameters and Options on page 66 contains the customer tunable parameters and options that have been altered from their default values for this benchmark. Tested Storage Configuration (TSC) Description Clause The FDR must include sufficient information to recreate the logical representation of the TSC. In addition to customer tunable parameters and options (Clause ), that information must include, at a minimum: A diagram and/or description of the following: All physical components that comprise the TSC. Those components are also illustrated in the BC Configuration Diagram in Clause and/or the Storage Network Configuration Diagram in Clause The logical representation of the TSC, configured from the above components that will be presented to the Workload Generator. Listings of scripts used to create the logical representation of the TSC. If scripts were not used, a description of the process used with sufficient detail to recreate the logical representation of the TSC. Appendix C: Tested Storage Configuration (TSC) Creation on page 71 contains the detailed information that describes how to create and configure the logical TSC. SPC-1 Workload Generator Storage Configuration Clause The FDR must include all SPC-1 Workload Generator storage configuration commands and parameters. The SPC-1 Workload Generator storage configuration commands and parameters for this measurement appear in Appendix D: SPC-1 Workload Generator Storage Commands and Parameters on page 83.
24 CONFIGURATION INFORMATION Page 24 of 88 ASU Pre-Fill Clause Each of the three SPC-1 ASUs (ASU-1, ASU-2 and ASU-3) is required to be completely filled with specified content prior to the execution of audited SPC-1 Tests. The content is required to consist of random data pattern such as that produced by an SPC recommended tool. The configuration file used to complete the required ASU pre-fill appears in Appendix D: SPC-1 Workload Generator Storage Commands and Parameters on page 83.
25 DATA REPOSITORY Page 25 of 88 SPC-1 DATA REPOSITORY This portion of the Full Disclosure Report presents the detailed information that fully documents the various SPC-1 storage capacities and mappings used in the Tested Storage Configuration. SPC-1 Data Repository Definitions on page 62 contains definitions of terms specific to the SPC-1 Data Repository. Storage Capacities and Relationships Clause Two tables and four charts documenting the storage capacities and relationships of the SPC-1 Storage Hierarchy (Clause 2.1) shall be included in the FDR. The capacity value in each chart may be listed as an integer value, for readability, rather than the decimal value listed in the table below. SPC-1 Storage Capacities The Physical Storage Capacity consisted of 10, GB distributed over 16 solid state devices (SSDs), each with a formatted capacity of GB and 8 disk drives (HDDs), each with a formatted capacity GB. There was 0 GB (0%) of Unused Storage within the Physical Storage Capacity. Global Storage Overhead consisted of 0 GB (0%) of the Physical Storage Capacity. There was 4, GB (41.89%) of Unused Storage within the Configured Storage Capacity. The Total ASU Capacity utilized 100% of the Addressable Storage Capacity resulting in 0.00 GB (0.00%) of Unused Storage within the Addressable Storage Capacity. The Data Protection (Mirroring) capacity was 5, GB of which 2, GB was utilized. The total Unused Storage capacity was GB. Note: The configured Storage Devices may include additional storage capacity reserved for system overhead, which is not accessible for application use. That storage capacity may not be included in the value presented for Physical Storage Capacity. SPC-1 Storage Capacities Storage Hierarchy Component Units Capacity Total ASU Capacity Gigabytes (GB) 2, Addressable Storage Capacity Gigabytes (GB) 2, Configured Storage Capacity Gigabytes (GB) 10, Physical Storage Capacity Gigabytes (GB) 10, Data Protection (Mirroring) Gigabytes (GB) 5, Required Storage (metadata) Gigabytes (GB) Global Storage Overhead Gigabytes (GB) Total Unused Storage Gigabytes (GB) 4,
 49.97% 49.97% Addressable Storage Capacity 29.02% 29.02% Required Storage (metadata) 0.07% 0.07% Configured Storage Capacity 100.")
26 DATA REPOSITORY Page 26 of 88 SPC-1 Storage Hierarchy Ratios Addressable Storage Capacity Configured Storage Capacity Physical Storage Capacity Total ASU Capacity % 29.02% 29.02% Required for Data Protection (Mirroring) 49.97% 49.97% Addressable Storage Capacity 29.02% 29.02% Required Storage (metadata) 0.07% 0.07% Configured Storage Capacity % Global Storage Overhead 0.00% Unused Storage: Addressable 0.00% Configured 41.89% Physical 0.00% SPC-1 Storage Capacity Charts
27 DATA REPOSITORY Page 27 of 88
, Protected Application Utilization (Clause 2.8.2), and Unused Storage Ratio (Clause 2.")
28 DATA REPOSITORY Page 28 of 88 Storage Capacity Utilization Clause The FDR will include a table illustrating the storage capacity utilization values defined for Application Utilization (Clause 2.8.1), Protected Application Utilization (Clause 2.8.2), and Unused Storage Ratio (Clause 2.8.3). Clause Application Utilization is defined as Total ASU Capacity divided by Physical Storage Capacity. Clause Protected Application Utilization is defined as (Total ASU Capacity plus total Data Protection Capacity minus unused Data Protection Capacity) divided by Physical Storage Capacity. Clause Unused Storage Ratio is defined as Total Unused Capacity divided by Physical Storage Capacity and may not exceed 45%. SPC-1 Storage Capacity Utilization Application Utilization 29.02% Protected Application Utilization 58.05% Unused Storage Ratio 41.89%
29 DATA REPOSITORY Page 29 of 88 Logical Volume Capacity and ASU Mapping Clause A table illustrating the capacity of each ASU and the mapping of Logical Volumes to ASUs shall be provided in the FDR. Logical Volumes shall be sequenced in the table from top to bottom per its position in the contiguous address space of each ASU. The capacity of each Logical Volume shall be stated. In conjunction with this table, the Test Sponsor shall provide a complete description of the type of data protection (see Clause 2.4.5) used on each Logical Volume. Logical Volume Capacity and Mapping ASU-1 (1, GB) 6 Logical Volumes GB per Logical Volume ( GB used per Logical Volume) ASU-2 (1, GB) 2 Logical Volumes GB per Logical Volume ( GB used per Logical Volume) ASU-3 ( GB) 6 Logical Volumes GB per Logical Volume ( GB used per Logical Volume) The Data Protection Level used for all Logical Volumes was Protected 1 using Mirroring as described on page 11. See ASU Configuration in the IOPS Test Results File for more detailed configuration information.
30 SPC-1 BENCHMARK EXECUTION RESULTS Page 30 of 88 SPC-1 BENCHMARK EXECUTION RESULTS This portion of the Full Disclosure Report documents the results of the various SPC-1 Tests, Test Phases, and Test Runs. An SPC-1 glossary on page 62 contains definitions of terms specific to the SPC-1 Tests, Test Phases, and Test Runs. Clause The Tests must be executed in the following sequence: Primary Metrics, Repeatability, and Data Persistence. That required sequence must be uninterrupted from the start of Primary Metrics to the completion of Persistence Test Run 1. Uninterrupted means the Benchmark Configuration shall not be power cycled, restarted, disturbed, altered, or adjusted during the above measurement sequence. If the required sequence is interrupted other than for the Host System/TSC power cycle between the two Persistence Test Runs, the measurement is invalid. SPC-1 Tests, Test Phases, and Test Runs The SPC-1 benchmark consists of the following Tests, Test Phases, and Test Runs: Primary Metrics Test Sustainability Test Phase and Test Run IOPS Test Phase and Test Run Response Time Ramp Test Phase o 95% of IOPS Test Run o 90% of IOPS Test Run o 80% of IOPS Test Run o 50% of IOPS Test Run o 10% of IOPS Test Run (LRT) Repeatability Test Repeatability Test Phase 1 o 10% of IOPS Test Run (LRT) o IOPS Test Run Repeatability Test Phase 2 o 10% of IOPS Test Run (LRT) o IOPS Test Run Data Persistence Test Data Persistence Test Run 1 Data Persistence Test Run 2 Each Test is an atomic unit that must be executed from start to finish before any other Test, Test Phase, or Test Run may be executed. The results from each Test, Test Phase, and Test Run are listed below along with a more detailed explanation of each component.
31 SPC-1 BENCHMARK EXECUTION RESULTS Page 31 of 88 PRIMARY METRICS TEST SUSTAINABILITY TEST PHASE Ramp-Up Test Runs Clause In order to warm-up caches or perform the initial ASU data migration in a multi-tier configuration, a Test Sponsor may perform a series of Ramp-Up Test Runs as a substitute for an initial, gradual Ramp-Up. Clause The Ramp-Up Test Runs will immediately precede the Primary Metrics Test as part of the uninterrupted SPC-1 measurement sequence. Clause If a series of Ramp-Up Test Runs were included in the SPC-1 measurement sequence, the FDR shall report the duration (ramp-up and measurement interval), BSU level, SPC-1 IOPS and average response time for each Ramp-Up Test Run in an appropriate table. There were no Ramp-Up Test Runs executed. Primary Metrics Test Sustainability Test Phase Clause The Sustainability Test Phase has exactly one Test Run and shall demonstrate the maximum sustainable I/O Request Throughput within at least a continuous eight (8) hour Measurement Interval. This Test Phase also serves to insure that the TSC has reached Steady State prior to reporting the final maximum I/O Request Throughput result (SPC-1 IOPS ). Clause The computed I/O Request Throughput of the Sustainability Test must be within 5% of the reported SPC-1 IOPS result. Clause The Average Response Time, as defined in Clause 5.1.1, will be computed and reported for the Sustainability Test Run and cannot exceed 30 milliseconds. If the Average Response time exceeds that 30-milliseconds constraint, the measurement is invalid. Clause For the Sustainability Test Phase the FDR shall contain: 1. A Data Rate Distribution graph and data table. 2. I/O Request Throughput Distribution graph and data table. 3. A Response Time Frequency Distribution graph and table. 4. An Average Response Time Distribution graph and table. 5. The human readable Test Run Results File produced by the Workload Generator (may be included in an appendix). 6. A listing or screen image of all input parameters supplied to the Workload Generator (may be included in an appendix). 7. The Measured Intensity Multiplier for each I/O stream. 8. The variability of the Measured Intensity Multiplier, as defined in Clause
32 SPC-1 BENCHMARK EXECUTION RESULTS Page 32 of 88 PRIMARY METRICS TEST SUSTAINABILITY TEST PHASE SPC-1 Workload Generator Input Parameters The SPC-1 Workload Generator input parameters for the Sustainability, IOPS, Response Time Ramp, Repeatability, and Persistence Test Runs are documented in Appendix E: SPC-1 Workload Generator Input Parameters on Page 85. Sustainability Test Results File A link to the test results file generated from the Sustainability Test Run is listed below. Sustainability Test Results File Sustainability Data Rate Distribution Data (MB/second) The Sustainability Data Rate table of data is not embedded in this document due to its size. The table is available via the following URL: Sustainability Data Rate Table Sustainability Data Rate Distribution Graph
33 SPC-1 BENCHMARK EXECUTION RESULTS Page 33 of 88 PRIMARY METRICS TEST SUSTAINABILITY TEST PHASE Sustainability I/O Request Throughput Distribution Data The Sustainability I/O Request Throughput table of data is not embedded in this document due to its size. The table is available via the following URL: Sustainability I/O Request Throughput Table Sustainability I/O Request Throughput Distribution Graph
34 SPC-1 BENCHMARK EXECUTION RESULTS Page 34 of 88 PRIMARY METRICS TEST SUSTAINABILITY TEST PHASE Sustainability Average Response Time (ms) Distribution Data The Sustainability Average Response Time table of data is not embedded in this document due to its size. The table is available via the following URL: Sustainability Average Response Time Table Sustainability Average Response Time (ms) Distribution Graph
35 SPC-1 BENCHMARK EXECUTION RESULTS Page 35 of 88 PRIMARY METRICS TEST SUSTAINABILITY TEST PHASE Sustainability Response Time Frequency Distribution Data Response Time (ms) > > > > > > > Read 3,014,493, ,554, ,651, ,147, ,520, ,795, ,752,215 98,878,304 Write 6,792,819,301 1,025,314, ,317,456 25,633,215 6,003,442 3,021,425 2,076,574 1,290,316 All ASUs 9,807,312,494 1,478,868, ,968, ,781, ,524, ,817, ,828, ,168,620 ASU1 5,838,233, ,636, ,134, ,633, ,402, ,628, ,998,040 80,048,328 ASU2 1,058,113, ,398, ,879, ,064,526 79,355,819 55,437,358 34,414,676 19,809,887 ASU3 2,910,965, ,833, ,954,440 16,082,827 2,766, , , ,405 Response Time (ms) > > > > > > > > Read 110,778,353 52,769,275 28,185,921 17,549,952 11,817,186 8,665,777 11,473,722 6,998,614 Write 1,499, , , , , , , ,613 All ASUs 112,278,072 53,758,886 28,830,390 18,065,189 12,226,491 9,019,154 12,055,002 7,469,227 ASU1 91,246,224 43,239,776 22,017,479 12,826,137 8,005,130 5,545,661 6,840,356 3,934,403 ASU2 20,571,877 10,173,692 6,524,499 4,987,286 3,996,139 3,270,841 4,862,565 3,236,318 ASU3 459, , , , , , , ,506 Response Time (ms) > > > > > > > >30.0 Read 4,353,310 2,653,848 1,548,905 3,234,243 2,095,970 1,634,781 1,289,380 4,332,208 Write 401, , ,963 1,223, , , ,160 1,025,760 All ASUs 4,754,687 3,006,778 1,863,868 4,457,463 3,095,538 2,454,896 1,936,540 5,357,968 ASU1 2,436,417 1,587,206 1,080,849 3,199,454 2,251,159 1,761,840 1,361,135 3,772,802 ASU2 2,061,225 1,189, , , , ,078 83, ,302 ASU3 257, , , , , , , ,864 Sustainability Response Time Frequency Distribution Graph
36 SPC-1 BENCHMARK EXECUTION RESULTS Page 36 of 88 PRIMARY METRICS TEST SUSTAINABILITY TEST PHASE Sustainability Measured Intensity Multiplier and Coefficient of Variation Clause IM Intensity Multiplier: The ratio of I/Os for each I/O stream relative to the total I/Os for all I/O streams (ASU1-1 ASU3-1) as required by the benchmark specification. Clauses and MIM Measured Intensity Multiplier: The Measured Intensity Multiplier represents the ratio of measured I/Os for each I/O stream relative to the total I/Os measured for all I/O streams (ASU1-1 ASU3-1). This value may differ from the corresponding Expected Intensity Multiplier by no more than 5%. Clause COV Coefficient of Variation: This measure of variation for the Measured Intensity Multiplier cannot exceed 0.2. ASU1-1 ASU1-2 ASU1-3 ASU1-4 ASU2-1 ASU2-2 ASU2-3 ASU3-1 IM MIM COV
37 SPC-1 BENCHMARK EXECUTION RESULTS Page 37 of 88 PRIMARY METRICS TEST IOPS TEST PHASE Primary Metrics Test IOPS Test Phase Clause The IOPS Test Phase consists of one Test Run at the 100% load point with a Measurement Interval of ten (10) minutes. The IOPS Test Phase immediately follows the Sustainability Test Phase without any interruption or manual intervention. The IOPS Test Run generates the SPC-1 IOPS primary metric, which is computed as the I/O Request Throughput for the Measurement Interval of the IOPS Test Run. The Average Response Time is computed for the IOPS Test Run and cannot exceed 30 milliseconds. If the Average Response Time exceeds the 30 millisecond constraint, the measurement is invalid. Clause For the IOPS Test Phase the FDR shall contain: 1. I/O Request Throughput Distribution (data and graph). 2. A Response Time Frequency Distribution. 3. An Average Response Time Distribution. 4. The human readable Test Run Results File produced by the Workload Generator. 5. A listing or screen image of all input parameters supplied to the Workload Generator. 6. The total number of I/O Requests completed in the Measurement Interval as well as the number of I/O Requests with a Response Time less than or equal to 30 milliseconds and the number of I/O Requests with a Response Time greater than 30 milliseconds. SPC-1 Workload Generator Input Parameters The SPC-1 Workload Generator input parameters for the Sustainability, IOPS, Response Time Ramp, Repeatability, and Persistence Test Runs are documented in Appendix E: SPC-1 Workload Generator Input Parameters on Page 85. IOPS Test Results File A link to the test results file generated from the IOPS Test Run is listed below. IOPS Test Results File

38 SPC-1 BENCHMARK EXECUTION RESULTS Page 38 of 88 PRIMARY METRICS TEST IOPS TEST PHASE IOPS Test Run I/O Request Throughput Distribution Data 9,200 BSUs Start Stop Interval Duration Start-Up/Ramp-Up 2:07:45 2:13: :06:01 Measurement Interval 2:13:46 2:23: :10:00 60 second intervals All ASUs ASU1 ASU2 ASU , , , , , , , , , , , , , , , , , , , , , , , , , , , , , , , , , , , , , , , , , , , , , , , , , , , , , , , , , , , , , , , , Average 459, , , , IOPS Test Run I/O Request Throughput Distribution Graph
39 SPC-1 BENCHMARK EXECUTION RESULTS Page 39 of 88 PRIMARY METRICS TEST IOPS TEST PHASE IOPS Test Run Average Response Time (ms) Distribution Data 9,200 BSUs Start Stop Interval Duration Start-Up/Ramp-Up 2:07:45 2:13: :06:01 Measurement Interval 2:13:46 2:23: :10:00 60 second intervals All ASUs ASU1 ASU2 ASU Average IOPS Test Run Average Response Time (ms) Distribution Graph
40 SPC-1 BENCHMARK EXECUTION RESULTS Page 40 of 88 PRIMARY METRICS TEST IOPS TEST PHASE IOPS Test Run Response Time Frequency Distribution Data Response Time (ms) > > > > > > > Read 68,126,269 7,661,557 5,546,093 5,983,860 5,384,334 4,365,864 3,097,177 2,007,804 Write 140,107,943 21,515,501 3,644, , , ,869 78,309 55,366 All ASUs 208,234,212 29,177,058 9,190,691 6,722,242 5,608,358 4,481,733 3,175,486 2,063,170 ASU1 127,420,082 12,072,595 4,300,666 4,154,902 3,838,611 3,240,933 2,387,221 1,601,789 ASU2 22,562,716 1,898,624 2,009,982 2,030,796 1,623,469 1,176, , ,779 ASU3 58,251,414 15,205,839 2,880, , ,278 64,718 42,402 31,602 Response Time (ms) > > > > > > > > Read 2,335,908 1,190, , , , , , ,178 Write 76,221 53,051 38,857 30,735 26,331 22,579 34,443 22,896 All ASUs 2,412,129 1,243, , , , , , ,074 ASU1 1,927, , , , , , , ,661 ASU2 438, , , ,452 89,970 76, ,363 84,655 ASU3 46,624 34,469 27,161 22,680 20,139 17,489 27,490 18,758 Response Time (ms) > > > > > > > >30.0 Read 180, ,965 60,207 92,301 35,842 19,913 9,398 22,167 Write 21,263 15,182 9,035 20,749 8,072 5, ,672 All ASUs 202, ,147 69, ,050 43,914 25,676 9,874 24,839 ASU1 125,923 77,078 44,555 82,123 31,545 17,499 8,296 21,513 ASU2 58,181 36,743 18,413 16,139 4,738 2,723 1,276 1,238 ASU3 18,059 12,326 6,274 14,788 7,631 5, ,088 IOPS Test Run Response Time Frequency Distribution Graph
41 SPC-1 BENCHMARK EXECUTION RESULTS Page 41 of 88 PRIMARY METRICS TEST IOPS TEST PHASE IOPS Test Run I/O Request Information I/O Requests Completed in the Measurement Interval I/O Requests Completed with Response Time = or < 30 ms I/O Requests Completed with Response Time > 30 ms 275,539, ,514,285 24,839 IOPS Test Run Measured Intensity Multiplier and Coefficient of Variation Clause IM Intensity Multiplier: The ratio of I/Os for each I/O stream relative to the total I/Os for all I/O streams (ASU1-1 ASU3-1) as required by the benchmark specification. Clauses and MIM Measured Intensity Multiplier: The Measured Intensity Multiplier represents the ratio of measured I/Os for each I/O stream relative to the total I/Os measured for all I/O streams (ASU1-1 ASU3-1). This value may differ from the corresponding Expected Intensity Multiplier by no more than 5%. Clause COV Coefficient of Variation: This measure of variation for the Measured Intensity Multiplier cannot exceed 0.2. ASU1-1 ASU1-2 ASU1-3 ASU1-4 ASU2-1 ASU2-2 ASU2-3 ASU3-1 IM MIM COV
42 SPC-1 BENCHMARK EXECUTION RESULTS Page 42 of 88 PRIMARY METRICS TEST RESPONSE TIME RAMP TEST PHASE Primary Metrics Test Response Time Ramp Test Phase Clause The Response Time Ramp Test Phase consists of five Test Runs, one each at 95%, 90%, 80%, 50%, and 10% of the load point (100%) used to generate the SPC-1 IOPS primary metric. Each of the five Test Runs has a Measurement Interval of ten (10) minutes. The Response Time Ramp Test Phase immediately follows the IOPS Test Phase without any interruption or manual intervention. The five Response Time Ramp Test Runs, in conjunction with the IOPS Test Run (100%), demonstrate the relationship between Average Response Time and I/O Request Throughput for the Tested Storage Configuration (TSC) as illustrated in the response time/throughput curve on page 15. In addition, the Average Response Time measured during the 10% Test Run is the value for the SPC-1 LRT metric. That value represents the Average Response Time of a lightly loaded TSC. Clause The following content shall appear in the FDR for the Response Time Ramp Phase: 1. A Response Time Ramp Distribution. 2. The human readable Test Run Results File produced by the Workload Generator for each Test Run within the Response Time Ramp Test Phase. 3. For the 10% Load Level Test Run (SPC-1 LRT metric) an Average Response Time Distribution. 4. A listing or screen image of all input parameters supplied to the Workload Generator. SPC-1 Workload Generator Input Parameters The SPC-1 Workload Generator input parameters for the Sustainability, IOPS, Response Time Ramp, Repeatability, and Persistence Test Runs are documented in Appendix E: SPC-1 Workload Generator Input Parameters on Page 85. Response Time Ramp Test Results File A link to each test result file generated from each Response Time Ramp Test Run list listed below. 95% Load Level 90% Load Level 80% Load Level 50% Load Level 10% Load Level
43 SPC-1 BENCHMARK EXECUTION RESULTS Page 43 of 88 PRIMARY METRICS TEST RESPONSE TIME RAMP TEST PHASE TEST PHASE Response Time Ramp Distribution (IOPS) Data The five Test Runs that comprise the Response Time Ramp Phase are executed at 95%, 90%, 80%, 50%, and 10% of the Business Scaling Unit (BSU) load level used to produce the SPC-1 IOPS primary metric. The 100% BSU load level is included in the following Response Time Ramp data table and graph for completeness. 100% Load Level: 95% Load Level: 9,200- BSUs Start Stop Interval Duration 8,740 BSUs Start Stop Interval Duration Start-Up/Ramp-Up 2:07:45 2:13: :06:01 Start-Up/Ramp-Up 2:25:26 2:31: :06:01 Measurement Interval 2:13:46 2:23: :10:00 Measurement Interval 2:31:27 2:41: :10:00 (60 second intervals) All ASUs ASU-1 ASU-2 ASU-3 (60 second intervals) All ASUs ASU-1 ASU-2 ASU , , , , , , , , , , , , , , , , , , , , , , , , , , , , , , , , , , , , , , , , , , , , , , , , , , , , , , , , , , , , , , , , , , , , , , , , , , , , , , , , , , , , , , , , , , , , , , , , , , , , , , , , , , , , , , , , , , , , , , , , , , , , , , , , Average 459, , , , Average 436, , , , % Load Level: 80% Load Level: 8,280 BSUs Start Stop Interval Duration 7,360 BSUs Start Stop Interval Duration Start-Up/Ramp-Up 2:43:03 2:49: :06:01 Start-Up/Ramp-Up 3:00:31 3:06: :06:01 Measurement Interval 2:49:04 2:59: :10:00 Measurement Interval 3:06:32 3:16: :10:00 (60 second intervals) All ASUs ASU-1 ASU-2 ASU-3 (60 second intervals) All ASUs ASU-1 ASU-2 ASU , , , , , , , , , , , , , , , , , , , , , , , , , , , , , , , , , , , , , , , , , , , , , , , , , , , , , , , , , , , , , , , , , , , , , , , , , , , , , , , , , , , , , , , , , , , , , , , , , , , , , , , , , , , , , , , , , , , , , , , , , , , , , , , , Average 413, , , , Average 367, , , ,385.96
44 SPC-1 BENCHMARK EXECUTION RESULTS Page 44 of 88 PRIMARY METRICS TEST RESPONSE TIME RAMP TEST PHASE TEST PHASE Response Time Ramp Distribution (IOPS) Data (continued) 50% Load Level: 10% Load Level: 4,600 BSUs Start Stop Interval Duration 920 BSUs Start Stop Interval Duration Start-Up/Ramp-Up 3:17:33 3:23: :06:01 Start-Up/Ramp-Up 3:33:59 3:40: :06:01 Measurement Interval 3:23:34 3:33: :10:00 Measurement Interval 3:40:00 3:50: :10:00 (60 second intervals) All ASUs ASU-1 ASU-2 ASU-3 (60 second intervals) All ASUs ASU-1 ASU-2 ASU , , , , , , , , , , , , , , , , , , , , , , , , , , , , , , , , , , , , , , , , , , , , , , , , , , , , , , , , , , , , , , , , , , , , , , , , , , , , , , , , , , , , , , , , , , , , , , , , , , , , , , , , , , , , , , , , , , , , , , , , , , , , , , , , Average 230, , , , Average 46, , , , Response Time Ramp Distribution (IOPS) Graph
45 SPC-1 BENCHMARK EXECUTION RESULTS Page 45 of 88 PRIMARY METRICS TEST RESPONSE TIME RAMP TEST PHASE TEST PHASE SPC-1 LRT Average Response Time (ms) Distribution Data 920 BSUs Start Stop Interval Duration Start-Up/Ramp-Up 3:33:59 3:40: :06:01 Measurement Interval 0:00:00 3:50: :50:00 60 second intervals All ASUs ASU1 ASU2 ASU Average SPC-1 LRT Average Response Time (ms) Distribution Graph
46 SPC-1 BENCHMARK EXECUTION RESULTS Page 46 of 88 PRIMARY METRICS TEST RESPONSE TIME RAMP TEST PHASE TEST PHASE SPC-1 LRT (10%) Measured Intensity Multiplier and Coefficient of Variation Clause IM Intensity Multiplier: The ratio of I/Os for each I/O stream relative to the total I/Os for all I/O streams (ASU1-1 ASU3-1) as required by the benchmark specification. Clauses and MIM Measured Intensity Multiplier: The Measured Intensity Multiplier represents the ratio of measured I/Os for each I/O stream relative to the total I/Os measured for all I/O streams (ASU1-1 ASU3-1). This value may differ from the corresponding Expected Intensity Multiplier by no more than 5%. Clause COV Coefficient of Variation: This measure of variation for the Measured Intensity Multiplier cannot exceed 0.2. ASU1-1 ASU1-2 ASU1-3 ASU1-4 ASU2-1 ASU2-2 ASU2-3 ASU3-1 IM MIM COV
47 SPC-1 BENCHMARK EXECUTION RESULTS Page 47 of 88 REPEATABILITY TEST Repeatability Test Clause The Repeatability Test demonstrates the repeatability and reproducibility of the SPC-1 IOPS primary metric and the SPC-1 LRT metric generated in earlier Test Runs. There are two identical Repeatability Test Phases. Each Test Phase contains two Test Runs. Each of the Test Runs will have a Measurement Interval of no less than ten (10) minutes. The two Test Runs in each Test Phase will be executed without interruption or any type of manual intervention. The first Test Run in each Test Phase is executed at the 10% load point. The Average Response Time from each of the Test Runs is compared to the SPC-1 LRT metric. Each Average Response Time value must be less than the SPC-1 LRT metric plus 5% or less than the SPC-1 LRT metric plus one (1) millisecond (ms). The second Test Run in each Test Phase is executed at the 100% load point. The I/O Request Throughput from the Test Runs is compared to the SPC-1 IOPS primary metric. Each I/O Request Throughput value must be greater than the SPC-1 IOPS primary metric minus 5%. In addition, the Average Response Time for each Test Run cannot exceed 30 milliseconds. If any of the above constraints are not met, the benchmark measurement is invalid. Clause The following content shall appear in the FDR for each Test Run in the two Repeatability Test Phases: 1. A table containing the results of the Repeatability Test. 2. An I/O Request Throughput Distribution graph and table. 3. An Average Response Time Distribution graph and table. 4. The human readable Test Run Results File produced by the Workload Generator. 5. A listing or screen image of all input parameters supplied to the Workload Generator. SPC-1 Workload Generator Input Parameters The SPC-1 Workload Generator input parameters for the Sustainability, IOPS, Response Time Ramp, Repeatability, and Persistence Test Runs are documented in Appendix E: SPC-1 Workload Generator Input Parameters on Page 85.
48 SPC-1 BENCHMARK EXECUTION RESULTS Page 48 of 88 REPEATABILITY TEST Repeatability Test Results File The values for the SPC-1 IOPS, SPC-1 LRT, and the Repeatability Test measurements are listed in the tables below. SPC-1 IOPS Primary Metrics 459, Repeatability Test Phase 1 460, Repeatability Test Phase 2 459, The SPC-1 IOPS values in the above table were generated using 100% of the specified Business Scaling Unit (BSU) load level. Each of the Repeatability Test Phase values for SPC-1 IOPS must greater than 95% of the reported SPC-1 IOPS Primary Metric. SPC-1 LRT Primary Metrics 0.08 Repeatability Test Phase Repeatability Test Phase The average response time values in the SPC-1 LRT column were generated using 10% of the specified Business Scaling Unit (BSU) load level. Each of the Repeatability Test Phase values for SPC-1 LRT must be less than 105% of the reported SPC-1 LRT Primary Metric or less than the reported SPC-1 LRT Primary Metric plus one (1) millisecond (ms). A link to the test result file generated from each Repeatability Test Run is listed below. Repeatability Test Phase 1, Test Run 1 (LRT) Repeatability Test Phase 1, Test Run 2 (IOPS) Repeatability Test Phase 2, Test Run 1 (LRT) Repeatability Test Phase 2, Test Run 2 (IOPS)
49 SPC-1 BENCHMARK EXECUTION RESULTS Page 49 of 88 REPEATABILITY TEST Repeatability 1 LRT I/O Request Throughput Distribution Data 920 BSUs Start Stop Interval Duration Start-Up/Ramp-Up 3:50:34 3:56: :06:00 Measurement Interval 3:56:34 4:06: :10:00 60 second intervals All ASUs ASU1 ASU2 ASU3 0 46, , , , , , , , , , , , , , , , , , , , , , , , , , , , , , , , , , , , , , , , , , , , , , , , , , , , , , , , , , , , , , , , Average 45, , , , Repeatability 1 LRT I/O Request Throughput Distribution Graph
50 SPC-1 BENCHMARK EXECUTION RESULTS Page 50 of 88 REPEATABILITY TEST Repeatability 1 LRT Average Response Time (ms) Distribution Data 920 BSUs Start Stop Interval Duration Start-Up/Ramp-Up 3:50:34 3:56: :06:00 Measurement Interval 3:56:34 4:06: :10:00 60 second intervals All ASUs ASU1 ASU2 ASU Average Repeatability 1 LRT Average Response Time (ms) Distribution Graph
51 SPC-1 BENCHMARK EXECUTION RESULTS Page 51 of 88 REPEATABILITY TEST Repeatability 1 IOPS I/O Request Throughput Distribution Data 9,200 BSUs Start Stop Interval Duration Start-Up/Ramp-Up 4:08:16 4:14: :06:01 Measurement Interval 4:14:17 4:24: :10:00 60 second intervals All ASUs ASU1 ASU2 ASU , , , , , , , , , , , , , , , , , , , , , , , , , , , , , , , , , , , , , , , , , , , , , , , , , , , , , , , , , , , , , , , , Average 460, , , , Repeatability 1 IOPS I/O Request Throughput Distribution Graph
52 SPC-1 BENCHMARK EXECUTION RESULTS Page 52 of 88 REPEATABILITY TEST Repeatability 1 IOPS Average Response Time (ms) Distribution Data 9,200 BSUs Start Stop Interval Duration Start-Up/Ramp-Up 4:08:16 4:14: :06:01 Measurement Interval 4:14:17 4:24: :10:00 60 second intervals All ASUs ASU1 ASU2 ASU Average Repeatability 1 IOPS Average Response Time (ms) Distribution Graph

53 SPC-1 BENCHMARK EXECUTION RESULTS Page 53 of 88 REPEATABILITY TEST Repeatability 2 LRT I/O Request Throughput Distribution Data 920 BSUs Start Stop Interval Duration Start-Up/Ramp-Up 4:24:55 4:30: :06:00 Measurement Interval 4:30:55 4:40: :10:00 60 second intervals All ASUs ASU1 ASU2 ASU3 0 46, , , , , , , , , , , , , , , , , , , , , , , , , , , , , , , , , , , , , , , , , , , , , , , , , , , , , , , , , , , , , , , , Average 46, , , , Repeatability 2 LRT I/O Request Throughput Distribution Graph

54 SPC-1 BENCHMARK EXECUTION RESULTS Page 54 of 88 REPEATABILITY TEST Repeatability 2 LRT Average Response Time (ms) Distribution Data 920 BSUs Start Stop Interval Duration Start-Up/Ramp-Up 4:24:55 4:30: :06:00 Measurement Interval 4:30:55 4:40: :10:00 60 second intervals All ASUs ASU1 ASU2 ASU Average Repeatability 2 LRT Average Response Time (ms) Distribution Graph
55 SPC-1 BENCHMARK EXECUTION RESULTS Page 55 of 88 REPEATABILITY TEST Repeatability 2 IOPS I/O Request Throughput Distribution Data 9,200 BSUs Start Stop Interval Duration Start-Up/Ramp-Up 4:42:35 4:48: :06:01 Measurement Interval 4:48:36 4:58: :10:00 60 second intervals All ASUs ASU1 ASU2 ASU , , , , , , , , , , , , , , , , , , , , , , , , , , , , , , , , , , , , , , , , , , , , , , , , , , , , , , , , , , , , , , , , Average 459, , , , Repeatability 2 IOPS I/O Request Throughput Distribution Graph

56 SPC-1 BENCHMARK EXECUTION RESULTS Page 56 of 88 REPEATABILITY TEST Repeatability 2 IOPS Average Response Time (ms) Distribution Data 9,200 BSUs Start Stop Interval Duration Start-Up/Ramp-Up 4:42:35 4:48: :06:01 Measurement Interval 4:48:36 4:58: :10:00 60 second intervals All ASUs ASU1 ASU2 ASU Average Repeatability 2 IOPS Average Response Time (ms) Distribution Graph
57 SPC-1 BENCHMARK EXECUTION RESULTS Page 57 of 88 REPEATABILITY TEST Repeatability 1 (LRT) Measured Intensity Multiplier and Coefficient of Variation Clause IM Intensity Multiplier: The ratio of I/Os for each I/O stream relative to the total I/Os for all I/O streams (ASU1-1 ASU3-1) as required by the benchmark specification. Clauses and MIM Measured Intensity Multiplier: The Measured Intensity Multiplier represents the ratio of measured I/Os for each I/O stream relative to the total I/Os measured for all I/O streams (ASU1-1 ASU3-1). This value may differ from the corresponding Expected Intensity Multiplier by no more than 5%. Clause COV Coefficient of Variation: This measure of variation for the Measured Intensity Multiplier cannot exceed 0.2. ASU1-1 ASU1-2 ASU1-3 ASU1-4 ASU2-1 ASU2-2 ASU2-3 ASU3-1 IM MIM COV Repeatability 1 (IOPS) Measured Intensity Multiplier and Coefficient of Variation ASU1-1 ASU1-2 ASU1-3 ASU1-4 ASU2-1 ASU2-2 ASU2-3 ASU3-1 IM MIM COV Repeatability 2 (LRT) Measured Intensity Multiplier and Coefficient of Variation ASU1-1 ASU1-2 ASU1-3 ASU1-4 ASU2-1 ASU2-2 ASU2-3 ASU3-1 IM MIM COV
58 SPC-1 BENCHMARK EXECUTION RESULTS Page 58 of 88 REPEATABILITY TEST Repeatability 2 (IOPS) Measured Intensity Multiplier and Coefficient of Variation ASU1-1 ASU1-2 ASU1-3 ASU1-4 ASU2-1 ASU2-2 ASU2-3 ASU3-1 IM MIM COV
59 SPC-1 BENCHMARK EXECUTION RESULTS Page 59 of 88 DATA PERSISTENCE TEST Data Persistence Test Clause 6 The Data Persistence Test demonstrates the Tested Storage Configuration (TSC): Is capable of maintain data integrity across a power cycle. Ensures the transfer of data between Logical Volumes and host systems occurs without corruption or loss. The SPC-1 Workload Generator will write 16 block I/O requests at random over the total Addressable Storage Capacity of the TSC for ten (10) minutes at a minimum of 25% of the load used to generate the SPC-1 IOPS primary metric. The bit pattern selected to be written to each block as well as the address of the block will be retained in a log file. The Tested Storage Configuration (TSC) will be shutdown and restarted using a power off/power on cycle at the end of the above sequence of write operations. In addition, any caches employing battery backup must be flushed/emptied. The SPC-1 Workload Generator will then use the above log file to verify each block written contains the correct bit pattern. Clause The following content shall appear in this section of the FDR: 1. A listing or screen image of all input parameters supplied to the Workload Generator. 2. For the successful Data Persistence Test Run, a table illustrating key results. The content, appearance, and format of this table are specified in Table Information displayed in this table shall be obtained from the Test Run Results File referenced below in #3. 3. For the successful Data Persistence Test Run, the human readable Test Run Results file produced by the Workload Generator (may be contained in an appendix). SPC-1 Workload Generator Input Parameters The SPC-1 Workload Generator input parameters for the Sustainability, IOPS, Response Time Ramp, Repeatability, and Persistence Test Runs are documented in Appendix E: SPC-1 Workload Generator Input Parameters on Page 85. Data Persistence Test Results File A link to each test result file generated from each Data Persistence Test is listed below. Persistence 1 Test Results File Persistence 2 Test Results File
60 SPC-1 BENCHMARK EXECUTION RESULTS Page 60 of 88 DATA PERSISTENCE TEST Data Persistence Test Results Data Persistence Test Results Data Persistence Test Run Number: 1 Total Number of Logical Blocks Written 838, Total Number of Logical Blocks Verified 236,235,632 Total Number of Logical Blocks that Failed Verification 0 Time Duration for Writing Test Logical Blocks 10 minutes Size in bytes of each Logical Block 512 Number of Failed I/O Requests in the process of the Test 0 In some cases the same address was the target of multiple writes, which resulted in more Logical Blocks Written than Logical Blocks Verified. In the case of multiple writes to the same address, the pattern written and verified must be associated with the last write to that address.
61 SPC-1 AVAILABILITY DATE, PRICING INFORMATION, AND Page 61 of 88 ANOMALIES OR IRREGULARITIES PRICED STORAGE CONFIGURATION AVAILABILITY DATE Clause The committed delivery data for general availability (Availability Date) of all products that comprise the Priced Storage Configuration must be reported. When the Priced Storage Configuration includes products or components with different availability dates, the reported Availability Date for the Priced Storage Configuration must be the date at which all components are committed to be available. The as documented in this Full Disclosure Report is currently available for customer purchase and shipment. PRICING INFORMATION Clause The Executive Summary shall contain a pricing spreadsheet as documented in Clause Pricing information may be found in the Priced Storage Configuration Pricing section on page 16. TESTED STORAGE CONFIGURATION (TSC) AND PRICED STORAGE CONFIGURATION DIFFERENCES Clause The Executive Summary shall contain a list of all differences between the Tested Storage Configuration (TSC) and the Priced Storage Configuration. A list of all differences between the Tested Storage Configuration (TSC) and Priced Storage Configuration may be found in the Executive Summary portion of this document on page 16. ANOMALIES OR IRREGULARITIES Clause The FDR shall include a clear and complete description of any anomalies or irregularities encountered in the course of executing the SPC-1 benchmark that may in any way call into question the accuracy, verifiability, or authenticity of information published in this FDR. There were no anomalies or irregularities encountered during the SPC-1 Onsite Audit of the.
62 APPENDIX A: Page 62 of 88 SPC-1 GLOSSARY APPENDIX A: SPC-1 GLOSSARY Decimal (powers of ten) Measurement Units In the storage industry, the terms kilo, mega, giga, tera, peta, and exa are commonly used prefixes for computing performance and capacity. For the purposes of the SPC workload definitions, all of the following terms are defined in powers of ten measurement units. A kilobyte (KB) is equal to 1,000 (10 3 ) bytes. A megabyte (MB) is equal to 1,000,000 (10 6 ) bytes. A gigabyte (GB) is equal to 1,000,000,000 (10 9 ) bytes. A terabyte (TB) is equal to 1,000,000,000,000 (10 12 ) bytes. A petabyte (PB) is equal to 1,000,000,000,000,000 (10 15 ) bytes An exabyte (EB) is equal to 1,000,000,000,000,000,000 (10 18 ) bytes Binary (powers of two) Measurement Units The sizes reported by many operating system components use powers of two measurement units rather than power of ten units. The following standardized definitions and terms are also valid and may be used in this document. A kibibyte (KiB) is equal to 1,024 (2 10 ) bytes. A mebibyte (MiB) is equal to 1,048,576 (2 20 ) bytes. A gigibyte (GiB) is equal to 1,073,741,824 (2 30 ) bytes. A tebibyte (TiB) is equal to 1,099,511,627,776 (2 40 ) bytes. A pebibyte (PiB) is equal to 1,125,899,906,842,624 (2 50 ) bytes. An exbibyte (EiB) is equal to 1,152,921,504,606,846,967 (2 60 ) bytes. SPC-1 Data Repository Definitions Total ASU Capacity: The total storage capacity read and written in the course of executing the SPC-1 benchmark. Application Storage Unit (ASU): The logical interface between the storage and SPC-1 Workload Generator. The three ASUs (Data, User, and Log) are typically implemented on one or more Logical Volume. Logical Volume: The division of Addressable Storage Capacity into individually addressable logical units of storage used in the SPC-1 benchmark. Each Logical Volume is implemented as a single, contiguous address space. Addressable Storage Capacity: The total storage (sum of Logical Volumes) that can be read and written by application programs such as the SPC-1 Workload Generator.
63 APPENDIX A: Page 63 of 88 SPC-1 GLOSSARY Configured Storage Capacity: This capacity includes the Addressable Storage Capacity and any other storage (parity disks, hot spares, etc.) necessary to implement the Addressable Storage Capacity. Physical Storage Capacity: The formatted capacity of all storage devices physically present in the Tested Storage Configuration (TSC). Data Protection Overhead: The storage capacity required to implement the selected level of data protection. Required Storage: The amount of Configured Storage Capacity required to implement the Addressable Storage Configuration, excluding the storage required for the three ASUs. Global Storage Overhead: The amount of Physical Storage Capacity that is required for storage subsystem use and unavailable for use by application programs. Total Unused Storage: The amount of storage capacity available for use by application programs but not included in the Total ASU Capacity. SPC-1 Data Protection Levels Protected 1: The single point of failure of any storage device in the configuration will not result in permanent loss of access to or integrity of the SPC-1 Data Repository. Protected 2: The single point of failure of any component in the configuration will not result in permanent loss of access to or integrity of the SPC-1 Data Repository. SPC-1 Test Execution Definitions Average Response Time: The sum of the Response Times for all Measured I/O Requests divided by the total number of Measured I/O Requests. Completed I/O Request: An I/O Request with a Start Time and a Completion Time (see I/O Completion Types below). Completion Time: The time recorded by the Workload Generator when an I/O Request is satisfied by the TSC as signaled by System Software. Data Rate: The data transferred in all Measured I/O Requests in an SPC-1 Test Run divided by the length of the Test Run in seconds. Expected I/O Count: For any given I/O Stream and Test Phase, the product of 50 times the BSU level, the duration of the Test Phase in seconds, and the Intensity Multiplier for that I/O Stream. Failed I/O Request: Any I/O Request issued by the Workload Generator that could not be completed or was signaled as failed by System Software. A Failed I/O Request has no Completion Time (see I/O Completion Types below).
64 APPENDIX A: Page 64 of 88 SPC-1 GLOSSARY I/O Request Throughput: The total number of Measured I/O requests in an SPC-1 Test Run divided by the duration of the Measurement Interval in seconds. In-Flight I/O Request: An I/O Request issued by the I/O Command Generator to the TSC that has a recorded Start Time, but does not complete within the Measurement Interval (see I/O Completion Types below). Measured I/O Request: A Completed I/O Request with a Completion Time occurring within the Measurement Interval (see I/O Completion Types below). Measured Intensity Multiplier: The percentage of all Measured I/O Requests that were issued by a given I/O Stream. Measurement Interval: The finite and contiguous time period, after the TSC has reached Steady State, when data is collected by a Test Sponsor to generate an SPC-1 test result or support an SPC-1 test result. Ramp-Up: The time required for the Benchmark Configuration (BC) to produce Steady State throughput after the Workload Generator begins submitting I/O Requests to the TSC for execution. Ramp-Down: The time required for the BC to complete all I/O Requests issued by the Workload Generator. The Ramp-Down period begins when the Workload Generator ceases to issue new I/O Requests to the TSC. Response Time: The Response Time of a Measured I/O Request is its Completion Time minus its Start Time. Start Time: The time recorded by the Workload Generator when an I/O Request is submitted, by the Workload Generator, to the System Software for execution on the Tested Storage Configuration (TSC). Start-Up: The period that begins after the Workload Generator starts to submit I/O requests to the TSC and ends at the beginning of the Measurement Interval. Shut-Down: The period between the end of the Measurement Interval and the time when all I/O Requests issued by the Workload Generator have completed or failed. Steady State: The consistent and sustainable throughput of the TSC. During this period the load presented to the TSC by the Workload Generator is constant. Test: A collection of Test Phases and or Test Runs sharing a common objective. Test Run: The execution of SPC-1 for the purpose of producing or supporting an SPC-1 test result. SPC-1 Test Runs may have a finite and measured Ramp-Up period, Start-Up period, Shut-Down period, and Ramp-Down period as illustrated in the SPC-1 Test Run Components below. All SPC-1 Test Runs shall have a Steady State period and a Measurement Interval.
65 APPENDIX A: Page 65 of 88 SPC-1 GLOSSARY Test Phase: A collection of one or more SPC-1 Test Runs sharing a common objective and intended to be run in a specific sequence. I/O Completion Types Start Time Completion Time Completed I/O Measured I/O Completed I/O In-Flight I/O Failed I/O X Error or Failure Failed I/O Time Start-Up Measurement Interval Shut-Down SPC-1 Test Run Components Start-Up Measurement Interval Shut-Down I/O Request Throughput Time Ramp-Up Ramp-Down Steady State Period
66 APPENDIX B: Page 66 of 88 CUSTOMER TUNABLE PARAMETERS AND OPTIONS APPENDIX B: CUSTOMER TUNABLE PARAMETERS AND OPTIONS Windows 2008 Server Registry Settings The following Windows 2008 Server registry settings were either changed from their default values or added if they did not exist. Settings changed from their default values will have the default value listed in parenthesis and new settings will be annotated with (new). SANsymphony-V Cache Settings for defined Virtual Disks [HKEY_LOCAL_MACHINE\SYSTEM\CurrentControlSet\services\DcsCache\Parameters] (will be applied to each virtual disk) WriteSizeStop=dword: ( ) Maximum amount of dirty data (cache memory locations that have changed but not committed to the backend) in the cache. ReadAhead=dword: ( ) Enable prefetching. Setting means no prefetching IoQueueCount=dword: ( ) Max number of outstanding IOs to the backend IoQueueSize=dword: ( ) Max number of blocks that can be outstanding to the backend AllowRewrite=dword: ( ) Enable rewrite. When set, an initiator can overwrite dirty data. CmdPoolSize=dword:0000fa00 (new) Number of storage commands that may be simultaneously in progress (global to the entire storage node) MaxLowWaterMark=dword: (new) Point at which the cache is critically short of available blocks and will begin to return busy status to requests. CheckRegSecs=dword: c (new) interval (seconds) at which the driver will check for changes to the registry parameters WriteThruLowWaterMark=dword: (new) Point at which the cache will begin to process all write requests by synchronizing them with the backend. (begins writethrough)
67 APPENDIX B: Page 67 of 88 CUSTOMER TUNABLE PARAMETERS AND OPTIONS SANsymphony-V Cache settings for defined specific Virtual Disks HKEY_LOCAL_MACHINE\SYSTEM\CurrentControlSet\services\DcsCache\Parameters\V.{ 434ce28d-45d9-11e5-a922-9abe94f83b67} ASU3_1="" IoQueueCount=dword: c ( ) Max number of outstanding IOs to the backend IoQueueSize=dword: ( ) Max number of blocks that can be outstanding to the backend WriteQueueCount=dword: c (IoQueueCount) Max number of outstanding writes to the backend WriteQueueSize=dword: (IoQueueSize) Max number of write blocks that can be outstanding to the backend HKEY_LOCAL_MACHINE\SYSTEM\CurrentControlSet\services\DcsCache\Parameters\V.{ 434ce28f-45d9-11e5-a922-9abe94f83b67} ASU3_2="" IoQueueCount=dword: c ( ) Max number of outstanding IOs to the backend IoQueueSize=dword: ( ) Max number of blocks that can be outstanding to the backend WriteQueueCount=dword: c (IoQueueCount) Max number of outstanding writes to the backend WriteQueueSize=dword: (IoQueueSize) Max number of write blocks that can be outstanding to the backend HKEY_LOCAL_MACHINE\SYSTEM\CurrentControlSet\services\DcsCache\Parameters\V.{ 434ce291-45d9-11e5-a922-9abe94f83b67} ASU3_3="" IoQueueCount=dword: c ( ) Max number of outstanding IOs to the backend IoQueueSize=dword: ( ) Max number of blocks that can be outstanding to the backend WriteQueueCount=dword: c (IoQueueCount) Max number of outstanding writes to the backend WriteQueueSize=dword: (IoQueueSize) Max number of write blocks that can be outstanding to the backend
68 APPENDIX B: Page 68 of 88 CUSTOMER TUNABLE PARAMETERS AND OPTIONS HKEY_LOCAL_MACHINE\SYSTEM\CurrentControlSet\services\DcsCache\Parameters\V.{ 434ce293-45d9-11e5-a922-9abe94f83b67} ASU3_4="" IoQueueCount=dword: ( ) Max number of outstanding IOs to the backend IoQueueSize=dword: ( ) Max number of blocks that can be outstanding to the backend WriteQueueCount=dword: (IoQueueCount) Max number of outstanding writes to the backend WriteQueueSize=dword: (IoQueueSize) Max number of write blocks that can be outstanding to the backend HKEY_LOCAL_MACHINE\SYSTEM\CurrentControlSet\services\DcsCache\Parameters\V.{ 434ce293-45d9-11e5-a922-9abe94f83b67} ASU3_5="" IoQueueCount=dword: ( ) Max number of outstanding IOs to the backend IoQueueSize=dword: ( ) Max number of blocks that can be outstanding to the backend WriteQueueCount=dword: (IoQueueCount) Max number of outstanding writes to the backend WriteQueueSize=dword: (IoQueueSize) Max number of write blocks that can be outstanding to the backend HKEY_LOCAL_MACHINE\SYSTEM\CurrentControlSet\services\DcsCache\Parameters\V.{ 434ce293-45d9-11e5-a922-9abe94f83b67} ASU3_6="" IoQueueCount=dword: ( ) Max number of outstanding IOs to the backend IoQueueSize=dword: ( ) Max number of blocks that can be outstanding to the backend WriteQueueCount=dword: (IoQueueCount) Max number of outstanding writes to the backend WriteQueueSize=dword: (IoQueueSize) Max number of write blocks that can be outstanding to the backend
69 APPENDIX B: Page 69 of 88 CUSTOMER TUNABLE PARAMETERS AND OPTIONS SANsymphony-V Poller settings HKEY_LOCAL_MACHINE\SYSTEM\CurrentControlSet\services\DcsPoll\Parameters LoadHighWaterMark=dword: ( ) Determines when a new scheduler instance is spawned. LoadLowWaterMark=dword: ( a) Determines when a scheduler instance is retired. MinPollers=dword: f ( ) (new) Minimum number of schedulers CpuAffinity=dword: ( ) (new) Hint that determines scheduler to CPU affinity. (1 st on CPU1, 2 nd on CPU2, etc.) MaxPollers=dword: f ( a) (new) Allows max pollers to increase to 31 and addition of logical Ports to increase to 31 The MinPollers, CpuAffinity and MaxPollers registry entries do not appear by default in the registry editor. If not created explicitly, the default values listed in parenthesis will be used. Those registry entries were explicitly created with the documented values for this benchmark configuration. SANsymphony-V settings for Pools HKEY_LOCAL_MACHINE\SYSTEM\CurrentControlSet\services\DcsPool\Parameters DisableAutoTrim=dword: ( ) (new) Disable Auto Trim Storage Allocation Units are not reclaimed automatically when filled with zeros. DisableZeroWrites=dword: ( ) (new) Disable filling Storage Allocation Units (SAUs) with Zeros when doing garbage collection or initialization. Means newly added disks to pool have been zeroed (e.g. low level format) The DisableAutoTrim and DisableZeroWrites registry entries do not appear by default in the registry editor. If not created explicitly, the default values listed in parenthesis will be used. Those registry entries were explicitly created with the documented values for this benchmark configuration.
70 APPENDIX B: Page 70 of 88 CUSTOMER TUNABLE PARAMETERS AND OPTIONS SANsymphony-V settings for specific Pools HKEY_LOCAL_MACHINE\SYSTEM\CurrentControlSet\services\DcsPool\Parameters\Max ActiveIOsPerDisk (Set per pool by specifying the Pool s GUID) {0272bb99-5afc-11e5-ae3f-9abe94f83b67}=dword: ( ) 4MB_Pool1, 128 IOs per disk in this pool {0272bbaf-5afc-11e5-ae3f-9abe94f83b67}=dword: ( ) 4MB_Pool2, 64 IOs per disk in this pool

. 2. Open and log in to the SANsymphony-V Management Console using the following steps.")
71 APPENDIX C: Page 71 of 88 TESTED STORAGE CONFIGURATION (TSC) CREATION APPENDIX C: TESTED STORAGE CONFIGURATION (TSC) CREATION 1. Install SANsymphony-V 10.0 Storage Software: The software installation is performed by running a self-extracting executable file After installation, the SANsymphony-V Management Console can be accessed from the Windows start menu or by using the desktop shortcut with the DataCore logo. Online help for using the Management Console is located at (refer the help topic, SANSymphony-V Management Console for more information). 2. Open and log in to the SANsymphony-V Management Console using the following steps. At the end of this step, you will be logged into the management and configuration console: a. On the system desktop, double-click on the SANsymphony-V icon to start the management console. b. Select the Use default credentials checkbox and click Connect to proceed to the management console: 3. Create pools from managed physical disk resources with the following steps: a. In the management console, click Disk Pools in the left panel labeled DataCore Servers, then click Create Disk Pool in the main panel to initiate the next step.
:, set the Maximum number of tiers: to 1, and select the proper type and amount of physical disks in")
72 APPENDIX C: Page 72 of 88 TESTED STORAGE CONFIGURATION (TSC) CREATION b. On the subsequent screen, in the main panel, complete the Name:, Storage allocation unit size (MB):, set the Maximum number of tiers: to 1, and select the proper type and amount of physical disks in accordance with the table listed below the following screenshot. Click the Create button to create the pool after selecting the disks. (Note: 4MB_Pool1 has been created as an example). Repeat this step for each of the 6 pools that are to be created: Pool Number PoolName Storage Allocation Unit Size(MB) Number of physical Disks to select (in lower panel) Type of Physical Disk (from Name column in lower panel) 1 4MB_Pool1 4 5 ATA SAMSUNG MZ7KM MB_Pool2 4 3 ATA SAMSUNG MZ7KM MB_ASU LSI MR9361-8i 4 32MB_ASU LSI MR9361-8i 5 32MB_ASU LSI MR9361-8i 6 32MB_ASU LSI MR9361-8i

73 APPENDIX C: Page 73 of 88 TESTED STORAGE CONFIGURATION (TSC) CREATION 4. Mirror each pooled physical disk in each pool created in step 3b by performing step 4a for each pool, then step 4b for each disk in the pool. a. Select the pool. In the management console, click on a disk pool in the left panel, then click the tab labeled Physical Disks in the main panel and then select a disk in the panel below that tab. b. Right-click on the disk (Name column) and select Add Mirror Disk and select a disk of the same type to mirror to.

74 APPENDIX C: Page 74 of 88 TESTED STORAGE CONFIGURATION (TSC) CREATION 5. Create 14 Virtual Disks repeating steps 5a through 5d 14 times, once for each of the virtual disks to be created, using the details in the following table. The virtual disks created in this step will be mapped and are the SPC-1 Logical Volumes use to define the SPC-1 ASUs. Virtual Disk Number Name: Size: (GB) Source Pool: 1 ASU1_ MB_Pool1 2 ASU1_ MB_Pool1 3 ASU1_ MB_Pool1 4 ASU1_ MB_Pool2 5 ASU1_ MB_Pool1 6 ASU1_ MB_Pool2 7 ASU2_ MB_Pool2 8 ASU2_ MB_Pool1 9 ASU3_ MB_ASU ASU3_ MB_ASU ASU3_ MB_ASU ASU3_ MB_ASU ASU3_ MB_ASU ASU3_ MB_ASU3.4 a. In the management console, click Virtual Disks in the left panel labeled DataCore Servers, then click Create Virtual Disks in the main panel.
75 APPENDIX C: Page 75 of 88 TESTED STORAGE CONFIGURATION (TSC) CREATION b. On the subsequent screen, complete the Name: and the Size (GB): as described in the table above. Click the Next button to proceed to the next step. (Note: ASU1_1 is being created as an example): c. On the subsequent screen, set the storage source by clicking on the appropriate entry (Refer to the above table in step 5.) under the Pool Name column and proceed to the next step by clicking the Next button,

 to increase logical ports with the following")
 b.")
76 APPENDIX C: Page 76 of 88 TESTED STORAGE CONFIGURATION (TSC) CREATION 6. Use the Windows 2008 Server registry editor to make the changes documented in Appendix B: Customer Tunable Parameters and Options on page Install logical (Null) ports from 5 to 31 (27 ports total). Open the Windows Device Manager and add legacy hardware (see step 7a) to increase logical ports with the following sequence of steps repeated 27 times. Each iteration will increment the logical device number by 1. a. Right click on top of tree and add legacy hardware (see example screenshot) b. Install the hardware that I manually select (Advanced) c. Choose DataCore Fibre-Channel Adapters (see example screenshot)

77 APPENDIX C: Page 77 of 88 TESTED STORAGE CONFIGURATION (TSC) CREATION d. Click the Next button to install the Null Port Adapter (see example screenshot) 8. Double-click the desktop icon labeled SANsymphony-V cmdlet shell to open it and execute the script ServeVD_jb_bal.ps1. This script maps the virtual disks created in step 5 to the host via the specified logical ports created in step 7. a. Maps virtual disks via logical ports 1-9,11-14 and for ASU1_1,2,3,5 and logical ports 18,19 for ASU2_2. b. Maps virtual disks via logical ports 10 for ASU1_4 and ASU1_6 and for ASU2_1. c. Maps virtual disks for ASU3_1-ASU3_6 via logical ports ServeVD_jb_bal.ps1 Connect-DcsServer Write-Host "ASU1_1" Serve-DcsVirtualDisk -Machine x3650spc3 -VirtualDisk ASU1_1 -InitiatorPort "Loopback Port 1" -TargetPort "Loopback Port 1" Write-Host "ASU1_1" Serve-DcsVirtualDisk -Machine x3650spc3 -VirtualDisk ASU1_1 -InitiatorPort "Loopback Port 2" -TargetPort "Loopback Port 2" Write-Host "ASU1_1" Serve-DcsVirtualDisk -Machine x3650spc3 -VirtualDisk ASU1_1 -InitiatorPort "Loopback Port 29" -TargetPort "Loopback Port 29" Write-Host "ASU1_2" Serve-DcsVirtualDisk -Machine x3650spc3 -VirtualDisk ASU1_2 -InitiatorPort "Loopback Port 3" -TargetPort "Loopback Port 3" Write-Host "ASU1_2" Serve-DcsVirtualDisk -Machine x3650spc3 -VirtualDisk ASU1_2 -InitiatorPort "Loopback Port 4" -TargetPort "Loopback Port 4" Write-Host "ASU1_2" Serve-DcsVirtualDisk -Machine x3650spc3 -VirtualDisk ASU1_2 -InitiatorPort "Loopback Port 5" -TargetPort "Loopback Port 5" Write-Host "ASU1_2" Serve-DcsVirtualDisk -Machine x3650spc3 -VirtualDisk ASU1_2 -InitiatorPort "Loopback Port 6" -TargetPort "Loopback Port 6"
78 APPENDIX C: Page 78 of 88 TESTED STORAGE CONFIGURATION (TSC) CREATION Write-Host "ASU1_2" Serve-DcsVirtualDisk -Machine x3650spc3 -VirtualDisk ASU1_2 -InitiatorPort "Loopback Port 7" -TargetPort "Loopback Port 7" Write-Host "ASU1_2" Serve-DcsVirtualDisk -Machine x3650spc3 -VirtualDisk ASU1_2 -InitiatorPort "Loopback Port 30" -TargetPort "Loopback Port 30" Write-Host "ASU1_3" Serve-DcsVirtualDisk -Machine x3650spc3 -VirtualDisk ASU1_3 -InitiatorPort "Loopback Port 8" -TargetPort "Loopback Port 8" Write-Host "ASU1_3" Serve-DcsVirtualDisk -Machine x3650spc3 -VirtualDisk ASU1_3 -InitiatorPort "Loopback Port 9" -TargetPort "Loopback Port 9" Write-Host "ASU1_4" Serve-DcsVirtualDisk -Machine x3650spc3 -VirtualDisk ASU1_4 -InitiatorPort "Loopback Port 10" -TargetPort "Loopback Port 10" Write-Host "ASU1_5" Serve-DcsVirtualDisk -Machine x3650spc3 -VirtualDisk ASU1_5 -InitiatorPort "Loopback Port 11" -TargetPort "Loopback Port 11" Write-Host "ASU1_5" Serve-DcsVirtualDisk -Machine x3650spc3 -VirtualDisk ASU1_5 -InitiatorPort "Loopback Port 12" -TargetPort "Loopback Port 12" Write-Host "ASU1_5" Serve-DcsVirtualDisk -Machine x3650spc3 -VirtualDisk ASU1_5 -InitiatorPort "Loopback Port 13" -TargetPort "Loopback Port 13" Write-Host "ASU1_5" Serve-DcsVirtualDisk -Machine x3650spc3 -VirtualDisk ASU1_5 -InitiatorPort "Loopback Port 14" -TargetPort "Loopback Port 14" Write-Host "ASU1_5" Serve-DcsVirtualDisk -Machine x3650spc3 -VirtualDisk ASU1_5 -InitiatorPort "Loopback Port 31" -TargetPort "Loopback Port 31" Write-Host "ASU1_6" Serve-DcsVirtualDisk -Machine x3650spc3 -VirtualDisk ASU1_6 -InitiatorPort "Loopback Port 10" -TargetPort "Loopback Port 10" Write-Host "ASU2_1" Serve-DcsVirtualDisk -Machine x3650spc3 -VirtualDisk ASU2_1 -InitiatorPort "Loopback Port 15" -TargetPort "Loopback Port 15" Write-Host "ASU2_1" Serve-DcsVirtualDisk -Machine x3650spc3 -VirtualDisk ASU2_1 -InitiatorPort "Loopback Port 16" -TargetPort "Loopback Port 16" Write-Host "ASU2_1" Serve-DcsVirtualDisk -Machine x3650spc3 -VirtualDisk ASU2_1 -InitiatorPort "Loopback Port 17" -TargetPort "Loopback Port 17"
79 APPENDIX C: Page 79 of 88 TESTED STORAGE CONFIGURATION (TSC) CREATION Write-Host "ASU2_2" Serve-DcsVirtualDisk -Machine x3650spc3 -VirtualDisk ASU2_2 -InitiatorPort "Loopback Port 18" -TargetPort "Loopback Port 18" Write-Host "ASU2_2" Serve-DcsVirtualDisk -Machine x3650spc3 -VirtualDisk ASU2_2 -InitiatorPort "Loopback Port 19" -TargetPort "Loopback Port 19" Write-Host "ASU3_1" Serve-DcsVirtualDisk -Machine x3650spc3 -VirtualDisk ASU3_1 -InitiatorPort "Loopback Port 20" -TargetPort "Loopback Port 20" Write-Host "ASU3_1" Serve-DcsVirtualDisk -Machine x3650spc3 -VirtualDisk ASU3_1 -InitiatorPort "Loopback Port 21" -TargetPort "Loopback Port 21" Write-Host "ASU3_1" Serve-DcsVirtualDisk -Machine x3650spc3 -VirtualDisk ASU3_1 -InitiatorPort "Loopback Port 22" -TargetPort "Loopback Port 22" Write-Host "ASU3_1" Serve-DcsVirtualDisk -Machine x3650spc3 -VirtualDisk ASU3_1 -InitiatorPort "Loopback Port 23" -TargetPort "Loopback Port 23" Write-Host "ASU3_1" Serve-DcsVirtualDisk -Machine x3650spc3 -VirtualDisk ASU3_1 -InitiatorPort "Loopback Port 24" -TargetPort "Loopback Port 24" Write-Host "ASU3_1" Serve-DcsVirtualDisk -Machine x3650spc3 -VirtualDisk ASU3_1 -InitiatorPort "Loopback Port 25" -TargetPort "Loopback Port 25" Write-Host "ASU3_1" Serve-DcsVirtualDisk -Machine x3650spc3 -VirtualDisk ASU3_1 -InitiatorPort "Loopback Port 26" -TargetPort "Loopback Port 26" Write-Host "ASU3_1" Serve-DcsVirtualDisk -Machine x3650spc3 -VirtualDisk ASU3_1 -InitiatorPort "Loopback Port 27" -TargetPort "Loopback Port 27" Write-Host "ASU3_1" Serve-DcsVirtualDisk -Machine x3650spc3 -VirtualDisk ASU3_1 -InitiatorPort "Loopback Port 28" -TargetPort "Loopback Port 28" Write-Host "ASU3_2" Serve-DcsVirtualDisk -Machine x3650spc3 -VirtualDisk ASU3_2 -InitiatorPort "Loopback Port 20" -TargetPort "Loopback Port 20" Write-Host "ASU3_2" Serve-DcsVirtualDisk -Machine x3650spc3 -VirtualDisk ASU3_2 -InitiatorPort "Loopback Port 21" -TargetPort "Loopback Port 21" Write-Host "ASU3_2" Serve-DcsVirtualDisk -Machine x3650spc3 -VirtualDisk ASU3_2 -InitiatorPort "Loopback Port 22" -TargetPort "Loopback Port 22" Write-Host "ASU3_2" Serve-DcsVirtualDisk -Machine x3650spc3 -VirtualDisk ASU3_2 -InitiatorPort "Loopback Port 23" -TargetPort "Loopback Port 23" Write-Host "ASU3_2"
80 APPENDIX C: Page 80 of 88 TESTED STORAGE CONFIGURATION (TSC) CREATION Serve-DcsVirtualDisk -Machine x3650spc3 -VirtualDisk ASU3_2 -InitiatorPort "Loopback Port 24" -TargetPort "Loopback Port 24" Write-Host "ASU3_2" Serve-DcsVirtualDisk -Machine x3650spc3 -VirtualDisk ASU3_2 -InitiatorPort "Loopback Port 25" -TargetPort "Loopback Port 25" Write-Host "ASU3_2" Serve-DcsVirtualDisk -Machine x3650spc3 -VirtualDisk ASU3_2 -InitiatorPort "Loopback Port 26" -TargetPort "Loopback Port 26" Write-Host "ASU3_2" Serve-DcsVirtualDisk -Machine x3650spc3 -VirtualDisk ASU3_2 -InitiatorPort "Loopback Port 27" -TargetPort "Loopback Port 27" Write-Host "ASU3_2" Serve-DcsVirtualDisk -Machine x3650spc3 -VirtualDisk ASU3_2 -InitiatorPort "Loopback Port 28" -TargetPort "Loopback Port 28" Write-Host "ASU3_3" Serve-DcsVirtualDisk -Machine x3650spc3 -VirtualDisk ASU3_3 -InitiatorPort "Loopback Port 20" -TargetPort "Loopback Port 20" Write-Host "ASU3_3" Serve-DcsVirtualDisk -Machine x3650spc3 -VirtualDisk ASU3_3 -InitiatorPort "Loopback Port 21" -TargetPort "Loopback Port 21" Write-Host "ASU3_3" Serve-DcsVirtualDisk -Machine x3650spc3 -VirtualDisk ASU3_3 -InitiatorPort "Loopback Port 22" -TargetPort "Loopback Port 22" Write-Host "ASU3_3" Serve-DcsVirtualDisk -Machine x3650spc3 -VirtualDisk ASU3_3 -InitiatorPort "Loopback Port 23" -TargetPort "Loopback Port 23" Write-Host "ASU3_3" Serve-DcsVirtualDisk -Machine x3650spc3 -VirtualDisk ASU3_3 -InitiatorPort "Loopback Port 24" -TargetPort "Loopback Port 24" Write-Host "ASU3_3" Serve-DcsVirtualDisk -Machine x3650spc3 -VirtualDisk ASU3_3 -InitiatorPort "Loopback Port 25" -TargetPort "Loopback Port 25" Write-Host "ASU3_3" Serve-DcsVirtualDisk -Machine x3650spc3 -VirtualDisk ASU3_3 -InitiatorPort "Loopback Port 26" -TargetPort "Loopback Port 26" Write-Host "ASU3_3" Serve-DcsVirtualDisk -Machine x3650spc3 -VirtualDisk ASU3_3 -InitiatorPort "Loopback Port 27" -TargetPort "Loopback Port 27" Write-Host "ASU3_3" Serve-DcsVirtualDisk -Machine x3650spc3 -VirtualDisk ASU3_3 -InitiatorPort "Loopback Port 28" -TargetPort "Loopback Port 28" Write-Host "ASU3_4" Serve-DcsVirtualDisk -Machine x3650spc3 -VirtualDisk ASU3_4 -InitiatorPort "Loopback Port 20" -TargetPort "Loopback Port 20" Write-Host "ASU3_4"
81 APPENDIX C: Page 81 of 88 TESTED STORAGE CONFIGURATION (TSC) CREATION Serve-DcsVirtualDisk -Machine x3650spc3 -VirtualDisk ASU3_4 -InitiatorPort "Loopback Port 21" -TargetPort "Loopback Port 21" Write-Host "ASU3_4" Serve-DcsVirtualDisk -Machine x3650spc3 -VirtualDisk ASU3_4 -InitiatorPort "Loopback Port 22" -TargetPort "Loopback Port 22" Write-Host "ASU3_4" Serve-DcsVirtualDisk -Machine x3650spc3 -VirtualDisk ASU3_4 -InitiatorPort "Loopback Port 23" -TargetPort "Loopback Port 23" Write-Host "ASU3_4" Serve-DcsVirtualDisk -Machine x3650spc3 -VirtualDisk ASU3_4 -InitiatorPort "Loopback Port 24" -TargetPort "Loopback Port 24" Write-Host "ASU3_4" Serve-DcsVirtualDisk -Machine x3650spc3 -VirtualDisk ASU3_4 -InitiatorPort "Loopback Port 25" -TargetPort "Loopback Port 25" Write-Host "ASU3_4" Serve-DcsVirtualDisk -Machine x3650spc3 -VirtualDisk ASU3_4 -InitiatorPort "Loopback Port 26" -TargetPort "Loopback Port 26" Write-Host "ASU3_4" Serve-DcsVirtualDisk -Machine x3650spc3 -VirtualDisk ASU3_4 -InitiatorPort "Loopback Port 27" -TargetPort "Loopback Port 27" Write-Host "ASU3_4" Serve-DcsVirtualDisk -Machine x3650spc3 -VirtualDisk ASU3_4 -InitiatorPort "Loopback Port 28" -TargetPort "Loopback Port 28" Write-Host "ASU3_5" Serve-DcsVirtualDisk -Machine x3650spc3 -VirtualDisk ASU3_5 -InitiatorPort "Loopback Port 20" -TargetPort "Loopback Port 20" Write-Host "ASU3_5" Serve-DcsVirtualDisk -Machine x3650spc3 -VirtualDisk ASU3_5 -InitiatorPort "Loopback Port 21" -TargetPort "Loopback Port 21" Write-Host "ASU3_5" Serve-DcsVirtualDisk -Machine x3650spc3 -VirtualDisk ASU3_5 -InitiatorPort "Loopback Port 22" -TargetPort "Loopback Port 22" Write-Host "ASU3_5" Serve-DcsVirtualDisk -Machine x3650spc3 -VirtualDisk ASU3_5 -InitiatorPort "Loopback Port 23" -TargetPort "Loopback Port 23" Write-Host "ASU3_5" Serve-DcsVirtualDisk -Machine x3650spc3 -VirtualDisk ASU3_5 -InitiatorPort "Loopback Port 24" -TargetPort "Loopback Port 24" Write-Host "ASU3_5" Serve-DcsVirtualDisk -Machine x3650spc3 -VirtualDisk ASU3_5 -InitiatorPort "Loopback Port 25" -TargetPort "Loopback Port 25" Write-Host "ASU3_5" Serve-DcsVirtualDisk -Machine x3650spc3 -VirtualDisk ASU3_5 -InitiatorPort "Loopback Port 26" -TargetPort "Loopback Port 26" Write-Host "ASU3_5" Serve-DcsVirtualDisk -Machine x3650spc3 -VirtualDisk ASU3_5 -InitiatorPort "Loopback Port 27" -TargetPort "Loopback Port 27"
82 APPENDIX C: Page 82 of 88 TESTED STORAGE CONFIGURATION (TSC) CREATION Write-Host "ASU3_5" Serve-DcsVirtualDisk -Machine x3650spc3 -VirtualDisk ASU3_5 -InitiatorPort "Loopback Port 28" -TargetPort "Loopback Port 28" Write-Host "ASU3_6" Serve-DcsVirtualDisk -Machine x3650spc3 -VirtualDisk ASU3_6 -InitiatorPort "Loopback Port 20" -TargetPort "Loopback Port 20" Write-Host "ASU3_6" Serve-DcsVirtualDisk -Machine x3650spc3 -VirtualDisk ASU3_6 -InitiatorPort "Loopback Port 21" -TargetPort "Loopback Port 21" Write-Host "ASU3_6" Serve-DcsVirtualDisk -Machine x3650spc3 -VirtualDisk ASU3_6 -InitiatorPort "Loopback Port 22" -TargetPort "Loopback Port 22" Write-Host "ASU3_6" Serve-DcsVirtualDisk -Machine x3650spc3 -VirtualDisk ASU3_6 -InitiatorPort "Loopback Port 23" -TargetPort "Loopback Port 23" Write-Host "ASU3_6" Serve-DcsVirtualDisk -Machine x3650spc3 -VirtualDisk ASU3_6 -InitiatorPort "Loopback Port 24" -TargetPort "Loopback Port 24" Write-Host "ASU3_6" Serve-DcsVirtualDisk -Machine x3650spc3 -VirtualDisk ASU3_6 -InitiatorPort "Loopback Port 25" -TargetPort "Loopback Port 25" Write-Host "ASU3_6" Serve-DcsVirtualDisk -Machine x3650spc3 -VirtualDisk ASU3_6 -InitiatorPort "Loopback Port 26" -TargetPort "Loopback Port 26" Write-Host "ASU3_6" Serve-DcsVirtualDisk -Machine x3650spc3 -VirtualDisk ASU3_6 -InitiatorPort "Loopback Port 27" -TargetPort "Loopback Port 27" Write-Host "ASU3_6" Serve-DcsVirtualDisk -Machine x3650spc3 -VirtualDisk ASU3_6 -InitiatorPort "Loopback Port 28" -TargetPort "Loopback Port 28" Disconnect-DcsServer
83 APPENDIX D: Page 83 of 88 SPC-1 WORKLOAD GENERATOR STORAGE COMMANDS AND PARAMETERS APPENDIX D: SPC-1 WORKLOAD GENERATOR STORAGE COMMANDS AND PARAMETERS ASU Pre-Fill The content of command and parameter file, used in this benchmark to execute the required ASU pre-fill, is listed below. compratio=1 sd=default,threads=8 sd=asu3_2,lun=\\.\physicaldrive35,threads=4 sd=asu3_5,lun=\\.\physicaldrive38,threads=4 sd=asu3_6,lun=\\.\physicaldrive39,threads=4 sd=asu1_4,lun=\\.\physicaldrive29,threads=4 sd=asu3_3,lun=\\.\physicaldrive36,threads=4 sd=asu3_4,lun=\\.\physicaldrive37,threads=4 sd=asu1_5,lun=\\.\physicaldrive30,threads=4 sd=asu1_1,lun=\\.\physicaldrive26,threads=4 sd=asu1_6,lun=\\.\physicaldrive31,threads=4 sd=asu1_2,lun=\\.\physicaldrive27,threads=4 sd=asu3_1,lun=\\.\physicaldrive34,threads=4 sd=asu2_1,lun=\\.\physicaldrive32,threads=4 sd=asu2_2,lun=\\.\physicaldrive33,threads=4 sd=asu1_3,lun=\\.\physicaldrive28,threads=4 wd=default,rdpct=0,seek=-1,xfersize=512k wd=wd1,sd=asu3_2 wd=wd2,sd=asu3_5 wd=wd3,sd=asu3_6 wd=wd4,sd=asu1_4 wd=wd5,sd=asu3_3 wd=wd6,sd=asu3_4 wd=wd7,sd=asu1_5 wd=wd8,sd=asu1_1 wd=wd9,sd=asu1_6 wd=wd10,sd=asu1_2 wd=wd11,sd=asu3_1 wd=wd12,sd=asu2_1 wd=wd13,sd=asu2_2 wd=wd14,sd=asu1_3 rd=asuprefill,wd=wd*,iorate=max,elapsed=24h,interval=60
84 APPENDIX D: Page 84 of 88 SPC-1 WORKLOAD GENERATOR STORAGE COMMANDS AND PARAMETERS Primary Metrics, Repeatability and Persistence Tests The content of SPC-1 Workload Generator command and parameter files used in this benchmark to execute the Primary Metrics (Sustainability Test Phase, IOPS Test Phase, and Response Time Ramp Test Phase) and Repeatability (Repeatability Test Phase 1 and Repeatability Test Phase 2) Tests are listed below. javaparms="-xmx768m" sd=asu1_1,lun=\\.\physicaldrive26 sd=asu1_2,lun=\\.\physicaldrive27 sd=asu1_3,lun=\\.\physicaldrive28 sd=asu1_4,lun=\\.\physicaldrive29 sd=asu1_5,lun=\\.\physicaldrive30 sd=asu1_6,lun=\\.\physicaldrive31 sd=asu2_1,lun=\\.\physicaldrive32 sd=asu2_2,lun=\\.\physicaldrive33 sd=asu3_1,lun=\\.\physicaldrive34 sd=asu3_2,lun=\\.\physicaldrive35 sd=asu3_3,lun=\\.\physicaldrive36 sd=asu3_4,lun=\\.\physicaldrive37 sd=asu3_5,lun=\\.\physicaldrive38 sd=asu3_6,lun=\\.\physicaldrive39
85 APPENDIX E: Page 85 of 88 SPC-1 WORKLOAD GENERATOR INPUT PARAMETERS APPENDIX E: SPC-1 WORKLOAD GENERATOR INPUT PARAMETERS The following script, RunBench.bat, was invoked to execute the required ASU pre-fill, execute the Primary Metrics Test (Sustainability Test Phase, IOPS Test Phase, and Response Time Ramp Test Phase), Repeatability Test (Repeatability Test Phase 1 and Repeatability Test Phase 2) and the SPC-1 Persistence Test Run 1 (write phase) in an uninterrupted sequence. The second script, Persist2.bat, was invoked to execute the SPC-1 Persistence Test Run 2 (read phase) after completionof the required TSC power off/power on cycle. Each of the two scripts included the appropriate command to capture a storage capacity listing as part of the audit. RunBench.bat rem mode con: cols=160 lines=60 cd c:\benchmarkrun powershell.exe c:\benchmarkrun\getinfo.ps1 -NoLogo > psoutputstart.txt rem rem PreFill ASU space with vdbench rem call C:\spc\vdbench\vdbench.bat -f ASU-PreFill-script.cfg -o prefill.out rem java -version rem rem Change to benchmark results folder rem cd C:\BenchmarkRun rem rem Metrics sustainability - rem java metrics -b s 360 -t rem rem Repeatability Runs rem java repeat1 -b s 360 Rem java repeat2 -b s 360 rem rem Persist runs rem java persist1 -b 9200 rem rem Run persist2 after power cycle rem Persist2.bat mode con: cols=160 lines=70 cd c:\benchmarkrun rem Run second Persist command to validate contents of storage rem Run persist2 after power cycle java -Xmx2048m persist2 powershell.exe c:\benchmarkrun\getinfo.ps1 -NoLogo > psoutputend.txt

86 APPENDIX F: Page 86 of 88 THIRD-PARTY QUOTATION APPENDIX F: THIRD-PARTY QUOTATION Priced Storage Configuration
SPC BENCHMARK 1 FULL DISCLOSURE REPORT IBM CORPORATION IBM STORWIZE V3700 (TURBO) SPC-1 V1.14
 SPC-1 V1.14") SPC BENCHMARK 1 FULL DISCLOSURE REPORT IBM CORPORATION IBM STORWIZE V3700 (TURBO) SPC-1 V1.14 Submitted for Review: April 18, 2014 Submission Identifier: A00143 ii First Edition April 2014 THE INFORMATION
SPC BENCHMARK 1 FULL DISCLOSURE REPORT IBM CORPORATION IBM STORWIZE V3700 (TURBO) SPC-1 V1.14 Submitted for Review: April 18, 2014 Submission Identifier: A00143 ii First Edition April 2014 THE INFORMATION
SPC BENCHMARK 1C FULL DISCLOSURE REPORT ORACLE CORPORATION SUN STORAGE F5100 FLASH ARRAY SPC-1C V1.3
 SPC BENCHMARK 1C FULL DISCLOSURE REPORT ORACLE CORPORATION SUN STORAGE F5100 FLASH ARRAY SPC-1C V1.3 Submitted for Review: April 13, 2010 Submission Identifier: C00010 ii First Edition April 2010 THE INFORMATION
SPC BENCHMARK 2 FULL DISCLOSURE REPORT VEXATA INC. VX100-F SCALABLE NVME FLASH ARRAY SPC-2 V1.7.0 SUBMITTED FOR REVIEW: AUGUST 29, 2018
 SPC BENCHMARK 2 FULL DISCLOSURE REPORT VEXATA INC. VX100-F SCALABLE NVME FLASH ARRAY SPC-2 V1.7.0 SUBMITTED FOR REVIEW: AUGUST 29, 2018 SUBMISSION IDENTIFIER: B12004 PREAMBLE ii First Edition August 2018
SPC BENCHMARK 2 FULL DISCLOSURE REPORT HITACHI DATA SYSTEMS CORPORATION HITACHI UNIFIED STORAGE VM SPC-2 V1.5
 SPC BENCHMARK 2 FULL DISCLOSURE REPORT HITACHI DATA SYSTEMS CORPORATION HITACHI UNIFIED STORAGE VM SPC-2 V1.5 Submitted for Review: January 21, 2014 First Edition January 2014 THE INFORMATION CONTAINED
SPC BENCHMARK 2 FULL DISCLOSURE REPORT SILICON GRAPHICS INTERNATIONAL CORP. SGI INFINITESTORAGE 5600 SPC-2 V1.4
 SPC BENCHMARK 2 FULL DISCLOSURE REPORT SILICON GRAPHICS INTERNATIONAL CORP. SGI INFINITESTORAGE 5600 SPC-2 V1.4 Submitted for Review: March 6, 2013 First Edition March 2013 THE INFORMATION CONTAINED IN
SPC BENCHMARK 1 EXECUTIVE SUMMARY
 SPC BENCHMARK 1 EXECUTIVE SUMMARY NETAPP, INC. NETAPP EF560 STORAGE SYSTEM SPC-1 V1.14 Submitted for Review: January 27, 2015 Submission Identifier: A00152 EXECUTIVE SUMMARY Page 2 of 9 EXECUTIVE SUMMARY
SPC BENCHMARK 1 EXECUTIVE SUMMARY IBM CORPORATION IBM SYSTEM STORAGE DS3524 EXPRESS SPC-1 V1.12
 SPC BENCHMARK 1 EXECUTIVE SUMMARY IBM CORPORATION IBM SYSTEM STORAGE DS3524 EXPRESS SPC-1 V1.12 Submitted for Review: December 31, 2010 Submission Identifier: A00101 EXECUTIVE SUMMARY Page 2 of 7 EXECUTIVE
SPC BENCHMARK 1 EXECUTIVE SUMMARY FUJITSU LIMITED FUJITSU STORAGE SYSTEMS ETERNUS DX200 S3 SPC-1 V1.14
 SPC BENCHMARK 1 EXECUTIVE SUMMARY FUJITSU LIMITED FUJITSU STORAGE SYSTEMS ETERNUS DX200 S3 SPC-1 V1.14 Submitted for Review: December 30, 2013 Submission Identifier: A00139 EXECUTIVE SUMMARY Page 2 of
SPC BENCHMARK 1 EXECUTIVE SUMMARY IBM CORPORATION IBM POWER 780 SERVER (WITH SSDS) SPC-1 V1.13
 SPC-1 V1.13") SPC BENCHMARK 1 EXECUTIVE SUMMARY IBM CORPORATION IBM POWER 780 SERVER (WITH SSDS) SPC-1 V1.13 Submitted for Review: April 11, 2013 Submission Identifier: A00130 EXECUTIVE SUMMARY Page 2 of 9 EXECUTIVE
SPC BENCHMARK 1 EXECUTIVE SUMMARY IBM CORPORATION IBM POWER 780 SERVER (WITH SSDS) SPC-1 V1.13 Submitted for Review: April 11, 2013 Submission Identifier: A00130 EXECUTIVE SUMMARY Page 2 of 9 EXECUTIVE
SPC BENCHMARK 1 EXECUTIVE SUMMARY IBM CORPORATION IBM STORWIZE V7000 (SSDS) SPC-1 V1.12
 SPC-1 V1.12") SPC BENCHMARK 1 EXECUTIVE SUMMARY IBM CORPORATION IBM STORWIZE V7000 (SSDS) SPC-1 V1.12 Submitted for Review: June 4, 2012 Submission Identifier: A00116 EXECUTIVE SUMMARY Page 2 of 8 EXECUTIVE SUMMARY
SPC BENCHMARK 1 EXECUTIVE SUMMARY IBM CORPORATION IBM STORWIZE V7000 (SSDS) SPC-1 V1.12 Submitted for Review: June 4, 2012 Submission Identifier: A00116 EXECUTIVE SUMMARY Page 2 of 8 EXECUTIVE SUMMARY
SPC BENCHMARK 1 EXECUTIVE SUMMARY IBM CORPORATION IBM SYSTEM STORAGE DS8700 RELEASE 5.1 (EASYTIER AND SSDS) SPC-1 V1.12
 SPC-1 V1.12") SPC BENCHMARK EXECUTIVE SUMMARY IBM CORPORATION IBM SYSTEM STORAGE DS87 RELEASE. (EASYTIER AND SSDS) SPC- V. Submitted for Review: April, Submission Identifier: A9 EXECUTIVE SUMMARY Page of 8 EXECUTIVE
SPC BENCHMARK EXECUTIVE SUMMARY IBM CORPORATION IBM SYSTEM STORAGE DS87 RELEASE. (EASYTIER AND SSDS) SPC- V. Submitted for Review: April, Submission Identifier: A9 EXECUTIVE SUMMARY Page of 8 EXECUTIVE
SPC BENCHMARK 1 EXECUTIVE SUMMARY HUAWEI TECHNOLOGIES CO., LTD. HUAWEI OCEANSTOR 5500 V3 SPC-1 V1.14
 SPC BENCHMARK 1 EXECUTIVE SUMMARY HUAWEI TECHNOLOGIES CO., LTD. HUAWEI OCEANSTOR 5500 V3 SPC-1 V1.14 Submitted for Review: April 26, 2016 Submission Identifier: A00174 EXECUTIVE SUMMARY Page 2 of 12 EXECUTIVE
SPC BENCHMARK 2 EXECUTIVE SUMMARY EMC CORPORATION EMC VMAX 400K SPC-2 V1.5. Submitted for Review: July 30, 2015 Submission Identifier: B00073
 SPC BENCHMARK 2 EXECUTIVE SUMMARY EMC CORPORATION SPC-2 V1.5 Submitted for Review: July 30, 2015 EXECUTIVE SUMMARY Page 2 of 11 EXECUTIVE SUMMARY Test Sponsor and Contact Information Test Sponsor Primary
SPC BENCHMARK 2 EXECUTIVE SUMMARY FUJITSU LIMITED FUJITSU STORAGE SYSTEMS ETERNUS DX8700 S2 SPC-2 V1.4
 SPC BENCHMARK 2 EXECUTIVE SUMMARY FUJITSU LIMITED FUJITSU STORAGE SYSTEMS ETERNUS DX8700 S2 SPC-2 V1.4 Submitted for Review: December 3, 2012 EXECUTIVE SUMMARY Page 2 of 9 EXECUTIVE SUMMARY Test Sponsor
SPC BENCHMARK 1 FULL DISCLOSURE REPORT LENOVO THINKSYSTEM DE6000H SPC-1 V3.8 SUBMISSION IDENTIFIER: A32008
 SPC BENCHMARK 1 FULL DISCLOSURE REPORT LENOVO THINKSYSTEM DE6000H SPC-1 V3.8 SUBMISSION IDENTIFIER: A32008 SUBMITTED FOR REVIEW: NOVEMBER 9, 2018 PREAMBLE Page 2 of 49 First Edition November 2018 THE INFORMATION
SPC BENCHMARK 1 EXECUTIVE SUMMARY PILLAR DATA SYSTEMS,INC. PILLAR AXIOM 600 SPC-1 V1.10.1
 SPC BENCHMARK 1 EXECUTIVE SUMMARY PILLAR DATA SYSTEMS,INC. PILLAR AXIOM 600 SPC-1 V1.10.1 Submitted for Review: January 13, 2009 Submission Identifier: A00073 EXECUTIVE SUMMARY Page 2 of 6 EXECUTIVE SUMMARY
SPC BENCHMARK 2/ENERGY EXECUTIVE SUMMARY IBM CORPORATION IBM XIV STORAGE SYSTEM GEN3 SPC-2/E V1.4
 SPC BENCHMARK 2/ENERGY EXECUTIVE SUMMARY IBM CORPORATION IBM XIV STORAGE SYSTEM GEN3 SPC-2/E V1.4 Submitted for Review: October 19, 2011 EXECUTIVE SUMMARY Page 2 of 9 EXECUTIVE SUMMARY Test Sponsor and
SPC BENCHMARK 1 FULL DISCLOSURE REPORT FUJITSU LIMITED ETERNUS AF650 S2 SPC-1 V3.5.0 SUBMISSION IDENTIFIER: A32004
 SPC BENCHMARK 1 FULL DISCLOSURE REPORT FUJITSU LIMITED ETERNUS AF650 S2 SPC-1 V3.5.0 SUBMISSION IDENTIFIER: A32004 SUBMITTED FOR REVIEW: JANUARY 19, 2018 PREAMBLE Page 2 of 35 First Edition January 2018
LENOVO THINKSYSTEM DE6000H
 EXECUTIVE SUMMARY SPC BENCHMARK 1 EXECUTIVE SUMMARY LENOVO THINKSYSTEM DE6000H SPC-1 IOPS 460,011 SPC-1 Price-Performance $91.76/SPC-1 KIOPS SPC-1 IOPS Response Time SPC-1 Overall Response Time SPC-1 ASU
TELECOMMUNICATIONS TECHNOLOGY ASSOCIATION JET-SPEED HHS3124F / HHS2112F (10 NODES)
") EXECUTIVE SUMMARY SPC BENCHMARK 1 EXECUTIVE SUMMARY TELECOMMUNICATIONS TECHNOLOGY ASSOCIATION JET-SPEED HHS3124F / HHS2112F (10 NODES) SPC-1 IOPS 2,410,271 SPC-1 Price-Performance $287.01/SPC-1 KIOPS SPC-1
EXECUTIVE SUMMARY SPC BENCHMARK 1 EXECUTIVE SUMMARY TELECOMMUNICATIONS TECHNOLOGY ASSOCIATION JET-SPEED HHS3124F / HHS2112F (10 NODES) SPC-1 IOPS 2,410,271 SPC-1 Price-Performance $287.01/SPC-1 KIOPS SPC-1
SPC BENCHMARK 1 FULL DISCLOSURE REPORT LENOVO THINKSYSTEM DS4200 SPC-1 V3.4.0 SUBMISSION IDENTIFIER: A32002
 SPC BENCHMARK 1 FULL DISCLOSURE REPORT LENOVO THINKSYSTEM DS4200 SPC-1 V3.4.0 SUBMISSION IDENTIFIER: A32002 SUBMITTED FOR REVIEW: JULY 19, 2017 PRE AMBLE Page 2 of 40 First Edition July 2017 THE INFORMATION
Hewlett-Packard Enterprise Company
 Hewlett-Packard Enterprise Company TPC Benchmark H Full Disclosure Report for Hewlett Packard Enterprise ProLiant DL580 Gen9 using and Red Hat Enterprise Linux Server 7.2 Edition First Edition i Hewlett-Packard
Part Number Unit Descriptions
 Part Number Unit Descriptions 2582B2A System x3100m4 Simple Swap (SATA) Xeon 4C E3-1220v2 69W 3.1GHz/1600MHz/8MB Form factor Tower (can be a 4U rack form factor using the optional Tower-to-Rack Conversion
HUAWEI TECHNOLOGIES CO., LTD. HUAWEI FUSIONSTORAGE
 EXECUTIVE SUMMARY SPC BENCHMARK 1 EXECUTIVE SUMMARY HUAWEI TECHNOLOGIES CO., LTD. HUAWEI FUSIONSTORAGE SPC-1 IOPS 4,500,392 SPC-1 Price-Performance $329.90/SPC-1 KIOPS SPC-1 IOPS Response Time 0.787 ms
FUJITSU LIMITED ETERNUS AF250 S2
 EXECUTIVE SUMMARY SPC BENCHMARK 1 EXECUTIVE SUMMARY FUJITSU LIMITED ETERNUS AF250 S2 SPC-1 IOPS 360,070 SPC-1 Price-Performance $94.02/SPC-1 KIOPS SPC-1 IOPS Response Time SPC-1 Overall Response Time SPC-1
IBM Express Portfolio is updated to include new IBM System x3650 M5 models
 Announcement ZG14-0241, dated September 9, 2014 IBM Express Portfolio is updated to include new IBM System x3650 M5 models Table of contents 1 Overview 9 Technical information 1 Key prerequisites 9 Terms
Lenovo Database Configuration Guide
 Lenovo Database Configuration Guide for Microsoft SQL Server OLTP on ThinkAgile SXM Reduce time to value with validated hardware configurations up to 2 million TPM in a DS14v2 VM SQL Server in an Infrastructure
QuickSpecs. What's New HP 120GB 1.5Gb/s SATA 5400 rpm SFF HDD. HP Serial-ATA (SATA) Hard Drive Option Kits. Overview
 Hard Drive Option Kits. Overview") Overview HP offers a variety of tested, HP-qualified, SMART* capable, SATA Hard Drives offering data integrity and availability in hotpluggable models. HP 3.5" and Small Form Factor (2.5") SATA drives
Overview HP offers a variety of tested, HP-qualified, SMART* capable, SATA Hard Drives offering data integrity and availability in hotpluggable models. HP 3.5" and Small Form Factor (2.5") SATA drives
Microsoft Exchange Server 2010 workload optimization on the new IBM PureFlex System
 Microsoft Exchange Server 2010 workload optimization on the new IBM PureFlex System Best practices Roland Mueller IBM Systems and Technology Group ISV Enablement April 2012 Copyright IBM Corporation, 2012
IBM Express Portfolio is updated to include new System x3550 M4 models
 Announcement ZG12-0075, dated March 6, 2012 IBM Express Portfolio is updated to include new System x3550 M4 models Table of contents 1 Overview 6 Technical information 1 Key prerequisites 7 Terms and conditions
Evaluation Report: Improving SQL Server Database Performance with Dot Hill AssuredSAN 4824 Flash Upgrades
 Evaluation Report: Improving SQL Server Database Performance with Dot Hill AssuredSAN 4824 Flash Upgrades Evaluation report prepared under contract with Dot Hill August 2015 Executive Summary Solid state
SPC BENCHMARK 1 FULL DISCLOSURE REPORT NETAPP AFF A800 SPC-1 V3.6.0 SUBMISSION IDENTIFIER: A32007
 SPC BENCHMARK 1 FULL DISCLOSURE REPORT NETAPP, INC. NETAPP AFF A800 SPC-1 V3.6.0 SUBMISSION IDENTIFIER: A32007 SUBMITTED FOR REVIEW: JULY 5, 2018 PREAMBLE Page 2 of 39 First Edition July 2018 THE INFORMATION
IBM System Storage DS8870 Release R7.3 Performance Update
 IBM System Storage DS8870 Release R7.3 Performance Update Enterprise Storage Performance Yan Xu Agenda Summary of DS8870 Hardware Changes I/O Performance of High Performance Flash Enclosure (HPFE) Easy
New IBM System x3500 M3 and x3650 M3 server models added to IBM Express Portfolio
 IBM Latin America Hardware Announcement LG11-0088, dated April 5, 2011 New IBM System x3500 M3 and x3650 M3 server models added to IBM Express Portfolio Table of contents 1 Overview 4 Publications 2 Key
IBM Express Portfolio is updated to include new IBM System x3650 M4 models
 Announcement ZG12-0078, dated March 6, 2012 IBM Express Portfolio is updated to include new IBM System x3650 M4 models Table of contents 1 Overview 5 Product number 1 Key prerequisites 6 Technical information
How Smarter Systems Deliver Smarter Economics and Optimized Business Continuity
 9-November-2010 Singapore How Smarter Systems Deliver Smarter Economics and Optimized Business Continuity Shiva Anand Neiker Storage Sales Leader STG ASEAN How Smarter Systems Deliver Smarter Economics
HP SAS benchmark performance tests
 HP SAS benchmark performance tests technology brief Abstract... 2 Introduction... 2 Test hardware... 2 HP ProLiant DL585 server... 2 HP ProLiant DL380 G4 and G4 SAS servers... 3 HP Smart Array P600 SAS
IBM 2-watt 15.8 GB 2.5-inch Solid State Drives provide new technology in performance for storage in BladeCenter
 IBM United States Announcement 107-417, dated July 17, 2007 IBM 2-watt 15.8 GB 2.5-inch Solid State Drives provide new technology in performance for storage in BladeCenter Key prerequisites...2 Description...2
ServeRAID M5015 and M5014 SAS/SATA Controllers Product Guide
 ServeRAID M5015 and M5014 SAS/SATA Controllers Product Guide The ServeRAID M5015 and ServeRAID M5014 SAS/SATA Controllers for System x are the next-generation 6 Gbps SAS 2.0 RAID controllers. The adapters
Suggested use: infrastructure applications, collaboration/ , web, and virtualized desktops in a workgroup or distributed environments.
 The IBM System x3500 M4 server provides outstanding performance for your business-critical applications. Its energy-efficient design supports more cores, memory, and data capacity in a scalable Tower or
[Procurement Officer] Within 10 days of signing of PO. [30] days after receipt of invoice. Binding period of the quote [7] days *
![[Procurement Officer] Within 10 days of signing of PO. [30] days after receipt of invoice. Binding period of the quote [7] days *](/thumbs/88/116119394.jpg "[Procurement Officer] Within 10 days of signing of PO. [30] days after receipt of invoice. Binding period of the quote [7] days *") REQUEST FOR QUOTATION SERVERS SUPPLIER NAME: RFQ specific information RFQ Ref Number MiDS Con-611/014 Date of issue [011/1/014] Deadline for receiving Quotes Contact Person For technical questions (Point
REQUEST FOR QUOTATION SERVERS SUPPLIER NAME: RFQ specific information RFQ Ref Number MiDS Con-611/014 Date of issue [011/1/014] Deadline for receiving Quotes Contact Person For technical questions (Point
EMC VMAX 400K SPC-2 Proven Performance. Silverton Consulting, Inc. StorInt Briefing
 EMC VMAX 400K SPC-2 Proven Performance Silverton Consulting, Inc. StorInt Briefing EMC VMAX 400K SPC-2 PROVEN PERFORMANCE PAGE 2 OF 10 Introduction In this paper, we analyze all- flash EMC VMAX 400K storage
Sun Fire X4170 M2 Server Frequently Asked Questions
 Overview Faced with ever increasing computing needs and budget constraints, companies today want to set up infrastructures that offer optimal value, can easily be re-purposed, and have reduced complexity.
IOmark- VM. HP MSA P2000 Test Report: VM a Test Report Date: 4, March
 IOmark- VM HP MSA P2000 Test Report: VM- 140304-2a Test Report Date: 4, March 2014 Copyright 2010-2014 Evaluator Group, Inc. All rights reserved. IOmark- VM, IOmark- VDI, VDI- IOmark, and IOmark are trademarks
Oracle Flash Storage System QoS Plus Operation and Best Practices ORACLE WHITE PAPER OCTOBER 2016
 Oracle Flash Storage System QoS Plus Operation and Best Practices ORACLE WHITE PAPER OCTOBER 2016 Table of Contents Introduction 1 When to Use Auto-Tiering 1 Access Skews 1 Consistent Access 2 Recommendations
SAP SD Benchmark with DB2 and Red Hat Enterprise Linux 5 on IBM System x3850 M2
 SAP SD Benchmark using DB2 and Red Hat Enterprise Linux 5 on IBM System x3850 M2 Version 1.0 November 2008 SAP SD Benchmark with DB2 and Red Hat Enterprise Linux 5 on IBM System x3850 M2 1801 Varsity Drive
HP ProLiant m300 1P C2750 CPU 32GB Configure-to-order Server Cartridge B21
 Overview HP Moonshot System with the HP ProLiant m300 server cartridge was created for cost-effective Dynamic Content Delivery, frontend Web and online analytics. The ProLiant m300 server cartridge has
FUSIONSTACK CO., LTD FUSIONSTOR SF6000
 EXECUTIVE SUMMARY SPC BENCHMARK 1 EXECUTIVE SUMMARY FUSIONSTACK CO., LTD FUSIONSTOR SF6000 SPC-1 IOPS 801,083 SPC-1 Price-Performance $ 121.73/SPC-1 KIOPS SPC-1 IOPS Response Time 0.296 ms SPC-1 Overall
Infor M3 on IBM POWER7+ and using Solid State Drives
 Infor M3 on IBM POWER7+ and using Solid State Drives IBM Systems & Technology Group Robert Driesch cooter@us.ibm.com This document can be found on the web, Version Date: January 31, 2014 Table of Contents
Lenovo System x3650 M5 with HGST Ultrastar SAS SSDs 9TB Data Warehouse Fast Track Reference Architecture on SQL Server 2016 SP1 Standard Edition
 WHITE PAPER Lenovo System x3650 M5 with HGST Ultrastar SAS SSDs 9TB Data Warehouse Fast Track Reference Architecture on SQL Server Based on the SQL Server 2016 Data Warehouse Fast Track Reference Architecture
NotesBench Disclosure Report for IBM Netfinity 3500 (RAID-5) with Lotus Domino Server 4.6a for Windows NT 4.0
 with Lotus Domino Server 4.6a for Windows NT 4.0") UNITED STATES NotesBench Disclosure Report for IBM Netfinity 3500 (RAID-5) with Lotus Domino Server 4.6a for Windows NT 4.0 Audited May 8, 1998 IBM Corporation UNITED STATES Table of Contents Executive
UNITED STATES NotesBench Disclosure Report for IBM Netfinity 3500 (RAID-5) with Lotus Domino Server 4.6a for Windows NT 4.0 Audited May 8, 1998 IBM Corporation UNITED STATES Table of Contents Executive
Hardware withdrawal: Lenovo System x select options/features
 Announcement ZG15-0292, dated December 15, 2015 Hardware withdrawal: Lenovo System x select options/features Table of contents 1 Overview 4 Replacement product information 1 Withdrawn products 5 Announcement
HUAWEI TECHNOLOGIES CO., LTD HUAWEI OCEANSTOR 6800 V3
 EXECUTIVE SUMMARY SPC BENCHMARK 1 EXECUTIVE SUMMARY HUAWEI TECHNOLOGIES CO., LTD HUAWEI OCEANSTOR 6800 V3 SPC-1 IOPS 800,022 SPC-1 Price-Performance $330.92/SPC-1 KIOPS SPC-1 IOPS Response Time 0.713 ms
Oracle Database 12c: JMS Sharded Queues
 Oracle Database 12c: JMS Sharded Queues For high performance, scalable Advanced Queuing ORACLE WHITE PAPER MARCH 2015 Table of Contents Introduction 2 Architecture 3 PERFORMANCE OF AQ-JMS QUEUES 4 PERFORMANCE
ThinkServer RD450 Platform Specifications
 ThinkServer RD450 Platform Specifications Components Dimensions Weight Processor RAID controller Specification 2U rack. Height: 87 mm (3.4 in), width: 482 mm (19 in), depth: 764 mm (30 in) Minimum configuration:
NEC Express5800 A2040b 22TB Data Warehouse Fast Track. Reference Architecture with SW mirrored HGST FlashMAX III
 NEC Express5800 A2040b 22TB Data Warehouse Fast Track Reference Architecture with SW mirrored HGST FlashMAX III Based on Microsoft SQL Server 2014 Data Warehouse Fast Track (DWFT) Reference Architecture
HARDWARE & ENVIRONMENTAL SPECIFICATIONS TECHNICAL BRIEF
 September 2011 HARDWARE & ENVIRONMENTAL SPECIFICATIONS TECHNICAL BRIEF 2011 M86 Security All rights reserved. 8845 Irvine Center Drive, Irvine, CA 92618 USA Version 1.0, published September 2011 for software
Oracle Fusion Middleware
 Oracle Fusion Middleware Installation Planning Guide 11g Release 1 (11.1.1.7.0) B32474-16 June 2013 Oracle Fusion Middleware Installation Planning Guide, 11g Release 1 (11.1.1.7.0) B32474-16 Copyright
Benefits of Automatic Data Tiering in OLTP Database Environments with Dell EqualLogic Hybrid Arrays
 TECHNICAL REPORT: Performance Study Benefits of Automatic Data Tiering in OLTP Database Environments with Dell EqualLogic Hybrid Arrays ABSTRACT The Dell EqualLogic hybrid arrays PS6010XVS and PS6000XVS
Lenovo SAN Manager. Rapid Tier and Read Cache. David Vestal, WW Product Marketing. June Lenovo.com/systems
 Lenovo SAN Manager Rapid Tier and Read Cache June 2017 David Vestal, WW Product Marketing Lenovo.com/systems Table of Contents Introduction... 3 Automated Sub-LUN Tiering... 4 LUN-level tiering is inflexible
MACROSAN TECHNOLOGIES CO., LTD MACROSAN MS3000G2
 EXECUTIVE SUMMARY SPC BENCHMARK 1 EXECUTIVE SUMMARY MACROSAN TECHNOLOGIES CO., LTD MACROSAN MS3000G2 SPC-1 IOPS 430,020 SPC-1 Price-Performance $324.38/SPC-1 KIOPS SPC-1 IOPS Response Time 0.444 ms SPC-1
Flexible General-Purpose Server Board in a Standard Form Factor
 Product brief Small and Medium Business, Storage, Networking, Web Hosting, and Security Appliances Intel Server Board S2600ST Product Family Featuring the Intel Xeon Processor Scalable Family Flexible
ServeRAID-BR10il SAS/SATA Controller v2 for IBM System x IBM System x at-a-glance guide
 ServeRAID-BR10il SAS/SATA Controller v2 for IBM System x IBM System x at-a-glance guide The ServeRAID-BR10il SAS/SATA Controller v2 is an ideal solution for servers that need high-speed data transfer in
LATEST INTEL TECHNOLOGIES POWER NEW PERFORMANCE LEVELS ON VMWARE VSAN
 LATEST INTEL TECHNOLOGIES POWER NEW PERFORMANCE LEVELS ON VMWARE VSAN Russ Fellows Enabling you to make the best technology decisions November 2017 EXECUTIVE OVERVIEW* The new Intel Xeon Scalable platform
INVITATION TO BID NORTH HAVEN PUBLIC SCHOOLS
 FINANCE INVITATION TO BID NORTH HAVEN PUBLIC SCHOOLS Sealed bids for purchase, installation and labor for Storage Area Network and VMware Host Upgrade for the North Haven Public Schools will be received
HUAWEI TECHNOLOGIES CO., LTD HUAWEI OCEANSTOR 5500 V5
 EXECUTIVE SUMMARY SPC BENCHMARK 1 EXECUTIVE SUMMARY HUAWEI TECHNOLOGIES CO., LTD HUAWEI OCEANSTOR 5500 V5 SPC-1 IOPS 600,275 SPC-1 Price-Performance $448.60/SPC-1 KIOPS SPC-1 IOPS Response Time 0.523 ms
HP ProLiant DL380 Gen8 and HP PCle LE Workload Accelerator 28TB/45TB Data Warehouse Fast Track Reference Architecture
 HP ProLiant DL380 Gen8 and HP PCle LE Workload Accelerator 28TB/45TB Data Warehouse Fast Track Reference Architecture Based on Microsoft SQL Server 2014 Data Warehouse Fast Track (DWFT) Reference Architecture
Oracle Event Processing Extreme Performance on Sparc T5
 Oracle Event Processing Extreme Performance on Sparc T5 An Oracle Event Processing (OEP) Whitepaper ORACLE WHITE PAPER AUGUST 2014 Table of Contents Introduction 2 OEP Architecture 2 Server Architecture
HUAWEI TECHNOLOGIES CO., LTD HUAWEI OCEANSTOR 5600 V5
 EXECUTIVE SUMMARY Page 1 of 6 EXECUTIVE SUMMARY SPC BENCHMARK 1 EXECUTIVE SUMMARY HUAWEI TECHNOLOGIES CO., LTD HUAWEI OCEANSTOR 5600 V5 SPC-1 IOPS 1,100,252 SPC-1 Price-Performance $405.39/SPC-1 KIOPS
Frequently Asked Questions. s620 SATA SSD Enterprise-Class Solid-State Device
 Frequently Asked Questions s620 SATA SSD Enterprise-Class Solid-State Device Frequently Asked Questions Q: What about advanced data protection? A: In mission-critical enterprise and datacenter applications,
An Oracle Technical White Paper October Sizing Guide for Single Click Configurations of Oracle s MySQL on Sun Fire x86 Servers
 An Oracle Technical White Paper October 2011 Sizing Guide for Single Click Configurations of Oracle s MySQL on Sun Fire x86 Servers Introduction... 1 Foundation for an Enterprise Infrastructure... 2 Sun
QuickSpecs. HPE Cloudline CL7100 Server. Overview
 Overview The is Open Compute Compliant and is designed for service providers that need very high density compute platforms for Open Rack deployment. The CL7100 is based upon the OCPv1 (Open Compute Project)
2 to 4 Intel Xeon Processor E v3 Family CPUs. Up to 12 SFF Disk Drives for Appliance Model. Up to 6 TB of Main Memory (with GB LRDIMMs)
") Based on Cisco UCS C460 M4 Rack Servers Solution Brief May 2015 With Intelligent Intel Xeon Processors Highlights Integrate with Your Existing Data Center Our SAP HANA appliances help you get up and running
Based on Cisco UCS C460 M4 Rack Servers Solution Brief May 2015 With Intelligent Intel Xeon Processors Highlights Integrate with Your Existing Data Center Our SAP HANA appliances help you get up and running
NexentaVSA for View. Hardware Configuration Reference nv4v-v A
 NexentaVSA for View Hardware Configuration Reference 1.0 5000-nv4v-v0.0-000003-A Copyright 2012 Nexenta Systems, ALL RIGHTS RESERVED Notice: No part of this publication may be reproduced or transmitted
QuickSpecs. What's New 300GB 6G SAS 15K rpm SFF (2.5in) Enterprise Hard Drive. HP SAS Enterprise and SAS Midline Hard Drives.
 Enterprise Hard Drive. HP SAS Enterprise and SAS Midline Hard Drives.") Overview Serial Attached SCSI (SAS) provides a superior storage solution. With some storage requirements escalating and others becoming more complex, factors such as flexibility, performance, increased
Overview Serial Attached SCSI (SAS) provides a superior storage solution. With some storage requirements escalating and others becoming more complex, factors such as flexibility, performance, increased
IBM Tivoli Storage Manager. Blueprint and Server Automated Configuration for Linux x86 Version 2 Release 3 IBM
 IBM Tivoli Storage Manager Blueprint and Server Automated Configuration for Linux x86 Version 2 Release 3 IBM Note: Before you use this information and the product it supports, read the information in
Hyperscaler Storage. September 12, 2016
 Storage Networking Industry Association Technical White Paper Hyperscaler Storage Abstract: Hyperscaler storage customers typically build their own storage systems from commodity components. They have
ASI System Integration, Inc.
 ASI System Integration, Inc. Server Solutions for the NYC DOE 2016-2021 our team ASI has a dedicated NYCDOE team for account management, services, and escalations. Account Team Title Phone Email Michael
TPC Benchmark TM C Full Disclosure Report
 TPC Benchmark TM C Full Disclosure Report for IBM System x3850 M2 using Microsoft SQL Server 2005 Enterprise x64 Edition (SP2) and Microsoft Windows Server 2003 R2 Enterprise x64 Edition (SP2) TPC-C Version
All-Flash Storage Solution for SAP HANA:
 All-Flash Storage Solution for SAP HANA: Storage Considerations using SanDisk Solid State Devices WHITE PAPER Western Digital Technologies, Inc. 951 SanDisk Drive, Milpitas, CA 95035 www.sandisk.com Table
HPE ProLiant DL360 Gen P 16GB-R P408i-a 8SFF 500W PS Performance Server (P06453-B21)
") Digital data sheet HPE ProLiant DL360 Gen10 4110 1P 16GB-R P408i-a 8SFF 500W PS Performance Server (P06453-B21) ProLiant DL Servers What's new Innovative design with greater flexibility to mix and match
Digital data sheet HPE ProLiant DL360 Gen10 4110 1P 16GB-R P408i-a 8SFF 500W PS Performance Server (P06453-B21) ProLiant DL Servers What's new Innovative design with greater flexibility to mix and match
ServeRAID M5015 and M5014 SAS/SATA Controllers for IBM System x IBM Redbooks Product Guide
 ServeRAID M5015 and M5014 SAS/SATA Controllers for IBM System x IBM Redbooks Product Guide The ServeRAID M5015 and ServeRAID M5014 SAS/SATA Controllers for IBM System x are the next-generation 6 Gbps SAS
Extreme Storage Performance with exflash DIMM and AMPS
 Extreme Storage Performance with exflash DIMM and AMPS 214 by 6East Technologies, Inc. and Lenovo Corporation All trademarks or registered trademarks mentioned here are the property of their respective
Create a Flexible, Scalable High-Performance Storage Cluster with WekaIO Matrix
 Solution brief Intel Storage Builders WekaIO Matrix Intel eon Processor E5-2600 Product Family Intel Ethernet Converged Network Adapter 520 Intel SSD Data Center Family Data Plane Development Kit Create
SSD Architecture Considerations for a Spectrum of Enterprise Applications. Alan Fitzgerald, VP and CTO SMART Modular Technologies
 SSD Architecture Considerations for a Spectrum of Enterprise Applications Alan Fitzgerald, VP and CTO SMART Modular Technologies Introduction Today s SSD delivers form-fit-function compatible solid-state
Transform your data center cost-effectively with the ultra-dense, efficient, and high-performance HP ProLiant DL320 G6 enterpriseclass
 HP ProLiant DL320 G6 Server Data sheet Transform your data center cost-effectively with the ultra-dense, efficient, and high-performance HP ProLiant DL320 G6 enterpriseclass rack server Would you consider
All-new HP ProLiant ML350p Gen8 Server series
 Data sheet All-new HP ProLiant ML350p Gen8 Server series Performance server with increased expandability and availability The HP ProLiant ML350p Gen8 Server series comes with a winning combination of increased
QuickSpecs. Models SATA RAID Controller HP 6-Port SATA RAID Controller B21. HP 6-Port SATA RAID Controller. Overview.
 Overview HP 6 Port SATA RAID controller provides customers with new levels of fault tolerance for low cost storage solutions using SATA hard drive technologies. Models SATA RAID Controller 372953-B21 DA
TPC Benchmark H Full Disclosure Report. SPARC T4-4 Server Using Oracle Database 11g Release 2 Enterprise Edition with Partitioning
 TPC Benchmark H Full Disclosure Report SPARC T4-4 Server Using Oracle Database 11g Release 2 Enterprise Edition with Partitioning Submitted for Review September 26, 2011 First Printing September 26, 2011
ServeRAID M1015 SAS/SATA Controller for System x IBM System x at-a-glance guide
 ServeRAID M1015 SAS/SATA Controller for System x IBM System x at-a-glance guide The ServeRAID M1015 SAS/SATA Controller for IBM System x is an entry-level 6 Gbps SAS 2.0 PCI Express 2.0 RAID controller.
Milestone Solution Partner IT Infrastructure Components Certification Report
 Milestone Solution Partner IT Infrastructure Components Certification Report Dell Storage PS6610, Dell EqualLogic PS6210, Dell EqualLogic FS7610 July 2015 Revisions Date July 2015 Description Initial release
PowerVault MD3 SSD Cache Overview
 PowerVault MD3 SSD Cache Overview A Dell Technical White Paper Dell Storage Engineering October 2015 A Dell Technical White Paper TECHNICAL INACCURACIES. THE CONTENT IS PROVIDED AS IS, WITHOUT EXPRESS
Entry-level Intel RAID RS3 Controller Family
 PRODUCT Brief Entry-Level Intel RAID RS3 Controller Portfolio Entry-level Intel RAID RS3 Controller Family 12Gb/s connectivity and basic data protection RAID matters. Rely on Intel RAID. Cost-effective
INTEL NEXT GENERATION TECHNOLOGY - POWERING NEW PERFORMANCE LEVELS
 INTEL NEXT GENERATION TECHNOLOGY - POWERING NEW PERFORMANCE LEVELS Russ Fellows Enabling you to make the best technology decisions July 2017 EXECUTIVE OVERVIEW* The new Intel Xeon Scalable platform is
An Oracle White Paper September Oracle Utilities Meter Data Management Demonstrates Extreme Performance on Oracle Exadata/Exalogic
 An Oracle White Paper September 2011 Oracle Utilities Meter Data Management 2.0.1 Demonstrates Extreme Performance on Oracle Exadata/Exalogic Introduction New utilities technologies are bringing with them
NEC Express5800/R120h-2M System Configuration Guide
 NEC Express5800/R120h-2M System Configuration Guide Introduction This document contains product and configuration information that will enable you to configure your system. The guide will ensure fast and
ServeRAID M5025 SAS/SATA Controller for IBM System x IBM System x at-a-glance guide
 ServeRAID M5025 SAS/SATA Controller for IBM System x IBM System x at-a-glance guide The ServeRAID M5025 SAS/SATA Controller for IBM System x is the next-generation 6 Gbps SAS 2.0 external RAID controller.
QuickSpecs. HP SAS Hard Drives. Overview
 Overview Serial Attached SCSI (SAS) provides a superior storage solution. With some storage requirements escalating and others becoming more complex, factors such as flexibility, performance, increased
SAS Connectivity Card (CIOv) for IBM BladeCenter IBM Redbooks Product Guide
 for IBM BladeCenter IBM Redbooks Product Guide") SAS Connectivity Card (CIOv) for IBM BladeCenter IBM Redbooks Product Guide The SAS Connectivity Card (CIOv) for IBM BladeCenter is an expansion card that offers the ideal way to connect the supported
SAS Connectivity Card (CIOv) for IBM BladeCenter IBM Redbooks Product Guide The SAS Connectivity Card (CIOv) for IBM BladeCenter is an expansion card that offers the ideal way to connect the supported
HPE ProLiant ML110 Gen10 Server
 Digital data sheet HPE ProLiant ML110 Gen10 Server ProLiant ML Servers What's new New SMB focused offers regionally released as Smart Buy Express in the U.S. and Canada, Top Value in Europe, and Intelligent