Citizen Data Scientist is the new Data Analyst
|
|
|
- Ruth Sparks
- 5 years ago
- Views:
Transcription

1
2 Welcome
3 # T C 1 8 Citizen Data Scientist is the new Data Analyst Mehmet Vanli Sales Consultant Tableau Australia
4 Citizen data scientist: A person who creates models that use advanced diagnostic analytics or predictive and prescriptive capabilities, but whose primary job function is outside the field of statistics and analytics.


5 Data driven organizations Technology & Automation Unicorn Data Scientists
6 Agenda Data Exploration Statistical Modelling Teaming up for Advanced Analytics
7 Data Exploration

8 Data exploration Data source :

9 Data exploration outliers
10 Data exploration Margin plots enable comparisons add context visualize the same fields in different ways
11 Data exploration Margin plots enable comparisons add context visualize the same fields in different ways
12 Data exploration using calculated fields
13 Statistical Modelling
14 Forecasting When to use : You have a time series You want to infer about future time series values
15 Forecasting Under the hood: Method - Exponential Smoothing Observations in the recent past are more predictive of the future than observations in the distant past.
16 Forecasting Under the hood: 95% prediction interval Tableau automatically selects the best of up to eight models, the best being the one that generates the highest quality forecast.
17 Trend Line When to use : To infer a relationship between two quantitative variables Used to show the overall pattern of a scatterplot Data Source:
18 Trend Line Line of best fit Under the hood: Method - Ordinary Least Squares What is the probability that this relationship is random? How much of the variations in divorce rate can be explained by salary?
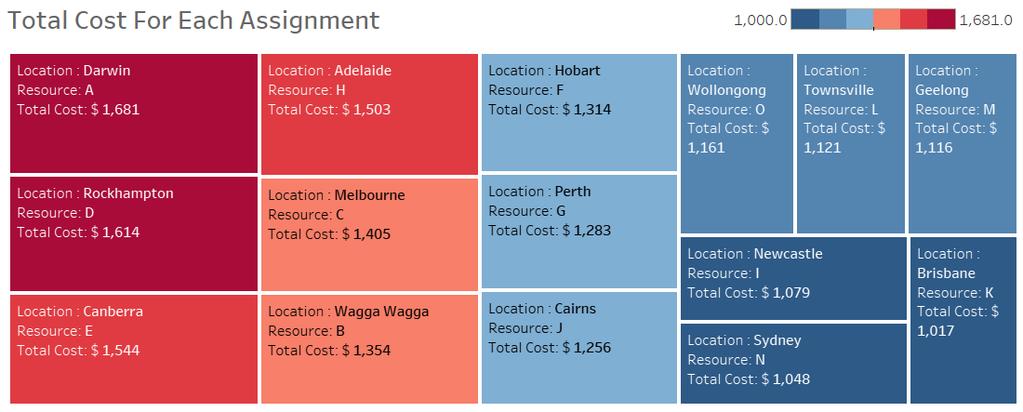
19 Clustering Which customers should we target for the next Pinot campaign? What are the characteristics of the customers based on what they bought? Data source:
20 Clustering

21 Clustering When to use : To group particular set of objects based on their characteristics, aggregating them according to their similarities. Under the hood: Method k-means K-means locates centers through an iterative procedure that minimizes distances between individual points in a cluster and the cluster center


22 Clustering Cluster 1: Pinot Lovers! Cluster 3: Mostly sparkling drinkers Cluster 4: Small buyers
23 Advanced Analytics


24 Teaming up for Advanced Analytics External services Integration In-Database Analytics Export Results Extensions for Tableau Dashboards

25 External Services - R Integration

26 R Integration

27 External Services - Python Integration


28 Python Integration


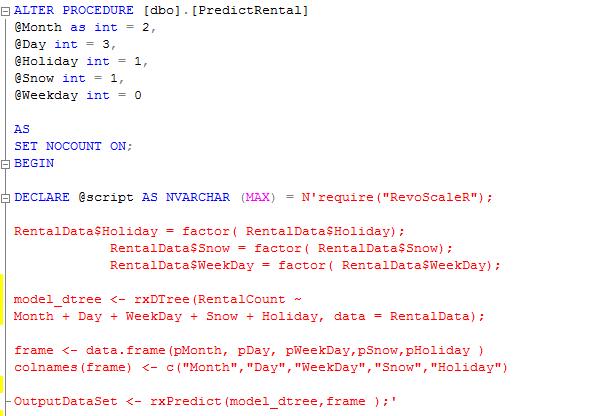


29 In-database Analytics MS SQL Server On-Premise SQL Server 2016,17 Azure SQL Server 2016,17 Stored Procedure Or Initial SQL

30 In-database Analytics MS SQL Server SQL Server 2016
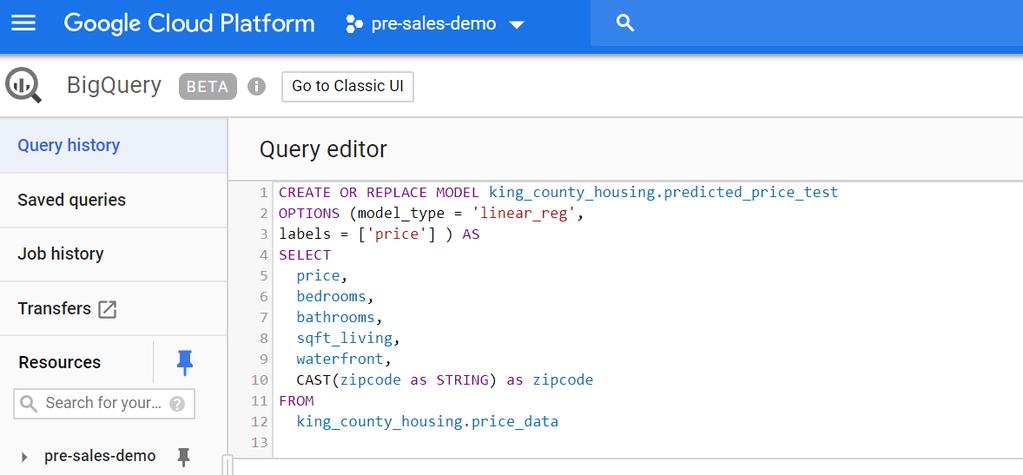
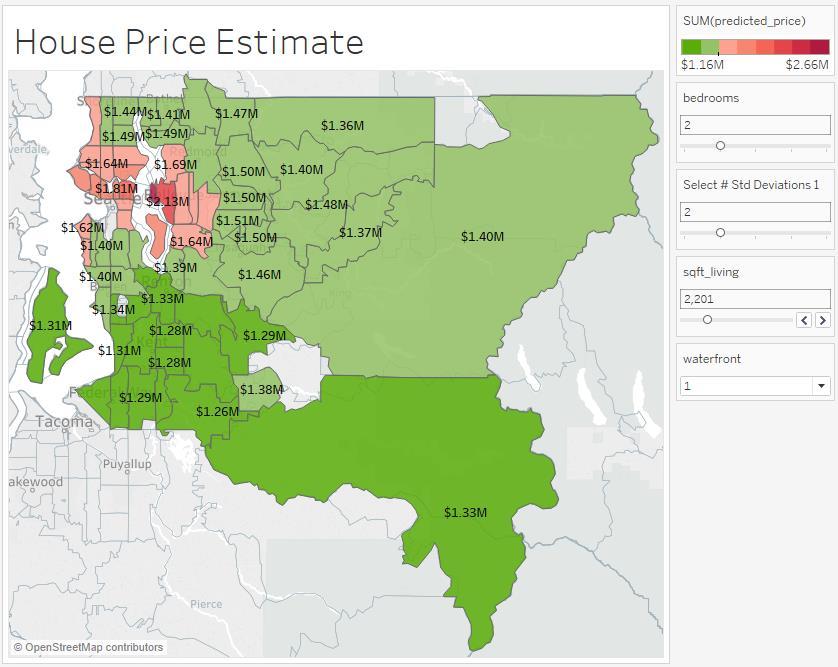


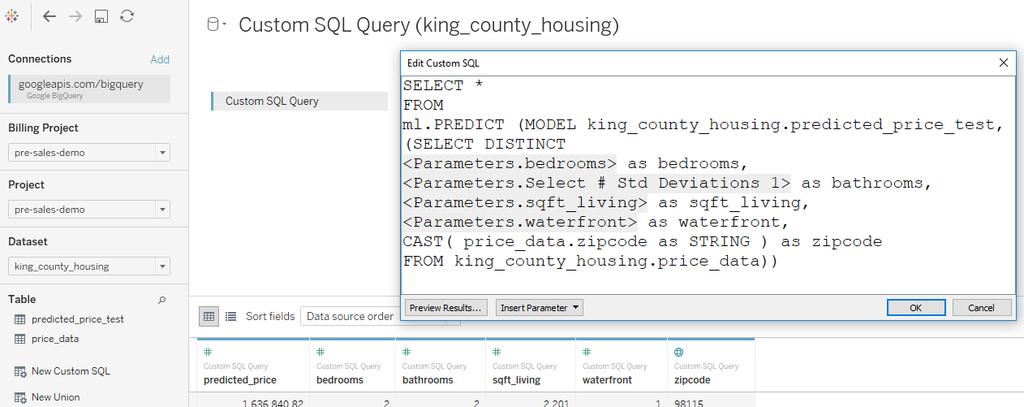
31 In-database Analytics Google BigQuery Custom Query


32 Extensions for Tableau Dashboards Extensions Gallery
33 Extensions for Tableau Dashboards


34 Extensions for Tableau Dashboards DataRobot Insights Extension Associations between variables Tableau dashboard powered by DataRobot. Train a predictive model and make predictions What if analysis how changes in parameters effects the predicted outcome?
35 Tableau empowers data analysts to become citizen data scientists
36 R E L AT E D S E S S I O N S Data science applications with TabPy/R Oct 24 12:00pm 1:00pm New Orleans Theater B Get on it, stat Statistical analysis skills in Tableau Oct 23 2:15pm 4:45m MCCO L2 244 Oct 24 1:45pm 4:15pm MCCO L2 R08 Oct 25 10:45am 1:15pm MCCO L2 294 Ready, set, action! Oct 23 2:15 3:15 pm MCCNO L2- R02 Oct 24 12:00 1:00 pm MCCNO L2- New Orleans Theater A

37 Please complete the session survey from the Session Details screen in your TC18 app
38 #TC18 Thank you!
39 Resources Content Tableau workbooks - How Airbnb Democratizes Data Science With Data University- Loupe Tooltips - Creating a Correlation Value Matrix - Analyze Data - Trend Line - Primer: What exactly is clustering, and why would you use it? - Finding the Pearson Correlation - Advanced Analytics with Tableau Working with External Services in Tableau: Python, R, and MATLAB - Interpreting earnings call with Natural Language Processing - Leveraging Google BigQuery's machine learning capabilities for analysis in Tableau- How to use Tableau with SQL Server on R and Python - Machine Learning Services (R, Python) in SQL Server
40
Catering to customers at DEG
 Welcome # T C 1 8 Catering to customers at DEG Creating painless, customized mobile reporting Matt Lewandowski Analytics Team Lead DEG R E L AT E D S E S S I O N S Catering to customers at DEG Day Time
Deploying Tableau at Enterprise Scale in the Cloud
 # T C 1 8 Deploying Tableau at Enterprise Scale in the Cloud Calvin Chaney Senior Systems Analyst Enterprise Analytics / Tableau Enterprise Analytics supports Tableau s mission of driving self-service
Using languages to build and reason about visualizations
 Welcome # T C 1 8 Using languages to build and reason about visualizations Scott Sherman Principal Software Engineer Tableau Research Agenda Why languages? The power of VizQL Visual Query Language, the
EZY Intellect Pte. Ltd., #1 Changi North Street 1, Singapore
 Tableau in Business Intelligence Duration: 6 Days Tableau Desktop Tableau Introduction Tableau Introduction. Overview of Tableau workbook, worksheets. Dimension & Measures Discrete and Continuous Install
Data Analytics at Logitech Snowflake + Tableau = #Winning
 Welcome # T C 1 8 Data Analytics at Logitech Snowflake + Tableau = #Winning Avinash Deshpande I am a futurist, scientist, engineer, designer, data evangelist at heart Find me at Avinash Deshpande Chief
Performance Issue : More than 30 sec to load. Design OK, No complex calculation. 7 tables joined, 500+ millions rows
 Bienvenue Nicolas Performance Issue : More than 30 sec to load Design OK, No complex calculation 7 tables joined, 500+ millions rows Denormalize, Materialized Views, Columnstore Index Less than 5 sec to
Extract API: Build sophisticated data models with the Extract API
 Welcome # T C 1 8 Extract API: Build sophisticated data models with the Extract API Justin Craycraft Senior Sales Consultant Tableau / Customer Consulting My Office Photo Used with permission Agenda 1)
The Definitive Guide to Preparing Your Data for Tableau
 The Definitive Guide to Preparing Your Data for Tableau Speed Your Time to Visualization If you re like most data analysts today, creating rich visualizations of your data is a critical step in the analytic
R Language for the SQL Server DBA
 R Language for the SQL Server DBA Beginning with R Ing. Eduardo Castro, PhD, Principal Data Analyst Architect, LP Consulting Moderated By: Jose Rolando Guay Paz Thank You microsoft.com idera.com attunity.com
Antrix Academy of Data Science TM
 TM Preparing for MOST Promising Career Opportunities in Data Analytics... Excel Tableau SAS Excel & SQL IBM SPSS Business Analytics COURSES # Duration* 1 Excel Proficiency 5 Hrs 2 Data Analytics with SAS
Data Analyst Nanodegree Syllabus
 Data Analyst Nanodegree Syllabus Discover Insights from Data with Python, R, SQL, and Tableau Before You Start Prerequisites : In order to succeed in this program, we recommend having experience working
Activator Library. Focus on maximizing the value of your data, gain business insights, increase your team s productivity, and achieve success.
 Focus on maximizing the value of your data, gain business insights, increase your team s productivity, and achieve success. ACTIVATORS Designed to give your team assistance when you need it most without
Data Analyst Nanodegree Syllabus
 Data Analyst Nanodegree Syllabus Discover Insights from Data with Python, R, SQL, and Tableau Before You Start Prerequisites : In order to succeed in this program, we recommend having experience working
ACHIEVEMENTS FROM TRAINING
 LEARN WELL TECHNOCRAFT DATA SCIENCE/ MACHINE LEARNING SYLLABUS 8TH YEAR OF ACCOMPLISHMENTS AUTHORIZED GLOBAL CERTIFICATION CENTER FOR MICROSOFT, ORACLE, IBM, AWS AND MANY MORE. 8411002339/7709292162 WWW.DW-LEARNWELL.COM
Create and Publish Accessible Dashboards In Tableau. Kyle Gupton Director, Product Management Tableau Software
 Welcome Create and Publish Accessible Dashboards In Tableau Kyle Gupton Director, Product Management Tableau Software Agenda Accessibility Basics Web Accessibility Standards Creating Accessible Dashboards
Cortana Intelligence Suite; Where the Magic Happens
 Cortana Intelligence Suite; Where the Magic Happens Reza Rad, Leila Etaati #509 Brisbane 2016 About Us Reza Rad Leila Etaati MVP BI Consultant and Trainer Author of Books Speaker in conferences; PASS Summit,
Microsoft Exam
 Volume: 42 Questions Case Study: 1 Relecloud General Overview Relecloud is a social media company that processes hundreds of millions of social media posts per day and sells advertisements to several hundred
SAS Visual Analytics 8.2: Getting Started with Reports
 SAS Visual Analytics 8.2: Getting Started with Reports Introduction Reporting The SAS Visual Analytics tools give you everything you need to produce and distribute clear and compelling reports. SAS Visual
Calc Me Maybe An Overview of All Tableau Calculations
 # C a l c M e M a y b e Calc Me Maybe An Overview of All Tableau Calculations David A Spezia Strategic Solutions Architect Tableau Software Agenda Understand the Calculation Types in Tableau Breakdown
 Welcome http://tableau.com/tableau-developer-puzzle-hunt http://tableau.com/tableau-developer-puzzle-hunt #TC18 Close the Loop & Light it Up with Dashboard Extensions Xavier Reid xreid@tableau.com Software
Supercharging Tableau for Sales Productivity
 Welcome # T C 1 8 Sales @Tableau Supercharging Tableau for Sales Productivity Zane Murfitt Senior Manager, Sales Tableau/Named Accounts # T C 1 8 Zane Murfitt Senior Manager, Sales Tableau/Named Accounts
Business Analytics Nanodegree Syllabus
 Business Analytics Nanodegree Syllabus Master data fundamentals applicable to any industry Before You Start There are no prerequisites for this program, aside from basic computer skills. You should be
Esri and MarkLogic: Location Analytics, Multi-Model Data
 Esri and MarkLogic: Location Analytics, Multi-Model Data Ben Conklin, Industry Manager, Defense, Intel and National Security, Esri Anthony Roach, Product Manager, MarkLogic James Kerr, Technical Director,
Data Science. Data Analyst. Data Scientist. Data Architect
 Data Science Data Analyst Data Analysis in Excel Programming in R Introduction to Python/SQL/Tableau Data Visualization in R / Tableau Exploratory Data Analysis Data Scientist Inferential Statistics &
BUSINESS ANALYTICS. 96 HOURS Practical Learning. DexLab Certified. Training Module. Gurgaon (Head Office)
") SAS (Base & Advanced) Analytics & Predictive Modeling Tableau BI 96 HOURS Practical Learning WEEKDAY & WEEKEND BATCHES CLASSROOM & LIVE ONLINE DexLab Certified BUSINESS ANALYTICS Training Module Gurgaon
SAS (Base & Advanced) Analytics & Predictive Modeling Tableau BI 96 HOURS Practical Learning WEEKDAY & WEEKEND BATCHES CLASSROOM & LIVE ONLINE DexLab Certified BUSINESS ANALYTICS Training Module Gurgaon
Agenda. Introduction Background. QPM Discrete Event Simulation. Case study. Using discrete event simulation for QPM
 Agenda Introduction Background QPM Discrete Event Simulation Case study Using discrete event simulation for QPM 1 Introduction Who we are Optimal Solutions & Technologies (OST, Inc) Washington DC-based,
Tableau Think Tank. Tips, Tricks and Overview for the Ohio Tableau Community. COPYRIGHT 2014 RESULT DATA - All Rights Reserved SLIDE 1
 Tableau Think Tank Tips, Tricks and Overview for the Ohio Tableau Community SLIDE 1 and Forecasting Outline Quick Table Calculations Computations Under the hood: Partitioning and Addressing Secondary Table
Think & Work like a Data Scientist with SQL 2016 & R DR. SUBRAMANI PARAMASIVAM (MANI)
") Think & Work like a Data Scientist with SQL 2016 & R DR. SUBRAMANI PARAMASIVAM (MANI) About the Speaker Dr. SubraMANI Paramasivam PhD., MCT, MCSE, MCITP, MCP, MCTS, MCSA CEO, Principal Consultant & Trainer
Think & Work like a Data Scientist with SQL 2016 & R DR. SUBRAMANI PARAMASIVAM (MANI) About the Speaker Dr. SubraMANI Paramasivam PhD., MCT, MCSE, MCITP, MCP, MCTS, MCSA CEO, Principal Consultant & Trainer
Analytics and Visualization
 GU I DE NO. 4 Analytics and Visualization AWS IoT Analytics Mini-User Guide Introduction As IoT applications scale, so does the data generated from these various IoT devices. This data is raw, unstructured,
ADVANCED ANALYTICS USING SAS ENTERPRISE MINER RENS FEENSTRA
 INSIGHTS@SAS: ADVANCED ANALYTICS USING SAS ENTERPRISE MINER RENS FEENSTRA AGENDA 09.00 09.15 Intro 09.15 10.30 Analytics using SAS Enterprise Guide Ellen Lokollo 10.45 12.00 Advanced Analytics using SAS
Deploying, Managing and Reusing R Models in an Enterprise Environment
 Deploying, Managing and Reusing R Models in an Enterprise Environment Making Data Science Accessible to a Wider Audience Lou Bajuk-Yorgan, Sr. Director, Product Management Streaming and Advanced Analytics
Tableau Desktop: Part 2
 Tableau Desktop: Part 2 095205 Target Student Professionals in a variety of job roles who are currently using Tableau to perform numerical or general data analysis, visualization, and reporting, who now
Introducing Microsoft SQL Server 2016 R Services. Julian Lee Advanced Analytics Lead Global Black Belt Asia Timezone
 Introducing Microsoft SQL Server 2016 R Services Julian Lee Advanced Analytics Lead Global Black Belt Asia Timezone SQL Server 2016: Everything built-in built-in built-in built-in built-in built-in $2,230
Doing the Data Science Dance
 Doing the Data Science Dance Dean Abbott Abbott Analytics, SmarterHQ KNIME Fall Summit 2018 Email: dean@abbottanalytics.com Twitter: @deanabb 1 Data Science vs. Other Labels 2 Google Trends 3 Abbott Analytics,
Six Core Data Wrangling Activities. An introductory guide to data wrangling with Trifacta
 Six Core Data Wrangling Activities An introductory guide to data wrangling with Trifacta Today s Data Driven Culture Are you inundated with data? Today, most organizations are collecting as much data in
BEST BIG DATA CERTIFICATIONS
 VALIANCE INSIGHTS BIG DATA BEST BIG DATA CERTIFICATIONS email : info@valiancesolutions.com website : www.valiancesolutions.com VALIANCE SOLUTIONS Analytics: Optimizing Certificate Engineer Engineering
 1 of 5 1/28/2015 12:27 PM BDA Program Program Mission/Purpose The mission of the Bachelor of Science in Business Data Analytics (BDA) program is to prepare students to understand the foundation of business
Automate Your Workflow Using Tableau Server Client and the REST API
 Welcome # T C 1 8 Automate Your Workflow Using Tableau Server Client and the REST API Chris Shin Software Engineer Developer Platform Ang Gao Software Engineer Developer Platform Enabling Integrations
Magento U. Getting Started with Magento Business Intelligence Essentials
 Magento U Getting Started with Magento Business Intelligence Essentials Leah Ard Solutions Architect, Magento Business Intelligence Nate Golubiewski Solutions Consultant, Magento Agenda Overview: Magento
Welcome to the Era of Open Analytics
 Welcome to the Era of Open Analytics Sumit Sarkar, Chief Data Evangelist, Progress sumit.sarkar@progress.com @SAsInSumit www.linkedin.com/in/meetsumit The embedded analytics market is estimated to nearly
Analytics Fundamentals by Mark Peco
 Analytics Fundamentals by Mark Peco All rights reserved. Reproduction in whole or part prohibited except by written permission. Product and company names mentioned herein may be trademarks of their respective
BIG DATA SCIENTIST Certification. Big Data Scientist
 BIG DATA SCIENTIST Certification Big Data Scientist Big Data Science Professional (BDSCP) certifications are formal accreditations that prove proficiency in specific areas of Big Data. To obtain a certification,
The Consequences of Poor Data Quality on Model Accuracy
 The Consequences of Poor Data Quality on Model Accuracy Dr. Gerhard Svolba SAS Austria Cologne, June 14th, 2012 From this talk you can expect The analytical viewpoint on data quality Answers to the questions
Driving value at Cars.com: Using spatial data to identify 7MM leads on dealership lots
 Welcome # T C 1 8 Driving value at Cars.com: Using spatial data to identify 7MM leads on dealership lots Jeff Bloomfield Senior Software Engineer Cars.com Who Are We? Cars.com is a leading two-sided digital
Ivy s Business Analytics Foundation Certification Details (Module I + II+ III + IV + V)
") Ivy s Business Analytics Foundation Certification Details (Module I + II+ III + IV + V) Based on Industry Cases, Live Exercises, & Industry Executed Projects Module (I) Analytics Essentials 81 hrs 1. Statistics
Ivy s Business Analytics Foundation Certification Details (Module I + II+ III + IV + V) Based on Industry Cases, Live Exercises, & Industry Executed Projects Module (I) Analytics Essentials 81 hrs 1. Statistics
Copyright 2018, Oracle and/or its affiliates. All rights reserved.
 Beyond SQL Tuning: Insider's Guide to Maximizing SQL Performance Monday, Oct 22 10:30 a.m. - 11:15 a.m. Marriott Marquis (Golden Gate Level) - Golden Gate A Ashish Agrawal Group Product Manager Oracle
Developing in Power BI. with Streaming Datasets and Real-time Dashboards
 Developing in Power BI with Streaming Datasets and Real-time Dashboards Code and Slides for this Session https://github.com/criticalpathtraining/realtimedashboards Critical Path Training https://www.criticalpathtrainig.com
Increase Value from Big Data with Real-Time Data Integration and Streaming Analytics
 Increase Value from Big Data with Real-Time Data Integration and Streaming Analytics Cy Erbay Senior Director Striim Executive Summary Striim is Uniquely Qualified to Solve the Challenges of Real-Time
Few s Design Guidance
 Few s Design Guidance CS 4460 Intro. to Information Visualization September 9, 2014 John Stasko Today s Agenda Stephen Few & Perceptual Edge Fall 2014 CS 4460 2 1 Stephen Few s Guidance Excellent advice
How to Troubleshoot Databases and Exadata Using Oracle Log Analytics
 How to Troubleshoot Databases and Exadata Using Oracle Log Analytics Nima Haddadkaveh Director, Product Management Oracle Management Cloud October, 2018 Copyright 2018, Oracle and/or its affiliates. All
this is not a love song How Spotify Uses Tableau Public Skyler Johnson
 this is not a love song How Spotify Uses Tableau Public Skyler Johnson Data Visualization Designer Spotify Intro Tableau Desktop/Server @ Spotify 2018.1, 8-core Primary & Worker usually upgrade soon
Security analytics: From data to action Visual and analytical approaches to detecting modern adversaries
 Security analytics: From data to action Visual and analytical approaches to detecting modern adversaries Chris Calvert, CISSP, CISM Director of Solutions Innovation Copyright 2013 Hewlett-Packard Development
The Science of Data Visualization
 Welcome # T C 1 8 The Science of Data Visualization Larry Silverstein Strategic Sales Consultant Tableau Start Your (Visualization) Engines Agenda The science of data visualization Best practices for building
ArcGIS Enterprise: Portal Administration BILL MAJOR CRAIG CLEVELAND
 ArcGIS Enterprise: Portal Administration BILL MAJOR CRAIG CLEVELAND Agenda Welcome & Introduction to ArcGIS Enterprise Portal for ArcGIS - Basic Configuration - Advanced Configuration - Deploying Apps
BUILD BETTER MICROSOFT SQL SERVER SOLUTIONS Sales Conversation Card
 OVERVIEW SALES OPPORTUNITY Lenovo Database Solutions for Microsoft SQL Server bring together the right mix of hardware infrastructure, software, and services to optimize a wide range of data warehouse
Introducing Oracle Machine Learning
 Introducing Oracle Machine Learning A Collaborative Zeppelin notebook for Oracle s machine learning capabilities Charlie Berger Marcos Arancibia Mark Hornick Advanced Analytics and Machine Learning Copyright
Machine Learning with Python
 DEVNET-2163 Machine Learning with Python Dmitry Figol, SE WW Enterprise Sales @dmfigol Cisco Spark How Questions? Use Cisco Spark to communicate with the speaker after the session 1. Find this session
Administering Your ArcGIS Enterprise Portal Bill Major Craig Cleveland
 Administering Your ArcGIS Enterprise Portal Bill Major Craig Cleveland Agenda Welcome & Introduction to ArcGIS Enterprise Portal for ArcGIS Administration - Basic Configuration - Advanced Configuration
10778A: Implementing Data Models and Reports with Microsoft SQL Server 2012
 10778A: Implementing Data Models and Reports with Microsoft SQL Server 2012 Course Overview This course provides students with the knowledge and skills to empower information workers through self-service
Indira Bandari. Predictive Analytics using R in SQL Server
 Indira Bandari Predictive Analytics using R in SQL Server Agenda What is Predictive Analytics? Analytics vs. Predictive Analytics Benefits of using R Predictive Analytics Life Cycle Demo Indira Bandari
Data Analysis and Data Science
 Data Analysis and Data Science CPS352: Database Systems Simon Miner Gordon College Last Revised: 4/29/15 Agenda Check-in Online Analytical Processing Data Science Homework 8 Check-in Online Analytical
CAREERS SNAPSHOT INFORMATION AND COMMUNICATIONS TECHNOLOGY TAFENSW.EDU.AU TAFE NSW STRATEGY
 CAREERS SNAPSHOT TAFE NSW STRATEGY INFORMATION AND COMMUNICATIONS TAFENSW.EDU.AU Which occupations in this industry are likely to have the largest employment growth over the next three years? Which TAFE
RIPE75 - Network monitoring at scale. Louis Poinsignon
 RIPE75 - Network monitoring at scale Louis Poinsignon Why monitoring and what to monitor? Why do we monitor? Billing Reducing costs Traffic engineering Where should we peer? Where should we set-up a new
BIG DATA COURSE CONTENT
 BIG DATA COURSE CONTENT [I] Get Started with Big Data Microsoft Professional Orientation: Big Data Duration: 12 hrs Course Content: Introduction Course Introduction Data Fundamentals Introduction to Data
Fast Innovation requires Fast IT
 Fast Innovation requires Fast IT Cisco Data Virtualization Puneet Kumar Bhugra Business Solutions Manager 1 Challenge In Data, Big Data & Analytics Siloed, Multiple Sources Business Outcomes Business Opportunity:
Hal Varian, Google s Chief Economist The McKinsey Quarterly, Jan 2009
 The ability to take data to be able to understand it, to process it, to extract value from it, to visualize it, to communicate it that s going to be a hugely important skill in the next decades, because
WHITEPAPER. MemSQL Enterprise Feature List
 WHITEPAPER MemSQL Enterprise Feature List 2017 MemSQL Enterprise Feature List DEPLOYMENT Provision and deploy MemSQL anywhere according to your desired cluster configuration. On-Premises: Maximize infrastructure
Management Information Systems
 Foundations of Business Intelligence: Databases and Information Management Lecturer: Richard Boateng, PhD. Lecturer in Information Systems, University of Ghana Business School Executive Director, PearlRichards
SQL Server Machine Learning Marek Chmel & Vladimir Muzny
 SQL Server Machine Learning Marek Chmel & Vladimir Muzny @VladimirMuzny & @MarekChmel MCTs, MVPs, MCSEs Data Enthusiasts! vladimir@datascienceteam.cz marek@datascienceteam.cz Session Agenda Machine learning
Learning Objectives for Data Concept and Visualization
 Learning Objectives for Data Concept and Visualization Assignment 1: Data Quality Concept and Impact of Data Quality Summarize concepts of data quality. Understand and describe the impact of data on actuarial
Asanka Padmakumara. ETL 2.0: Data Engineering with Azure Databricks
 Asanka Padmakumara ETL 2.0: Data Engineering with Azure Databricks Who am I? Asanka Padmakumara Business Intelligence Consultant, More than 8 years in BI and Data Warehousing A regular speaker in data
Using Tableau to report on SharePoint lists and libraries: A step by step guide
 Using Tableau to report on SharePoint lists and libraries: A step by step guide Tableau is one of the most renowned and accepted Business Intelligence tool for visually analyzing the data by organizations
DATA SCIENCE INTRODUCTION QSHORE TECHNOLOGIES. About the Course:
 DATA SCIENCE About the Course: In this course you will get an introduction to the main tools and ideas which are required for Data Scientist/Business Analyst/Data Analyst/Analytics Manager/Actuarial Scientist/Business
Minitab 17 commands Prepared by Jeffrey S. Simonoff
 Minitab 17 commands Prepared by Jeffrey S. Simonoff Data entry and manipulation To enter data by hand, click on the Worksheet window, and enter the values in as you would in any spreadsheet. To then save
Data Analytics Training Program
 Data Analytics Training Program In exclusive association with 1200+ Trainings 20,000+ Participants 10,000+ Brands 45+ Countries [Since 2009] Training partner for Who Is This Course For? Programers Willing
Oracle Big Data Science IOUG Collaborate 16
 Oracle Big Data Science IOUG Collaborate 16 Session 4762 Tim and Dan Vlamis Tuesday, April 12, 2016 Vlamis Software Solutions Vlamis Software founded in 1992 in Kansas City, Missouri Developed 200+ Oracle
ArcGIS in the Cloud. Andrew Sakowicz & Alec Walker
 ArcGIS in the Cloud Andrew Sakowicz & Alec Walker Key Takeaways How to Identify Organizational Strategy & Priorities Esri s Cloud Offerings A Broad Spectrum Successfully Executing Your Strategy The Cloud
SAS (Statistical Analysis Software/System)
") SAS (Statistical Analysis Software/System) SAS Adv. Analytics or Predictive Modelling:- Class Room: Training Fee & Duration : 30K & 3 Months Online Training Fee & Duration : 33K & 3 Months Learning SAS:
SAS (Statistical Analysis Software/System) SAS Adv. Analytics or Predictive Modelling:- Class Room: Training Fee & Duration : 30K & 3 Months Online Training Fee & Duration : 33K & 3 Months Learning SAS:
Certified Data Science with Python Professional VS-1442
 Certified Data Science with Python Professional VS-1442 Certified Data Science with Python Professional Certified Data Science with Python Professional Certification Code VS-1442 Data science has become
Mike Schulte Data Scientist at the University of Pittsburgh Professor of Economics and Philosophy at Western Michigan University
 Mike Schulte mike@shrewd-owl.com Data Scientist at the University of Pittsburgh Professor of Economics and Philosophy at Western Michigan University Advanced Analytics Introduced Advanced Analytics within
Statistical Graphs & Charts
 Statistical Graphs & Charts CS 4460 Intro. to Information Visualization August 30, 2017 John Stasko Learning Objectives Learn different statistical data graphs Line graph, Bar Graph, Scatterplot, Trellis,
Team AquaFu (Aperio) Data Science on Water Data
 Data Science on Water Data") Team AquaFu (Aperio) Data Science on Water Data Analysis of water quality problems - a challenge Water Quality sensors, Flow sensors Sensors of different types on different pipes. Unlabeled data. Tools
Team AquaFu (Aperio) Data Science on Water Data Analysis of water quality problems - a challenge Water Quality sensors, Flow sensors Sensors of different types on different pipes. Unlabeled data. Tools
Tableau JS API: The most delicious ingredient for your custom apps. #TableauJsApi. Jackson Huang. Timo Tautenhahn
 #TableauJsApi Tableau JS API: The most delicious ingredient for your custom apps Jackson Huang Software Engineer Tableau Seattle Timo Tautenhahn Senior Solution Consultant Tableau Germany @tautenhex Why
Curriculum Guide. ThingWorx
 Curriculum Guide ThingWorx Live Classroom Curriculum Guide Introduction to ThingWorx 8 ThingWorx 8 User Interface Development ThingWorx 8 Platform Administration ThingWorx 7.3 Fundamentals Applying Machine
Microsoft certified solutions associate
 Microsoft certified solutions associate MCSA: BI Reporting This certification demonstrates your expertise in analyzing data with both Power BI and Excel. Exam 70-778/Course 20778 Analyzing and Visualizing
Demystifying Machine Learning
 Demystifying Machine Learning Dmitry Figol, WW Enterprise Sales Systems Engineer - Programmability @dmfigol CTHRST-1002 Agenda Machine Learning examples What is Machine Learning Types of Machine Learning
DIGGING INTO COMPETENCIES AND CREDENTIALING REQUIREMENTS SEPTEMBER 23, 2015 LISA HORWITZ
 DIGGING INTO COMPETENCIES AND CREDENTIALING REQUIREMENTS SEPTEMBER 23, 2015 LISA HORWITZ WHY ARE COMPETENCY PATHS AND CREDENTIALS IMPORTANT? The more you know about SAS technology, the better you will
Multi-Dimensional Vis
 CSE512 :: 21 Jan 2014 Multi-Dimensional Vis Jeffrey Heer University of Washington 1 Last Time: Exploratory Data Analysis 2 Exposure, the effective laying open of the data to display the unanticipated,
Sql Server 2016 Reporting Services Cookbook
 We have made it easy for you to find a PDF Ebooks without any digging. And by having access to our ebooks online or by storing it on your computer, you have convenient answers with sql server 2016 reporting
Sitecore Experience Platform 8.0 Rev: September 13, Sitecore Experience Platform 8.0
 Sitecore Experience Platform 8.0 Rev: September 13, 2018 Sitecore Experience Platform 8.0 All the official Sitecore documentation. Page 1 of 455 Experience Analytics glossary This topic contains a glossary
Introduction to Customer Data Platforms
 Introduction to Customer Data Platforms Introduction to Customer Data Platforms Overview Many marketers are struggling to assemble the unified customer data they need for successful marketing programs.
Build a system health check for Db2 using IBM Machine Learning for z/os
 Build a system health check for Db2 using IBM Machine Learning for z/os Jonathan Sloan Senior Analytics Architect, IBM Analytics Agenda A brief machine learning overview The Db2 ITOA model solutions template
Prototyping Data Intensive Apps: TrendingTopics.org
 Prototyping Data Intensive Apps: TrendingTopics.org Pete Skomoroch Research Scientist at LinkedIn Consultant at Data Wrangling @peteskomoroch 09/29/09 1 Talk Outline TrendingTopics Overview Wikipedia Page
Tableau. training courses
 Tableau training courses Tableau Desktop 2 day course This course covers Tableau Desktop functionality required for new Tableau users. It starts with simple visualizations and moves to an in-depth look
Dallas Marks - Session 5010
 [ Delivering Personalized and Secure Business Intelligence With the SAP BusinessObjects Business Intelligence 4.0 Information Design Tool Chicago BusinessObjects User Group (CHIBOUG) Friday, November 18,
Data Sheet. Monitoring Automation for Web-Scale Networks MONITORING AUTOMATION FOR WEB-SCALE NETWORKS -
 Data Sheet Monitoring Automation for Web-Scale Networks CLOUD-BASED MONITORING AUTOMATION FOR WEB-SCALE NETWORKS NetSpyGlass (NSG) is cloud-based, network monitoring automation for network operators seeking
MicroStrategy Academic Program
 MicroStrategy Academic Program Creating a center of excellence for enterprise analytics and mobility. HOW TO DEPLOY ENTERPRISE ANALYTICS AND MOBILITY ON AWS APPROXIMATE TIME NEEDED: 1 HOUR In this workshop,
Adobe Target Analyst Adobe Certified Expert Exam Guide
 Adobe Target Analyst Adobe Certified Expert Exam Guide Exam number: 9A0-399 Note: To become certified as an Adobe Target Analyst requires passing this exam and exam 9A0-398 Adobe Target Business Practitioner.
TIBCO Spotfire Statement of Direction. Spotfire Product Management
 TIBCO Spotfire Statement of Direction Spotfire Product Management CONFIDENTIALITY The following information is confidential information of TIBCO Software Inc. Use, duplication, transmission, or republication
Join us for Joins (The Joy in Joins!!)
") # T C 1 8 Join us for Joins (The Joy in Joins!!) Terrence Maas Software Engineer tmaas@tableau.com Joanna Chen Software Engineer jochen@tableau.com Agenda Joins Why the hype? Intro to Tableau Prep Practical
# T C 1 8 Join us for Joins (The Joy in Joins!!) Terrence Maas Software Engineer tmaas@tableau.com Joanna Chen Software Engineer jochen@tableau.com Agenda Joins Why the hype? Intro to Tableau Prep Practical