Professional PostgreSQL monitoring made easy. Kaarel Moppel - p2d2.cz 2019 Prague
|
|
|
- Derick Rice
- 5 years ago
- Views:
Transcription
1 Professional PostgreSQL monitoring made easy Kaarel Moppel - p2d2.cz 2019 Prague

2 Who? Kaarel Moppel Senior Database Consultant

3 PostgreSQL Database Services Training Consulting High Availability Development Cloud Performance Tuning 24/7 Support Setup Replication


4 Client sectors University Automotive Government Industry Administration Finance Trade etc.
5 Agenda Different levels of database monitoring
6 Agenda Different levels of database monitoring PostgreSQL monitoring approaches
7 Agenda Different levels of database monitoring PostgreSQL monitoring approaches PostgreSQL monitoring tools
8 Agenda Different levels of database monitoring PostgreSQL monitoring approaches PostgreSQL monitoring tools pgwatch2 Main principles Architecture Features Demo
9 Agenda Different levels of database monitoring PostgreSQL monitoring approaches PostgreSQL monitoring tools pgwatch2 Main principles Architecture Features Demo Alerting / anomaly detection (if time)
10 Why to monitor Failure / Downtime detection Slowness / Performance analysis Proactive predictions Maybe wasting money?
11 Different levels of database monitoring High level service availability System monitoring PostgreSQL land
12 High level service availability Try to periodically connect/query from an outside system DIY - e.g. a simple Cron script SaaS - lots of service providers Who will guard the guards themselves? You ll probably want two services for more critical stuff
13 System monitoring Too many tools, no real standards. Just make sure to understand what you re measuring! Do you know what does the CPU load number actually mean? Is it a good metric? What s the difference between VIRT, RES, SHR memory values for a process?
14 PostgreSQL land Log analysis Stats Collector Extensions
15 Log analysis Just in case storing of logs for possible ad hoc needs Moving logs to a central place makes sense rsync + Cron Active parsing grep + Cron DIY (postgres_fdw, Graylog, ELK,...) pgbadger (JSON format) Some cloud service (Loggly, Splunk,...)
16 Logging configuration Some settings to note log_destination (I recommend CSV format) log_statement = none (default) log_min_duration_statement / log_duration log_min_messages / log_min_error_statement krl@postgres=# SELECT count(*) FROM pg_settings WHERE category LIKE 'Reporting and Logging%'; count
17 Stats Collector Not all track_* parameters enabled by default Dynamic views pg_stat_activity, pg_stat_(replication wal_receiver), pg_locks, pg_stat_ssl, pg_stat_progress_vacuum Cumulative views Most pg_stat_* views Long uptimes cause lag for problem detection Selective stats reset possible
18 Extensions Most notably pg_stat_statments ( top statements ) pgstattuple (bloat) pg_buffercache (what s in the shared buffers) auto_explain (for jumping runtimes)...
19 Real life Typically a mixed approach for bigger shops DYI Log collection / parsing Continuous storing of pg_stat* snapshots via some tool Alerting and trends predictions (it s hard!) APM A more high level concept, requires some trust / lock-in AppDynamics, New Relic, DataDog,...
20 PostgreSQL Monitoring Tools Ad hoc monitoring / troubleshooting Continuous monitoring frameworks
21 PostgreSQL Monitoring Tools No shortage of tools!
22 Ad hoc monitoring / troubleshooting Open Source ad-hoc tools pg_activity pgcenter pghero pgadmin4...
23 Continuous monitoring frameworks Commercial (mostly agent based) AppDynamics New Relic Datadog Vividcortex EDB Enterprise Manager pganalyze
24 Continuous monitoring frameworks Generic Open Source Nagios Icinga Munin Zabbix Base mostly on check_postgres script or derivatives
25 Postgres specific pghero PoWA (server side, quite advanced - pg_qualstats, pg_stat_kcache) PgCluu (server side, with sar system info) pgwatch2 (client or server side)...
26 pgwatch2 Main principles Architecture Features Demo
27 Main principles - why another tool? 1-minute setup Docker (custom setup also possible) User changeable visuals / dashboarding Non-invasive No extensions or superuser needed for base functionality Easy extensibility, do minimal work needed SQL metrics Easy alerting when needed
28 Architecture components Metrics gathering daemon Go Config database / YAML files Metrics storage layer PostgreSQL InfluxDB Graphite Optional simple Web UI for administration Easy dashboarding with data discovery and optional alerting Grafana

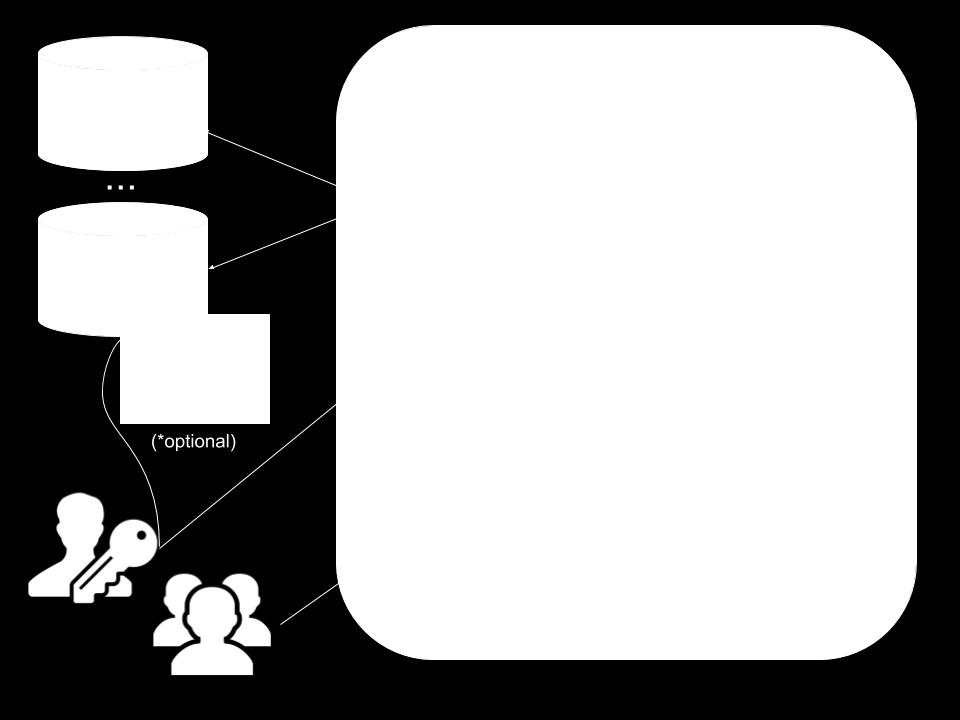
29
30 Features Ready to go Default metrics cover almost all pg_stat* views Pre-configured dashboards for almost all metrics Supports Postgres 9.0+ out of the box Older versions also possible Configurable security - admin login, SSL Reuse of existing Postgres, Grafana, InfluxDB installations possible Kubernetes/OpenStack ready
31 Features Configured per DB, with optional auto-discovery of PG clusters Change detection Added/changed/deleted table/index/sproc/config events AWS RDS CloudWatch metrics support PgBouncer metrics support Extensible Custom metrics via SQL, i.e. usable also for business layer! Grafana has plugins
32 Getting started 1. docker run -d --restart=unless-stopped \ -p 3000:3000 -p 8080:8080 \ --name pw2 cybertec/pgwatch2-postgres 2. Wait some seconds and open browser at localhost: Insert your DB connection strings 4. Start viewing/editing dashboards in 5min...
33

34

35

36

37

38

39
40 Beyond basics Alerting Anomaly detection
41 Alerting Quite easy with Grafana, point-and-click Most important alerting services covered Slack PagerDuty Web hooks Based on graph panels only currently :/
42 Anomaly detection Kapacitor - part of the InfluxData s TICK stack Harder to get going but powerful Extensive math/string processing support Statistical data mangling UDF-s Alert topics - pub/sub Stream caching (e.g. last 10min moving average) Stream redirection - store transformed data back into InfluxDB
43 Kapacitor sample -simplified from().measurement('cpu') groupby('service', 'datacenter') window().period(10m) percentile('load_1min', 95.0) eval(lambda: sigma("percentile")).as('sigma') alert().crit(lambda: "sigma" > 3.0)


44 Improvement ideas? User input very much expected github.com/cybertec-postgresql/pgwatch2
45 kthxbye Don t be a stranger:
Professional PostgreSQL monitoring made easy. Kaarel Moppel Kaarel Moppel
 Professional PostgreSQL monitoring made easy Kaarel Moppel Kaarel Moppel Why to monitor Failure / Downtime detection Slowness / Performance analysis Proactive predictions Maybe wasting money? Kaarel Moppel
PostgreSQL monitoring with pgwatch2. Kaarel Moppel / PostgresConf US 2018
 PostgreSQL monitoring with pgwatch2 Why to monitor Failure / Downtime detection Slowness / Performance analysis Proactive predictions Maybe wasting money? Different levels of Database monitoring Service
Keep an eye on your PostgreSQL clusters
 Keep an eye on your PostgreSQL clusters Open PostgreSQL Monitoring & PostgreSQL Workload Analyzer Julien Rouhaud Dalibo - www.dalibo.org pgconf.ru 2015 - February, 6th [ 1 / 37 ] Monitoring? Service availability
The Art of Container Monitoring. Derek Chen
 The Art of Container Monitoring Derek Chen 2016.9.22 About me DevOps Engineer at Trend Micro Agile transformation Micro service and cloud service Docker integration Monitoring system development Automate
PostgreSQL migration from AWS RDS to EC2
 PostgreSQL migration from AWS RDS to EC2 Technology lover Worked as Software Engineer, Team lead, DevOps, DBA, Data analyst Sr. Tech Architect at Coverfox Email me at mistryhitul007@gmail.com Tweet me
WOMBATOAM OPERATIONS & MAINTENANCE FOR ERLANG & ELIXIR SYSTEMS
 version 3.0.0 3.0.0 IMPROVEMENTS OVER 2.0.0 MONITORING ++ Extensive dashboard redesign with a new, more intuitive user interface using GridStack. ++ Improved Mnesia netsplit service to detect and fix partitions
WOMBATOAM OPERATIONS & MAINTENANCE FOR ERLANG & ELIXIR SYSTEMS
 version 3.0.0 3.0.0 IMPROVEMENTS OVER 2.0.0 MONITORING ++ Extensive dashboard redesign with a new, more intuitive user interface using GridStack. ++ Improved Mnesia netsplit service to detect and fix partitions
Building an Enterprise-grade PostgreSQL Server using Open Source tools
 Building an Enterprise-grade PostgreSQL Server using Open Source tools Avinash Vallarapu (Avi) Fernando Laudares Percona Usual Myths Security is not free Cannot take a full backup that is good for PITR
Open Source Database Performance Optimization and Monitoring with PMM. Fernando Laudares, Vinicius Grippa, Michael Coburn Percona
 Open Source Database Performance Optimization and Monitoring with PMM Fernando Laudares, Vinicius Grippa, Michael Coburn Percona Fernando Laudares 2 Vinicius Grippa 3 Michael Coburn Product Manager for
Monitoring MySQL Performance with Percona Monitoring and Management
 Monitoring MySQL Performance with Percona Monitoring and Management Santa Clara, California April 23th 25th, 2018 MIchael Coburn, Product Manager Your Presenter Product Manager for PMM (also Percona Toolkit
Effecient monitoring with Open source tools. Osman Ungur, github.com/o
 Effecient monitoring with Open source tools Osman Ungur, github.com/o Who i am? software developer with system-administration background over 10 years mostly writes Java and PHP also working about infrastructure
MQ Monitoring on Cloud
 MQ Monitoring on Cloud Suganya Rane Digital Automation, Integration & Cloud Solutions Agenda Metrics & Monitoring Monitoring Options AWS ElasticSearch Kibana MQ CloudWatch on AWS Prometheus Grafana MQ
Infrastructure at your Service. Elking your PostgreSQL Database Infrastructure
 Infrastructure at your Service. About me Infrastructure at your Service. Arnaud Berbier Senior Consultant +41 79 128 91 45 arnaud.berbier@dbi-services.com Page 2 Agenda 1.Playground Infrastructure 2.Elastic
Linux Clusters Institute: Monitoring. Zhongtao Zhang, System Administrator, Holland Computing Center, University of Nebraska-Lincoln
 Linux Clusters Institute: Monitoring Zhongtao Zhang, System Administrator, Holland Computing Center, University of Nebraska-Lincoln Why monitor? 2 Service Level Agreement (SLA) Which services must be provided
Using Prometheus with InfluxDB for metrics storage
 Using Prometheus with InfluxDB for metrics storage Roman Vynar Senior Site Reliability Engineer, Quiq September 26, 2017 About Quiq Quiq is a messaging platform for customer service. https://goquiq.com
README file for TICKpy (CogSys) Container v0.9.4
 Container v0.9.4") README file for TICKpy (CogSys) Container v0.9.4 Container: TICKpy (CogSys) Container-Version: 0.9.4 Interface-Version: 2.0.0 Build-date: Wed Jun 27 12:09:08 UTC 2018 Maintainer: Oliver Beyer Support:
README file for TICKpy (CogSys) Container v0.9.4 Container: TICKpy (CogSys) Container-Version: 0.9.4 Interface-Version: 2.0.0 Build-date: Wed Jun 27 12:09:08 UTC 2018 Maintainer: Oliver Beyer Support:
Solving Problems in Ways Never Before Possible, with FusionReactor 7
 Solving Problems in Ways Never Before Possible, with FusionReactor 7 Introductions Charlie Arehart Independent Consultant, CArehart.org (Focused on server troubleshooting) Agenda Foreword Major new FR
Monitoring MySQL Performance with Percona Monitoring and Management
 Monitoring MySQL Performance with Percona Monitoring and Management Your Presenters Michael Coburn - PMM Product Manager Working at Percona for almost 5 years Consultant, Manager, TAM, now Product Manager
Using Percona Monitoring and Management to Troubleshoot MySQL Performance Issues
 Using Percona Monitoring and Management to Troubleshoot MySQL Performance Issues Michael Coburn, Product Manager PMM September 7th, 2017 1 Your presenter Michael Coburn - Product Manager PMM Working at
Run your own Open source. (MMS) to avoid vendor lock-in. David Murphy MongoDB Practice Manager, Percona
 to avoid vendor lock-in. David Murphy MongoDB Practice Manager, Percona") Run your own Open source Click alternative to edit to Master Ops-Manager title style (MMS) to avoid vendor lock-in David Murphy MongoDB Practice Manager, Percona Who is this Person and What Does He Know?
Run your own Open source Click alternative to edit to Master Ops-Manager title style (MMS) to avoid vendor lock-in David Murphy MongoDB Practice Manager, Percona Who is this Person and What Does He Know?
Breaking PostgreSQL at Scale. Christophe Pettus PostgreSQL Experts FOSDEM 2019
 Breaking PostgreSQL at Scale. Christophe Pettus PostgreSQL Experts FOSDEM 2019 Christophe Pettus CEO, PostgreSQL Experts, Inc. christophe.pettus@pgexperts.com thebuild.com twitter @xof So, what is this?
Monitoring InfluxCloud with InfluxDB, Grafana, Telegraf, and Kapacitor. Paul Dix CTO & cofounder of
 Monitoring InfluxCloud with InfluxDB, Grafana, Telegraf, and Kapacitor Paul Dix CTO & cofounder of InfluxData @pauldix Who am I? What is InfluxCloud? Cost to monitor with SaaS > $10,000/month We do it
Big Data Insights Using Analytics
 Governors State University OPUS Open Portal to University Scholarship All Capstone Projects Student Capstone Projects Fall 2015 Big Data Insights Using Analytics Naga Krishna Reddy Muppidi Governors State
Visualize Your Data With Grafana Percona Live Daniel Lee - Software Engineer at Grafana Labs
 Visualize Your Data With Grafana Percona Live 2017 Daniel Lee - Software Engineer at Grafana Labs Daniel Lee Software Engineer at Grafana Labs Stockholm, Sweden @danlimerick on Twitter What is Grafana?
Monasca. Monitoring/Logging-as-a-Service (at-scale)
") Monasca Monitoring/Logging-as-a-Service (at-scale) Speaker Roland Hochmuth Hewlett Packard Enterprise Fort Collins, Colorado, USA Agenda Describe how to build a highly scalable monitoring and logging as
Monasca Monitoring/Logging-as-a-Service (at-scale) Speaker Roland Hochmuth Hewlett Packard Enterprise Fort Collins, Colorado, USA Agenda Describe how to build a highly scalable monitoring and logging as
AALOK INSTITUTE. DevOps Training
 DevOps Training Duration: 40Hrs (8 Hours per Day * 5 Days) DevOps Syllabus 1. What is DevOps? a. History of DevOps? b. How does DevOps work anyways? c. Principle of DevOps: d. DevOps combines the best
Exploring Cloud Security, Operational Visibility & Elastic Datacenters. Kiran Mohandas Consulting Engineer
 Exploring Cloud Security, Operational Visibility & Elastic Datacenters Kiran Mohandas Consulting Engineer The Ideal Goal of Network Access Policies People (Developers, Net Ops, CISO, ) V I S I O N Provide
SQL Server inside a docker container. Christophe LAPORTE SQL Server MVP/MCM SQL Saturday 735 Helsinki 2018
 SQL Server inside a docker container Christophe LAPORTE SQL Server MVP/MCM SQL Saturday 735 Helsinki 2018 Christophe LAPORTE ~ since 1997 : SQL 6.5 / WinNT4 christophe_laporte@hotmail.fr http://conseilit.wordpress.com/
IBM Security QRadar Deployment Intelligence app IBM
 IBM Security QRadar Deployment Intelligence app IBM ii IBM Security QRadar Deployment Intelligence app Contents QRadar Deployment Intelligence app.. 1 Installing the QRadar Deployment Intelligence app.
PoWA Documentation. Release Dalibo
 PoWA Documentation Release 1.2.1 Dalibo May 04, 2015 Contents 1 PostgreSQL Workload Analyzer detailled installation guide 3 1.1 Download PoWA from the website................................... 3 1.2
Migrating and living on RDS/Aurora. life after Datacenters
 Migrating and living on RDS/Aurora life after Datacenters Why to migrate to RDS - It is AWS native - A lot of complexity is handled by Amazon - It is Someone Else s Problem (SEP ) - You have someone to
From LLD to SuperDiscovery
 From LLD to SuperDiscovery How to involve developers in monitoring process Ilya Ableev 16th of September Who am I? Ilya Ableev, Head of Monitoring Department in Badoo Zabbix experience 7 years (certified
Open-Falcon A Distributed and High-Performance Monitoring System. Yao-Wei Ou & Lai Wei 2017/05/22
 Open-Falcon A Distributed and High-Performance Monitoring System Yao-Wei Ou & Lai Wei 2017/05/22 Let us begin with a little story Grafana PR#3787 [feature] Add Open-Falcon datasource I'm sorry but we will
Amp Up Troubleshooting Effectiveness with Free Genesys Care Tools. Marc Picard & Zenon Marsh Genesys Care Infrastructure and Tools
 Amp Up Troubleshooting Effectiveness with Free Genesys Care Tools Marc Picard & Zenon Marsh Genesys Care Infrastructure and Tools Information gathering Various data sources Genesys Care Tools and Services
High availability and analysis of PostgreSQL
 High availability and analysis of PostgreSQL Sergey Kalinin 18-19 of April 2012, dcache Workshop, Zeuthen Content There is a lot you can do with PG. This talk concentrates on backup, high availability
Designing MQ deployments for the cloud generation
 Designing MQ deployments for the cloud generation WebSphere User Group, London Arthur Barr, Senior Software Engineer, IBM MQ 30 th March 2017 Top business drivers for cloud 2 Source: OpenStack user survey,
Monitoring MySQL with Prometheus & Grafana
 Monitoring MySQL with Prometheus & Grafana Julien Pivotto (@roidelapluie) Percona University Belgium June 22nd, 2017 SELECT USER(); Julien "roidelapluie" Pivotto @roidelapluie Sysadmin at inuits Automation,
Prometheus. A Next Generation Monitoring System. Brian Brazil Founder
 Prometheus A Next Generation Monitoring System Brian Brazil Founder Who am I? Engineer passionate about running software reliably in production. Based in Ireland Core-Prometheus developer Contributor to
LNE. Vlaamse Milieuoverheid Flemish environmental government. Author: Patrik Uytterhoeven
 Zabbix @ LNE Vlaamse Milieuoverheid Flemish environmental government Author: Patrik Uytterhoeven Who Am I Name: Patrik Uytterhoeven Job: Open-source consultant Company: Open-future Zabbix Trainer Author:
Consuming Model-Driven Telemetry
 Consuming Model-Driven Telemetry Cristina Precup & Stefan Braicu Software Systems Engineers Cisco Spark How Questions? Use Cisco Spark to communicate with the speaker after the session 1. Find this session
Cloud providers, tools and best practices in running Magento on Kubernetes. Adrian Balcan MindMagnet Software
 Cloud providers, tools and best practices in running Magento on Kubernetes Adrian Balcan DevOps @ MindMagnet Software About Me Companies Projects Adrian Balcan contact@adrianbalcan.com Agenda Magento on
Postgres in Amazon RDS. Denish Patel Lead Database Architect
 Postgres in Amazon RDS / Denish Patel Lead Database Architect Who am I? Database Architect with OmniTI for last 7+ years Expertise in PostgreSQL, Oracle, MySQL, NoSQL Contact : denish@omniti.com, Twitter:
4 Effective Tools for Docker Monitoring. By Ranvijay Jamwal
 4 Effective Tools for Docker Monitoring By Ranvijay Jamwal CONTENT 1. The need for Container Technologies 2. Introduction to Docker 2.1. What is Docker? 2.2. Why is Docker popular? 2.3. How does a Docker
Activator Library. Focus on maximizing the value of your data, gain business insights, increase your team s productivity, and achieve success.
 Focus on maximizing the value of your data, gain business insights, increase your team s productivity, and achieve success. ACTIVATORS Designed to give your team assistance when you need it most without
Scaling with Postgres. Robert Treat Percona Performance Conference 2009
 Scaling with Postgres Robert Treat Percona Performance Conference 2009 Disclaimer Every really big site uses custom solutions. Don t expect to get there using out of the box software. You don t have to
Data Sheet. Monitoring Automation for Web-Scale Networks MONITORING AUTOMATION FOR WEB-SCALE NETWORKS -
 Data Sheet Monitoring Automation for Web-Scale Networks CLOUD-BASED MONITORING AUTOMATION FOR WEB-SCALE NETWORKS NetSpyGlass (NSG) is cloud-based, network monitoring automation for network operators seeking
Copyright 2018, Oracle and/or its affiliates. All rights reserved.
 Beyond SQL Tuning: Insider's Guide to Maximizing SQL Performance Monday, Oct 22 10:30 a.m. - 11:15 a.m. Marriott Marquis (Golden Gate Level) - Golden Gate A Ashish Agrawal Group Product Manager Oracle
EDB & PGPOOL Relationship and PGPOOL II 3.4 Benchmarking results on AWS
 EDB & PGPOOL Relationship and PGPOOL II 3.4 Benchmarking results on AWS May, 2015 2014 EnterpriseDB Corporation. All rights reserved. 1 Ahsan Hadi Senior Director of Product Development with EnterpriseDB
IT Best Practices Audit TCS offers a wide range of IT Best Practices Audit content covering 15 subjects and over 2200 topics, including:
 IT Best Practices Audit TCS offers a wide range of IT Best Practices Audit content covering 15 subjects and over 2200 topics, including: 1. IT Cost Containment 84 topics 2. Cloud Computing Readiness 225
Site Speed: To Measure Is To Know. Sava Sertov QA Technical Lead ecommera
 Site Speed: To Measure Is To Know Sava Sertov QA Technical Lead ecommera We want to be faster than our competitors "80-90% of the end-user response time is spent on the front-end. Start there. Someone
F5 Analytics and Visibility Solutions
 Agility 2017 Hands-on Lab Guide F5 Analytics and Visibility Solutions F5 Networks, Inc. 2 Contents: 1 Class 1: Introduction to F5 Analytics 5 1.1 Lab Environment Setup.......................................
Logging in the age of
 Logging in the age of and the Cloud Microservices @axelfontaine POLL: what type of infrastructure are you running on? On Premise Colocation Root Server Cloud The (good) old days of logging ssh me@myserver
Oracle Enterprise Manager 12c IBM DB2 Database Plug-in
 Oracle Enterprise Manager 12c IBM DB2 Database Plug-in May 2015 Safe Harbor Statement The following is intended to outline our general product direction. It is intended for information purposes only, and
Debug and Tune PL/pgSQL Function
 Debug and Tune PL/pgSQL Function 22 Feb 2018 Bengaluru Mohamed Tanveer Senior PostgreSQL DBA, pgconf India 2018 about us Started Operations in early 2010 Around 130 member team Headquartered in East Brunswick,
Prometheus For Big & Little People Simon Lyall
 Prometheus For Big & Little People Simon Lyall Sysadmin (it says DevOps Engineer in my job title) Large Company, Auckland, New Zealand Use Prometheus at home on workstations, home servers and hosted Vms
Enterprise Overview. Benefits and features of Cloudflare s Enterprise plan FLARE
 Enterprise Overview Benefits and features of s Enterprise plan 1 888 99 FLARE enterprise@cloudflare.com www.cloudflare.com This paper summarizes the benefits and features of s Enterprise plan. State of
How we built a highly scalable Machine Learning platform using Apache Mesos
 How we built a highly scalable Machine Learning platform using Apache Mesos Daniel Sârbe Development Manager, BigData and Cloud Machine Translation @ SDL Co-founder of BigData/DataScience Meetup Cluj,
Percona Software & Services Update
 Percona Software & Services Update Q2 2017 Peter Zaitsev,CEO Percona Technical Webinars May 4, 2017 Why? Talking to Many Users and Customers Getting What have you been up to? Question This is a way to
Oralogic Education Systems
 Oralogic Education Systems Next Generation IT Education Systems Introduction: In the Oracle Database 12c: Performance Management and Tuning course, learn about the performance analysis and tuning tasks
JBOSS OPERATIONS NETWORK FAQ Answers to frequently asked questions
 Answers to frequently asked questions General Product Q: What is JBoss Operations Network? A: JBoss Operations Network is a middleware and application management solution that provides a single point of
MFM 4.2 AWS. User Manual
 MFM 4.2 AWS User Manual Table of Contents 1. Product Overview... 6 Main Functions... 7 2. Maxgauge Daemon & Client... 10 MaxGauge Startup and Shutdown... 10 MaxGauge Real-time Client Startup... 10 MaxGauge
Cloud Monitoring as a Service. Built On Machine Learning
 Cloud Monitoring as a Service Built On Machine Learning Table of Contents 1 2 3 4 5 6 7 8 9 10 Why Machine Learning Who Cares Four Dimensions to Cloud Monitoring Data Aggregation Anomaly Detection Algorithms
EZY Intellect Pte. Ltd., #1 Changi North Street 1, Singapore
 Oracle Database 12c: Performance Management and Tuning NEW Duration: 5 Days What you will learn In the Oracle Database 12c: Performance Management and Tuning course, learn about the performance analysis
Oracle Big Data Cloud Service, Oracle Storage Cloud Service, Oracle Database Cloud Service
 Demo Introduction Keywords: Oracle Big Data Cloud Service, Oracle Storage Cloud Service, Oracle Database Cloud Service Goal of Demo: Oracle Big Data Preparation Cloud Services can ingest data from various
Metrics Guide. March 29, Version
 Metrics Guide March 29, 2018 - Version 9.5.411.4 - - - - - - - - - - - - - - - - - - - - - - - - - - - - - - - - - - - - - - - - - - - - - - - - - - - - - - - - - - - - - - - - - - - - - - - - - - - -
Minimizing the Risks of OpenStack Adoption
 Minimizing the Risks of OpenStack Adoption White Paper Minimizing the Risks of OpenStack Adoption Introduction Over the last five years, OpenStack has become a solution of choice for enterprise private
DataCenter.ai. A Predictive Analytics Framework for Modern Data Cedtner, and A Case Study for Disk Failure Prediction
 DataCenter.ai A Predictive Analytics Framework for Modern Data Cedtner, and A Case Study for Disk Failure Prediction Yuming Ma Architect, Cisco Cloud Services Eric Chen CEO, ProphetStor March 21, 2017
Advanced ecommerce Monitoring one tool does it all
 Advanced ecommerce Monitoring one tool does it all No ecommerce platform can be operated without a proper monitoring solution in place. In fact monitoring or analytics alone isn t enough. If you are serious
Zumobi Brand Integration(Zbi) Platform Architecture Whitepaper Table of Contents
 Platform Architecture Whitepaper Table of Contents") Zumobi Brand Integration(Zbi) Platform Architecture Whitepaper Table of Contents Introduction... 2 High-Level Platform Architecture Diagram... 3 Zbi Production Environment... 4 Zbi Publishing Engine...
Zumobi Brand Integration(Zbi) Platform Architecture Whitepaper Table of Contents Introduction... 2 High-Level Platform Architecture Diagram... 3 Zbi Production Environment... 4 Zbi Publishing Engine...
EDB Postgres Enterprise Manager Installation Guide Version 6.0
 EDB Postgres Enterprise Manager Installation Guide Version 6.0 March 7, 2016 EDB Postgres Enterprise Manager Installation Guide by EnterpriseDB Corporation Copyright 2013-2016 EnterpriseDB Corporation.
How can you implement this through a script that a scheduling daemon runs daily on the application servers?
 You ve been tasked with implementing an automated data backup solution for your application servers that run on Amazon EC2 with Amazon EBS volumes. You want to use a distributed data store for your backups
A Survey on Open Source Tools - for Server Monitoring using SNMP
 A Survey on Open Source Tools - for Server Monitoring using SNMP S. Priscilla Florence Persis, S. Bindiya B.Tech IT III year SNS College of Engineering,Coimbatore. Abstract:- This paper covers the scope
Monitoring agent for PostgreSQL 1.0 Fix Pack 12. Reference IBM
 Monitoring agent for PostgreSQL 1.0 Fix Pack 12 Reference IBM Monitoring agent for PostgreSQL 1.0 Fix Pack 12 Reference IBM Note Before using this information and the product it supports, read the information
Lassoing the Clouds: Best Practices on AWS. Brian DeShong May 26, 2017
 Lassoing the Clouds: Best Practices on AWS Brian DeShong May 26, 2017 Who am I? Who am I? Who am I? Who am I? Agenda Agenda Running web servers Agenda Running web servers Serving static content Agenda
Using the SDACK Architecture to Build a Big Data Product. Yu-hsin Yeh (Evans Ye) Apache Big Data NA 2016 Vancouver
 Apache Big Data NA 2016 Vancouver") Using the SDACK Architecture to Build a Big Data Product Yu-hsin Yeh (Evans Ye) Apache Big Data NA 2016 Vancouver Outline A Threat Analytic Big Data product The SDACK Architecture Akka Streams and data
Using the SDACK Architecture to Build a Big Data Product Yu-hsin Yeh (Evans Ye) Apache Big Data NA 2016 Vancouver Outline A Threat Analytic Big Data product The SDACK Architecture Akka Streams and data
 https://bit.do/pgsessions-postgresqlkubernetes PostgreSQL and Kubernetes Database as a Service without a Vendor Lock-in Oleksii Kliukin PostgreSQL Sessions 10 Paris, France About me PostgreSQL Engineer
ThoughtSpot on AWS Quick Start Guide
 ThoughtSpot on AWS Quick Start Guide Version 4.2 February 2017 Table of Contents Contents Chapter 1: Welcome to ThoughtSpot...3 Contact ThoughtSpot... 4 Chapter 2: Introduction... 6 About AWS...7 Chapter
FUJITSU Software ServerView Cloud Monitoring Manager V1.1. Release Notes
 FUJITSU Software ServerView Cloud Monitoring Manager V1.1 Release Notes J2UL-2170-01ENZ0(00) July 2016 Contents Contents About this Manual... 4 1 What's New?...6 1.1 Performance Improvements... 6 1.2
Real-time Monitoring, Inventory and Change Tracking for. Track. Report. RESOLVE!
 Real-time Monitoring, Inventory and Change Tracking for Track. Report. RESOLVE! Powerful Monitoring Tool for Full Visibility over Your Hyper-V Environment VirtualMetric provides the most comprehensive
Migrating to Aurora MySQL and Monitoring with PMM. Percona Technical Webinars August 1, 2018
 Migrating to Aurora MySQL and Monitoring with PMM Percona Technical Webinars August 1, 2018 Introductions Introduction Vineet Khanna (Autodesk) Senior Database Engineer vineet.khanna@autodesk.com Tate
ELK Stack Elasticsearch, Logstash, Kibana
 www.netways.de ELK Stack Elasticsearch, Logstash, Kibana Munich 19.10.2015 INTRODUCTION Bernd Erk CEO at NETWAYS GmbH Co-Founder Icinga @gethash info@netways.de NETWAYS GmbH Open Source Service Provider
Oracle Database 12c: Performance Management and Tuning
 Oracle University Contact Us: +43 (0)1 33 777 401 Oracle Database 12c: Performance Management and Tuning Duration: 5 Days What you will learn In the Oracle Database 12c: Performance Management and Tuning
ManageEngine Applications Manager 9. Product Features
 ManageEngine Applications Manager 9 Product Features Applications Manager - The Solution Applications Manager Monitors your entire IT infrastructure including applications, servers, databases, operating
VMware vrealize operations Management Pack FOR. PostgreSQL. User Guide
 VMware vrealize operations Management Pack FOR PostgreSQL User Guide TABLE OF CONTENTS 1. Purpose... 3 2. Introduction to the Management Pack... 3 2.1 How the Management Pack Collects Data... 3 2.2 Data
In the Oracle Database 12c: Performance Management and
 Oracle Uni Contact Us: 08 Oracle Database 12c: Performance Management a Durat5 Da What you will learn In the Oracle Database 12c: Performance Management and analysis and tuning tasks expected of a DBA:
Lassoing the Clouds: Best Practices on AWS. Brian DeShong May 26, 2017
 Lassoing the Clouds: Best Practices on AWS Brian DeShong May 26, 2017 Who am I? Agenda Running web servers Serving static content Security-related concerns Databases Logging Regions + Availability Zones
vrealize Automation Management Pack 2.0 Guide
 vrealize Automation Management Pack 2.0 Guide This document supports the version of each product listed and supports all subsequent versions until the document is replaced by a new edition. To check for
Search Engines and Time Series Databases
 Università degli Studi di Roma Tor Vergata Dipartimento di Ingegneria Civile e Ingegneria Informatica Search Engines and Time Series Databases Corso di Sistemi e Architetture per Big Data A.A. 2017/18
AppDynamics Integration Guide
 AppDynamics Integration Guide AppFirst (http://www.appfirst.com) delivers the only application aware operational intelligence platform that provides organizations with unparalleled visibility into their
Aurora, RDS, or On-Prem, Which is right for you
 Aurora, RDS, or On-Prem, Which is right for you Kathy Gibbs Database Specialist TAM Katgibbs@amazon.com Santa Clara, California April 23th 25th, 2018 Agenda RDS Aurora EC2 On-Premise Wrap-up/Recommendation
Monitoring PostgreSQL At
 Monitoring PostgreSQL At Scale pganalyze Statistics That Matter Two Tables To Remember Breaking Down High-Level Statistics Log Events Worth Knowing Fingerprinting & Tracing Queries Statistics That Matter
Continuous Delivery of Micro Applications with Jenkins, Docker & Kubernetes at Apollo
 Continuous Delivery of Micro Applications with Jenkins, Docker & Kubernetes at Apollo Ulrich Häberlein Team Manager Backend Systems Apollo-Optik Holding GmbH & Co KG Michael Steinfurth Linux / Unix Consultant
VMware vrealize Operations for Horizon Installation
 VMware vrealize Operations for Horizon Installation vrealize Operations for Horizon 6.4 Installation vrealize Operations for Horizon 6.4 This document supports the version of each product listed and supports
Database Visibility. AppDynamics Application Intelligence Platform. Version Page 1
 Database Visibility AppDynamics Application Intelligence Platform Version 4.2.5 Page 1 Database Monitoring............................................................................ 3 Database Monitoring
Design Patterns for the Cloud. MCSN - N. Tonellotto - Distributed Enabling Platforms 68
 Design Patterns for the Cloud 68 based on Amazon Web Services Architecting for the Cloud: Best Practices Jinesh Varia http://media.amazonwebservices.com/aws_cloud_best_practices.pdf 69 Amazon Web Services
Monitoring & Tuning Azure SQL Database
 Monitoring & Tuning Azure SQL Database Dustin Ryan, Data Platform Solution Architect, Microsoft Moderated By: Paresh Motiwala Presenting Sponsors Thank You to Our Presenting Sponsors Empower users with
Pega Predictive Diagnostic Cloud Security
 Pega Predictive Diagnostic Cloud Security A Technical Brief Build for Change Table Of Contents I. Introduction... 3 II. Data Sent to Pega PDC... 3 A. Alerts... 3 B. Parameter Page... 4 C. Database Alerts...
Cloud & container monitoring , Lars Michelsen Check_MK Conference #4
 Cloud & container monitoring 04.05.2018, Lars Michelsen Some cloud definitions Applications Data Runtime Middleware O/S Virtualization Servers Storage Networking Software-as-a-Service (SaaS) Applications
Time Series Live 2017
 1 Time Series Schemas @Percona Live 2017 Who Am I? Chris Larsen Maintainer and author for OpenTSDB since 2013 Software Engineer @ Yahoo Central Monitoring Team Who I m not: A marketer A sales person 2
Self Healing PostgreSQL with Predictive Analysis. - Rajesh Madiwale(Database Consultant)
") Self Healing PostgreSQL with Predictive Analysis - Rajesh Madiwale(Database Consultant) Introduction I am Rajesh Madiwale with 4+ Years of exp on various DB technologies like PostgreSQL,Greenplum,Mongodb,Mysql.
Self Healing PostgreSQL with Predictive Analysis - Rajesh Madiwale(Database Consultant) Introduction I am Rajesh Madiwale with 4+ Years of exp on various DB technologies like PostgreSQL,Greenplum,Mongodb,Mysql.