Survival in schema evolution: putting the lives of survivor and dead tables in counterpoint
|
|
|
- Hortense Parks
- 6 years ago
- Views:
Transcription

1 Survival in schema evolution: putting the lives of survivor and dead tables in counterpoint Panos Vassiliadis, Apostolos Zarras Department of Computer Science and Engineering University of Ioannina, Hellas
2 Why is schema evolution so important? Software and DB maintenance makes up for at least 50% of all resources spent in a project. Databases are rarely stand-alone: typically, an entire ecosystem of applications is structured around them => Changes in the schema can impact a large (typically, not traced) number of surrounding app s, without explicit identification of the impact. Is it possible to design for evolution and minimize the impact of evolution to the surrounding applications? But first, we need to know the patterns of evolution of relational schemata! 2
3 Why aren t we there yet? Historically, nobody from the research community had access + the right to publish to version histories of database schemata Open source tools internally hosting databases have changed this landscape & We are now presented with the opportunity to study the version histories of such open source databases Mind the gap! (15 years) Sjoberg IST 93 ~ ~ Curino+ ICEIS08 Univ. Riverside IWPSE09, ICDEW11 Qiu,Li,Su FSE13 Un. Ioannina CAiSE14, ER15 Cleve+ SCP15 Un. Ioannina CAiSE

4 Our take on the problem To address the quest for finding patterns in the evolution of relational schemata, we have Collected version histories for the schemata of 8 open-source projects CMS s: MediaWiki, TYPO3, Coppermine, phpbb, OpenCart Physics: ATLAS Trigger Biomed: Ensemble, BioSQL Preprocessed them to be parsable by our HECATE schema comparison tool and exported the transitions between each two subsequent versions and measures for them (size, growth, changes) Performed exploratory research where we statistically study / mine these measures, to extract patterns & regularities for the lives of tables Available at: 4
5 Scope of our studies Scope: databases being part of open-source software (and not proprietary ones) long history we work only with changes at the logical schema level (and ignore physical-level changes like index creation or change of storage engine) We encompass datasets with different domains ([A]: physics, [B]: biomedical, [C]: CMS s), amount of growth (shade: high, med, low) & schema size We should be very careful to not overgeneralize findings to proprietary databases or physical schemata! FoSS Dataset ATLAS Trigger [A] Versio ns Lifetime Start End 84 2 Y, 7 M, 2 D BioSQL [B] Y, 6 M, 19 D Coppermine [C] Y, 6 M, 2 D 8 22 Ensembl [B] Y, 3 M, 15 D MediaWiki [C] Y, 10 M, 6 D OpenCart [C] Y, 4 M, 3 D phpbb [C] Y, 7 M, 10 D TYPO3 [C] 97 8 Y, 11 M, 0 D
![What we have found for schema evolution [CAiSE 14, IS 15] Schema growth over time (red](/docs-images/76/74304554/images/6-0.jpg "continuous line) along with the heartbeat of changes (spikes) for two of our datasets.")

6 What we have found for schema evolution [CAiSE 14, IS 15] Schema growth over time (red continuous line) along with the heartbeat of changes (spikes) for two of our datasets. Overlayed darker green rectangles highlight the calmness versions, and lighter blue rectangles highlight smooth expansions. Arrows point at periods of abrupt expansion and circles highlight drops in size. [IS15] 6
7 What we know so far for table evolution [ER 15, IS 17] 7

8 What we don t know yet Although we have fused the discrimination of survivor vs. dead tables in the graphical representations, the 4 patterns do not tell us how do survivors differ from dead tables with respect to the combination of duration and activity profile Also studied [not part of the paper]: year of birth, schema size, schema resizing 8

9 Background Durations study Electrolysis Discussion Compute the histograms of durations for both dead and survivors, and you get OPPOSITE SKEWED DURATIONS 9
, often with very large percentages of them being removed very shortly after birth.")
10 The oppositely skewed durations pattern Histograms for the durations of dead vs. survivor tables The dead tables are strongly biased towards short durations (positively skewed), often with very large percentages of them being removed very shortly after birth. Survivor tables are mostly heavy-tailed at the other end of the spectrum (negatively skewed), i.e., at high (frequently: max) durations. 10

11 Background Durations study Electrolysis Discussion Not only are the durations of dead vs survivors opposite, but also the activity profile is inverse, resulting in ELECTROLYSIS PATTERN FOR TABLE ACTIVITIES 11
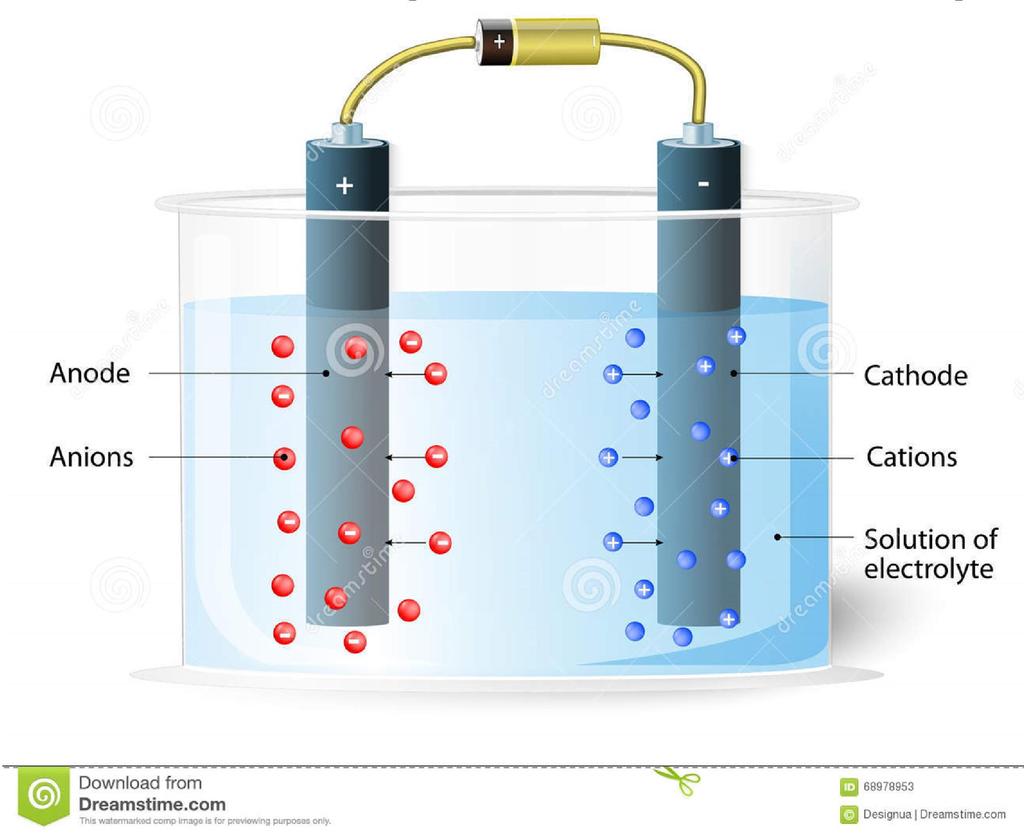
12 Electrolysis in chemistry 12 (C) Designua Dreamstime.com
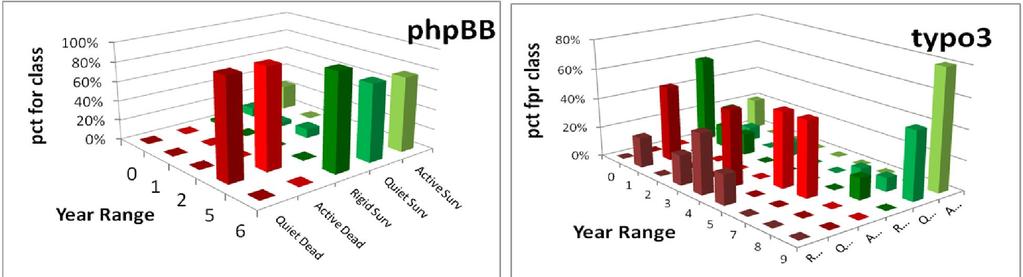
13 Duration is related to the Life & Death Class of the tables! DEAD Rigid Quiet Active Low dur., rigidity High dur., quiet SURVIVORS Rigid Quiet Active (a) Survival: DEAD vs SURVIVORS (b) Activity: Rigid (no change) vs Active (change rate > 10%) vs Quiet (all in between) (c) Life And Death (LAD) class: Survival x Activity

14 Attn: all pct s are per class 14
15 The electrolysis pattern Dead tables demonstrate much shorter lifetimes than survivor ones, can be located at short or medium durations, and practically never at high durations. With few exceptions, the less active dead tables are, the higher the chance to reach shorter durations. Survivors expose the inverse behavior, i.e., mostly located at medium or high durations. The more active survivors are, the stronger they are attracted towards high durations, with a significant such inclination for the few active ones that cluster in very high durations. 15

16 The electrolysis pattern: survivors The extreme clustering of active survivors to high durations The wider spread of (quite numerous) quiet survivors to a large span of durations with long trails of points The clustering of rigid survivors, albeit not just to one, but to all kinds of durations (frequently, not as high as quiet and active survivors) 16

17 The electrolysis pattern: dead The total absence of dead tables from high durations The clustering of rigid dead at low durations, the spread of quiet dead tables to low or medium durations, and the occasional presence of the few active dead, that are found also at low or medium durations, but in a clustered way 17
18 For each data set, for each LifeAndDeath class, percentage of tables per duration range over the total of the data set (for each data set, the sum of all cells adds up to 100%) To probe further (code, data, details, presentations, ) 18
19 Indicative, average values over all datasets: for each LifeAndDeath class, percentage of tables per duration range over the total of the data set An acute reader might express the concern whether it would be better to gather all the tables in one single set and average over them. We disagree: each data set comes with its own requirements, development style, and idiosyncrasy and putting all tables in a single data set, not only scandalously favors large data sets, but integrates different things. We average the behavior of schemata, not tables here. 19
20 electrolysis as a heatmap For each LifeAndDeath value, and for each duration range of 5% of the database lifetime, we computed the percentage of tables (over the total of the data set) whose duration falls within this range. We removed cells that corresponded to only one data set The resulting heatmap shows the polarization in colors: brighter color signifies higher percentage of the population 20
21 Background Durations study Electrolysis Discussion Main Findings Open Issues DISCUSSION & OPEN ISSUES 21
22 Gravitation to Rigidity Although the majority of survivor tables are in the quiet class, we can quite emphatically say that it is the absence of evolution that dominates! Survivors vastly outnumber removed tables. Similarly, rigid tables outnumber the active ones, both in the survival and, in particular, in the dead class. Schema size is rarely resized, and only in survivors (not in the paper). Active tables are few and do not seem to be born in other but early phases of the database lifetime. Evidently, not only survival is also stronger than removal, but rigidity is also stronger a force than variability and the combination of the two forces further lowers the amount of change in the life of a database schema. 22
23 Gravitation to rigidity: death Why dead tables have short durations and die mostly rigid? We believe its due to the cost that deletions have for the maintenance of the software that surrounds the database. The earlier a table is removed, the smaller the cost of maintaining the surrounding code is. If the table starts being used by queries spread in the code, the cost to to locate, maintain and test the application code that uses it is high. 23
24 Gravitation to rigidity: life Who survives? Why do survivors last long? Due to the reluctance for removals, it appears that after a certain period, practically within 10%-20% of the databases lifetime, tables begin to be safe add to this that the starting versions of the database already include a large percentage of the overall population of tables and you get a right-heavy, left-tailed, negatively skewed distribution of survivor tables (for 6 out of 8 data sets, survivor durations reaching the final bucket of the respective histogram exceed 45%). 24
25 Gravitation to rigidity: life Tables with high durations that survive spend their lives mostly quietly (with the few occasional maintenance changes) again minimizing the impact to the surrounding code. The high concentration of the few active tables to very high durations and survival is related to the gravitation to rigidity: the early phases of the database lifetime typically include more table births after the development of a substantial amount of code, too high rate of updates becomes harder; this results in very low numbers of active tables being born later. So, the pattern should not be read so much as active tables are born early, but rather as we do not see so many active tables being born in late phases of the database life. 25
26 Activity & Duration Rigid tables find it hard to attain high durations (unless found in an environment of low change activity). Shortly after there are born, they are in the high-risk group of being removed. Rigid tables have the highest migration probability (a single upd => quiet). Long duration and high activity are also correlated Long duration is practically a pre-requisite of high activity (very rare exceptions) Lack of late born active tables explains the long duration of the few active ones 26
27 Risks for developers Young rigid tables are the high risk group for being removed Tables mostly survive; when they don t, tables typically die shortly after their birth and quite often, rigid If a table surpasses infant mortality it will likely survive to live a rigid or, more commonly, a quiet live. There is a small group of active tables, going through significant updates. Look for them in the early born, survivors. Soon after a table is born, the development of code that depends on it should be kept as restrained as possible After the period of infant mortality, it is fairly safe to say that (unless the table shows signs of significant update activity), gravitation to rigidity enters the stage and the table s evolution will be low. 27
28 Future work Related literature suggests that database evolution cools down after the first versions. Is it true? Collect posted comments and expressed user requirements at the public repositories and try to figure out why change is happening the way it does. Automating this effort is a very ambitious goal in this context. Finally, the validation of existing research results with more studies from other groups, different software tools, hopefully extending the set of studied data sets, is imperative to allow us progressively to move towards `laws' rather than `patterns of change in the field of understanding schema evolution. 28
 and quietly active are radically different than dead tables, being mostly short-lived and rigid! Gravitation to rigidity rules: we see more absence than presence of schema evolution!")
29 Danke schön! Thank you! Yes, we can indeed find patterns in the lives of tables, during schema evolution! Survivors, mostly long-lived (esp. active ones) and quietly active are radically different than dead tables, being mostly short-lived and rigid! Gravitation to rigidity rules: we see more absence than presence of schema evolution! To probe further (code, data, details, presentations, ) 29
30 AUXILIARY SLIDES 30
31 What are the laws of database (schema) evolution? How do databases change? In particular, how does the schema of a database evolve over time? Long term research goals: Are there any invariant properties (e.g., patterns of repeating behavior) on the way database (schemata) change? Is there a theory / model to explain them? Can we exploit findings to engineer data-intensive ecosystems that withstand change gracefully? 31
32 Why care for the laws /patterns of schema evolution? Scientific curiosity! Practical Impact: DB s are dependency magnets. Applications have to conform to the structure of the db typically, development waits till the db backbone is stable and applications are build on top of it slight changes to the structure of a db can cause several (parts of) different applications to crash, causing the need for emergency repairing 32


33 Abstract coupling example from my SW Dev course Interface as a contract Specification Implementation Client class Factory as a bridge Service providers 33

34 Hecate: SQL schema diff extractor 34
35 Hecate: SQL schema diff extractor Parses DDL files Creates a model for the parsed SQL elements Compares two versions of the same schema Reports on the diff performed with a variety of metrics Exports the transitions that occurred in XML format 35
36 SCOPE OF THE STUDY && VALIDITY CONSIDERATIONS 36
37 Data sets Dataset Versi ons Lifetime Table s Start Table s End Attribut es Start Attribut es End Commit s per Day % commits with change Repository URL ATLAS Trigger 84 2 Y, 7 M, 2 D ,089 82% BioSQL Y, 6 M, 19 D ,012 63% Coppermine Y, 6 M, 2 D ,038 50% Ensembl Y, 3 M, 15 D ,109 60% MediaWiki Y, 10 M, 6 D ,100 59% tenance/tables.sql?view=log OpenCart Y, 4 M, 3 D ,104 47% phpbb Y, 7 M, 10 D ,055 82% all/opencart.sql schemas/mysql_41_schema.sql TYPO Y, 11 M, 0 D ,030 76% bined_schema.sql x/sql/schema.sql
38 Scope of the study Scope: databases being part of open-source software (and not proprietary ones) long history we work only with changes at the logical schema level (and ignore physical-level changes like index creation or change of storage engine) We encompass datasets with different domains ([A]: physics, [B]: biomedical, [C]: CMS s), amount of growth (shade: high, med, low) & schema size We should be very careful to not overgeneralize findings to proprietary databases or physical schemata! FoSS Dataset ATLAS Trigger [A] Versio ns Lifetime Start End 84 2 Y, 7 M, 2 D BioSQL [B] Y, 6 M, 19 D Coppermine [C] Y, 6 M, 2 D 8 22 Ensembl [B] Y, 3 M, 15 D MediaWiki [C] Y, 10 M, 6 D OpenCart [C] Y, 4 M, 3 D phpbb [C] Y, 7 M, 10 D TYPO3 [C] 97 8 Y, 11 M, 0 D
39 Measures and Terminology SurvivalClass: this measure classifies a tables as (a) a survivor table (with the value of 20 in our data) if the table has survived (i.e., was present at the last known version of the database schema) or (b)a dead table (with the value of 10 in our data), if its last known version is prior to the last known version of the schema history. ATU: Average Transitional amount of Updates is the ratio SumUpd / Duration ActivityClass: characterization of how active a table is. Takes the value 0 for rigid tables that go through zero updates in their life, 2 for active tables, having ATU larger than 0.1 and sumupd larger than 5 (see [ER 2015]), and 1 for the rest of the tables, characterized as quiet tables. LifeAndDeath Class: the Cartesian product of the measures SurvivorClass and ActivityClass. The LifeAndDeath Class characterizes a table both with respect to its survival and to its update profile during its lifetime. The measure s domain includes six values produced by the combination of {dead, survivor} x {rigid, quiet, active} (and conveniently computed as the sum SurvivorClass + ActivityClass in our data). 39
40 External validity Can we generalize out findings broadly? We perform an exploratory study to observe frequently occurring phenomena within the scope of the aforementioned population Are our data sets representative enough? Is it possible that the observed behaviors are caused by sui-generis characteristics of the studied data sets? Yes: we believe we have a good population definition & we abide by it Yes: we believe we have a large number of databases, from a variety of domains with different profiles, that seem to give fairly consistent answers to our research questions (behavior deviations are mostly related to the maturity of the database and not to its application area). Yes: we believe we have a good data extraction and measurement process without interference / selection / of the input from our part Maybe: unclear when the number of studied databases is large enough to declare the general application of a pattern as universal. 40
41 External validity Can we generalize out findings broadly? Understanding the represented population Precision: all our data sets belong to the specified population Definition Completeness: no missing property that we knowledgably omit to report FoSS has an inherent way of maintenance and evolution Representativeness of selected datasets Data sets come from 3 categories of FoSS (CMS / Biomedical / Physics) They have different size and growth volumes Results are fairly consistent both in our ER 15 and our CAiSE 14 papers Treatment of data We have tested our Delta Extractor, Hecate, to parse the input correctly & adapted it during its development; the parser is not a full-blown SQL parser, but robust to ignore parts unknown to it A handful of cases where adapted in the Coppermine to avoid overcomplicating the parser; not a serious threat to validity ; other than that we have not interfered with the input Fully automated counting for the measures via Hecate 41
 http://www.cs.uoi.gr/~pvassil/projects/schemabiographies 42 https://github.")
42 Most importantly: we are happy to invite you to reuse /test /assess /disprove / all our code, data and results! To probe further (code, data, results, )
43 Internal validity Can we confirm statements A=>B? No! Are there any spurious relationships? Maybe! Internal validity concerns the accuracy of causeeffect statements: change in A => change in B We are very careful to avoid making strong causation statements! In some places, we just hint that we suspect the causes for a particular phenomenon, in some places in the text, but we have no data, yet, to verify our gutfeeling. And yes, it is quite possible that our correlations hide cofounding variables. 43
44 Is there a theory? Our study should be regarded as a pattern observer, rather than as a collection of laws, coming with their internal mechanics and architecture. It will take too many studies (to enlarge the representativeness even more) and more controlled experiments (in-depth excavation of cause-effect relationships) to produce a solid theory. It would be highly desirable if a clear set of requirements on the population definition, the breadth of study and the experimental protocol could be solidified by the scientific community (like e.g., the TREC benchmarks) and of course, there might be other suggestions on how to proceed 44
45 RELATED WORK 45
46 Why aren t we there yet? Historically, nobody from the research community had access + the right to publish to version histories of database schemata Open source tools internally hosting databases have changed this landscape: not only is the code available, but also, public repositories (git, svn, ) keep the entire history of revisions We are now presented with the opportunity to study the version histories of such open source databases 46
47 Timeline of empirical studies Sjoberg IST 93 ~ ~ Curino+ ICEIS08 Univ. Riverside IWPSE09, ICDEW11 Qiu,Li,Su FSE13 Un. Ioannina CAiSE14, ER15 Cleve+ SCP15 Un. Ioannina CAiSE Long v. IS 15 Long v. IS
48 Timeline of empirical studies IST 93: 18 months study of a health system. 139% increase of #tables ; 274% increase of the #attributes Changes in the code (on avg): relation addition: 19 changes ; attribute additions: 2 changes relation deletion : 59.5 changes; attribute deletions: 3.25 changes An inflating period during construction where almost all changes were additions, and a subsequent period where additions and deletions where balanced. Sjoberg IST 93 ~ ~ Curino+ ICEIS08 Univ. Riverside IWPSE09, ICDEW11 Qiu,Li,Su FSE13 Un. Ioannina CAiSE14, ER15 Cleve+ SCP15 Un. Ioannina CAiSE
49 Timeline of empirical studies ICEIS08: Mediawiki for 4.5 years 100% increase in the number of tables 142% in the number of attributes. 45% of changes do not affect the information capacity of the schema (but are rather index adjustments, documentation, etc) Sjoberg IST 93 ~ ~ Curino+ ICEIS08 Univ. Riverside IWPSE09, ICDEW11 Qiu,Li,Su FSE13 Un. Ioannina CAiSE14, ER15 Cleve+ SCP15 Un. Ioannina CAiSE
50 Timeline of empirical studies IWPSE09: Mozilla and Monotone (a version control system) Many ways to be out of synch between code and evolving db schema ICDEW11: Firefox, Monotone, Biblioteq (catalogue man.), Vienna (RSS) Similar pct of changes with previous work Frequency and timing analysis: db schemata tend to stabilize over time, as there is more change at the beginning of their history, but seem to converge to a relatively fixed structure later Sjoberg IST 93 ~ ~ Curino+ ICEIS08 Univ. Riverside IWPSE09, ICDEW11 Qiu,Li,Su FSE13 Un. Ioannina CAiSE14, ER15 Cleve+ SCP15 Un. Ioannina CAiSE
51 Timeline of empirical studies FSE 2013: 10 (!) database schemata studied. Change is focused both (a) with respect to time and (b) with respect to the tables who change. Timing: 7 out of 10 databases reached 60% of their schema size within 20% of their early lifetime. Change is frequent in the early stages of the databases, with inflationary characteristics; then, the schema evolution process calms down. Tables that change: 40% of tables do not undergo any change at all, and 60%- 90% of changes pertain to 20% of the tables (in other words, 80% of the tables live quiet lives). The most frequently modified tables attract 80% of the changes. Sjoberg IST 93 ~ ~ Curino+ ICEIS08 Univ. Riverside IWPSE09, ICDEW11 Qiu,Li,Su FSE13 Un. Ioannina CAiSE14, ER15 Cleve+ SCP15 Un. Ioannina CAiSE
52 Timeline of empirical studies FSE 2013: Code and db co-evolution, not always in synch. Code and db changed in the same revision: 50.67% occasions Code change was in a previous/subsequent version than the one where the database schema change: 16.22% of occasions database changes not followed by code adaptation: 21.62% of occasions 11.49% of code changes were unrelated to the database evolution. Each atomic change at the schema level is estimated to result in lines of application code been updated; A valid db revision results in lines of application code being updated Sjoberg IST 93 ~ ~ Curino+ ICEIS08 Univ. Riverside IWPSE09, ICDEW11 Qiu,Li,Su FSE13 Un. Ioannina CAiSE14, ER15 Cleve+ SCP15 Un. Ioannina CAiSE
53 Timeline of empirical studies CAiSE14: DB level ER 15: Table level Sjoberg IST 93 ~ ~ Curino+ ICEIS08 Univ. Riverside IWPSE09, ICDEW11 Qiu,Li,Su FSE13 Un. Ioannina CAiSE14, ER15 Cleve+ SCP15 Un. Ioannina CAiSE
54 Timeline of empirical studies Cleve+ Science Comp. Progr. 2015: Oscar, an open source electronic medical record system schema grows over time deletions are rare change is infrequent: most tables have less than 4 changes Sjoberg IST 93 ~ ~ Curino+ ICEIS08 Univ. Riverside IWPSE09, ICDEW11 Qiu,Li,Su FSE13 Un. Ioannina CAiSE14, ER15 Cleve+ SCP15 Un. Ioannina CAiSE Long v. IS 15 Long v. IS
55 CAISE 14 / INF. SYSTEMS 15 55
56 Datasets Content management Systems MediaWiki, TYPO3, Coppermine, phpbb, OpenCart Medical Databases Ensemble, BioSQL Scientific ATLAS Trigger 56
57 Schema Size (relations)
58 CaiSE 14: Main results Schema size (#tables, #attributes) supports the assumption of a feedback mechanism Schema size grows over time; not continuously, but with bursts of concentrated effort Drops in schema size signifies the existence of perfective maintenance Regressive formula for size estimation holds, with a quite short memory Schema Growth (diff in size between subsequent versions) is small!! Growth is small, smaller than in typical software The number of changes for each evolution step follows Zipf s law around zero Average growth is close (slightly higher) to zero Patterns of change: no consistently constant behavior Changes reduce in density as databases age Grey for results requiring further search Change follows three patterns: Stillness, Abrupt change (up or down), Smooth growth upwards Change frequently follows spike patterns Complexity does not increase with age 58
59 What we have found for schema evolution [CAiSE 14, IS 15] Schemata grow over time in order to satisfy new requirements, albeit not in a continuous or linear fashion, but rather, with bursts of concentrated effort interrupting longer periods of calmness. Growth is small, with average growth being close to zero. Growth comes with drops in schema size that signify the existence of perfective maintenance. 59
60 Schema Growth (diff in #tables)
61 Change over time
62 ER 2015 / IS
 http://www.cs.uoi.")
63 To probe further (code, data, details, presentations, ) 63
64 Statistical study of durations Short and long lived tables are practically equally proportioned Medium size durations are fewer than the rest! Long lived tables are mostly survivors (see on the right) One of the fascinating revelations of this measurement was that there is a 26.11% fraction of tables that appeared in the beginning of the database and survived until the end. In fact, if a table is long-lived there is a 70% chance (188 over 269 occasions) that it has appeared in the beginning of the database. 64
65 Tables are mostly thin On average, half of the tables (approx. 47%) are thin tables with less than 5 attributes. The tables with 5 to 10 attributes are approximately one third of the tables' population The large tables with more than 10 attributes are approximately 17% of the tables. 65
66 THE FOUR PATTERNS 66

 that occur frequently in our data sets Highlights 4")
67 Exploratory search of the schema Input: schema histories from github/sourceforge/ Raw material: details and stats on each table s life, as produced by our diff extractor, for all the 8 datasets histories for patterns Output: properties & patterns on table properties (birth, duration, amt of change, ) that occur frequently in our data sets Highlights 4 patterns of evolution 67
68 What we know so far for table evolution [ER 15, IS 17] The Γ pattern indicates that tables with large schemata tend to have long durations and avoid removal; The Comet pattern indicates that the tables with most updates are frequently the ones with medium schema size; The Inverse Γ pattern indicates that tables with medium or small durations produce amounts of updates lower than expected, whereas tables with long duration expose all sorts of update behavior. The Empty Triangle pattern indicates a significant absence of tables of medium or long durations that were removed thus, an empty triangle signifying mainly short lives for deleted tables and low probability of deletion for old timers. 68
69 -Statistical properties for schema size, change and duration of tables - How are these measures interrelated? SCHEMA SIZE, CHANGE AND DURATION 69
70 The Gamma Pattern: "if you 're wide, you survive" The Gamma phenomenon: tables with small schema sizes can have arbitrary durations, //small size does not determine duration larger size tables last long Observations: whenever a table exceeds the critical value of 10 attributes in its schema, its chances of surviving are high. in most cases, the large tables are created early on and are not deleted afterwards. 70
71 Exceptions - Biosql: nobody exceeds 10 attributes - Ensembl, mwiki: very few exceed 10 attributes, 3 of them died - typo: has many late born survivors 71
72 The Comet Pattern Comet for change over schema size with: a large, dense, nucleus cluster close to the beginning of the axes, denoting small size and small amount of change, medium schema size tables typically demonstrating medium to large change The tables with the largest amount of change are typically tables whose schema is on average one standard deviation above the mean wide tables with large schema sizes demonstrating small to medium (typically around the middle of the y- axis) amount of change. 72
73 73
74 The inverse Gamma pattern The correlation of change and duration is as follows: small durations come necessarily with small change, large durations come with all kinds of change activity and medium sized durations come mostly with small change activity (Inverse Gamma). 74
75 75
76 Who are the top changers? Who are removed at some point of time? How do removals take place? BIRTHDAY & SCHEMA SIZE & MATTERS OF LIFE AND DEATH 76
77 Quiet tables rule, esp. for mature db s Non-survivors Sudden deaths mostly Quiet come ~ close Too few active Survivors Quiet tables rule Rigid and active then Active mostly in new db s Mature DB s: the pct of active tables drops significantly 77
78 Deleted tables are born early & last short Empty space: high change rates are only for early born & long lived Too many top changers are born early Top changers live long Birth rate drops over time Longevity and update activity correlate!! The few top-changers (in terms of avg trans. update ATU) are long lived, typically come from the early versions of the database due to the combination of high ATU and duration => they have high total amount of updates, and, frequently survive! 78
79 Deleted tables last short & do not change a lot Deleted tables are born early & last short Empty space: high change rates are only for early born & long lived An empty triangle: no deleted tables with large or even modest durations Die young and suddenly There is a very large concentration of the deleted tables in a small range of newly born, quickly removed, with few or no updates. resulting in very low numbers of removed tables with medium or long durations (empty triangle). 79
80 Too rare to see deletions! High durations are overwhelmingly blue! Only a couple of deletions are seen here! Survive long enough & you re probably safe It is quite rare to see tables being removed at old age Typically, the area of high duration is overwhelmingly inhabited by survivors (although each data set comes with a few such cases )! 80
81 Deleted tables last short & do not change a lot Deleted tables are born early & last short Few short lived tables are born and die in the mature life of the db Die young and suddenly [Early life of the db] There is a very large concentration of the deleted tables in a small range of newly born, quickly removed, with few or no updates, resulting in very low numbers of removed tables with medium or long durations. [Mature db] After the early stages of the databases, we see the birth of tables who eventually get deleted, but they mostly come with very small durations and sudden deaths. 81
82 82
83 Schema birth / duration Only the thin die young, all the wide ones seem to live forever THE GAMMA PATTERN

84 Exceptions - Biosql: nobody exceeds 10 attributes - Ensembl, mwiki: very few exceed 10 attributes, 3 of them died - typo: has many late born survivors 84
85 Stats on wide tables and their survival Definitions: Wide schema: strictly above 10 attributes. The top band of durations (the upper part of the Gamma shape): the upper 10% of the values in the y-axis. Early born table: ts birth version is in the lowest 33% of versions; Late-comers: born after the 77% of the number of versions.
86 Whenever a table is wide, its chances of surviving are high Apart from mwiki and ensembl, all the rest of the data sets confirm the hypothesis with a percentage higher than 85%. The two exceptions are as high as 50% for their support to the hypothesis.
87 Wide tables are frequently created early on and are not deleted afterwards Early born, wide, survivor tables (as a percentage over the set of wide tables). - in half the data sets the percentage is above 70% - in two of them the percentage of these tables is one third of the wide tables.
88 Whenever a table is wide, its duration frequently lies within the top-band of durations (upper part of Gamma) What is probability that a wide table belongs to the upper part of the Gamma? - there is a very strong correlation between the two last columns: the Pearson correlation is 88% overall; 100% for the datasets with high pct of early born wide tables. - - Bipolarity on this pattern: half the cases support the pattern with support higher than 70%, whereas the rest of the cases clearly disprove it, with very low support values.
89 Long-lived & wide => early born and survivor Subset relationship In all data sets, if a wide table has a long duration within the upper part of the Gamma, this deterministically (100% of all data sets) signifies that the table was also early born and survivor. If a wide table is in the top of the Gamma line, it is deterministically an early born survivor.
90 THE COMET PATTERN Schema size and updates

91 91
92 Statistics of schema size at birth and sum of updates
93 Typically: ~70% of tables inside the box Typically, around 70% of the tables of a database is found within the 10x10 box of schemasize@birth x sumofupdates (10 excluded in both axes).
94 Top changers tend to have medium schema sizes For every dataset: we selected the top 5% of tables in terms of this sum of updates and we averaged the schema size at birth of these top 5% tables.
95 Top changers tend to have medium schema sizes The average schema size for the top 5% of tables in terms of their update behavior is close to one standard deviation up from the average value of the schema size at birth(i.e., very close to $mu$+$sigma$). //except phpbb
96 Top changers tend to have medium schema sizes - In 5 out of 8 cases, the average schema size of top-changers within 0.4 and 0.5 of the maximum value (practically the middle of the domain) and never above 0.65 of it. - Pearson: the maximum value, the standard deviation of the entire data set and the average of the top changers are very strongly correlated.
97 Wide tables have a medium number of updates For each data set, we took the top 5% in terms of schema size at birth (top wide) and contrasted their update behavior wrt the update behavior of the entire data set. Typically, the avg. number of updates of the top wide tables is close to the 50% of the domain of values for the sum of updates (i.e., the middle of the y-axis of the comet figure, measuring the sum of updates for each table). This is mainly due to the (very) large standard deviation (twice the mean), rather than the -- typically low -- mean value (due to the large part of the population living quiet lives).
98 INVERSE GAMMA
99 99
100 Skyline & Avg for Inverse Gamma
101 THE EMPTY TRIANGLE PATTERN 101
102 102
103 Top changers: early born, survivors, often with long durations, and often all the above In all data sets, active tables are born early with percentages that exceed 75% With the exceptions of two data sets, they survive with percentage higher than 70%. The probability of having a long duration is higher than 50% in 6 out of 8 data sets. Interestingly, the two last lines are exactly the same sets of tables in all data sets! An active table with long duration has been born early and survived with prob. 100% An active, survivor table that has a long duration has been born early with prob. 100% 103
104 Dead are: quiet, early born, short lived, and quite often all three of them 104

105 Most births &deaths occur early (usually)
106 Deleted tables are born early & last short Too many top changers are born early Top changers live long Birth rate drops over time Longevity and update activity correlate!! Remember: top changers are defined as such wrt ATU (AvgTrxnUpdate), not wrt sum(changes) Still, they dominate the sum(updates) too! (see top of inverse ) See also upper right blue part of diagonal: too many of them are born early and survive => live long! 106
107 Deleted tables last short & do not change a lot Deleted tables are born early & last short Empty space: high change rates are only for early born & long lived Top changers live long Top changers are born early An empty triangle: no deleted tables with large or even modest durations Birth rate drops over time All in one Early stages of the database life are more "active" in terms of births, deaths and updates, and have higher chances of producing deleted tables. After the first major restructuring, the database continues to grow; however, we see much less removals, and maintenance activity becomes more concentrated and focused. 107
108 CAISE
109 Why do we see what we see We believe that this study strengthens our theory that schema evolution antagonizes a powerful gravitation to rigidity. DB s = dependency magnets all the application code relies on them but not vice versa, => avoiding schema evolution reduces the need for adaptation and maintenance of application code 109
110
111 111
112 DEAD Rigid Quiet Active Low dur., rigidity High dur., quiet SURVIVORS Rigid Quiet Active
113
114 The data to support the pattern We have performed an in-depth study of how tables are distributed in different durations. To group durations, we have split the duration of each schema lifetime into periods of 5%. Then, for each LifeAndDeath value, and for each duration range of 5% of the database lifetime, we computed the percentage of tables whose duration falls within this range. 114

115 electrolysis as a heatmap For each LifeAndDeath value, and for each duration range of 5% of the database lifetime, we computed the percentage of tables (over the total of the data set) whose duration falls within this range. We removed cells that corresponded to only one data set The resulting heatmap shows the polarization in colors: brighter color signifies higher percentage of the population 115
")
116 For each data set, for each LifeAndDeath class, percentage of tables per duration range over the total of the data set (for each data set, the sum of all cells adds up to 100%) 116

117 Indicative, average values over all datasets: for each LifeAndDeath class, percentage of tables per duration range over the total of the data set An acute reader might express the concern whether it would be better to gather all the tables in one single set and average over them. We disagree: each data set comes with its own requirements, development style, and idiosyncrasy and putting all tables in a single data set, not only scandalously favors large data sets, but integrates different things. We average the behavior of schemata, not tables here. 117
118 Do certain LifeAndDeath classes have high concentrations in particular data ranges? The following tables are important. Many findings for survivor tables refer to it. 118
")
119 For each data set, for each LifeAndDeath class, percentage of tables per duration range over the total of their Life&Death class (for each data set, for each column, percentages add up to 100%) 119
 An acute reader might express the concern whether it would be better to gather all the tables in one single set and average over them.")
120 Average values over all datasets: for each LifeAndDeath class, percentage of tables per duration range over the total of their LifeAndDeath class (for each data set, for each column, percentages add up to 100%) An acute reader might express the concern whether it would be better to gather all the tables in one single set and average over them. We disagree: each data set comes with its own requirements, development style, and idiosyncrasy and putting all tables in a single data set, not only scandalously favors large data sets, but integrates different things. We average the behavior of schemata, not tables here. 120
121 What is the distribution of tables per activity class for the dead tables that have durations less than the 20% of the database s life? What is the distribution of tables per activity class for the survivor tables that have durations longer than the 80% of the database s life? The following table is important. Many findings for dead tables refer to it. 121
122 Zoom into low 20% of durations for the dead and upper 20% for the survivors We count the number of tables, per LifeAndDeath class, for the respective critical duration range, and we compute the fraction of this value over the total number of tables pertaining to this LifeAndDeath class (columns Rigid, Quiet, Active). For the Dead and Surv columns, we divide the total number of dead/survivor tables belonging to the respective critical duration over the total number of dead/survivor tables overall. 122
123 In more than half of the cells of the table, the percentage reaches or exceeds 50% We count the number of tables, per LifeAndDeath class, for the respective critical duration range, and we compute the fraction of this value over the total number of tables pertaining to this LifeAndDeath class (columns Rigid, Quiet, Active). For the Dead and Surv columns, we divide the total number of dead/survivor tables belonging to the respective critical duration over the total number of dead/survivor tables overall. 123
124 Dead Tables All kinds of dead tables are strongly inclined (a) to rigidity, and (b) to small durations. The less active tables are the more they are attracted to short durations. The attraction of dead tables, especially rigid ones, to (primarily) low or, (secondarily) medium durations is significant and only few tables in the class of dead tables escape this rule. Interestingly, in all our datasets, the only dead tables that escape the barrier of low and medium durations are a single table in mediawiki, another one in typo3, and the 4 of the 5 tables that are simultaneously deleted in phpbb. 124
125 Dead tables 1. Rigid dead tables, which is the most populated category of dead tables, strongly cluster in the area of low durations (lower than the 20% of the database lifetime) with percentages of 90% 100% in 3 of the 6 data sets 2. Quiet dead tables, which is a category including few tables, are mostly oriented towards low durations. Specifically, there are 5 data sets with a high concentration of tables in the area of low durations; for the rest, the majority of quiet dead tables lie elsewhere 3. The very few active dead, have mixed behaviors. 125
126 Survivor tables It is extremely surprising that, the vast majority of active survivors exceed 80% of the database lifetime in all datasets. With the exception of three data sets in the range of 67%- 75%, the percentage of active survivors that exceeds 80% of the db lifetime exceeds 80%, and even attains totality in 2 cases. Active survivor tables are not too many; however, it is amazing how long they live. If one looks into the detailed data and in synch with the empty triangle pattern of [IS16], the top changers are very often of maximum duration, i.e., early born and survivors. This should be read as: no top-changer tables are born later!
127 Survivor tables Rigid survivors demonstrate a large variety of behaviors. Quiet survivors, being the (sometimes vast) majority of survivor tables, are mostly gravitated towards large durations, and secondarily to medium ones. In 6 out of 8 data sets, the percentage of quiet survivors that exceeds 80% of db lifetime surpasses 50%. In the two exceptions, medium durations is the largest subgroup of quiet survivors. Still, quiet survivors also demonstrate short durations too, so overall, their span of possible durations is large. Notably, in all data sets, there are quiet survivors reaching maximum duration. 127
128 Unexplored research territory (risky but possibly rewarding) Weather Forecast: given the history and the state of a database, predict subsequent events Risky: frequently, changes come due to an external, changing world and have thematic affinity. Big & small steps in many directions needed (more data sets, studies with high internal validity to find causations, more events to capture, ) Engineer for evolution: To absorb change gracefully we can try to (i) alter db design and DDL; (ii) encapsulate the database via a stable API; To probe further (code, data, details, presentations, ) 128
 our human-made calculations.")
129 Threats To Validity With respect to the measurement validity of our work, we have tested (i) our automatic extraction tool, Hecate, for the accuracy of its automatic extraction of delta's and measures, and (ii) our human-made calculations. The external validity of our study is supported by several strong statements: we have chosen data sets with fairly long histories of versions, a variety of domains (CMS's and scientific systems), a variety in the number of their commits (from 46 to 528), and, a variety of schema sizes (from 23 to 114 at the end of the study); We have also been steadily attentive to work only with phenomena that are common to all the data sets. Do not to interpret our findings as laws (that would need confirmation of our results by other research groups), but rather as patterns. 129
How is Life for a Table in an Evolving Relational Schema? Birth, Death & Everything in Between
 This work was partially supported from the European Community's FP7/2007-2013 under grant agreement number 257178 (project CHOReOS). How is Life for a Table in an Evolving Relational Schema? Birth, Death
Survival in schema evolution: putting the lives of survivor and dead tables in counterpoint
 Survival in schema evolution: putting the lives of survivor and dead tables in counterpoint Panos Vassiliadis and Apostolos V. Zarras Department of Computer Science and Engineering, University of Ioannina,
Gravitating to Rigidity: Patterns of Schema Evolution -and its Absence- in the Lives of Tables
 Gravitating to Rigidity: Patterns of Schema Evolution -and its Absence- in the Lives of Tables Panos Vassiliadis a, Apostolos V. Zarras a, Ioannis Skoulis b,1 a University of Ioannina, Ioannina, Hellas
Schema Evolution Survival Guide for Tables: Avoid Rigid Childhood and You re En Route to a Quiet Life
 Noname manuscript No. (will be inserted by the editor) Schema Evolution Survival Guide for Tables: Avoid Rigid Childhood and You re En Route to a Quiet Life Panos Vassiliadis Apostolos V. Zarras This is
Open-Source Databases: Within, Outside, or Beyond Lehman's Laws of Software Evolution?
 This research has been co-financed by the European Union (European Social Fund - ESF) and Greek national funds through the Operational Program "Education and Lifelong Learning" of the National Strategic
3 Graphical Displays of Data
 3 Graphical Displays of Data Reading: SW Chapter 2, Sections 1-6 Summarizing and Displaying Qualitative Data The data below are from a study of thyroid cancer, using NMTR data. The investigators looked
Growing up with Stability: how Open-Source Relational Databases Evolve
 Growing up with Stability: how Open-Source Relational Databases Evolve Ioannis Skoulis a,1, Panos Vassiliadis b, Apostolos V. Zarras b a Opera, Helsinki, Finland b University of Ioannina, Ioannina, Hellas
DB2 is a complex system, with a major impact upon your processing environment. There are substantial performance and instrumentation changes in
 DB2 is a complex system, with a major impact upon your processing environment. There are substantial performance and instrumentation changes in versions 8 and 9. that must be used to measure, evaluate,
The Attraction of Complexity
 The Attraction of Complexity Carlo Bottiglieri December 10, 2017 1 Introduction How is complexity distributed through a codebase? Does this distribution present similarities across different projects?
Categorizing Migrations
 What to Migrate? Categorizing Migrations A version control repository contains two distinct types of data. The first type of data is the actual content of the directories and files themselves which are
Open-Source Databases: Within, Outside, or Beyond Lehman s Laws of Software Evolution?
 Open-Source Databases: Within, Outside, or Beyond Lehman s Laws of Software Evolution? Ioannis Skoulis, Panos Vassiliadis, and Apostolos Zarras Dept. of Computer Science and Engineering University of Ioannina
SQL Tuning Reading Recent Data Fast
 SQL Tuning Reading Recent Data Fast Dan Tow singingsql.com Introduction Time is the key to SQL tuning, in two respects: Query execution time is the key measure of a tuned query, the only measure that matters
Graph Structure Over Time
 Graph Structure Over Time Observing how time alters the structure of the IEEE data set Priti Kumar Computer Science Rensselaer Polytechnic Institute Troy, NY Kumarp3@rpi.edu Abstract This paper examines
Further Maths Notes. Common Mistakes. Read the bold words in the exam! Always check data entry. Write equations in terms of variables
 Further Maths Notes Common Mistakes Read the bold words in the exam! Always check data entry Remember to interpret data with the multipliers specified (e.g. in thousands) Write equations in terms of variables
Chapter 2 Basic Structure of High-Dimensional Spaces
 Chapter 2 Basic Structure of High-Dimensional Spaces Data is naturally represented geometrically by associating each record with a point in the space spanned by the attributes. This idea, although simple,
Character Recognition
 Character Recognition 5.1 INTRODUCTION Recognition is one of the important steps in image processing. There are different methods such as Histogram method, Hough transformation, Neural computing approaches
Chapter 6: DESCRIPTIVE STATISTICS
 Chapter 6: DESCRIPTIVE STATISTICS Random Sampling Numerical Summaries Stem-n-Leaf plots Histograms, and Box plots Time Sequence Plots Normal Probability Plots Sections 6-1 to 6-5, and 6-7 Random Sampling
3 Graphical Displays of Data
 3 Graphical Displays of Data Reading: SW Chapter 2, Sections 1-6 Summarizing and Displaying Qualitative Data The data below are from a study of thyroid cancer, using NMTR data. The investigators looked
D-Optimal Designs. Chapter 888. Introduction. D-Optimal Design Overview
 Chapter 888 Introduction This procedure generates D-optimal designs for multi-factor experiments with both quantitative and qualitative factors. The factors can have a mixed number of levels. For example,
Basic features. Adding audio files and tracks
 Audio in Pictures to Exe Introduction In the past the conventional wisdom was that you needed a separate audio editing program to produce the soundtrack for an AV sequence. However I believe that PTE (Pictures
Downloaded from
 UNIT 2 WHAT IS STATISTICS? Researchers deal with a large amount of data and have to draw dependable conclusions on the basis of data collected for the purpose. Statistics help the researchers in making
Chapter 3 Analyzing Normal Quantitative Data
 Chapter 3 Analyzing Normal Quantitative Data Introduction: In chapters 1 and 2, we focused on analyzing categorical data and exploring relationships between categorical data sets. We will now be doing
Prepare a stem-and-leaf graph for the following data. In your final display, you should arrange the leaves for each stem in increasing order.
 Chapter 2 2.1 Descriptive Statistics A stem-and-leaf graph, also called a stemplot, allows for a nice overview of quantitative data without losing information on individual observations. It can be a good
Math 120 Introduction to Statistics Mr. Toner s Lecture Notes 3.1 Measures of Central Tendency
 Math 1 Introduction to Statistics Mr. Toner s Lecture Notes 3.1 Measures of Central Tendency lowest value + highest value midrange The word average: is very ambiguous and can actually refer to the mean,
How Developers Use the Dynamic Features of Programming Languages: The Case of Smalltalk
 How Developers Use the Dynamic Features of Programming Languages: The Case of Smalltalk Oscar Callaú, Romain Robbes, Éric Tanter (University of Chile) David Röthlisberger (University of Bern) Proceedings
(Refer Slide Time: 00:02:00)
") Computer Graphics Prof. Sukhendu Das Dept. of Computer Science and Engineering Indian Institute of Technology, Madras Lecture - 18 Polyfill - Scan Conversion of a Polygon Today we will discuss the concepts
Computer Graphics Prof. Sukhendu Das Dept. of Computer Science and Engineering Indian Institute of Technology, Madras Lecture - 18 Polyfill - Scan Conversion of a Polygon Today we will discuss the concepts
Unit 1, Lesson 1: Moving in the Plane
 Unit 1, Lesson 1: Moving in the Plane Let s describe ways figures can move in the plane. 1.1: Which One Doesn t Belong: Diagrams Which one doesn t belong? 1.2: Triangle Square Dance m.openup.org/1/8-1-1-2
Joint Entity Resolution
 Joint Entity Resolution Steven Euijong Whang, Hector Garcia-Molina Computer Science Department, Stanford University 353 Serra Mall, Stanford, CA 94305, USA {swhang, hector}@cs.stanford.edu No Institute
Whitepaper Spain SEO Ranking Factors 2012
 Whitepaper Spain SEO Ranking Factors 2012 Authors: Marcus Tober, Sebastian Weber Searchmetrics GmbH Greifswalder Straße 212 10405 Berlin Phone: +49-30-3229535-0 Fax: +49-30-3229535-99 E-Mail: info@searchmetrics.com
Tips and Guidance for Analyzing Data. Executive Summary
 Tips and Guidance for Analyzing Data Executive Summary This document has information and suggestions about three things: 1) how to quickly do a preliminary analysis of time-series data; 2) key things to
An Introduction to EDA with GeoDa
 An Introduction to EDA with GeoDa Luc Anselin Spatial Analysis Laboratory Department of Agricultural and Consumer Economics University of Illinois, Urbana-Champaign http://sal.agecon.uiuc.edu/ June 16,
Data Partitioning. Figure 1-31: Communication Topologies. Regular Partitions
 Data In single-program multiple-data (SPMD) parallel programs, global data is partitioned, with a portion of the data assigned to each processing node. Issues relevant to choosing a partitioning strategy
Introduction to Data Science
 UNIT I INTRODUCTION TO DATA SCIENCE Syllabus Introduction of Data Science Basic Data Analytics using R R Graphical User Interfaces Data Import and Export Attribute and Data Types Descriptive Statistics
6.2 DATA DISTRIBUTION AND EXPERIMENT DETAILS
 Chapter 6 Indexing Results 6. INTRODUCTION The generation of inverted indexes for text databases is a computationally intensive process that requires the exclusive use of processing resources for long
Project and Production Management Prof. Arun Kanda Department of Mechanical Engineering Indian Institute of Technology, Delhi
 Project and Production Management Prof. Arun Kanda Department of Mechanical Engineering Indian Institute of Technology, Delhi Lecture - 8 Consistency and Redundancy in Project networks In today s lecture
Data Preprocessing. Why Data Preprocessing? MIT-652 Data Mining Applications. Chapter 3: Data Preprocessing. Multi-Dimensional Measure of Data Quality
 Why Data Preprocessing? Data in the real world is dirty incomplete: lacking attribute values, lacking certain attributes of interest, or containing only aggregate data e.g., occupation = noisy: containing
Data Analysis and Solver Plugins for KSpread USER S MANUAL. Tomasz Maliszewski
 Data Analysis and Solver Plugins for KSpread USER S MANUAL Tomasz Maliszewski tmaliszewski@wp.pl Table of Content CHAPTER 1: INTRODUCTION... 3 1.1. ABOUT DATA ANALYSIS PLUGIN... 3 1.3. ABOUT SOLVER PLUGIN...
Data Preprocessing. Slides by: Shree Jaswal
 Data Preprocessing Slides by: Shree Jaswal Topics to be covered Why Preprocessing? Data Cleaning; Data Integration; Data Reduction: Attribute subset selection, Histograms, Clustering and Sampling; Data
Complex Networks. Structure and Dynamics
 Complex Networks Structure and Dynamics Ying-Cheng Lai Department of Mathematics and Statistics Department of Electrical Engineering Arizona State University Collaborators! Adilson E. Motter, now at Max-Planck
Chapter 12: Indexing and Hashing. Basic Concepts
 Chapter 12: Indexing and Hashing! Basic Concepts! Ordered Indices! B+-Tree Index Files! B-Tree Index Files! Static Hashing! Dynamic Hashing! Comparison of Ordered Indexing and Hashing! Index Definition
Machine Learning for Pre-emptive Identification of Performance Problems in UNIX Servers Helen Cunningham
 Final Report for cs229: Machine Learning for Pre-emptive Identification of Performance Problems in UNIX Servers Helen Cunningham Abstract. The goal of this work is to use machine learning to understand
Chapter 5. Track Geometry Data Analysis
 Chapter Track Geometry Data Analysis This chapter explains how and why the data collected for the track geometry was manipulated. The results of these studies in the time and frequency domain are addressed.
Regression III: Advanced Methods
 Lecture 3: Distributions Regression III: Advanced Methods William G. Jacoby Michigan State University Goals of the lecture Examine data in graphical form Graphs for looking at univariate distributions
MATH 1070 Introductory Statistics Lecture notes Descriptive Statistics and Graphical Representation
 MATH 1070 Introductory Statistics Lecture notes Descriptive Statistics and Graphical Representation Objectives: 1. Learn the meaning of descriptive versus inferential statistics 2. Identify bar graphs,
2013 Association Marketing Benchmark Report
 2013 Association Email Marketing Benchmark Report Part I: Key Metrics 1 TABLE of CONTENTS About Informz.... 3 Introduction.... 4 Key Findings.... 5 Overall Association Metrics... 6 Results by Country of
Conway s Game of Life Wang An Aloysius & Koh Shang Hui
 Wang An Aloysius & Koh Shang Hui Winner of Foo Kean Pew Memorial Prize and Gold Award Singapore Mathematics Project Festival 2014 Abstract Conway s Game of Life is a cellular automaton devised by the British
Database Management System Prof. D. Janakiram Department of Computer Science & Engineering Indian Institute of Technology, Madras Lecture No.
 Database Management System Prof. D. Janakiram Department of Computer Science & Engineering Indian Institute of Technology, Madras Lecture No. # 20 Concurrency Control Part -1 Foundations for concurrency
Correlation. January 12, 2019
 Correlation January 12, 2019 Contents Correlations The Scattterplot The Pearson correlation The computational raw-score formula Survey data Fun facts about r Sensitivity to outliers Spearman rank-order
Chapter 12: Indexing and Hashing
 Chapter 12: Indexing and Hashing Basic Concepts Ordered Indices B+-Tree Index Files B-Tree Index Files Static Hashing Dynamic Hashing Comparison of Ordered Indexing and Hashing Index Definition in SQL
The attendee will get a deep dive into all the DDL changes needed in order to exploit DB2 V10 Temporal tables as well as the limitations.
 The attendee will get a deep dive into all the DDL changes needed in order to exploit DB2 V10 Temporal tables as well as the limitations. A case study scenario using a live DB2 V10 system will be used
Frequency Distributions
 Displaying Data Frequency Distributions After collecting data, the first task for a researcher is to organize and summarize the data so that it is possible to get a general overview of the results. Remember,
High Performance Computing in Europe and USA: A Comparison
 High Performance Computing in Europe and USA: A Comparison Erich Strohmaier 1 and Hans W. Meuer 2 1 NERSC, Lawrence Berkeley National Laboratory, USA 2 University of Mannheim, Germany 1 Introduction In
CCSSM Curriculum Analysis Project Tool 1 Interpreting Functions in Grades 9-12
 Tool 1: Standards for Mathematical ent: Interpreting Functions CCSSM Curriculum Analysis Project Tool 1 Interpreting Functions in Grades 9-12 Name of Reviewer School/District Date Name of Curriculum Materials:
STA Rev. F Learning Objectives. Learning Objectives (Cont.) Module 3 Descriptive Measures
 Module 3 Descriptive Measures") STA 2023 Module 3 Descriptive Measures Learning Objectives Upon completing this module, you should be able to: 1. Explain the purpose of a measure of center. 2. Obtain and interpret the mean, median, and
STA 2023 Module 3 Descriptive Measures Learning Objectives Upon completing this module, you should be able to: 1. Explain the purpose of a measure of center. 2. Obtain and interpret the mean, median, and
Averages and Variation
 Averages and Variation 3 Copyright Cengage Learning. All rights reserved. 3.1-1 Section 3.1 Measures of Central Tendency: Mode, Median, and Mean Copyright Cengage Learning. All rights reserved. 3.1-2 Focus
SPSS INSTRUCTION CHAPTER 9
 SPSS INSTRUCTION CHAPTER 9 Chapter 9 does no more than introduce the repeated-measures ANOVA, the MANOVA, and the ANCOVA, and discriminant analysis. But, you can likely envision how complicated it can
Computer Graphics Prof. Sukhendu Das Dept. of Computer Science and Engineering Indian Institute of Technology, Madras Lecture - 24 Solid Modelling
 Computer Graphics Prof. Sukhendu Das Dept. of Computer Science and Engineering Indian Institute of Technology, Madras Lecture - 24 Solid Modelling Welcome to the lectures on computer graphics. We have
OPTIMIZING A VIDEO PREPROCESSOR FOR OCR. MR IBM Systems Dev Rochester, elopment Division Minnesota
 OPTIMIZING A VIDEO PREPROCESSOR FOR OCR MR IBM Systems Dev Rochester, elopment Division Minnesota Summary This paper describes how optimal video preprocessor performance can be achieved using a software
Whitepaper Italy SEO Ranking Factors 2012
 Whitepaper Italy SEO Ranking Factors 2012 Authors: Marcus Tober, Sebastian Weber Searchmetrics GmbH Greifswalder Straße 212 10405 Berlin Phone: +49-30-3229535-0 Fax: +49-30-3229535-99 E-Mail: info@searchmetrics.com
Building Better Parametric Cost Models
 Building Better Parametric Cost Models Based on the PMI PMBOK Guide Fourth Edition 37 IPDI has been reviewed and approved as a provider of project management training by the Project Management Institute
RSM Split-Plot Designs & Diagnostics Solve Real-World Problems
 RSM Split-Plot Designs & Diagnostics Solve Real-World Problems Shari Kraber Pat Whitcomb Martin Bezener Stat-Ease, Inc. Stat-Ease, Inc. Stat-Ease, Inc. 221 E. Hennepin Ave. 221 E. Hennepin Ave. 221 E.
Spatial and multi-scale data assimilation in EO-LDAS. Technical Note for EO-LDAS project/nceo. P. Lewis, UCL NERC NCEO
 Spatial and multi-scale data assimilation in EO-LDAS Technical Note for EO-LDAS project/nceo P. Lewis, UCL NERC NCEO Abstract Email: p.lewis@ucl.ac.uk 2 May 2012 In this technical note, spatial data assimilation
Decision Trees Dr. G. Bharadwaja Kumar VIT Chennai
 Decision Trees Decision Tree Decision Trees (DTs) are a nonparametric supervised learning method used for classification and regression. The goal is to create a model that predicts the value of a target
Subset sum problem and dynamic programming
 Lecture Notes: Dynamic programming We will discuss the subset sum problem (introduced last time), and introduce the main idea of dynamic programming. We illustrate it further using a variant of the so-called
Adobe Marketing Cloud Data Workbench Controlled Experiments
 Adobe Marketing Cloud Data Workbench Controlled Experiments Contents Data Workbench Controlled Experiments...3 How Does Site Identify Visitors?...3 How Do Controlled Experiments Work?...3 What Should I
Data Mining Algorithms: Basic Methods
 Algorithms: The basic methods Inferring rudimentary rules Data Mining Algorithms: Basic Methods Chapter 4 of Data Mining Statistical modeling Constructing decision trees Constructing rules Association
STA Module 2B Organizing Data and Comparing Distributions (Part II)
") STA 2023 Module 2B Organizing Data and Comparing Distributions (Part II) Learning Objectives Upon completing this module, you should be able to 1 Explain the purpose of a measure of center 2 Obtain and
STA 2023 Module 2B Organizing Data and Comparing Distributions (Part II) Learning Objectives Upon completing this module, you should be able to 1 Explain the purpose of a measure of center 2 Obtain and
STA Learning Objectives. Learning Objectives (cont.) Module 2B Organizing Data and Comparing Distributions (Part II)
 Module 2B Organizing Data and Comparing Distributions (Part II)") STA 2023 Module 2B Organizing Data and Comparing Distributions (Part II) Learning Objectives Upon completing this module, you should be able to 1 Explain the purpose of a measure of center 2 Obtain and
STA 2023 Module 2B Organizing Data and Comparing Distributions (Part II) Learning Objectives Upon completing this module, you should be able to 1 Explain the purpose of a measure of center 2 Obtain and
Centrality Book. cohesion.
 Cohesion The graph-theoretic terms discussed in the previous chapter have very specific and concrete meanings which are highly shared across the field of graph theory and other fields like social network
Ch 4 : CPU scheduling
 Ch 4 : CPU scheduling It's the basis of multiprogramming operating systems. By switching the CPU among processes, the operating system can make the computer more productive In a single-processor system,
Constructing a G(N, p) Network
 Network") Random Graph Theory Dr. Natarajan Meghanathan Professor Department of Computer Science Jackson State University, Jackson, MS E-mail: natarajan.meghanathan@jsums.edu Introduction At first inspection, most
Random Graph Theory Dr. Natarajan Meghanathan Professor Department of Computer Science Jackson State University, Jackson, MS E-mail: natarajan.meghanathan@jsums.edu Introduction At first inspection, most
Enterprise Integration Patterns: Designing, Building, and Deploying Messaging Solutions
 Enterprise Integration Patterns: Designing, Building, and Deploying Messaging Solutions Chapter 1: Solving Integration Problems Using Patterns 2 Introduction The Need for Integration Integration Challenges
CHAPTER-13. Mining Class Comparisons: Discrimination between DifferentClasses: 13.4 Class Description: Presentation of Both Characterization and
 CHAPTER-13 Mining Class Comparisons: Discrimination between DifferentClasses: 13.1 Introduction 13.2 Class Comparison Methods and Implementation 13.3 Presentation of Class Comparison Descriptions 13.4
Whitepaper US SEO Ranking Factors 2012
 Whitepaper US SEO Ranking Factors 2012 Authors: Marcus Tober, Sebastian Weber Searchmetrics Inc. 1115 Broadway 12th Floor, Room 1213 New York, NY 10010 Phone: 1 866-411-9494 E-Mail: sales-us@searchmetrics.com
CHAPTER 6. The Normal Probability Distribution
 The Normal Probability Distribution CHAPTER 6 The normal probability distribution is the most widely used distribution in statistics as many statistical procedures are built around it. The central limit
Chapter 6 Normal Probability Distributions
 Chapter 6 Normal Probability Distributions 6-1 Review and Preview 6-2 The Standard Normal Distribution 6-3 Applications of Normal Distributions 6-4 Sampling Distributions and Estimators 6-5 The Central
Math 7 Glossary Terms
 Math 7 Glossary Terms Absolute Value Absolute value is the distance, or number of units, a number is from zero. Distance is always a positive value; therefore, absolute value is always a positive value.
γ : constant Goett 2 P(k) = k γ k : degree
 = k γ k : degree") Goett 1 Jeffrey Goett Final Research Paper, Fall 2003 Professor Madey 19 December 2003 Abstract: Recent observations by physicists have lead to new theories about the mechanisms controlling the growth
Goett 1 Jeffrey Goett Final Research Paper, Fall 2003 Professor Madey 19 December 2003 Abstract: Recent observations by physicists have lead to new theories about the mechanisms controlling the growth
Statistical Good Practice Guidelines. 1. Introduction. Contents. SSC home Using Excel for Statistics - Tips and Warnings
 Statistical Good Practice Guidelines SSC home Using Excel for Statistics - Tips and Warnings On-line version 2 - March 2001 This is one in a series of guides for research and support staff involved in
Chapter 11: Indexing and Hashing
 Chapter 11: Indexing and Hashing Basic Concepts Ordered Indices B + -Tree Index Files B-Tree Index Files Static Hashing Dynamic Hashing Comparison of Ordered Indexing and Hashing Index Definition in SQL
SPM Users Guide. This guide elaborates on powerful ways to combine the TreeNet and GPS engines to achieve model compression and more.
 SPM Users Guide Model Compression via ISLE and RuleLearner This guide elaborates on powerful ways to combine the TreeNet and GPS engines to achieve model compression and more. Title: Model Compression
THE STATE OF CLOUD & DATA PROTECTION 2018
 THE STATE OF CLOUD & DATA PROTECTION 2018 Survey Results: 10 Findings on how over 800 IT Pros handle Disaster Recovery & Cloud Adoption. INTRODUCTION The Unitrends 2018 annual survey of IT professionals
DATA MINING TRANSACTION
 DATA MINING Data Mining is the process of extracting patterns from data. Data mining is seen as an increasingly important tool by modern business to transform data into an informational advantage. It is
Table of Contents (As covered from textbook)
") Table of Contents (As covered from textbook) Ch 1 Data and Decisions Ch 2 Displaying and Describing Categorical Data Ch 3 Displaying and Describing Quantitative Data Ch 4 Correlation and Linear Regression
Table of Contents (As covered from textbook) Ch 1 Data and Decisions Ch 2 Displaying and Describing Categorical Data Ch 3 Displaying and Describing Quantitative Data Ch 4 Correlation and Linear Regression
Continuous Improvement Toolkit. Normal Distribution. Continuous Improvement Toolkit.
 Continuous Improvement Toolkit Normal Distribution The Continuous Improvement Map Managing Risk FMEA Understanding Performance** Check Sheets Data Collection PDPC RAID Log* Risk Analysis* Benchmarking***
CHAPTER 2 DESCRIPTIVE STATISTICS
 CHAPTER 2 DESCRIPTIVE STATISTICS 1. Stem-and-Leaf Graphs, Line Graphs, and Bar Graphs The distribution of data is how the data is spread or distributed over the range of the data values. This is one of
Statistical Analysis of MRI Data
 Statistical Analysis of MRI Data Shelby Cummings August 1, 2012 Abstract Every day, numerous people around the country go under medical testing with the use of MRI technology. Developed in the late twentieth
Empirical Study on Impact of Developer Collaboration on Source Code
 Empirical Study on Impact of Developer Collaboration on Source Code Akshay Chopra University of Waterloo Waterloo, Ontario a22chopr@uwaterloo.ca Parul Verma University of Waterloo Waterloo, Ontario p7verma@uwaterloo.ca
Maximizing Statistical Interactions Part II: Database Issues Provided by: The Biostatistics Collaboration Center (BCC) at Northwestern University
 at Northwestern University") Maximizing Statistical Interactions Part II: Database Issues Provided by: The Biostatistics Collaboration Center (BCC) at Northwestern University While your data tables or spreadsheets may look good to
Maximizing Statistical Interactions Part II: Database Issues Provided by: The Biostatistics Collaboration Center (BCC) at Northwestern University While your data tables or spreadsheets may look good to
WWW. FUSIONIO. COM. Fusion-io s Solid State Storage A New Standard for Enterprise-Class Reliability Fusion-io, All Rights Reserved.
 Fusion-io s Solid State Storage A New Standard for Enterprise-Class Reliability iodrive Fusion-io s Solid State Storage A New Standard for Enterprise-Class Reliability Fusion-io offers solid state storage
Improving Stack Overflow Tag Prediction Using Eye Tracking Alina Lazar Youngstown State University Bonita Sharif, Youngstown State University
 Improving Stack Overflow Tag Prediction Using Eye Tracking Alina Lazar, Youngstown State University Bonita Sharif, Youngstown State University Jenna Wise, Youngstown State University Alyssa Pawluk, Youngstown
Deliver robust products at reduced cost by linking model-driven software testing to quality management.
 Quality management White paper September 2009 Deliver robust products at reduced cost by linking model-driven software testing to quality management. Page 2 Contents 2 Closing the productivity gap between
The Grid File: An Adaptable, Symmetric Multikey File Structure
 The Grid File: An Adaptable, Symmetric Multikey File Structure Presentation: Saskia Nieckau Moderation: Hedi Buchner The Grid File: An Adaptable, Symmetric Multikey File Structure 1. Multikey Structures
Similarity Templates or Schemata. CS 571 Evolutionary Computation
 Similarity Templates or Schemata CS 571 Evolutionary Computation Similarities among Strings in a Population A GA has a population of strings (solutions) that change from generation to generation. What
Basic Statistical Terms and Definitions
 I. Basics Basic Statistical Terms and Definitions Statistics is a collection of methods for planning experiments, and obtaining data. The data is then organized and summarized so that professionals can
To Plot a Graph in Origin. Example: Number of Counts from a Geiger- Müller Tube as a Function of Supply Voltage
 To Plot a Graph in Origin Example: Number of Counts from a Geiger- Müller Tube as a Function of Supply Voltage 1 Digression on Error Bars What entity do you use for the magnitude of the error bars? Standard
Packet-Level Diversity From Theory to Practice: An based Experimental Investigation
 Packet-Level Diversity From Theory to Practice: An 802.11- based Experimental Investigation E. Vergetis, E. Pierce, M. Blanco and R. Guérin University of Pennsylvania Department of Electrical & Systems
Configuring BGP. Cisco s BGP Implementation
 Configuring BGP This chapter describes how to configure Border Gateway Protocol (BGP). For a complete description of the BGP commands in this chapter, refer to the BGP s chapter of the Network Protocols
Bootstrapping Method for 14 June 2016 R. Russell Rhinehart. Bootstrapping
 Bootstrapping Method for www.r3eda.com 14 June 2016 R. Russell Rhinehart Bootstrapping This is extracted from the book, Nonlinear Regression Modeling for Engineering Applications: Modeling, Model Validation,
Age & Stage Structure: Elephant Model
 POPULATION MODELS Age & Stage Structure: Elephant Model Terri Donovan recorded: January, 2010 Today we're going to be building an age-structured model for the elephant population. And this will be the