How is Life for a Table in an Evolving Relational Schema? Birth, Death & Everything in Between
|
|
|
- Emory Johnson
- 6 years ago
- Views:
Transcription

1 This work was partially supported from the European Community's FP7/ under grant agreement number (project CHOReOS). How is Life for a Table in an Evolving Relational Schema? Birth, Death & Everything in Between Panos Vassiliadis, Apostolos Zarras, Ioannis Skoulis Department of Computer Science and Engineering University of Ioannina, Hellas
2 WHAT ARE THE LAWS OF DATABASE SCHEMA EVOLUTION? 2
3 Imagine if we could predict how a schema will evolve over time we would be able to design for evolution and minimize the impact of evolution to the surrounding applications by applying design patterns by avoiding anti-patterns & complexity increase in both the db and the code we would be able to plan administration and perfective maintenance tasks and resources, instead of responding to emergencies 3
4 Why aren t we there yet? Historically, nobody from the research community had access + the right to publish to version histories of database schemata Open source tools internally hosting databases have changed this landscape: not only is the code available, but also, public repositories (git, svn, ) keep the entire history of revisions We are now presented with the opportunity to study the version histories of such open source databases 4
5 Timeline of empirical studies Mind the gap! (15 years) Sjoberg IST 93 Curino+ ICEIS08 Univ. Riverside IWPSE09, ICDEW11 Qiu,Li,Su FSE 13 Univ. Ioannina CAiSE14, ER
 Exploratory")
6 Our take on the problem Collected version histories for the schemata of 8 open-source projects CMS s: MediaWiki, TYPO3, Coppermine, phpbb, OpenCart Physics: ATLAS Trigger --- Bio: Ensemble, BioSQL Preprocessed them to be parsable by our HECATE schema comparison tool and exported the transitions between each two subsequent versions and measures for them (size, growth, changes) Exploratory search where we statistically studied / mined these measures, to extract patterns & regularities for the lives of tables Available at: 6
7 Scope of the study Scope: databases being part of open-source software (and not proprietary ones) long history we work only with changes at the logical schema level (and ignore physical-level changes like index creation or change of storage engine) We encompass datasets with different domains ([A]: physics, [B]: biomedical, [C]: CMS s), amount of growth (shade: high, med, low) & schema size We should be very careful to not overgeneralize findings to proprietary databases or physical schemata! FoSS Dataset ATLAS Trigger [A] Versio ns Lifetime Start End 84 2 Y, 7 M, 2 D BioSQL [B] Y, 6 M, 19 D Coppermine [C] Y, 6 M, 2 D 8 22 Ensembl [B] Y, 3 M, 15 D MediaWiki [C] Y, 10 M, 6 D OpenCart [C] Y, 4 M, 3 D phpbb [C] Y, 7 M, 10 D TYPO3 [C] 97 8 Y, 11 M, 0 D

8 Hecate: SQL schema diff extractor 8


9 Exploratory search of the schema Input: schema histories from github/sourceforge/ Raw material: details and stats on each table s life, as produced by our diff extractor, for all the 8 datasets histories for patterns Output: properties & patterns on table properties (birth, duration, amt of change, ) that occur frequently in our data sets Highlights 4 patterns of evolution 9
10 -Statistical properties for schema size, change and duration of tables - How are these measures interrelated? SCHEMA SIZE, CHANGE AND DURATION 10

11 The Gamma Pattern: "if you 're wide, you survive" The Gamma phenomenon: tables with small schema sizes can have arbitrary durations, //small size does not determine duration larger size tables last long Observations: whenever a table exceeds the critical value of 10 attributes in its schema, its chances of surviving are high. in most cases, the large tables are created early on and are not deleted afterwards. duration duration duration Atlas: duration/ size schema size@birth 11 schema size@birth schema size@birth Coppermine: duration / schema size mwiki: duration / schema size

12 Exceptions - Biosql: nobody exceeds 10 attributes - Ensembl, mwiki: very few exceed 10 attributes, 3 of them died - typo: has many late born survivors 12
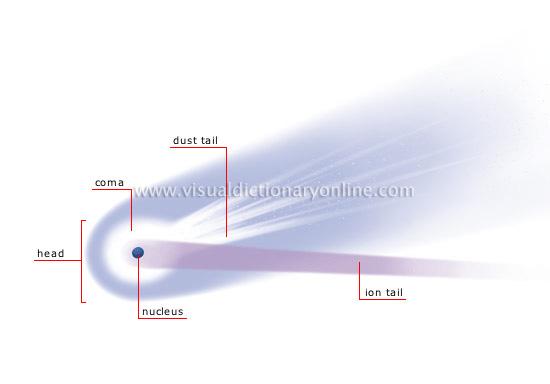
13 The Comet Pattern Comet for change over schema size with: a large, dense, nucleus cluster close to the beginning of the axes, denoting small size and small amount of change, medium schema size tables typically demonstrating medium to large change The tables with the largest amount of change are typically tables whose schema is on average one standard deviation above the mean wide tables with large schema sizes demonstrating small to medium (typically around the middle of the y- axis) amount of change. changes changes changes Atlas: changes / schema size schema size@birth Coppermine: changes / schema size schema size@birth mwiki: changes / schema size schema size@birth 13

14 14
15 The inverse Gamma pattern The correlation of change and duration is as follows: small durations come necessarily with small change, large durations come with all kinds of change activity and medium sized durations come mostly with small change activity (Inverse Gamma). changes changes changes Atlas: changes / duration duration Coppermine: changes / duration duration mwiki: changes / duration duration 15
16 16
17 Who are the top changers? Who are removed at some point of time? How do removals take place? BIRTHDAY & SCHEMA SIZE & MATTERS OF LIFE AND DEATH 17
18 Quiet tables rule, esp. for mature db s Non-survivors Sudden deaths mostly Quiet come ~ close Too few active Survivors Quiet tables rule Rigid and active then Active mostly in new db s Mature DB s: the pct of active tables drops significantly 18
19 Deleted tables are born early & last short Empty space: high change rates are only for early born & long lived Too many top changers are born early Top changers live long Birth rate drops over time Longevity and update activity correlate!! The few top-changers (in terms of avg trans. update ATU) are long lived, typically come from the early versions of the database due to the combination of high ATU and duration => they have high total amount of updates, and, frequently survive! 19
20 Deleted tables last short & do not change a lot Deleted tables are born early & last short Empty space: high change rates are only for early born & long lived An empty triangle: no deleted tables with large or even modest durations Die young and suddenly There is a very large concentration of the deleted tables in a small range of newly born, quickly removed, with few or no updates. resulting in very low numbers of removed tables with medium or long durations (empty triangle). 20
21 Too rare to see deletions! High durations are overwhelmingly blue! Only a couple of deletions are seen here! Survive long enough & you re probably safe It is quite rare to see tables being removed at old age Typically, the area of high duration is overwhelmingly inhabited by survivors (although each data set comes with a few such cases )! 21
22 Deleted tables last short & do not change a lot Deleted tables are born early & last short Few short lived tables are born and die in the mature life of the db Die young and suddenly [Early life of the db] There is a very large concentration of the deleted tables in a small range of newly born, quickly removed, with few or no updates, resulting in very low numbers of removed tables with medium or long durations. [Mature db] After the early stages of the databases, we see the birth of tables who eventually get deleted, but they mostly come with very small durations and sudden deaths. 22
23 23
24 Main Findings Open Issues CONCLUSIONS & OPEN ISSUES 24
25 Regularities on table change do exist! Only the thin die young, all the wide ones seem to live forever Top-changers typically live long, are early born, survive and they are not necessarily the widest ones in terms of schema size Progressive cooling: most change activity lies at the beginning of the db history Void triangle: The few dead tables are typically quiet, early born, short lived, and quite often all three of them 25
26 Unexplored research territory (risky but possibly rewarding) Weather Forecast: given the history and the state of a database, predict subsequent events Risky: frequently, changes come due to an external, changing world and have thematic affinity. Big & small steps in many directions needed (more data sets, studies with high internal validity to find causations, more events to capture, ) Engineer for evolution: To absorb change gracefully we can try to (i) alter db design and DDL; (ii) encapsulate the database via a stable API; To probe further (code, data, details, presentations, ) 26


27 Q & A time Many thanks: to our hosts for all their efforts to organize ER 2015! to you for your attention! 27
28 Regularities on table change do exist! Tack! Ett varmt tack till våra värdar! Only the thin die young, all the wide ones seem to live forever Top-changers typically live long, are early born, survive and they are not necessarily the widest ones in terms of schema size Progressive cooling: most change activity lies at the beginning of the db history Void triangle: The few dead tables are typically quiet, early born, short lived, and quite often all three of them 28
29 AUXILIARY SLIDES 29
30 What are the laws of database (schema) evolution? How do databases change? In particular, how does the schema of a database evolve over time? Long term research goals: Are there any invariant properties (e.g., patterns of repeating behavior) on the way database (schemata) change? Is there a theory / model to explain them? Can we exploit findings to engineer data-intensive ecosystems that withstand change gracefully? 30
31 Why care for the laws /patterns of schema evolution? Scientific curiosity! Practical Impact: DB s are dependency magnets. Applications have to conform to the structure of the db typically, development waits till the db backbone is stable and applications are build on top of it slight changes to the structure of a db can cause several (parts of) different applications to crash, causing the need for emergency repairing 31


32 Abstract coupling example from my SW Dev course Interface as a contract Specification Implementation Client class Factory as a bridge Service providers 32
33 Hecate: SQL schema diff extractor Parses DDL files Creates a model for the parsed SQL elements Compares two versions of the same schema Reports on the diff performed with a variety of metrics Exports the transitions that occurred in XML format 33
 http://www.cs.uoi.")
34 To probe further (code, data, details, presentations, ) 34
35 SCOPE OF THE STUDY && VALIDITY CONSIDERATIONS 35
36 Data sets Dataset Versi ons Lifetime Table s Start Table s End Attribut es Start Attribut es End Commit s per Day % commits with change Repository URL ATLAS Trigger 84 2 Y, 7 M, 2 D ,089 82% BioSQL Y, 6 M, 19 D ,012 63% Coppermine Y, 6 M, 2 D ,038 50% Ensembl Y, 3 M, 15 D ,109 60% MediaWiki Y, 10 M, 6 D ,100 59% tenance/tables.sql?view=log OpenCart Y, 4 M, 3 D ,104 47% phpbb Y, 7 M, 10 D ,055 82% all/opencart.sql schemas/mysql_41_schema.sql TYPO Y, 11 M, 0 D ,030 76% bined_schema.sql x/sql/schema.sql
37 Scope of the study Scope: databases being part of open-source software (and not proprietary ones) long history we work only with changes at the logical schema level (and ignore physical-level changes like index creation or change of storage engine) We encompass datasets with different domains ([A]: physics, [B]: biomedical, [C]: CMS s), amount of growth (shade: high, med, low) & schema size We should be very careful to not overgeneralize findings to proprietary databases or physical schemata! FoSS Dataset ATLAS Trigger [A] Versio ns Lifetime Start End 84 2 Y, 7 M, 2 D BioSQL [B] Y, 6 M, 19 D Coppermine [C] Y, 6 M, 2 D 8 22 Ensembl [B] Y, 3 M, 15 D MediaWiki [C] Y, 10 M, 6 D OpenCart [C] Y, 4 M, 3 D phpbb [C] Y, 7 M, 10 D TYPO3 [C] 97 8 Y, 11 M, 0 D
38 External validity Can we generalize out findings broadly? We perform an exploratory study to observe frequently occurring phenomena within the scope of the aforementioned population Are our data sets representative enough? Is it possible that the observed behaviors are caused by sui-generis characteristics of the studied data sets? Yes: we believe we have a good population definition & we abide by it Yes: we believe we have a large number of databases, from a variety of domains with different profiles, that seem to give fairly consistent answers to our research questions (behavior deviations are mostly related to the maturity of the database and not to its application area). Yes: we believe we have a good data extraction and measurement process without interference / selection / of the input from our part Maybe: unclear when the number of studied databases is large enough to declare the general application of a pattern as universal. 38
39 External validity Can we generalize out findings broadly? Understanding the represented population Precision: all our data sets belong to the specified population Definition Completeness: no missing property that we knowledgably omit to report FoSS has an inherent way of maintenance and evolution Representativeness of selected datasets Data sets come from 3 categories of FoSS (CMS / Biomedical / Physics) They have different size and growth volumes Results are fairly consistent both in our ER 15 and our CAiSE 14 papers Treatment of data We have tested our Delta Extractor, Hecate, to parse the input correctly & adapted it during its development; the parser is not a full-blown SQL parser, but robust to ignore parts unknown to it A handful of cases where adapted in the Coppermine to avoid overcomplicating the parser; not a serious threat to validity ; other than that we have not interfered with the input Fully automated counting for the measures via Hecate 39
 http://www.cs.uoi.gr/~pvassil/publications/2015_er/ https://github.")
40 Most importantly: we are happy to invite you to reuse /test /assess /disprove / all our code, data and results! To probe further (code, data, results, )
41 Internal validity Can we confirm statements A=>B? No! Are there any spurious relationships? Maybe! Internal validity concerns the accuracy of causeeffect statements: change in A => change in B We are very careful to avoid making strong causation statements! In some places, we just hint that we suspect the causes for a particular phenomenon, in some places in the text, but we have no data, yet, to verify our gutfeeling. And yes, it is quite possible that our correlations hide cofounding variables. 41
42 Is there a theory? Our study should be regarded as a pattern observer, rather than as a collection of laws, coming with their internal mechanics and architecture. It will take too many studies (to enlarge the representativeness even more) and more controlled experiments (in-depth excavation of cause-effect relationships) to produce a solid theory. It would be highly desirable if a clear set of requirements on the population definition, the breadth of study and the experimental protocol could be solidified by the scientific community (like e.g., the TREC benchmarks) and of course, there might be other suggestions on how to proceed 42
43 RELATED WORK 43
44 Timeline of empirical studies Sjoberg IST 93 Curino+ ICEIS08 Univ. Riverside IWPSE09, ICDEW11 Qiu,Li,Su FSE 13 Univ. Ioannina CAiSE14, ER
45 Timeline of empirical studies IST 93: 18 months study of a health system. 139% increase of #tables ; 274% increase of the #attributes Changes in the code (on avg): relation addition: 19 changes ; attribute additions: 2 changes relation deletion : 59.5 changes; attribute deletions: 3.25 changes An inflating period during construction where almost all changes were additions, and a subsequent period where additions and deletions where balanced. Sjoberg IST 93 Curino+ ICEIS08 Univ. Riverside IWPSE09, ICDEW11 Qiu,Li,Su FSE 13 Univ. Ioannina CAiSE14, ER
46 Timeline of empirical studies ICEIS08: Mediawiki for 4.5 years 100% increase in the number of tables 142% in the number of attributes. 45% of changes do not affect the information capacity of the schema (but are rather index adjustments, documentation, etc) Sjoberg IST 93 Curino+ ICEIS08 Univ. Riverside IWPSE09, ICDEW11 Qiu,Li,Su FSE 13 Univ. Ioannina CAiSE14, ER
47 Timeline of empirical studies IWPSE09: Mozilla and Monotone (a version control system) Many ways to be out of synch between code and evolving db schema ICDEW11: Firefox, Monotone, Biblioteq (catalogue man.), Vienna (RSS) Similar pct of changes with previous work Frequency and timing analysis: db schemata tend to stabilize over time, as there is more change at the beginning of their history, but seem to converge to a relatively fixed structure later Sjoberg IST 93 Curino+ ICEIS08 Univ. Riverside IWPSE09, ICDEW11 Qiu,Li,Su FSE 13 Univ. Ioannina CAiSE14, ER
48 Timeline of empirical studies FSE 2013: 10 (!) database schemata studied. Change is focused both (a) with respect to time and (b) with respect to the tables who change. Timing: 7 out of 10 databases reached 60% of their schema size within 20% of their early lifetime. Change is frequent in the early stages of the databases, with inflationary characteristics; then, the schema evolution process calms down. Tables that change: 40% of tables do not undergo any change at all, and 60%- 90% of changes pertain to 20% of the tables (in other words, 80% of the tables live quiet lives). The most frequently modified tables attract 80% of the changes. Sjoberg IST 93 Curino+ ICEIS08 Univ. Riverside IWPSE09, ICDEW11 Qiu,Li,Su FSE 13 Univ. Ioannina CAiSE14, ER
49 Timeline of empirical studies FSE 2013: Code and db co-evolution, not always in synch. Code and db changed in the same revision: 50.67% occasions Code change was in a previous/subsequent version than the one where the database schema change: 16.22% of occasions database changes not followed by code adaptation: 21.62% of occasions 11.49% of code changes were unrelated to the database evolution. Each atomic change at the schema level is estimated to result in lines of application code been updated; A valid db revision results in lines of application code being updated Sjoberg IST 93 Curino+ ICEIS08 Univ. Riverside IWPSE09, ICDEW11 Qiu,Li,Su FSE 13 Univ. Ioannina CAiSE14, ER
50 Timeline of empirical studies CAiSE14: DB level ER 15: Table level Sjoberg IST 93 Curino+ ICEIS08 Univ. Riverside IWPSE09, ICDEW11 Qiu,Li,Su FSE 13 Univ. Ioannina CAiSE14, ER
51 CAISE 14 / INF. SYSTEMS 15 51
52 Datasets Content management Systems MediaWiki, TYPO3, Coppermine, phpbb, OpenCart Medical Databases Ensemble, BioSQL Scientific ATLAS Trigger 52
53 Schema Size (relations)
54 CaiSE 14: Main results Schema size (#tables, #attributes) supports the assumption of a feedback mechanism Schema size grows over time; not continuously, but with bursts of concentrated effort Drops in schema size signifies the existence of perfective maintenance Regressive formula for size estimation holds, with a quite short memory Schema Growth (diff in size between subsequent versions) is small!! Growth is small, smaller than in typical software The number of changes for each evolution step follows Zipf s law around zero Average growth is close (slightly higher) to zero Patterns of change: no consistently constant behavior Changes reduce in density as databases age Grey for results requiring further search Change follows three patterns: Stillness, Abrupt change (up or down), Smooth growth upwards Change frequently follows spike patterns Complexity does not increase with age 54
55 Schema Growth (diff in #tables)
56 Change over time
57 STATS 57
58 Statistical study of durations Short and long lived tables are practically equally proportioned Medium size durations are fewer than the rest! Long lived tables are mostly survivors (see on the right) One of the fascinating revelations of this measurement was that there is a 26.11% fraction of tables that appeared in the beginning of the database and survived until the end. In fact, if a table is long-lived there is a 70% chance (188 over 269 occasions) that it has appeared in the beginning of the database. 58
59 Tables are mostly thin On average, half of the tables (approx. 47%) are thin tables with less than 5 attributes. The tables with 5 to 10 attributes are approximately one third of the tables' population The large tables with more than 10 attributes are approximately 17% of the tables. 59
60 THE FOUR PATTERNS 60
61 Schema birth / duration Only the thin die young, all the wide ones seem to live forever THE GAMMA PATTERN
62 Exceptions - Biosql: nobody exceeds 10 attributes - Ensembl, mwiki: very few exceed 10 attributes, 3 of them died - typo: has many late born survivors 62
63 Stats on wide tables and their survival Definitions: Wide schema: strictly above 10 attributes. The top band of durations (the upper part of the Gamma shape): the upper 10% of the values in the y-axis. Early born table: ts birth version is in the lowest 33% of versions; Late-comers: born after the 77% of the number of versions.
64 Whenever a table is wide, its chances of surviving are high Apart from mwiki and ensembl, all the rest of the data sets confirm the hypothesis with a percentage higher than 85%. The two exceptions are as high as 50% for their support to the hypothesis.
65 Wide tables are frequently created early on and are not deleted afterwards Early born, wide, survivor tables (as a percentage over the set of wide tables). - in half the data sets the percentage is above 70% - in two of them the percentage of these tables is one third of the wide tables.
66 Whenever a table is wide, its duration frequently lies within the top-band of durations (upper part of Gamma) What is probability that a wide table belongs to the upper part of the Gamma? - there is a very strong correlation between the two last columns: the Pearson correlation is 88% overall; 100% for the datasets with high pct of early born wide tables. - - Bipolarity on this pattern: half the cases support the pattern with support higher than 70%, whereas the rest of the cases clearly disprove it, with very low support values.
67 Long-lived & wide => early born and survivor Subset relationship In all data sets, if a wide table has a long duration within the upper part of the Gamma, this deterministically (100% of all data sets) signifies that the table was also early born and survivor. If a wide table is in the top of the Gamma line, it is deterministically an early born survivor.
68 THE COMET PATTERN Schema size and updates
69 69
70 Statistics of schema size at birth and sum of updates
71 Typically: ~70% of tables inside the box Typically, around 70% of the tables of a database is found within the 10x10 box of schemasize@birth x sumofupdates (10 excluded in both axes).
72 Top changers tend to have medium schema sizes For every dataset: we selected the top 5% of tables in terms of this sum of updates and we averaged the schema size at birth of these top 5% tables.
73 Top changers tend to have medium schema sizes The average schema size for the top 5% of tables in terms of their update behavior is close to one standard deviation up from the average value of the schema size at birth(i.e., very close to $mu$+$sigma$). //except phpbb
74 Top changers tend to have medium schema sizes - In 5 out of 8 cases, the average schema size of top-changers within 0.4 and 0.5 of the maximum value (practically the middle of the domain) and never above 0.65 of it. - Pearson: the maximum value, the standard deviation of the entire data set and the average of the top changers are very strongly correlated.
75 Wide tables have a medium number of updates For each data set, we took the top 5% in terms of schema size at birth (top wide) and contrasted their update behavior wrt the update behavior of the entire data set. Typically, the avg. number of updates of the top wide tables is close to the 50% of the domain of values for the sum of updates (i.e., the middle of the y-axis of the comet figure, measuring the sum of updates for each table). This is mainly due to the (very) large standard deviation (twice the mean), rather than the -- typically low -- mean value (due to the large part of the population living quiet lives).
76 INVERSE GAMMA
77 77
78 Skyline & Avg for Inverse Gamma
79 THE EMPTY TRIANGLE PATTERN 79
80 80
81 Top changers: early born, survivors, often with long durations, and often all the above In all data sets, active tables are born early with percentages that exceed 75% With the exceptions of two data sets, they survive with percentage higher than 70%. The probability of having a long duration is higher than 50% in 6 out of 8 data sets. Interestingly, the two last lines are exactly the same sets of tables in all data sets! An active table with long duration has been born early and survived with prob. 100% An active, survivor table that has a long duration has been born early with prob. 100% 81
82 Dead are: quiet, early born, short lived, and quite often all three of them 82
83 Most births &deaths occur early (usually)
84 Deleted tables are born early & last short Too many top changers are born early Top changers live long Birth rate drops over time Longevity and update activity correlate!! Remember: top changers are defined as such wrt ATU (AvgTrxnUpdate), not wrt sum(changes) Still, they dominate the sum(updates) too! (see top of inverse Γ) See also upper right blue part of diagonal: too many of them are born early and survive => live long! 84
85 Deleted tables last short & do not change a lot Deleted tables are born early & last short Empty space: high change rates are only for early born & long lived Top changers live long Top changers are born early An empty triangle: no deleted tables with large or even modest durations Birth rate drops over time All in one Early stages of the database life are more "active" in terms of births, deaths and updates, and have higher chances of producing deleted tables. After the first major restructuring, the database continues to grow; however, we see much less removals, and maintenance activity becomes more concentrated and focused. 85
Survival in schema evolution: putting the lives of survivor and dead tables in counterpoint
 Survival in schema evolution: putting the lives of survivor and dead tables in counterpoint Panos Vassiliadis, Apostolos Zarras Department of Computer Science and Engineering University of Ioannina, Hellas
Gravitating to Rigidity: Patterns of Schema Evolution -and its Absence- in the Lives of Tables
 Gravitating to Rigidity: Patterns of Schema Evolution -and its Absence- in the Lives of Tables Panos Vassiliadis a, Apostolos V. Zarras a, Ioannis Skoulis b,1 a University of Ioannina, Ioannina, Hellas
Schema Evolution Survival Guide for Tables: Avoid Rigid Childhood and You re En Route to a Quiet Life
 Noname manuscript No. (will be inserted by the editor) Schema Evolution Survival Guide for Tables: Avoid Rigid Childhood and You re En Route to a Quiet Life Panos Vassiliadis Apostolos V. Zarras This is
Survival in schema evolution: putting the lives of survivor and dead tables in counterpoint
 Survival in schema evolution: putting the lives of survivor and dead tables in counterpoint Panos Vassiliadis and Apostolos V. Zarras Department of Computer Science and Engineering, University of Ioannina,
Open-Source Databases: Within, Outside, or Beyond Lehman's Laws of Software Evolution?
 This research has been co-financed by the European Union (European Social Fund - ESF) and Greek national funds through the Operational Program "Education and Lifelong Learning" of the National Strategic
Growing up with Stability: how Open-Source Relational Databases Evolve
 Growing up with Stability: how Open-Source Relational Databases Evolve Ioannis Skoulis a,1, Panos Vassiliadis b, Apostolos V. Zarras b a Opera, Helsinki, Finland b University of Ioannina, Ioannina, Hellas
Open-Source Databases: Within, Outside, or Beyond Lehman s Laws of Software Evolution?
 Open-Source Databases: Within, Outside, or Beyond Lehman s Laws of Software Evolution? Ioannis Skoulis, Panos Vassiliadis, and Apostolos Zarras Dept. of Computer Science and Engineering University of Ioannina
The Attraction of Complexity
 The Attraction of Complexity Carlo Bottiglieri December 10, 2017 1 Introduction How is complexity distributed through a codebase? Does this distribution present similarities across different projects?
Spatial and multi-scale data assimilation in EO-LDAS. Technical Note for EO-LDAS project/nceo. P. Lewis, UCL NERC NCEO
 Spatial and multi-scale data assimilation in EO-LDAS Technical Note for EO-LDAS project/nceo P. Lewis, UCL NERC NCEO Abstract Email: p.lewis@ucl.ac.uk 2 May 2012 In this technical note, spatial data assimilation
The attendee will get a deep dive into all the DDL changes needed in order to exploit DB2 V10 Temporal tables as well as the limitations.
 The attendee will get a deep dive into all the DDL changes needed in order to exploit DB2 V10 Temporal tables as well as the limitations. A case study scenario using a live DB2 V10 system will be used
Microscopic Measurement
 Microscopic Measurement Estimating Specimen Size : The area of the slide that you see when you look through a microscope is called the " field of view ". If you know the diameter of your field of view,
Whitepaper Spain SEO Ranking Factors 2012
 Whitepaper Spain SEO Ranking Factors 2012 Authors: Marcus Tober, Sebastian Weber Searchmetrics GmbH Greifswalder Straße 212 10405 Berlin Phone: +49-30-3229535-0 Fax: +49-30-3229535-99 E-Mail: info@searchmetrics.com
Tips and Guidance for Analyzing Data. Executive Summary
 Tips and Guidance for Analyzing Data Executive Summary This document has information and suggestions about three things: 1) how to quickly do a preliminary analysis of time-series data; 2) key things to
Constructing a G(N, p) Network
 Network") Random Graph Theory Dr. Natarajan Meghanathan Professor Department of Computer Science Jackson State University, Jackson, MS E-mail: natarajan.meghanathan@jsums.edu Introduction At first inspection, most
Random Graph Theory Dr. Natarajan Meghanathan Professor Department of Computer Science Jackson State University, Jackson, MS E-mail: natarajan.meghanathan@jsums.edu Introduction At first inspection, most
Scale Free Network Growth By Ranking. Santo Fortunato, Alessandro Flammini, and Filippo Menczer
 Scale Free Network Growth By Ranking Santo Fortunato, Alessandro Flammini, and Filippo Menczer Motivation Network growth is usually explained through mechanisms that rely on node prestige measures, such
6.2 DATA DISTRIBUTION AND EXPERIMENT DETAILS
 Chapter 6 Indexing Results 6. INTRODUCTION The generation of inverted indexes for text databases is a computationally intensive process that requires the exclusive use of processing resources for long
Introduction to Data Science
 UNIT I INTRODUCTION TO DATA SCIENCE Syllabus Introduction of Data Science Basic Data Analytics using R R Graphical User Interfaces Data Import and Export Attribute and Data Types Descriptive Statistics
Math 120 Introduction to Statistics Mr. Toner s Lecture Notes 3.1 Measures of Central Tendency
 Math 1 Introduction to Statistics Mr. Toner s Lecture Notes 3.1 Measures of Central Tendency lowest value + highest value midrange The word average: is very ambiguous and can actually refer to the mean,
High Performance Computing in Europe and USA: A Comparison
 High Performance Computing in Europe and USA: A Comparison Erich Strohmaier 1 and Hans W. Meuer 2 1 NERSC, Lawrence Berkeley National Laboratory, USA 2 University of Mannheim, Germany 1 Introduction In
Path Length. 2) Verification of the Algorithm and Code
 Verification of the Algorithm and Code") Path Length ) Introduction In calculating the average path length, we must find the shortest path from a source node to all other nodes contained within the graph. Previously, we found that by using an
Path Length ) Introduction In calculating the average path length, we must find the shortest path from a source node to all other nodes contained within the graph. Previously, we found that by using an
SQL Tuning Reading Recent Data Fast
 SQL Tuning Reading Recent Data Fast Dan Tow singingsql.com Introduction Time is the key to SQL tuning, in two respects: Query execution time is the key measure of a tuned query, the only measure that matters
CREATING BASIC METRICS AND REPORTS
 CREATING BASIC METRICS AND REPORTS Table of Contents Choosing between Metrics, Multi-Metrics, and Reports... 4 What capabilities are supported by different types of Elements?... 5 Should I use a Metric,
Database Management System Prof. D. Janakiram Department of Computer Science & Engineering Indian Institute of Technology, Madras Lecture No.
 Database Management System Prof. D. Janakiram Department of Computer Science & Engineering Indian Institute of Technology, Madras Lecture No. # 20 Concurrency Control Part -1 Foundations for concurrency
Categorizing Migrations
 What to Migrate? Categorizing Migrations A version control repository contains two distinct types of data. The first type of data is the actual content of the directories and files themselves which are
Chapter 2 Basic Structure of High-Dimensional Spaces
 Chapter 2 Basic Structure of High-Dimensional Spaces Data is naturally represented geometrically by associating each record with a point in the space spanned by the attributes. This idea, although simple,
Constructing a G(N, p) Network
 Network") Random Graph Theory Dr. Natarajan Meghanathan Associate Professor Department of Computer Science Jackson State University, Jackson, MS E-mail: natarajan.meghanathan@jsums.edu Introduction At first inspection,
Random Graph Theory Dr. Natarajan Meghanathan Associate Professor Department of Computer Science Jackson State University, Jackson, MS E-mail: natarajan.meghanathan@jsums.edu Introduction At first inspection,
Small Libraries of Protein Fragments through Clustering
 Small Libraries of Protein Fragments through Clustering Varun Ganapathi Department of Computer Science Stanford University June 8, 2005 Abstract When trying to extract information from the information
Exploiting the Behavior of Generational Garbage Collector
 Exploiting the Behavior of Generational Garbage Collector I. Introduction Zhe Xu, Jia Zhao Garbage collection is a form of automatic memory management. The garbage collector, attempts to reclaim garbage,
Challenges on Combining Open Web and Dataset Evaluation Results: The Case of the Contextual Suggestion Track
 Challenges on Combining Open Web and Dataset Evaluation Results: The Case of the Contextual Suggestion Track Alejandro Bellogín 1,2, Thaer Samar 1, Arjen P. de Vries 1, and Alan Said 1 1 Centrum Wiskunde
Roc Model and Density Dependence, Part 1
 POPULATION MODELS Roc Model and Density Dependence, Part 1 Terri Donovan recorded: February, 2012 You ve now completed several modeling exercises dealing with the Roc population. So far, the caliph of
Further Maths Notes. Common Mistakes. Read the bold words in the exam! Always check data entry. Write equations in terms of variables
 Further Maths Notes Common Mistakes Read the bold words in the exam! Always check data entry Remember to interpret data with the multipliers specified (e.g. in thousands) Write equations in terms of variables
Morphogenesis. Simulation Results
 Morphogenesis Simulation Results This document contains the results of the simulations designed to investigate the regeneration strength of the computational model of the planarium. Specific portions of
Semi-Automatic Transcription Tool for Ancient Manuscripts
 The Venice Atlas A Digital Humanities atlas project by DH101 EPFL Students Semi-Automatic Transcription Tool for Ancient Manuscripts In this article, we investigate various techniques from the fields of
Distance-based Methods: Drawbacks
 Distance-based Methods: Drawbacks Hard to find clusters with irregular shapes Hard to specify the number of clusters Heuristic: a cluster must be dense Jian Pei: CMPT 459/741 Clustering (3) 1 How to Find
Whitepaper US SEO Ranking Factors 2012
 Whitepaper US SEO Ranking Factors 2012 Authors: Marcus Tober, Sebastian Weber Searchmetrics Inc. 1115 Broadway 12th Floor, Room 1213 New York, NY 10010 Phone: 1 866-411-9494 E-Mail: sales-us@searchmetrics.com
Closed Non-Derivable Itemsets
 Closed Non-Derivable Itemsets Juho Muhonen and Hannu Toivonen Helsinki Institute for Information Technology Basic Research Unit Department of Computer Science University of Helsinki Finland Abstract. Itemset
COSC 311: ALGORITHMS HW1: SORTING
 COSC 311: ALGORITHMS HW1: SORTIG Solutions 1) Theoretical predictions. Solution: On randomly ordered data, we expect the following ordering: Heapsort = Mergesort = Quicksort (deterministic or randomized)
3 Graphical Displays of Data
 3 Graphical Displays of Data Reading: SW Chapter 2, Sections 1-6 Summarizing and Displaying Qualitative Data The data below are from a study of thyroid cancer, using NMTR data. The investigators looked
Conway s Game of Life Wang An Aloysius & Koh Shang Hui
 Wang An Aloysius & Koh Shang Hui Winner of Foo Kean Pew Memorial Prize and Gold Award Singapore Mathematics Project Festival 2014 Abstract Conway s Game of Life is a cellular automaton devised by the British
Enterprise Integration Patterns: Designing, Building, and Deploying Messaging Solutions
 Enterprise Integration Patterns: Designing, Building, and Deploying Messaging Solutions Chapter 1: Solving Integration Problems Using Patterns 2 Introduction The Need for Integration Integration Challenges
Chapter 5. Track Geometry Data Analysis
 Chapter Track Geometry Data Analysis This chapter explains how and why the data collected for the track geometry was manipulated. The results of these studies in the time and frequency domain are addressed.
On Static and Dynamic Partitioning Behavior of Large-Scale Networks
 On Static and Dynamic Partitioning Behavior of Large-Scale Networks Derek Leonard Department of Computer Science Texas A&M University College Station, TX 77843 27th October 2005 Derek Leonard On Static
Elemental Set Methods. David Banks Duke University
 Elemental Set Methods David Banks Duke University 1 1. Introduction Data mining deals with complex, high-dimensional data. This means that datasets often combine different kinds of structure. For example:
Maximizing Statistical Interactions Part II: Database Issues Provided by: The Biostatistics Collaboration Center (BCC) at Northwestern University
 at Northwestern University") Maximizing Statistical Interactions Part II: Database Issues Provided by: The Biostatistics Collaboration Center (BCC) at Northwestern University While your data tables or spreadsheets may look good to
Maximizing Statistical Interactions Part II: Database Issues Provided by: The Biostatistics Collaboration Center (BCC) at Northwestern University While your data tables or spreadsheets may look good to
DB2 is a complex system, with a major impact upon your processing environment. There are substantial performance and instrumentation changes in
 DB2 is a complex system, with a major impact upon your processing environment. There are substantial performance and instrumentation changes in versions 8 and 9. that must be used to measure, evaluate,
FACETs. Technical Report 05/19/2010
 F3 FACETs Technical Report 05/19/2010 PROJECT OVERVIEW... 4 BASIC REQUIREMENTS... 4 CONSTRAINTS... 5 DEVELOPMENT PROCESS... 5 PLANNED/ACTUAL SCHEDULE... 6 SYSTEM DESIGN... 6 PRODUCT AND PROCESS METRICS...
Character Recognition
 Character Recognition 5.1 INTRODUCTION Recognition is one of the important steps in image processing. There are different methods such as Histogram method, Hough transformation, Neural computing approaches
CUSTOMER DATA INTEGRATION (CDI): PROJECTS IN OPERATIONAL ENVIRONMENTS (Practice-Oriented)
: PROJECTS IN OPERATIONAL ENVIRONMENTS (Practice-Oriented)") CUSTOMER DATA INTEGRATION (CDI): PROJECTS IN OPERATIONAL ENVIRONMENTS (Practice-Oriented) Flávio de Almeida Pires Assesso Engenharia de Sistemas Ltda flavio@assesso.com.br Abstract. To counter the results
CUSTOMER DATA INTEGRATION (CDI): PROJECTS IN OPERATIONAL ENVIRONMENTS (Practice-Oriented) Flávio de Almeida Pires Assesso Engenharia de Sistemas Ltda flavio@assesso.com.br Abstract. To counter the results
Whitepaper Italy SEO Ranking Factors 2012
 Whitepaper Italy SEO Ranking Factors 2012 Authors: Marcus Tober, Sebastian Weber Searchmetrics GmbH Greifswalder Straße 212 10405 Berlin Phone: +49-30-3229535-0 Fax: +49-30-3229535-99 E-Mail: info@searchmetrics.com
Empirical Study on Impact of Developer Collaboration on Source Code
 Empirical Study on Impact of Developer Collaboration on Source Code Akshay Chopra University of Waterloo Waterloo, Ontario a22chopr@uwaterloo.ca Parul Verma University of Waterloo Waterloo, Ontario p7verma@uwaterloo.ca
Age & Stage Structure: Elephant Model
 POPULATION MODELS Age & Stage Structure: Elephant Model Terri Donovan recorded: January, 2010 Today we're going to be building an age-structured model for the elephant population. And this will be the
Basic features. Adding audio files and tracks
 Audio in Pictures to Exe Introduction In the past the conventional wisdom was that you needed a separate audio editing program to produce the soundtrack for an AV sequence. However I believe that PTE (Pictures
Chapter 17: INTERNATIONAL DATA PRODUCTS
 Chapter 17: INTERNATIONAL DATA PRODUCTS After the data processing and data analysis, a series of data products were delivered to the OECD. These included public use data files and codebooks, compendia
Software Quality. Chapter What is Quality?
 Chapter 1 Software Quality 1.1 What is Quality? The purpose of software quality analysis, or software quality engineering, is to produce acceptable products at acceptable cost, where cost includes calendar
THE ADHERENCE OF OPEN SOURCE JAVA PROGRAMMERS TO STANDARD CODING PRACTICES
 THE ADHERENCE OF OPEN SOURCE JAVA PROGRAMMERS TO STANDARD CODING PRACTICES Mahmoud O. Elish Department of Computer Science George Mason University Fairfax VA 223-44 USA melish@gmu.edu ABSTRACT The use
Building Better Parametric Cost Models
 Building Better Parametric Cost Models Based on the PMI PMBOK Guide Fourth Edition 37 IPDI has been reviewed and approved as a provider of project management training by the Project Management Institute
Logical Templates for Feature Extraction in Fingerprint Images
 Logical Templates for Feature Extraction in Fingerprint Images Bir Bhanu, Michael Boshra and Xuejun Tan Center for Research in Intelligent Systems University of Califomia, Riverside, CA 9252 1, USA Email:
Graph Structure Over Time
 Graph Structure Over Time Observing how time alters the structure of the IEEE data set Priti Kumar Computer Science Rensselaer Polytechnic Institute Troy, NY Kumarp3@rpi.edu Abstract This paper examines
Cpk: What is its Capability? By: Rick Haynes, Master Black Belt Smarter Solutions, Inc.
 C: What is its Capability? By: Rick Haynes, Master Black Belt Smarter Solutions, Inc. C is one of many capability metrics that are available. When capability metrics are used, organizations typically provide
Packet-Level Diversity From Theory to Practice: An based Experimental Investigation
 Packet-Level Diversity From Theory to Practice: An 802.11- based Experimental Investigation E. Vergetis, E. Pierce, M. Blanco and R. Guérin University of Pennsylvania Department of Electrical & Systems
3 Graphical Displays of Data
 3 Graphical Displays of Data Reading: SW Chapter 2, Sections 1-6 Summarizing and Displaying Qualitative Data The data below are from a study of thyroid cancer, using NMTR data. The investigators looked
Tracking and Evaluating Changes to Address-Based Sampling Frames over Time
 Tracking and Evaluating Changes to Address-Based Sampling Frames over Time Jennifer Unangst 1, Joseph McMichael 1 1 RTI International, 3040 Cornwallis Road, Research Triangle Park, NC 27709 Abstract Address-based
Epidemic spreading on networks
 Epidemic spreading on networks Due date: Sunday October 25th, 2015, at 23:59. Always show all the steps which you made to arrive at your solution. Make sure you answer all parts of each question. Always
Logical Optimization of ETL Workflows
 Logical Optimization of ETL Workflows 1001 11001 111001 1001 1100011001 100011 100011 011001 10010 100101 10010 0101001 1001 1001 1001001 101001 010101001 010101001 1001001 1001001 1001001 1001001 1001
A Generating Function Approach to Analyze Random Graphs
 A Generating Function Approach to Analyze Random Graphs Presented by - Vilas Veeraraghavan Advisor - Dr. Steven Weber Department of Electrical and Computer Engineering Drexel University April 8, 2005 Presentation
Kaggle See Click Fix Model Description
 Kaggle See Click Fix Model Description BY: Miroslaw Horbal & Bryan Gregory LOCATION: Waterloo, Ont, Canada & Dallas, TX CONTACT : miroslaw@gmail.com & bryan.gregory1@gmail.com CONTEST: See Click Predict
Top 3 Marketing Metrics You Should Measure in Google Analytics
 Top 3 Marketing Metrics You Should Measure in Google Analytics Presented By Table of Contents Overview 3 How to Use This Knowledge Brief 3 Metric to Measure: Traffic 4 Direct (Acquisition > All Traffic
Behavioral Data Mining. Lecture 9 Modeling People
 Behavioral Data Mining Lecture 9 Modeling People Outline Power Laws Big-5 Personality Factors Social Network Structure Power Laws Y-axis = frequency of word, X-axis = rank in decreasing order Power Laws
Warewolf User Guide 1: Introduction and Basic Concepts
 Warewolf User Guide 1: Introduction and Basic Concepts Contents: An Introduction to Warewolf Preparation for the Course Welcome to Warewolf Studio Create your first Microservice Exercise 1 Using the Explorer
Hash-Based Indexing 1
 Hash-Based Indexing 1 Tree Indexing Summary Static and dynamic data structures ISAM and B+ trees Speed up both range and equality searches B+ trees very widely used in practice ISAM trees can be useful
//If target was found, then //found == true and a[index] == target.
![//If target was found, then //found == true and a[index] == target.](/thumbs/71/66156177.jpg "//If target was found, then //found == true and a[index] == target.") 230 CHAPTER 5 Arrays //If target was found, then //found == true and a[index] == target. } if (found) where = index; return found; 20. 0 1 2 3 0 1 2 3 0 1 2 3 0 1 2 3 21. int a[4][5]; int index1, index2;
230 CHAPTER 5 Arrays //If target was found, then //found == true and a[index] == target. } if (found) where = index; return found; 20. 0 1 2 3 0 1 2 3 0 1 2 3 0 1 2 3 21. int a[4][5]; int index1, index2;
Getting Started with Rational Team Concert
 Getting Started with Rational Team Concert or RTC in 16 Steps Kai-Uwe Maetzel IBM Rational Software kai-uwe_maetzel@us.ibm.com SDP 20 2009 IBM Corporation This Presentation is Good for You if You know
WHITE PAPER. Leveraging Database Virtualization for Test Data Management. Abstract. Vikas Dewangan, Senior Technology Architect, Infosys
 WHITE PAPER Leveraging ization for Test Data Management Vikas Dewangan, Senior Technology Architect, Infosys Abstract virtualization is an emerging trend in test data management (TDM) and is all set to
DATA MINING TRANSACTION
 DATA MINING Data Mining is the process of extracting patterns from data. Data mining is seen as an increasingly important tool by modern business to transform data into an informational advantage. It is
Practical Capacity Planning in 2010 zaap and ziip
 Practical Capacity Planning in 2010 zaap and ziip Fabio Massimo Ottaviani EPV Technologies February 2010 1 Introduction When IBM released zaap (2004) and ziip(2006) most companies decided to acquire a
OPTIMIZING A VIDEO PREPROCESSOR FOR OCR. MR IBM Systems Dev Rochester, elopment Division Minnesota
 OPTIMIZING A VIDEO PREPROCESSOR FOR OCR MR IBM Systems Dev Rochester, elopment Division Minnesota Summary This paper describes how optimal video preprocessor performance can be achieved using a software
Development of a guidance document on How to perform a shredder campaign Background information
 Development of a guidance document on How to perform a shredder campaign Background information Contract no. 070307/2011/603989/ETU/C2 Authors: Knut Sander, Stephanie Schilling Impressum / Imprint: ÖKOPOL
Oracle Rdb Hot Standby Performance Test Results
 Oracle Rdb Hot Performance Test Results Bill Gettys (bill.gettys@oracle.com), Principal Engineer, Oracle Corporation August 15, 1999 Introduction With the release of Rdb version 7.0, Oracle offered a powerful
 Format of Session 1. Forensic Accounting then and now 2. Overview of Data Analytics 3. Fraud Analytics Basics 4. Advanced Fraud Analytics 5. Data Visualization 6. Wrap-up Question are welcome and encouraged!
Erdős-Rényi Model for network formation
 Network Science: Erdős-Rényi Model for network formation Ozalp Babaoglu Dipartimento di Informatica Scienza e Ingegneria Università di Bologna www.cs.unibo.it/babaoglu/ Why model? Simpler representation
Unsupervised Learning and Clustering
 Unsupervised Learning and Clustering Selim Aksoy Department of Computer Engineering Bilkent University saksoy@cs.bilkent.edu.tr CS 551, Spring 2008 CS 551, Spring 2008 c 2008, Selim Aksoy (Bilkent University)
Table of Laplace Transforms
 Table of Laplace Transforms 1 1 2 3 4, p > -1 5 6 7 8 9 10 11 12 13 14 15 16 17 18 19 20 21 22 23 24 25 26 Heaviside Function 27 28. Dirac Delta Function 29 30. 31 32. 1 33 34. 35 36. 37 Laplace Transforms
Software Vulnerability
 Software Vulnerability Refers to a weakness in a system allowing an attacker to violate the integrity, confidentiality, access control, availability, consistency or audit mechanism of the system or the
Main challenges for a SAS programmer stepping in SAS developer s shoes
 Paper AD15 Main challenges for a SAS programmer stepping in SAS developer s shoes Sebastien Jolivet, Novartis Pharma AG, Basel, Switzerland ABSTRACT Whether you work for a large pharma or a local CRO,
Spatial Birth-Death-Swap Chains
 Spatial Birth-Death-Swap Chains Why swapping at birth is a good thing Mark Huber Department of Mathematics Claremont-McKenna College 14 Jan, 2010 Mark Huber, Claremont-McKenna College Spatial Birth-Death-Swap
Data Analyst Nanodegree Syllabus
 Data Analyst Nanodegree Syllabus Discover Insights from Data with Python, R, SQL, and Tableau Before You Start Prerequisites : In order to succeed in this program, we recommend having experience working
Final Project Report: Learning optimal parameters of Graph-Based Image Segmentation
 Final Project Report: Learning optimal parameters of Graph-Based Image Segmentation Stefan Zickler szickler@cs.cmu.edu Abstract The performance of many modern image segmentation algorithms depends greatly
Block Gas Limits vs. Transactional Throughput: A Performance Analysis of the Ubiq Platform
 Block Gas Limits vs. Transactional Throughput: A Performance Analysis of the Ubiq Platform Whiteblock, Inc. Abstract The following report outlines a performance benchmarking analysis for the Ubiq blockchain
The Encoding Complexity of Network Coding
 The Encoding Complexity of Network Coding Michael Langberg Alexander Sprintson Jehoshua Bruck California Institute of Technology Email: mikel,spalex,bruck @caltech.edu Abstract In the multicast network
Probabilistic Models of Software Function Point Elements
 Probabilistic Models of Software Function Point Elements Masood Uzzafer Amity university Dubai Dubai, U.A.E. Email: muzzafer [AT] amityuniversity.ae Abstract Probabilistic models of software function point
Software Metrics based on Coding Standards Violations
 Software Metrics based on Coding Standards Violations Yasunari Takai, Takashi Kobayashi and Kiyoshi Agusa Graduate School of Information Science, Nagoya University Aichi, 464-8601, Japan takai@agusa.i.is.nagoya-u.ac.jp,
CHAPTER 2. Morphometry on rodent brains. A.E.H. Scheenstra J. Dijkstra L. van der Weerd
 CHAPTER 2 Morphometry on rodent brains A.E.H. Scheenstra J. Dijkstra L. van der Weerd This chapter was adapted from: Volumetry and other quantitative measurements to assess the rodent brain, In vivo NMR
Question #1: 1. The assigned readings use the phrase "Database Approach." In your own words, what is the essence of a database approach?
 Question #1: 1. The assigned readings use the phrase "Database Approach." In your own words, what is the essence of a database approach? Respondant: I understand the essence of "database approach" to be
Information Retrieval CSCI
 Information Retrieval CSCI 4141-6403 My name is Anwar Alhenshiri My email is: anwar@cs.dal.ca I prefer: aalhenshiri@gmail.com The course website is: http://web.cs.dal.ca/~anwar/ir/main.html 5/6/2012 1
Object vs Image-based Testing Producing Automated GUI Tests to Withstand Change
 Object vs Image-based Testing Producing Automated GUI Tests to Withstand Change Handling Application Change Script maintenance, and handling application change, is one of the highest impact factors when
Provläsningsexemplar / Preview INTERNATIONAL STANDARD ISO Second edition
 INTERNATIONAL STANDARD ISO 18926 Second edition 2012-06-01 Imaging materials Information stored on magneto-optical (MO) discs Method for estimating the life expectancy based on the effects of temperature
γ : constant Goett 2 P(k) = k γ k : degree
 = k γ k : degree") Goett 1 Jeffrey Goett Final Research Paper, Fall 2003 Professor Madey 19 December 2003 Abstract: Recent observations by physicists have lead to new theories about the mechanisms controlling the growth
Goett 1 Jeffrey Goett Final Research Paper, Fall 2003 Professor Madey 19 December 2003 Abstract: Recent observations by physicists have lead to new theories about the mechanisms controlling the growth
Issues in Distributed Architecture
 Issues in Distributed Architecture Simon Roberts Simon.Roberts@earthlink.net Simon Roberts Issues in Distributed Architecture Page 1 Why Do We Need Architecture? Network programming systems usually aren't
How to integrate data into Tableau
 1 How to integrate data into Tableau a comparison of 3 approaches: ETL, Tableau self-service and WHITE PAPER WHITE PAPER 2 data How to integrate data into Tableau a comparison of 3 es: ETL, Tableau self-service
Prepare a stem-and-leaf graph for the following data. In your final display, you should arrange the leaves for each stem in increasing order.
 Chapter 2 2.1 Descriptive Statistics A stem-and-leaf graph, also called a stemplot, allows for a nice overview of quantitative data without losing information on individual observations. It can be a good