Table of Contents. Part I Introduction. Part II FSM Ribbon. Part III FSM Context Menu. Part IV Trial Balance. Part V Building a report
|
|
|
- Rudolph Foster
- 5 years ago
- Views:
Transcription
1 Contents I Table of Contents Part I Introduction 1 1 Welcome Benefits... of using 3 3 System... Requirements 4 4 Uninstalling... 4 Part II FSM Ribbon 5 Part III FSM Context Menu 5 Part IV Trial Balance 6 1 Read Trial... Balance Data 7 2 Chart... of Accounts 15 3 Adjusting... Entries 22 Part V Building a report 29 1 Balance... Variation 29 2 Suggested... Item Titles 38 3 Item Balance As-Of... Date 48 5 Enterprise... Name 50 6 Total Part VI Report presentation 52 1 Details Comparative Adjusted... Balances 65 4 Rounded Part VII Sheets Manager 80 Part VIII Print 82 Part IX Help 85 Part X About 85 Part XI 87 I
2 II Index 0

3 Introduction 1 1 Introduction is an easy to install, easy to use, and easy to learn add-in for Microsoft Excel which brings the FSM's unique and universal patented method to millions of worldwide users, who build and update financial reports every day. The enhanced Excel spreadsheet software is now a fully integrated financial report generator, where the financial reports are automatically updated with the accounting data of the following periods (e.g. next day, next week, next month, etc.). provides a tremendous amount of flexibility in building customized financial reports, such as: Non typical financial statements such as Non-Profit Organizations Statements of Cash Flow Comparative Quarterly financial statements while ensuring their completeness without excessive review. Its innovative invention is paradigm shifting for financial officers, financial departments, business managers, entrepreneurs and accounting firms, reducing the amount of time spent preparing and reviewing financial reports. is affordable and quickly pays dividends in terms of time and cost saved. The Financial Statement Module Patent describes a unique and universal method to build financial reports with a computer for any type of business or organization (The Method). It also provides the capacity to read, organize, and manipulate the accounting data of any accounting software (Business
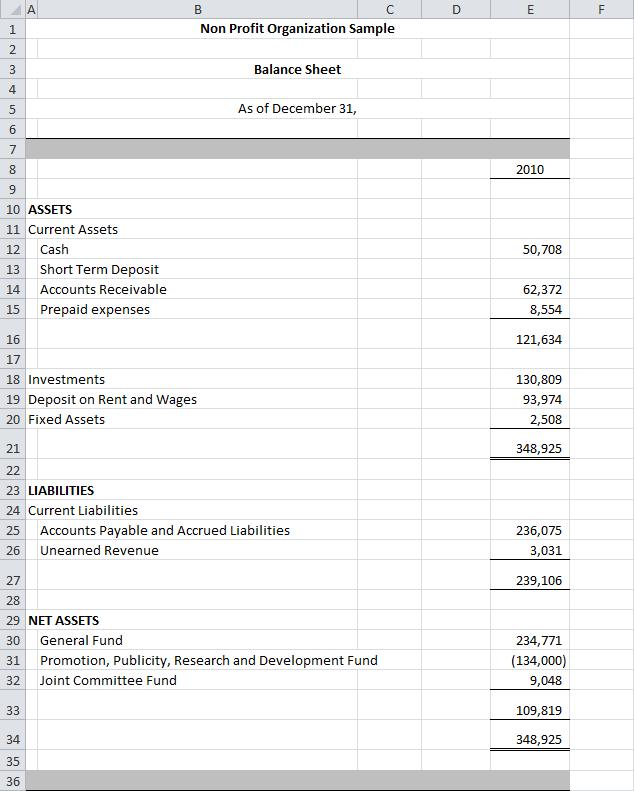
4 2 Intelligence). The FSM invention was submitted for patent protection to an art unit of the United States Patent Office, where the allowance rate is only 16% [see "Business method patents for financial products"], and has been granted Patent 7,139,729. The ROMAD (Reading, Organizing and Manipulating Accounting Data) patent 7,885,868 tells more about the FSM Business Intelligence capacity. 1.1 Welcome Welcome to is the fastest and easiest way to create and update financial reports. Why can't I just use Microsoft Excel or Microsoft Word? Creating financial reports in Microsoft Excel (and Word) is tedious and error-prone. Computing Items and Totals is very labor intensive. There are no Adjusting journal entries. Worst of all, this work must be done again from scratch for each financial period! Further, the reports from each financial period are kept in separate files, making it difficult to compare numbers of various financial periods together. adds to Excel the high level concepts of financial statements: trial balances and the notion of debit and credit, as-of dates, accounts, grouping accounts into financial report Items, grouping Items into Totals, adjusting entries, and more. Not only can you work within Excel naturally, using these high level concepts to build financial reports, but thanks to the business intelligence to read, organize, and manipulate the accounting data of any account software, these financial reports will be updated automatically! Where do I go from here? As you continue to read this help, please refer to the sample workbook "FSM Non Profit Organization Sample xslx", located on your desktop. You can open it in Excel by double clicking its icon, or by performing the File Open command from within Excel.

5 Introduction 3 Click the Right Arrow (Next page) button at the top to continue with the help file. 1.2 Benefits of using How does help? Amounts appearing in a financial report are either an Item balance or a Total. An Item balance results from the grouping of one or more accounts from the Chart of Accounts. A Total results from the grouping of financial report Items. reads the trial balances produced by accounting software, then organizes and stores the data, building a Chart of Accounts. Besides the accounts identifier (number and/or title), initializes a Sense field that will be used further for presentation purposes. This Chart of Accounts can be edited and printed. accesses the accounts so you can easily group them into financial report Items. Items balances are placed into Excel worksheet cells, updated as you perform the grouping. helps you group Items into Totals, which are also placed into Excel worksheet cells, updated as you perform the grouping. also helps you reduce typing by providing Suggested Titles for the financial report Items. even has a button to put the Enterprise name into a cell, and a button to put the As-of date into a cell.
6 4 allows you to record Adjusting Entries. Item balances and Totals are simultaneously updated accordingly while you are recording an entry. allows you to toggle the display of accounts that are grouped into Items, while you are in the sheet of a financial report. updates the financial reports by simply reading the trial balance of the following financial period (next day, week, month, year) and identifies any new accounts, that you simply group into the proper financial reports Items. Even the cells initialized with the As-of date button are updated. manages the trial balance data and financial reports of multiple financial periods by automatically saving copies of your Excel workbook for each financial period. The latest workbook contains the account balances read from the last trial balance, as well as the adjusted balances of all previous financial periods (to enable Comparative presentations). Should you need to refer to your work of a previous financial period, simply open the appropriate Excel workbook identified by the FSM + As-of date + Enterprise name. can display, in your financial report, Comparative balances of selected previous financial periods. You no longer have to print worksheets of prior periods and manually merge to place them side by side in order to compare numbers from one financial period to another. not only displays rounded values, but also computes with the rounded values of the account balances, which provides accuracy. allows you to manage the worksheets from a movable and resizeable dialog that shows all the worksheets at one glance, a handy alternative to manipulating the worksheet tabs at the bottom of the Excel workbook, which can be tedious and time consuming. assists in generating PDF / XPS files for your financial reports and generated worksheets, from with Excel. 1.3 System Requirements To use, you need: A computer running Microsoft Windows XP or later..net 2.0 (included with Microsoft Windows Vista and Windows 7, and a free download for Windows XP). Microsoft Excel 2007, 2010, or Uninstalling There are two ways to uninstall. 1. Run the original.msi installer again. You will be given a choice of repair or remove. 2. Open the Control Panel, select Uninstall a program, and select from the list.
 The FSM ribbon contains buttons, separated into groups ordered from left-to-right reflecting the actions you will do to prepare financial reports.")
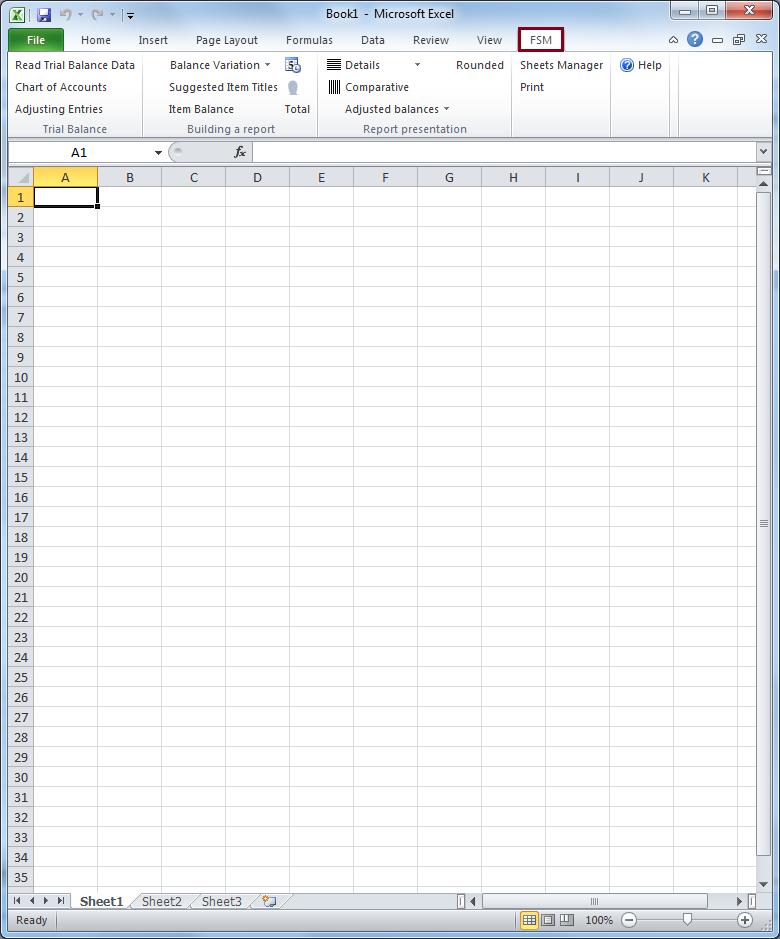
7 Introduction 2 5 FSM Ribbon After installing, an FSM ribbon is added into your Excel: Figure: The ribbon, shown in Excel (The same concepts apply to Excel 2007 and Excel 2013 as well.) The FSM ribbon contains buttons, separated into groups ordered from left-to-right reflecting the actions you will do to prepare financial reports. Trial Balance - Import trial balance data into, which builds/updates a Chart of Accounts that you can edit and print, and allows you to record Adjusting Entries in these accounts. Building a report - Build your financial report by filling Excel cells with the Enterprise name, As-of date, Titles, Items, and Totals. Activate the Balance Variation button to build Cash Flow statements, Quarterly comparative financial statements, financial statement notes. Report Presentation - Extend the presentation of your financial report by toggling various views on and off, including Details (the individual accounts grouped into an Item), Comparative (the balances of the Items and the Totals of previous financial periods), Rounded (with computation being performed with the rounded values), and choosing to select/unselect adjusting entry categories and to show the Adjusted or Unadjusted balances (with or without the computation of the selected categories of Adjusting Entries). Sheets Manager - Travel through the sheets to insert, delete, move and copy sheets, and to create PDF or XPS files for selected sheets. Print - Easily select and print the various worksheets containing the financial reports. Help - Get Help on (what you are reading now). See the following sections to learn about the buttons of each of these groups. 3 FSM Context Menu adds selected ribbon items to the context menu that pops up when you right click on a worksheet cell:

8 6 Figure: Right-clicking a worksheet cell shows has added 3 items for quick access: Suggested Titles Item Balance Total You may find it's easier to access these items from the context menu rather than the ribbon. 4 Trial Balance
9 Trial Balance 7 The Trial Balance buttons let you Read the trial balance data from the accounting software (from a file containing the exported data) and import this data into. View, Edit, and generate a printout sheet for the Chart of Accounts built/updated through the Read process. Record Adjusting Entries in these accounts and generate a printout sheet of these entries. 4.1 Read Trial Balance Data Read Trial Balance Data reads the data from the file containing the trial balance produced by accounting software. The data read from the file by is the account number, the account Title and the account balance (Debit or Credit). Trial Balance in an Excel File For Excel files, assumes that trial balance data is stored in Excel spreadsheets. It should be straightforward to put the trial balance produced by accounting software into an Excel spreadsheet, but as each accounting program has varying capabilities, the exact details are left up to you. Typically you would choose the Export, Save As, or Print To File functions within the accounting program. For the easiest path to get the trial balance data into an Excel spreadsheet: 1. If your accounting software exports to Excel spreadsheets (.xlsx or.xls????) directly, choose this first. These files can be read by directly. 2. If your accounting software exports to Comma Separated Value files (.csv), choose this. These files can be read by directly. 3. If your accounting program exports or prints to text (.txt) files, choose this. Then open this file in Excel and use the Text Import Wizard activated by Excel to break up lines into columns. After ensuring that each account's fields were properly put into the correct columns, save as a spreadsheet (.xlsx), and use the resultant.xlsx file for. NOTE: Often, trial balance files contain extraneous lines of headers, footers, titles, page numbers, etc. attempts to ignore them and to read only the lines which contain true account information (start with the first account with a non zero balance). If you encounter problems, you can workaround them by manually opening the trial balance.xlsx file in Excel, and removing all extraneous rows which don't contain account information. Reading a Trial Balance File Once Excel is running, starting with a blank workbook, select the FSM tab in the ribbon:
10 8

11 Trial Balance 9 Clicking the Read Trial Balance Data button in a blank workbook opens the standard Windows dialog: Figure 1: Trial Balance File selector Select the type of file (bottom right). Select the folder where the file is stored. Select the file containing the desired trial balance data, and click Open. If the file contains more than one worksheet, you will be asked to select the one containing the Trial Balance data. inserts a new sheet named 'Data', temporarily, into your workbook. This inserted 'Data' sheet contains the trial balance data.

12 10 then shows the following dialog to allow you to specify additional information about this trial balance file:

13 Trial Balance 11 Figure 2: Trial Balance Information Name of enterprise - The name of the enterprise will be used to identify the Excel workbook (along with the as of date), to initialize a cell with the Enterprise Name button, in the financial reports. As-of-Date for this Trial Balance - The date of the trial balance will be used, along with the enterprise name, to identify the Excel workbook, to initialize a cell with the As-of Date button, to compute balance variation between two financial periods, as well as to select the Comparative periods balances. NOTE: The above dialog (Figure 2) will be empty if it is a blank workbook. Make sure you put the right as-of date. For subsequent financial periods, you will be updating an existing FSM workbook by reading the trial balance data with another as-of date. The above dialog will be pre-filled according to the previous financial period. It will be important that you update the as-of date to reflect the new period; otherwise, will assume you are re-reading an amended trial balance for an existing period and, if you confirm to proceed, will update the existing period's data instead of processing a new period (Yes, has the capacity to process amended trial balances and automatically

14 12 update the financial reports). has also the capacity to add prior periods to an existing FSM workbook. Specify Worksheet Columns - Specify the letter of the worksheet column containing the account number, the letter of the worksheet column containing the account title, the letter of the worksheet column containing the debit balance and the letter of the worksheet column containing the credit balance, in the trial balance file. For trial balances with debits and credits in one column, simply specify the letter of that column in both fields. NOTE: If account numbers contain '-', the '-' will be replaced by '_' Copy adjusting entries - Check if you want to copy the current adjusting entries for the new financial period. You will be able to edit or delete these according to the new financial period. This feature is useful, for example, if the adjusting entries must be repeated one financial period after the other. Results Click OK. The following actions occur: The trial balance data is imported and organized (The account's number and title are displayed in cell A1 during the process.) A new FSM workbook is created. It's name is <Enterprise> <As-of date>. A new worksheet named 'ReadTBData printout' is inserted into this workbook. (The account's number and title are displayed in cell E1 during the process.) The Chart of Accounts is opened. Updating the Chart of Accounts

15 Trial Balance 13 If this is the first time the workbook has had a trial balance read into it, a Chart of Accounts is built. If the workbook contained previous trial balances, the Chart of Accounts, which was previously built, is updated. The number of new accounts that were added to the Chart of Accounts is displayed: The new accounts are shown at the top of the Chart: You may reorder these new accounts by dragging and dropping with the mouse or by clicking the 'Reorder new accounts' button, whenever you wish. A good time to do so is after you ve grouped them into the proper financial reports Items.
 Data of the trial balance Number of accounts Computed totals")
16 14 Note: Account titles changed in the accounting software will likewise be changed in. ReadTBData printout The ReadTBData printout shows the data read by : Name of enterprise As-of-Date Copy adjusting entries (checked or not) Data of the trial balance Number of accounts Computed totals for Debit and Credit Note: The only purpose for this worksheet is to help you verify that the Trial Balance was read correctly. You may print it, delete it, etc. Updated Reports Any existing reports in your workbook are automatically updated with the new trial balance data: Item balances are updated to reflect the new account balances. Totals are then updated according to the new Item balances. As-of dates are updated. If Transfer adjusting entries was checked, the adjusting entries of the previous financial period are copied into the new financial period. New Workbook created for each subsequent financial period When the trial balance data for a new financial period (i.e. the As-of date has changed) is read and this new financial period is subsequent to the last financial period read, i.e. not a prior period added to an existing FSM workbook, the existing workbook is copied, and the new period's data is read into the new

17 Trial Balance 15 copy of the workbook. Your original workbook will not be altered, and thus will contain only the data from the previous financial period. As more financial periods are read, you will retain a historical series of workbooks, one for each of their respective financial periods. Note: Since the name of the workbook contains the Enterprise name and As-of date, the workbooks are easy to identify. Note: Account balances of previous financial periods are preserved in the new workbook containing the latest financial period and are used for the Comparative presentation. However, you might need to access a historical workbook to see things like the Chart of Accounts as of a previous period, and the Adjusting Entries used in a previous period. 4.2 Chart of Accounts View, edit, re-order, and print the Chart of Accounts that is built from the read trial balance data. Chart of Accounts dialog.
18 16 Each account has it's Number, Title (description), and Sense (Debit or Credit) displayed. The Chart of Accounts dialog is movable and resizable. The bigger you make the window, the more accounts are visible. Insert - Insert a new account above the currently selected account A blank row is inserted into the list Type the account number into the first column Press the Tab key to fill in the Title column Press the Tab key again to specify the Sense (Debit or Credit). Press the Tab key a final time to finish the insertion. Delete - Delete the currently selected account. The account will be deleted only if it has no balance, current or prior, has no adjusting entry, and is not grouped into any Items. Edit Sense - Edit the sense of the currently selected account. Only the account's sense can be changed (not it's account number or title, as these fields uniquely identify the account in subsequent financial periods). NOTE: The default Sense of an account is the accounting sense of the account s balance (Debit or Credit), as read from the trial balance. The Sense of an account is used only for presentation purposes, e.g. in the Account Balance Detail dialog, it allows to show whether an entry increases or decreases the balance of the account.the default Sense of an Item is the Sense of its first grouped account. Re-ordering accounts in the Chart of Accounts The sequence of the accounts in the Chart is of no importance to. You are free to change the order for your convenience. Simply click on the account you wish to move and drag it up and down in the list with the mouse. The list will scroll as you drag near the top and bottom borders. Drop the item at the desired location. Don t be afraid - this will not change the groupings you made for the Items of the financial reports. HINT: Enlarge the Chart of Accounts dialog so that more accounts are visible, and it will be easier to find the desired location in the list. Reading Trial Balance Data of succeeding financial periods, the new accounts are shown at the top of the Chart:
19 Trial Balance 17 You may reorder these new accounts by dragging and dropping with the mouse or by clicking the 'Reorder new accounts' button. Clicking the 'Reorder new accounts' button will move the new accounts in the sequence they were from the previous read trial balance. A good time to do so is after you ve grouped them into the proper financial reports Items. NOTE: In the case where the sequence order of a new account is above or below an account that is in the Chart of Accounts but not in the read trial balance (for example new account in the demo file TB2010 and account 30183, which is in the Chart of accounts but not in TB2010), the new account will be reordered above the account that comes after the account preceding the new account in the read trial balance (30182 preceding in the read trial balance, will be moved above which comes after in the Chart of Accounts). In such particular case, simply complete the reordering of this new account by dragging and dropping with the mouse. Generate Printout Sheet - Generate a new worksheet for the Chart of Accounts, ready to print. Clicking the Generate Printout Sheet button displays the following dialog

20 18 Select With or Without account groupings and click OK A new worksheet is created and a Chart of Accounts printout is generated: With account groupings

21 Trial Balance 19
22 20 Without account groupings
23 Trial Balance 21
24 22 You can edit the worksheet before printing. Note that editing the worksheet will not change the Chart of Accounts. NOTE: Changes made in the chart of accounts and in the financial reports, after the generation of the printout, are not automatically reflected in the printout. Simply generate a new printout to get an updated one. Close - Close the dialog. NOTE: Your changes are preserved whether you dismiss the dialog by clicking either the 'X' or the Close button. Saving the Chart of Accounts The Chart of Accounts is automatically saved in your workbook (Excel file) and is available to any worksheet in the workbook. 4.3 Adjusting Entries Insert, Delete, and Edit adjusting entries. Recording Adjusting entries is the only way (besides reading another trial balance) to change the accounts balances. You CANNOT edit a cell that contains either an Item Balance (the result of the grouping of accounts) or a Total (the result of the grouping of Items). You can toggle the effect of the adjusting entries with the Adjusted balances button in the ribbon.
25 Trial Balance 23 Adjusting Entries dialog. Your Adjusting Entries are shown in the list, one row for each entry line. Each entry has two or more entry lines. Each line specifies an entry number, an entry category, an allocation account and a debit or credit amount. The total of an entry must equal 0. Each entry can have a comment. The comment is displayed in the Allocation Account column, beneath the entry lines. The comment for the selected entry line is also displayed in the textbox at the bottom, where it was originally inserted and where can be directly edited. The dialog is resizable. The bigger you make the window, the more entries are visible. Inserting and Editing an Entry Line Click Insert to insert a new line above the currently selected line. Click Edit to edit the currently selected line. Shortcut: To edit, double-click in the desired line, within the desired column. The Edit dialog will appear, with the caret set into the field that you double-clicked. A new dialog appears for you to fill in or edit the entry line information:

26 24 Entry - Type or select the entry number to which this line belongs Category - You can categorize the adjusting entries to further make a selection for the computation of Adjusted balances. Leaving the field blank means that you don t want to categorize at this time. You can always do that in another time. Account - Choose the allocation account to debit or credit. Change the account by clicking in the textbox or typing Space to open the Allocation Account list:

27 Trial Balance 25 Note: Move and Resize the dialog - the bigger you make the window, the more accounts are visible.

28 26 Shortcut: If you know the desired account number, type it, and it will be highlighted in the account list. To complete the selection, type Enter. The list will close, and the selected account will be chosen. Debit/Credit - Type the amount in the proper field. Use the Tab key to change field. Next line - Inserts the new entry line and keeps the dialog open in preparation to specify another entry line. OK - Inserts or changes the entry line and closes the dialog. Cancel - Ignore any changes and close the dialog.
29 Trial Balance 27 Inserting and Editing an Entry Comment Select any line in the list that is part of the entry whose comment you wish to add or change. Type the desired comment into the Entry Comment textbox. As you type, your comment will also appear in the appropriate place in the list. Saving the Adjusting Entries The Adjusting Entries are automatically saved in your workbook (Excel file) and are available to any worksheet in the workbook. Adjusting Entries affect the current accounting period only. When you Read Trial Balance Data for a new accounting period, the adjusted balances are moved forward and, unless you checked the Transfer Adjusting Entries box in the Read Trial Balance Data dialog, the Adjusting Entries are destroyed. Generate Printout Sheet A new worksheet is generated for the adjusting entries journal, ready to print.

30 28 You can edit the worksheet before printing. Note: Editing the worksheet will not change the adjusting entries. If a category selection is made for the active sheet, the sheet name will appear on the totals row

31 Trial Balance 29 Close - Close the dialog. 5 Building a report The Building a report buttons let you: Activate Balance Variation for e.g. Statement of Cash Flow, financial statement Notes, and Quarterly financial statements. Insert the title of any account into your financial report. Group accounts into an Item and insert its balance into your financial report. Group items into a Total and insert its balance into your financial report. Additional buttons you might find useful when building your report are: Enterprise Name, and As-Of Date. 5.1 Balance Variation The Balance Variation button allows you to build an Item balance with balances for a range of periods. This is used for the Cash Flow statement, financial statement Notes, periodic (Monthly, Quarterly, etc.) financial statements, financial reports combining cumulative and periodic balances on the same column, etc. It is also used for any report where you prefer to create comparative columns manually (as described below) rather than using the Comparative button. Click the Balance Variation Down Arrow, then click Select Periods. This opens the Balance Variation dialog, where you select the beginning period for the range of periods.
32 30 (The number between parentheses is the index of the period used in the FSM formulas, index 0 being the index of the current period, i.e., the index of the last trial balance read.) Check the beginning period and click OK. The Balance Variation is then turned ON. Note: Balance variation button can be turned ON for an existing report. The beginning period will be set to the current period. (Comparative button must be OFF). Click on Item Balance to group accounts into an Item and insert the item s balance into the financial report:

33 Building a report 31 The dialog's title shows the selected beginning and ending periods. The ending period is the current period. If the selected beginning period is also the current period, the title will show [ as of <current period date> ]. Hint: For the Cash Flow Statement, the sense of all Items must be Credit.

34 32 Comparative In some cases, the comparative columns created by turning Comparative ON may not be appropriate, such as for financial statement Notes for example. Balance Variation would then be used instead. Note: When Balance Variation is ON, the Comparative button is disabled. Comparative columns are created manually by: Selecting the 'groupings' column as source range to copy (click on the column letter at the top) Copying this source range (right click + Copy) into a destination range (click on the destination column letter at the top, right click + Paste) Selecting the beginning and ending periods for this comparative column Click on the column letter at the top
 Use the As-of Date button,")

35 Building a report 33 Click on the Balance Variation Down Arrow button Click on Select Period(s) Use the As-of Date button, select the date, then build the Items and then group the Items into a Total: Then select the source range cells to copy & paste:
, and select only one date as the periods")
36 34 Then click the Balance Variation Down Arrow button, click Select Period(s), and select only one date as the periods range:

37 Building a report Here are samples of financial statement Notes: (shown with the Rounded button ON) 35
 (shown with the")

38 36 (shown with the Rounded button ON) (shown with the Rounded button ON) Periodic (Monthly, Quarterly, etc.) financial statements

39 Building a report 37 Balance Variation is also useful for building periodic (Monthly, Quarterly, etc.) financial statements. You are able to present comparative columns with different range of periods. Selecting period or periods range for a range of cells With the Balance Variation button turned ON, you can select a range of cells containing item balances, and select the period or periods range for these item balances. Select a range of cells Click on the Balance Variation Down Arrow button

40 38 Click on Select Period(s) Check the period or periods range and click OK. This feature allows you, for example, to build financial reports combining cumulative and periodic balances on the same column. 5.2 Suggested Item Titles Suggested Item Titles is a quick way to save typing by entering the title of a selected account into a worksheet cell when building your financial report.

41 Building a report 39 Suggested Item Titles shows the titles of the accounts in the Chart of Accounts. Select the desired text, and it will be inserted into the active cell in your worksheet. Dialog position and size The dialog is movable and resizable. The bigger you make the window, the more titles are visible. By default, the dialog is displayed besides the active cell. Once moved and resized, the new settings can become the default settings by checking the Keep Position And Size checkbox. Shortcut: In addition to the FSM ribbon button, access this dialog by right-clicking on a worksheet cell to open its context menu. 5.3 Item Balance Group accounts into an Item and insert the item's balance into your financial report. (Also used to transform item's accounts into items, as shown at the bottom of the topic Details). Clicking the Item Balance ribbon button, double clicking (or right-clicking) on a cell that already contains an Item balance shows:

42 40 Accounts that are grouped into the Item are in the left list. Accounts that are not grouped into this Item (or any other in the worksheet) are in the right list. Note: This means that on a given worksheet, an account can be grouped into only one item. Affecting how the Item Balance is computed The Item Balance is computed as of the date shown in the title of the dialog at the top (e.g. "[ as of 12/31/2009 ]"). If Balance Variation button is ON, it might indicate e.g. [ Variation from <beginning period date> to <ending period date> ] and the balance is computed for that range of periods. Item Sense At the bottom left, the sense of the Item is indicated (e.g. "Debit"). By default, it is the sense of the first grouped account. Click it to change the sense of the Item. For example, in the above image, clicking "Debit" changes the sense of the Item to Credit. Clicking again changes it back to Debit. The sense of an Item allows to know whether or not the computed balance must be shown between parentheses. If the computed balance of an Item has a different sense than the sense of the Item, the balance is shown between parentheses.

43 Building a report 41 Hint: When you want to change the default presentation of an Item, simply change the sense of the Item, in this dialog. Note: This does not change the computation of a balance. This is only for presentation purposes. Dialog position and size The dialog is movable and resizable. The bigger you make the window, the more accounts are visible. By default, the dialog is displayed besides the active cell. Once moved and resized, the new settings can become the default settings by checking the Keep Position And Size checkbox. Account balances The account balances can be shown by checking the Show Account Balances checkbox.
44 42 List All Accounts As mentioned previously, accounts grouped into the Item are in the left list, and accounts not grouped into this Item (or any other in the worksheet) are in the right list, so on a given worksheet, an account can be grouped into only one item. However, there are some situations, such as in financial statement Notes for example, which might require an account to be grouped into more than one item on a given worksheet. Clicking 'List All Accounts' at the bottom right will temporarily list all the accounts (except the accounts that are grouped into the Item) in the Ungrouped Accounts right list, allowing you to group an account into more than one item. Shortcut: In addition to the FSM ribbon button, access this dialog by right-clicking on a worksheet cell to open its context menu, or by double-clicking on a cell that already contains an Item Balance. Grouping / Ungrouping To move accounts from one list to the other, double-click on a single account, or select one or more accounts, and then click the Move button. They will be moved to the other list, in the direction of the arrow shown in the Move button. Selection Clicking a single account selects it. Hold down the Ctrl key while clicking accounts (or pressing the Space bar), to select multiple accounts Hold down the Shift key while clicking accounts (or pressing the display keys), to select all the accounts in between. Move Selected Account(s) Click the Move button (or press the Enter key) to move the selected account(s). When moving account(s) to the Grouped Accounts list, the accounts will be moved above the selected account in the Grouped Accounts list. When moving account(s) to the Ungrouped Accounts list, the accounts will be placed in the order they are shown in the Chart of Accounts. When accounts are moved, the Item's balance is re-computed, and displayed immediately in the cell. Order of accounts in the lists The Grouped Accounts list is maintained according to how the accounts were grouped (and is subject to the user's preference). In order to change the order of the Grouped Accounts, individual accounts must be ungrouped, then re-grouped in the correct position. The Ungrouped Accounts list is maintained in the same order as they appear in the Chart of
45 Building a report 43 Accounts Saving an Item When satisfied with the Grouped Accounts, click the 'X' in the upper right corner. Your changes will be preserved, and the dialog will close. Effects of Grouping Changes If your worksheets contain comparative columns, the Item's grouping within the comparative periods will also be changed. Item grouping can be changed in any period. Copying Item Balances Item Balances are quickly recognizable because they have a cell formula starting with =FSMITEMBALANCE, e.g.: =FSMITEMBALANCE(" d-b3b1-aca16f6e9443, D, 0, 0") You must be very careful when copying cells or worksheets containing Item Balances. If you copy cells or sheets that contains FSMITEMBALANCE formulas, you will end up with Items with formulas having the same grouping in more than one cell. Consequently, if you change the grouping or the sense of such an Item in one cell, it will be modified in the other cells as well. To change the grouping of such an Item in one cell without modifying the other cells, use the NewId button. NewId: this button replaces the item's unique identifier (the first parameter '42...3' in the formula) with a new one. Copying Item Balances and using the NewId button can be really useful for the building of the financial statement Notes and for the Statement of Cash Flows, as shown in the following sample:
46 44 Copying an Item Balance cell from the Balance Sheet to the Statement of Cash Flows

47 Building a report Clicking the NewId button: the item's unique identifier is replaced with a new one in the formula 45

48 46 Here is the formula, and its resulting value, after changing the sense of the Item to Credit and after selecting the periods range

49 Building a report 47 Hint for cell format The cell format for balances can be customized by adding ;; at its end, to show zero balance as blank.

50 As-Of Date Insert the As-Of date of the current accounting period into the active cell. The As-of date was specified when you last performed a Read Trial Balance Data. HINT: You may change the format of the As-of date, as you desire by formatting the cell within Excel. Date format can be customized to show only the year, by keeping only yyyy

51 Building a report 49 If the Balance Variation button is ON, you will be prompted to select a date. (The number between parentheses is the index of the period used in the FSM formulas, index 0 being the index of the current period, i.e., the index of the last trial balance read.)

52 Enterprise Name Insert the Enterprise name into the active cell. The Enterprise name was specified when you last performed a Read Trial Balance Data. 5.6 Total Group Items into a Total and insert the total's balance into your financial report. The way the dialog works for Grouping Totals is very similar to Grouping Items. Items that are grouped into the Total are in the left list. Items that are not grouped into this Total are in the right list. Only Items in cells appearing "before" the Total cell can be grouped into the Total. This includes Items: In the same column and a previous row to the Total cell In the same row and previous column to the Total cell In a previous row and column Dialog position and size

53 Building a report 51 The dialog is movable and resizable. The bigger you make the window, the more items are visible. By default, the dialog is displayed besides the active cell. Once moved and resized, the new settings can become the default settings by checking the Keep Position And Size checkbox. Item balances The item balances can be shown by checking the Show Item Balances checkbox. List All Items As mentioned previously, only Items in cells appearing "before" the Total cell can be grouped into the Total. However, there are some situations, such as in financial statement Notes for example, which might require an item appearing "after" the Total to be grouped into the Total. Clicking 'List All Items' at the bottom right will temporarily list all the items (except the items that are grouped into the Total) in the Ungrouped Items right list, allowing you to group an item appearing "after" the Total cell. Shortcut: In addition to the FSM ribbon button, access this dialog by right-clicking on a worksheet cell to open its context menu, or by double-clicking on a cell that already contains a Total. To move items from one list to the other, double-click on a single item, or select one or more items, and then click the Move button. They will be moved to the other list, in the direction of the arrow shown in the Move button. Selection Clicking a single item (or pressing the Space bar) selects it.
 Click the Move button (or press the Enter key) to move the selected item(s).")
54 52 Hold down the Ctrl key while clicking items (or pressing the Space bar), to select multiple items Hold down the Shift key while clicking items (or pressing the Space bar), to select all the items in between. Move Selected Item(s) Click the Move button (or press the Enter key) to move the selected item(s). When moving item(s) to the Grouped Items list, the items will be moved above the selected item in the Grouped Items list. When moving item(s) to the Ungrouped Items list, the items will be placed in the order they appear in the worksheet. When items are moved, the Total's balance is re-computed, and displayed immediately in the cell. Order of items in the lists The Grouped Items list is maintained according to how the items were grouped (and is subject to the user's preference). In order to change the order of the Grouped Items, individual items must be ungrouped, then re-grouped in the correct position. Note: For presentation purposes, the Sense of the total is defined by the Sense of the first grouped item. To change the Sense of a Total, simply edit the Sense of the first item (see Item Balance for further details). The Ungrouped Items list is maintained in the same order as they appear in the worksheet. Saving a Total When satisfied with the Grouped Items, click the 'X' in the upper right corner. Your changes will be preserved, and the dialog will close. FSM Total Formula Totals are quickly recognizable because they have a cell formula starting with =1*, e.g.: =1*(+E$8+E$9+E$10) 6 Report presentation
55 Report presentation 53 The Report presentation buttons let you: Toggle the display of Item Details. Details are additional rows in the worksheet showing the accounts which are grouped into the item. Toggle the display of previous accounting periods, for comparative purposes. Comparative is additional columns in the worksheet showing the account, item, and total balances of previous financial periods. Toggle whether to ignore the Adjusting Entries and show the Unadjusted balances of accounts, items, and totals. Toggle whether to display the balances with or without decimals. Note that will not only display the rounded values, but will also perform computations using these rounded values. 6.1 Details Details toggles the display of an Item's accounts. To illustrate, here is a sheet with a financial report. It is shown first with Details turned Off, then with Details turned On for the first Item: Details turned Off

56 54 Details turned On for the first Item

57 Report presentation 55 Figure 1: When Details are turned on, the accounts grouped in the Item are shown. Notice how rows are inserted to show the accounts for the "Cash" Item.


58 56 Double clicking on an account's balance provide the detail of the account's balance and double clicking on an adjusting entry from the Account Balance Detail provide the detail of the journal entry You can also choose not to have the account numbers shown:
59 Report presentation Figure 2: Details are turned on for the first Item, but the account numbers are not shown. 57
60 58 The detail rows are inserted prior to the Item balance, separated by cell borders: a top border is added in the Item balance cell with Details ON, and removed with Details OFF. Toggling an Item's Details Select the item(s) in the worksheet that you wish to toggle: Click a single item Hold down the Ctrl key while clicking to select multiple items Hold down the Shift key while clicking items to select all the items in between. Click an item and drag the mouse to select the items within the rectangle you drag. Select all the items in the worksheet by clicking the square in the upper left corner of the worksheet: Details are toggled based on the state of the first selected item. If the first selected item does not have its details showing, then details are shown for all the selected items. Conversely, if the first selected item does have its details showing, then details are removed for all the selected items. Note: The Details button is pushed (or not pushed) when the active cell contains (or does not contain) details, respectively. Show Account Numbers In Details Whether or not Account Numbers are shown is determined by the Details ribbon button. Click on the arrow next to the Details to select from the drop down menu: The next time you press the Details button, your choice will be used. Formulas The formulas in the cells containing details are e.g. =FSMACCOUNTTITLE("8") =FSMACCOUNTBALANCE("8, D, 0, 0")
61 Report presentation Transforming Item's Accounts Into Items From the toggled Details of an Item (shown without account numbers in the following sample) you can select accounts 59
62 60 then click the Item Balance button from the FSM ribbon and choose to transform the selected accounts into one item per selected account or into one item for all selected accounts
63 Report presentation Selected accounts transformed into one item per selected account: Selected accounts transformed into one item for all selected accounts: 61
64 Comparative Comparative toggles the display of selected previous financial periods, for comparative presentation. To illustrate, here is a financial statement with current period balances:
65 Report presentation 63
66 64 Here is the same report with Comparative turned on:

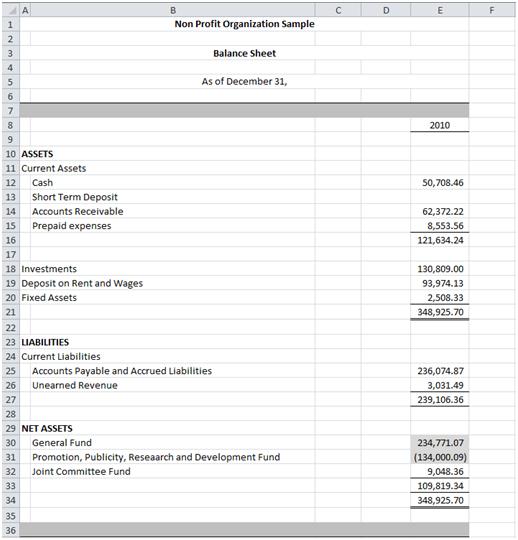
67 Report presentation 65 The previous period's balances are shown in column F (adjacent to the report's item balances, in column E). Note: Blank columns can be inserted between periods, for clarity. Toggling Comparative Periods Comparative periods can be shown or hidden separately, for each worksheet in your workbook. When the active worksheet has Comparative turned on, the Comparative button is pushed in. When turning Comparative on, you will be prompted to select the previous periods you wish to show: (The number between parentheses is the index of the period used in the FSM formulas, index 0 being the index of the current period, i.e., the index of the last trial balance read.) Each period that you read a Trial Balance for will be shown. Check the periods you desire, and click OK. One column will be added for each selected period. The number of comparative periods that can be presented is limited only by the number of columns available in Excel. Clicking Cancel leaves Comparative turned off. Note that if a financial report was built with the Balance Variation button ON (such as the Cash Flow statement, Quarterly financial statements, financial statement Notes), the Comparative button will be disabled. Comparative columns will be done manually by copying the current period column and then select periods range by clicking the Balance Variation Down Arrow button. 6.3 Adjusted Balances The Adjusted balances button allows you to look at your financial report with or without the computation of the adjusting entries. If the button is OFF, the unadjusted balances of accounts, items and totals will be displayed by having ignore the adjusting entries. By default, the button is ON. If turned ON, balances will be updated with the Adjusting Entries.
68 66
69 Report presentation 67
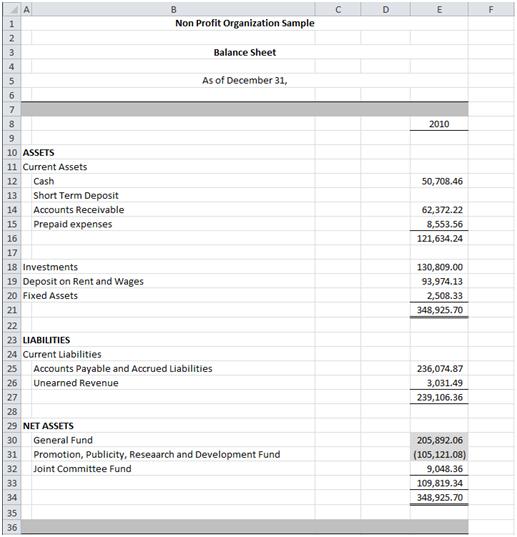
70 68 If turned OFF, balances will be updated to ignore any Adjusting Entries.
71 Report presentation 69
72 70

73 Report presentation Note: Each worksheet remembers its own Adjusted/Unadjusted state. Adjusting entry categories If you categorized some adjusting entries 71

74 72 Clicking on the Adjusted balances down arrow button allows selecting/unselecting adjusting entry categories for the computation of the adjusted balances. Note that by default, categories are selected.

75 Report presentation 73 Turning the Adjusted balances button ON, balances will be updated with the Adjusting Entries of the selected categories.
, and selected categories letters remains")
76 74 Looking at the Adjusting Entries, the unselected category letters are lowercased replacing blank), and selected categories letters remains uppercased.

77 Report presentation 75 Note: Each worksheet remembers its own category selection NOTE: The Adjusting Entries affect the current financial period balances only, and not the balances of previous financial periods. 6.4 Rounded The Rounded button allows you to look at your financial report with the rounded balances of accounts, items and totals, by having rounding the value of the accounts balances. If turned ON, balances will be displayed and computed with rounded values. If turned OFF, balances will be displayed and computed with decimals values. Each worksheet remembers its own Rounded state. Excel rounding to 0 decimal with Format Cells Number. Here is a sample of a financial statement displayed with decimals values:
78 76
79 Report presentation By changing the decimal places to 0 in the Format Cells Number, we get the financial statement displayed with rounded values: 77
80 78 As it can be observed in the Assets section for example, and in the Liabilities + Net Assets section as well, changing the decimal places to 0 in the Format Cells Number results in accuracy problems.: = not as displayed in the Assets section = not as displayed in the Liabilities + Net Assets section. This is because Excel only rounded the display of the value of each cell, while still performing computation with the decimals values. rounding process By turning On the Rounded button, not only displays rounded values, but also computes with the rounded values of the accounts balances, which provides accuracy:
81 Report presentation 79
82 80 The rounding Adjusting Entry As any accountant is familiar with, the rounding process sometimes results in an out of balance of 1 between the Total Assets and the Total Liabilities & Equity. To rectify that we simply record an adjusting entry, and since performs computations with the rounded values of the accounts balances, we simply need to debit/credit an account balance by an amount that will change the rounded value by 1, while, on the other hand, the rounded value of the counter part must not change. Another way to rectify this out of balance is to add a 'Rounding account' to the Chart of Accounts, then record an adjusting entry to debit/credit an account balance by the out of balance amount using this 'Rounding account' for the counter part, and leave this 'Rounding account' ungrouped into any item. 7 Sheets Manager View, insert, re-order, copy, update,and create PDF or XPS files for selected sheets in the workbook.

83 Sheets Manager 81 The financial reports can represent a lot of sheets in the workbook. Managing these sheets from the worksheet tabs at the bottom of Excel can be tedious and time consuming. The Sheets Manager allows to see all the sheets at one glance. The Sheets Manager dialog is movable and resizable. The bigger you make the window, the more sheets are visible. Simply click on a sheet to make this sheet active. Click Insert to insert a sheet before this active sheet Click Move to move the active sheet, by selecting the sheet to move it before and then click move again.
84 82 Click Copy to make a copy of the active sheet To delete sheet(s), check the desired sheet(s), then click Delete. To create a PDF or XPS file, check the desired sheet(s), then click Create PDF or XPS To rename the active sheet, use the tag at the bottom and right click - Rename 8 Print The Print Report button lets you easily Print Preview (then Print if desired) selected worksheets in the active workbook. When you click the button, a dialog allows you to see all the sheets at one glance. This dialog is movable and resizable. The bigger you make the window, the more sheets are visible: (Note that clicking on a sheet make it the active sheet)

85 Print Check the desired sheets, then click Print to show the Print Preview: 83

86 84 The Excel Print Preview dialog.

87 Print 85 From here, you can click Print, Page Setup, etc. to adjust your printout or simply click the 'X' to abort. Note that you can also click on a sheet to make it the active sheet, and then use the Excel menu item File Print. 9 Help The Help button shows this Help file. For up to date news, please see 10 About Running without a license, the following dialog is displayed Running with a license, the following dialog is displayed
Table of Contents. Part I Introduction. Part II FSM Ribbon. Part III FSM Context Menu. Part IV Trial Balance. Part V Building a report
 Contents I Table of Contents Part I Introduction 1 1 Welcome... 2 2 Benefits... of using 2 3 System... Requirements 3 4 Uninstalling... 4 Part II FSM Ribbon 4 Part III FSM Context Menu 5 Part IV Trial
Table of Contents. Part I Introduction. Part II FSM Ribbon. Part III FSM Context Menu. Part IV Trial Balance. Part V Building a report
 Contents I Table of Contents Part I Introduction 1 1 Welcome... 2 2 Benefits... of using 3 3 System... Requirements 4 4 Uninstalling... 5 Part II FSM Ribbon 5 Part III FSM Context Menu 6 Part IV Trial
Excel Intermediate
 Excel 2013 - Intermediate (103-124) Multiple Worksheets Quick Links Manipulating Sheets Pages EX16 EX17 Copying Worksheets Page EX337 Grouping Worksheets Pages EX330 EX332 Multi-Sheet Cell References Page
Excel Template Instructions for the Glo-Brite Payroll Project (Using Excel 2010 or 2013)
") Excel Template Instructions for the Glo-Brite Payroll Project (Using Excel 2010 or 2013) T APPENDIX B he Excel template for the Payroll Project is an electronic version of the books of account and payroll
Excel Template Instructions for the Glo-Brite Payroll Project (Using Excel 2010 or 2013) T APPENDIX B he Excel template for the Payroll Project is an electronic version of the books of account and payroll
Microsoft Excel 2010 Part 2: Intermediate Excel
 CALIFORNIA STATE UNIVERSITY, LOS ANGELES INFORMATION TECHNOLOGY SERVICES Microsoft Excel 2010 Part 2: Intermediate Excel Spring 2014, Version 1.0 Table of Contents Introduction...3 Working with Rows and
Contents Table of Contents Part I Introduction Part II Setting up Word
 Contents I Table of Contents Part I Introduction 1 Part II Setting up Word 1 1 Setting... up Font 2 2 Setting... up Paragraph 3 3 Setting... up Margins 4 4 Setting... up Tabs 5 5 Setting... up Underlines
Excel 2007 New Features Table of Contents
 Table of Contents Excel 2007 New Interface... 1 Quick Access Toolbar... 1 Minimizing the Ribbon... 1 The Office Button... 2 Format as Table Filters and Sorting... 2 Table Tools... 4 Filtering Data... 4
Learning Worksheet Fundamentals
 1.1 LESSON 1 Learning Worksheet Fundamentals After completing this lesson, you will be able to: Create a workbook. Create a workbook from a template. Understand Microsoft Excel window elements. Select
Financial Statement WalkThrough
 WORKPAPERS CS Financial Statement WalkThrough version 2015.x.x TL 29655 (12/21/15) Copyright Information Text copyright 2009-2015 by Thomson Reuters. All rights reserved. Video display images copyright
Microsoft Excel Level 2
 Microsoft Excel Level 2 Table of Contents Chapter 1 Working with Excel Templates... 5 What is a Template?... 5 I. Opening a Template... 5 II. Using a Template... 5 III. Creating a Template... 6 Chapter
INTRODUCTION... 1 UNDERSTANDING CELLS... 2 CELL CONTENT... 4
 Introduction to Microsoft Excel 2016 INTRODUCTION... 1 The Excel 2016 Environment... 1 Worksheet Views... 2 UNDERSTANDING CELLS... 2 Select a Cell Range... 3 CELL CONTENT... 4 Enter and Edit Data... 4
Tips & Tricks: MS Excel
 Tips & Tricks: MS Excel 080501.2319 Table of Contents Navigation and References... 3 Layout... 3 Working with Numbers... 5 Power Features... 7 From ACS to Excel and Back... 8 Teacher Notes: Test examples
MS Excel Henrico County Public Library. I. Tour of the Excel Window
 MS Excel 2013 I. Tour of the Excel Window Start Excel by double-clicking on the Excel icon on the desktop. Excel may also be opened by clicking on the Start button>all Programs>Microsoft Office>Excel.
Office 2016 Excel Basics 25 Video/Class Project #37 Excel Basics 25: Power Query (Get & Transform Data) to Convert Bad Data into Proper Data Set
 to Convert Bad Data into Proper Data Set") Office 2016 Excel Basics 25 Video/Class Project #37 Excel Basics 25: Power Query (Get & Transform Data) to Convert Bad Data into Proper Data Set Goal in video # 25: Learn about how to use the Get & Transform
Office 2016 Excel Basics 25 Video/Class Project #37 Excel Basics 25: Power Query (Get & Transform Data) to Convert Bad Data into Proper Data Set Goal in video # 25: Learn about how to use the Get & Transform
6. Essential Spreadsheet Operations
 6. Essential Spreadsheet Operations 6.1 Working with Worksheets When you open a new workbook in Excel, the workbook has a designated number of worksheets in it. You can specify how many sheets each new
Workbook Also called a spreadsheet, the Workbook is a unique file created by Excel. Title bar
 Microsoft Excel 2007 is a spreadsheet application in the Microsoft Office Suite. A spreadsheet is an accounting program for the computer. Spreadsheets are primarily used to work with numbers and text.
Candy is Dandy Project (Project #12)
") Candy is Dandy Project (Project #12) You have been hired to conduct some market research about M&M's. First, you had your team purchase 4 large bags and the results are given for the contents of those
Candy is Dandy Project (Project #12) You have been hired to conduct some market research about M&M's. First, you had your team purchase 4 large bags and the results are given for the contents of those
MS Excel Henrico County Public Library. I. Tour of the Excel Window
 MS Excel 2013 I. Tour of the Excel Window Start Excel by double-clicking on the Excel icon on the desktop. Excel may also be opened by clicking on the Start button>all Programs>Microsoft Office>Excel.
Microsoft Excel 2010
 Microsoft Excel 2010 omar 2013-2014 First Semester 1. Exploring and Setting Up Your Excel Environment Microsoft Excel 2010 2013-2014 The Ribbon contains multiple tabs, each with several groups of commands.
Rev. C 11/09/2010 Downers Grove Public Library Page 1 of 41
 Table of Contents Objectives... 3 Introduction... 3 Excel Ribbon Components... 3 Office Button... 4 Quick Access Toolbar... 5 Excel Worksheet Components... 8 Navigating Through a Worksheet... 8 Making
Microsoft Excel 2010 Tutorial
 1 Microsoft Excel 2010 Tutorial Excel is a spreadsheet program in the Microsoft Office system. You can use Excel to create and format workbooks (a collection of spreadsheets) in order to analyze data and
Using Microsoft Excel
 Using Microsoft Excel Excel contains numerous tools that are intended to meet a wide range of requirements. Some of the more specialised tools are useful to people in certain situations while others have
2. create the workbook file
 2. create the workbook file Excel documents are called workbook files. A workbook can include multiple sheets of information. Excel supports two kinds of sheets for working with data: Worksheets, which
WEEK NO. 12 MICROSOFT EXCEL 2007
 WEEK NO. 12 MICROSOFT EXCEL 2007 LESSONS OVERVIEW: GOODBYE CALCULATORS, HELLO SPREADSHEET! 1. The Excel Environment 2. Starting A Workbook 3. Modifying Columns, Rows, & Cells 4. Working with Worksheets
Using Microsoft Excel
 About Excel Using Microsoft Excel What is a Spreadsheet? Microsoft Excel is a program that s used for creating spreadsheets. So what is a spreadsheet? Before personal computers were common, spreadsheet
MultiSite Suite: General Ledger
 MultiSite Suite: General Ledger User s Manual version 2.2.97 Copyright & Trademarks Copyright Notice and Trademarks 2003 by Brent Lawrence, LLC. All rights reserved. Reprinted and edited by MultiSite Systems,
Introduction to Excel
 Office Button, Tabs and Ribbons Office Button The File menu selection located in the upper left corner in previous versions of Excel has been replaced with the Office Button in Excel 2007. Clicking on
Spreadsheet Microsoft Excel 2010
 Spreadsheet Microsoft Excel 2010 Prepared by: Teo Siew Copyright 2017 MAHSA UNIVERSITY Faculty of Business, Finance, and Hospitality Spreadsheet A type of application program which manipulates numerical
Introductory Excel Walpole Public Schools. Professional Development Day March 6, 2012
 Introductory Excel 2010 Walpole Public Schools Professional Development Day March 6, 2012 By: Jessica Midwood Agenda: What is Excel? How is Excel 2010 different from Excel 2007? Basic functions of Excel
Excel Shortcuts Increasing YOUR Productivity
 Excel Shortcuts Increasing YOUR Productivity CompuHELP Division of Tommy Harrington Enterprises, Inc. tommy@tommyharrington.com https://www.facebook.com/tommyharringtonextremeexcel Excel Shortcuts Increasing
Using Microsoft Excel
 Using Microsoft Excel Table of Contents The Excel Window... 2 The Formula Bar... 3 Workbook View Buttons... 3 Moving in a Spreadsheet... 3 Entering Data... 3 Creating and Renaming Worksheets... 4 Opening
Chapter 2: Clients, charts of accounts, and bank accounts
 Chapter 2: Clients, charts of accounts, and bank accounts Most operations in BankLink Practice are client specific. These include all work on coding transactions, reporting, and maintaining chart of accounts
A PRACTICAL TUTORIAL TO EXCEL
 2010 BEGINNERS A PRACTICAL TUTORIAL TO EXCEL by: Julio C. Fajardo A Practical Tutorial to Excel About: Excel is one of the early software tools developed by Microsoft. The program has been widely adopted
Excel Select a template category in the Office.com Templates section. 5. Click the Download button.
 Microsoft QUICK Excel 2010 Source Getting Started The Excel Window u v w z Creating a New Blank Workbook 2. Select New in the left pane. 3. Select the Blank workbook template in the Available Templates
DOING MORE WITH EXCEL: MICROSOFT OFFICE 2013
 DOING MORE WITH EXCEL: MICROSOFT OFFICE 2013 GETTING STARTED PAGE 02 Prerequisites What You Will Learn MORE TASKS IN MICROSOFT EXCEL PAGE 03 Cutting, Copying, and Pasting Data Basic Formulas Filling Data
Using Microsoft Excel
 Using Microsoft Excel Files in Microsoft Excel are referred to as Workbooks. This is because they can contain more than one sheet. The number of sheets a workbook can contain is only limited by your computer
Microsoft Excel Microsoft Excel
 Excel 101 Microsoft Excel is a spreadsheet program that can be used to organize data, perform calculations, and create charts and graphs. Spreadsheets or graphs created with Microsoft Excel can be imported
Excel Tables and Pivot Tables
 A) Why use a table in the first place a. Easy to filter and sort if you only sort or filter by one item b. Automatically fills formulas down c. Can easily add a totals row d. Easy formatting with preformatted
NorthStar Club Management System
 NorthStar Club Management System The Version 3.2.0 GL- 03252008 March 25, 2008 CONTENTS OVERVIEW OF THE GL (GENERAL LEDGER) MODULE... 5 ACCESSING THE GL MODULE... 6 GL INTRODUCTION:... 8 Inquiry... 8 Admin...
Making an entry into the CIS Payments workbook
 Making an entry into the CIS Payments workbook By now you should have carried out the CIS Payments workbook Setup. If you have not done so you will need to do this before you can proceed. When you have
Spreadsheet definition: Starting a New Excel Worksheet: Navigating Through an Excel Worksheet
 Copyright 1 99 Spreadsheet definition: A spreadsheet stores and manipulates data that lends itself to being stored in a table type format (e.g. Accounts, Science Experiments, Mathematical Trends, Statistics,
Intermediate Excel 2016
 Intermediate Excel 2016 Relative & Absolute Referencing Relative Referencing When you copy a formula to another cell, Excel automatically adjusts the cell reference to refer to different cells relative
MICROSOFT Excel 2010 Advanced Self-Study
 MICROSOFT Excel 2010 Advanced Self-Study COPYRIGHT This manual is copyrighted: S&G Training Limited. This manual may not be copied, photocopied or reproduced in whole or in part without the written permission
Microsoft Office Excel 2003
 Microsoft Office Excel 2003 Tutorial 1 Using Excel To Manage Data 1 Identify major components of the Excel window Excel is a computerized spreadsheet, which is an important business tool that helps you
Creating a Spreadsheet by Using Excel
 The Excel window...40 Viewing worksheets...41 Entering data...41 Change the cell data format...42 Select cells...42 Move or copy cells...43 Delete or clear cells...43 Enter a series...44 Find or replace
Excel 2003 Tutorial II
 This tutorial was adapted from a tutorial by see its complete version at http://www.fgcu.edu/support/office2000/excel/index.html Excel 2003 Tutorial II Charts Chart Wizard Chart toolbar Resizing a chart
Excel 2016: Part 2 Functions/Formulas/Charts
 Excel 2016: Part 2 Functions/Formulas/Charts Updated: March 2018 Copy cost: $1.30 Getting Started This class requires a basic understanding of Microsoft Excel skills. Please take our introductory class,
Excel 2016: Part 1. Updated January 2017 Copy cost: $1.50
 Excel 2016: Part 1 Updated January 2017 Copy cost: $1.50 Getting Started Please note that you are required to have some basic computer skills for this class. Also, any experience with Microsoft Word is
Microsoft Excel Chapter 1. Creating a Worksheet and an Embedded Chart
 Microsoft Excel 2010 Chapter 1 Creating a Worksheet and an Embedded Chart Objectives Describe the Excel worksheet Enter text and numbers Use the Sum button to sum a range of cells Copy the contents of
Excel Macros, Links and Other Good Stuff
 Excel Macros, Links and Other Good Stuff COPYRIGHT Copyright 2001 by EZ-REF Courseware, Laguna Beach, CA http://www.ezref.com/ All rights reserved. This publication, including the student manual, instructor's
I OFFICE TAB... 1 RIBBONS & GROUPS... 2 OTHER SCREEN PARTS... 4 APPLICATION SPECIFICATIONS... 5 THE BASICS...
 EXCEL 2010 BASICS Microsoft Excel I OFFICE TAB... 1 RIBBONS & GROUPS... 2 OTHER SCREEN PARTS... 4 APPLICATION SPECIFICATIONS... 5 THE BASICS... 6 The Mouse... 6 What Are Worksheets?... 6 What is a Workbook?...
EXCEL 2003 DISCLAIMER:
 EXCEL 2003 DISCLAIMER: This reference guide is meant for experienced Microsoft Excel users. It provides a list of quick tips and shortcuts for familiar features. This guide does NOT replace training or
Microsoft Excel 2010
 www.jadehorizon.com Microsoft Excel 2010 Sorting and Filtering Sorting and Filtering Microsoft Excel 2010 Table of Contents Table of Contents INTRODUCTION... 3 CONVENTIONS... 3 TABLE DESIGN RULES... 5
Excel 2013 for Beginners
 Excel 2013 for Beginners Class Objective: This class will familiarize you with the basics of using Microsoft Excel. Class Outline: Introduction to Microsoft Excel 2013... 1 Microsoft Excel...2-3 Getting
Introduction to Microsoft Excel
 Athens-Clarke County Library Page 1 What is a spreadsheet program? Microsoft Excel is an example of a spreadsheet program that will maintain records for you relating to finances, products, activities,
EVALUATION COPY. Unauthorized Reproduction or Distribution Prohibited
 INTRODUCTION TO MICROSOFT EXCEL 2016 Introduction to Microsoft Excel 2016 (EXC2016.1 version 1.0.1) Copyright Information Copyright 2016 Webucator. All rights reserved. The Authors Dave Dunn Dave Dunn
Intro to Excel. To start a new workbook, click on the Blank workbook icon in the middle of the screen.
 Excel is a spreadsheet application that allows for the storing, organizing and manipulation of data that is entered into it. Excel has variety of built in tools that allow users to perform both simple
Sage Financial Reporter User's Guide. May 2017
 Sage 300 2018 Financial Reporter User's Guide May 2017 This is a publication of Sage Software, Inc. 2017 The Sage Group plc or its licensors. All rights reserved. Sage, Sage logos, and Sage product and
Excel 2007 Fundamentals
 Excel 2007 Fundamentals Introduction The aim of this document is to introduce some basic techniques for using Excel to enter data, perform calculations and produce simple charts based on that information.
The American University in Cairo. Academic Computing Services. Excel prepared by. Maha Amer
 The American University in Cairo Excel 2000 prepared by Maha Amer Spring 2001 Table of Contents: Opening the Excel Program Creating, Opening and Saving Excel Worksheets Sheet Structure Formatting Text
Gloucester County Library System EXCEL 2007
 Gloucester County Library System EXCEL 2007 Introduction What is Excel? Microsoft E x c e l is an electronic s preadsheet program. I t is capable o f performing many diff e r e n t t y p e s o f c a l
Excel 2013 Charts and Graphs
 Excel 2013 Charts and Graphs Copyright 2016 Faculty and Staff Training, West Chester University. A member of the Pennsylvania State System of Higher Education. No portion of this document may be reproduced
EXCEL BASICS: MICROSOFT OFFICE 2007
 EXCEL BASICS: MICROSOFT OFFICE 2007 GETTING STARTED PAGE 02 Prerequisites What You Will Learn USING MICROSOFT EXCEL PAGE 03 Opening Microsoft Excel Microsoft Excel Features Keyboard Review Pointer Shapes
SUM - This says to add together cells F28 through F35. Notice that it will show your result is
 COUNTA - The COUNTA function will examine a set of cells and tell you how many cells are not empty. In this example, Excel analyzed 19 cells and found that only 18 were not empty. COUNTBLANK - The COUNTBLANK
Budget Exercise for Intermediate Excel
 Budget Exercise for Intermediate Excel Follow the directions below to create a 12 month budget exercise. Read through each individual direction before performing it, like you are following recipe instructions.
Gloucester County Library System. Excel 2010
 Gloucester County Library System Excel 2010 Introduction What is Excel? Microsoft Excel is an electronic spreadsheet program. It is capable of performing many different types of calculations and can organize
Microsoft Excel Office 2016/2013/2010/2007 Tips and Tricks
 Microsoft Excel Office 2016/2013/2010/2007 Tips and Tricks In Office 2007, the OFFICE BUTTON is the symbol at the top left of the screen. 1 Enter Fractions That Will Display And Calculate Properly a. Type
Microsoft Excel 2007
 Learning computers is Show ezy Microsoft Excel 2007 301 Excel screen, toolbars, views, sheets, and uses for Excel 2005-8 Steve Slisar 2005-8 COPYRIGHT: The copyright for this publication is owned by Steve
Exploring extreme weather with Excel - The basics
 Exploring extreme weather with Excel - The basics These activities will help to develop your data skills using Excel and explore extreme weather in the UK. This activity introduces the basics of using
CSV Roll Documentation
 CSV Roll Documentation Version 1.1 March 2015 INTRODUCTION The CSV Roll is designed to display the contents of a Microsoft Excel worksheet in a Breeze playlist. The Excel worksheet must be exported as
Chapter 4. Microsoft Excel
 Chapter 4 Microsoft Excel Topic Introduction Spreadsheet Basic Screen Layout Modifying a Worksheet Formatting Cells Formulas and Functions Sorting and Filling Borders and Shading Charts Introduction A
Formulas Learn how to use Excel to do the math for you by typing formulas into cells.
 Microsoft Excel 2007: Part III Creating Formulas Windows XP Microsoft Excel 2007 Microsoft Excel is an electronic spreadsheet program. Electronic spreadsheet applications allow you to type, edit, and print
Microsoft Excel Chapter 2. Formulas, Functions, and Formatting
 Microsoft Excel 2010 Chapter 2 Formulas, Functions, and Formatting Objectives Enter formulas using the keyboard Enter formulas using Point mode Apply the AVERAGE, MAX, and MIN functions Verify a formula
COMPUTER TRAINING CENTER
 Excel 2007 Introduction to Spreadsheets COMPUTER TRAINING CENTER 1515 SW 10 th Avenue Topeka KS 66604-1374 785.580.4606 class@tscpl.org www.tscpl.org Excel 2007 Introduction 1 Office button Quick Access
DOING MORE WITH EXCEL: MICROSOFT OFFICE 2010
 DOING MORE WITH EXCEL: MICROSOFT OFFICE 2010 GETTING STARTED PAGE 02 Prerequisites What You Will Learn MORE TASKS IN MICROSOFT EXCEL PAGE 03 Cutting, Copying, and Pasting Data Filling Data Across Columns
Beginner s Guide to Microsoft Excel 2002
 Beginner s Guide to Microsoft Excel 2002 Microsoft Excel lets you create spreadsheets, which allow you to make budgets, track inventories, calculate profits, and design charts and graphs. 1. Open Start
Excel 2010: Getting Started with Excel
 Excel 2010: Getting Started with Excel Excel 2010 Getting Started with Excel Introduction Page 1 Excel is a spreadsheet program that allows you to store, organize, and analyze information. In this lesson,
Excel 2007/2010. Don t be afraid of PivotTables. Prepared by: Tina Purtee Information Technology (818)
") Information Technology MS Office 2007/10 Users Guide Excel 2007/2010 Don t be afraid of PivotTables Prepared by: Tina Purtee Information Technology (818) 677-2090 tpurtee@csun.edu [ DON T BE AFRAID OF
Information Technology MS Office 2007/10 Users Guide Excel 2007/2010 Don t be afraid of PivotTables Prepared by: Tina Purtee Information Technology (818) 677-2090 tpurtee@csun.edu [ DON T BE AFRAID OF
Printing spreadsheets is easy. Microsoft Excel has lots of options available so you can print exactly what you want.
 Page Setup and Print Chapter 4 Printing spreadsheets is easy. Microsoft Excel has lots of options available so you can print exactly what you want. Print Preview is available so that you can check how
Excel Advanced
 Excel 2016 - Advanced LINDA MUCHOW Alexandria Technical & Community College 320-762-4539 lindac@alextech.edu Table of Contents Macros... 2 Adding the Developer Tab in Excel 2016... 2 Excel Macro Recorder...
NATIONAL ASSOCIATION OF INVESTORS CORPORATION (NAIC) CHAPTER ACCOUNTING WITH QUICKBOOKS USER PROCEDURES
 CHAPTER ACCOUNTING WITH QUICKBOOKS USER PROCEDURES") NATIONAL ASSOCIATION OF INVESTORS CORPORATION (NAIC) CHAPTER ACCOUNTING WITH QUICKBOOKS USER PROCEDURES Version: 2.2 Last Revised September 15, 2004 Table of Contents 1 PURPOSE OF THE USER PROCEDURES...3
NATIONAL ASSOCIATION OF INVESTORS CORPORATION (NAIC) CHAPTER ACCOUNTING WITH QUICKBOOKS USER PROCEDURES Version: 2.2 Last Revised September 15, 2004 Table of Contents 1 PURPOSE OF THE USER PROCEDURES...3
EXCEL BASICS: MICROSOFT OFFICE 2010
 EXCEL BASICS: MICROSOFT OFFICE 2010 GETTING STARTED PAGE 02 Prerequisites What You Will Learn USING MICROSOFT EXCEL PAGE 03 Opening Microsoft Excel Microsoft Excel Features Keyboard Review Pointer Shapes
Microsoft Excel 2010 Basics
 Microsoft Excel 2010 Basics Starting Word 2010 with XP: Click the Start Button, All Programs, Microsoft Office, Microsoft Excel 2010 Starting Word 2010 with 07: Click the Microsoft Office Button with the
Tabs3, PracticeMaster, and the pinwheel symbol ( trademarks of Software Technology, Inc. Portions copyright Microsoft Corporation
 Tabs3 General Ledger Software Reseller/User Tutorial Version 16.1 for November 2011 Sample Data Copyright 1983-2013 Software Technology, Inc. 1621 Cushman Drive Lincoln, NE 68512 (402) 423-1440 http://www.tabs3.com
Introduction to Excel 2007
 Introduction to Excel 2007 These documents are based on and developed from information published in the LTS Online Help Collection (www.uwec.edu/help) developed by the University of Wisconsin Eau Claire
Sage Financial Reporter User's Guide
 Sage 300 2017 Financial Reporter User's Guide This is a publication of Sage Software, Inc. Copyright 2016. Sage Software, Inc. All rights reserved. Sage, the Sage logos, and the Sage product and service
Inserting or deleting a worksheet
 Inserting or deleting a worksheet To insert a new worksheet at the end of the existing worksheets, just click the Insert Worksheet tab at the bottom of the screen. To insert a new worksheet before an existing
Working with Excel CHAPTER 1
 CHAPTER 1 Working with Excel You use Microsoft Excel to create spreadsheets, which are documents that enable you to manipulate numbers and formulas to quickly create powerful mathematical, financial, and
PARTS OF A WORKSHEET. Rows Run horizontally across a worksheet and are labeled with numbers.
 1 BEGINNING EXCEL While its primary function is to be a number cruncher, Excel is a versatile program that is used in a variety of ways. Because it easily organizes, manages, and displays information,
Microsoft Office Excel
 Microsoft Office 2007 - Excel Help Click on the Microsoft Office Excel Help button in the top right corner. Type the desired word in the search box and then press the Enter key. Choose the desired topic
Financial Reporting Using Microsoft Excel. Presented By: Jim Lee
 Financial Reporting Using Microsoft Excel Presented By: Jim Lee Table of Contents Financial Reporting Overview... 4 Reporting Periods... 4 Microsoft Excel... 4 SedonaOffice General Ledger Structure...
Creating Reports in Access 2007 Table of Contents GUIDE TO DESIGNING REPORTS... 3 DECIDE HOW TO LAY OUT YOUR REPORT... 3 MAKE A SKETCH OF YOUR
 Creating Reports in Access 2007 Table of Contents GUIDE TO DESIGNING REPORTS... 3 DECIDE HOW TO LAY OUT YOUR REPORT... 3 MAKE A SKETCH OF YOUR REPORT... 3 DECIDE WHICH DATA TO PUT IN EACH REPORT SECTION...
KEYBOARD SHORTCUTS AND HOT KEYS
 KEYBOARD SHORTCUTS AND HOT KEYS Page 1 This document is devoted to using the keyboard instead of the mouse to perform tasks within applications. This list is by no means the "be all and end all". There
Office of Instructional Technology
 Office of Instructional Technology Microsoft Excel 2016 Contact Information: 718-254-8565 ITEC@citytech.cuny.edu Contents Introduction to Excel 2016... 3 Opening Excel 2016... 3 Office 2016 Ribbon... 3
Part III Fundamentals of Microsoft Excel
 Part III Fundamentals of Microsoft Excel Table of Contents 1. INTRODUCTION... 83 2. STARTING MICROSOFT EXCEL... 84 2.1 Steps for starting word...84 2.2 The Excel Window...84 3. MICROSOFT EXCEL BASICS...
Working with Excel involves two basic tasks: building a spreadsheet and then manipulating the
 Working with Excel You use Microsoft Excel to create spreadsheets, which are documents that enable you to manipulate numbers and formulas to create powerful mathematical, financial, and statistical models
Microsoft How to Series
 Microsoft How to Series Getting Started with EXCEL 2007 A B C D E F Tabs Introduction to the Excel 2007 Interface The Excel 2007 Interface is comprised of several elements, with four main parts: Office
MICROSOFT EXCEL BIS 202. Lesson 1. Prepared By: Amna Alshurooqi Hajar Alshurooqi
 MICROSOFT EXCEL Prepared By: Amna Alshurooqi Hajar Alshurooqi Lesson 1 BIS 202 1. INTRODUCTION Microsoft Excel is a spreadsheet application used to perform financial calculations, statistical analysis,
Excel 2013 Intermediate
 Excel 2013 Intermediate Quick Access Toolbar... 1 Customizing Excel... 2 Keyboard Shortcuts... 2 Navigating the Spreadsheet... 2 Status Bar... 3 Worksheets... 3 Group Column/Row Adjusments... 4 Hiding
A cell is highlighted when a thick black border appears around it. Use TAB to move to the next cell to the LEFT. Use SHIFT-TAB to move to the RIGHT.
 Instructional Center for Educational Technologies EXCEL 2010 BASICS Things to Know Before You Start The cursor in Excel looks like a plus sign. When you click in a cell, the column and row headings will