Mira Shapiro, Analytic Designers LLC, Bethesda, MD
|
|
|
- Clyde Sullivan
- 6 years ago
- Views:
Transcription


1 Paper JMP04 Using JMP Partition to Grow Decision Trees in Base SAS Mira Shapiro, Analytic Designers LLC, Bethesda, MD ABSTRACT Decision Tree is a popular technique used in data mining and is often used to pare down to a subset of variables for more complex modeling efforts. If your organization has only licensed Base SAS and SAS/STAT you may be surprised to find that there is no procedure for decision trees. However, if you are licensed JMP 9 user, you can build and test a decision tree with JMP. The Modeling Partition analysis provides an option for creating SAS Data Step scoring code. Once created, the scoring code can be run in Base SAS. This discussion with provide a brief overview of decision trees and illustrate how to create a decision tree with Partition in JMP and then create the SAS Data Step Scoring code. INTRODUCTION As analysts and statisticians we are often faced with the question of what relationships are present in our data. JMP provides methods to find an answer. The JMP Partition Platform provides an easy way to create decision trees with numerous options for perfecting and interpreting the results. This discussion will focus on creating a decision tree and will give an introduction to the many options that are available for improving and interpreting the results within JMP. Additionally, the option to create a decision tree in JMP and export the code to be run in Base SAS will be demonstrated. WHAT IS A DECISION TREE? A decision tree model allows for examination of the relationship between a response variable and multiple possible predictors. The potential predictors are evaluated using statistical methods appropriate to their type and assessed as to their predictive value for the response variable. The data is then split into two groups based on the value of the predictor. As the tree is built by recursive splitting, the predictors are re-evaluated at each stage. There are numerous resources available for understanding the underlying statistical techniques and algo rithms used in the decision tree modeling process. Such a discussion is beyond the scope of this paper. Several recommended books, papers and online resources are listed in the References and Recommended Reading sections at the end of this paper. JMP SAMPLE DATA USED IN EXAMPLES A variety of sample data sets are included with JMP. The index of data sets is helpful to find a sample data set by subject area or analysis type and provides opportunities for new users to explore JMP s capabilities. The example s in this paper use the sample data set Lipid Data. The sample JMP data sets are found under the JMP Home Window Help Sample Data. 1


2 GROWING A DECISION TREE Once you have opened or created your data table in JMP, there are multiple ways to invoke the JMP Partition Platform. From the JMP Home Window, select Analyze Modeling Partition to begin. 2


3 Next, the JMP Partition selection pane opens, providing the opportunity to select variables for roles in the model and make use of the initial options for the model. Missing Value Categories: Y Response Checked Unchecked Categorical Additional variable level is created for the missing values Excluded Continuous Excluded Excluded X Predictors (used as splitting variable) Checked Unchecked Categorical Continuous Additional variable level is created for the missing values Random assignment of value to one side of the split Random assignment of value to one side of the split Random assignment of value to one side of the split Validation Portion: This option allows the user to use a portion of their data to estimate the model parameters, leaving the remaining portion to validate the model. 3


4 At this point, drag and drop columns to cast them into roles. For this example, Heart History is chosen as the Y response, and several others are cast into the role as potential predictors. Minimum Size Split The user has the option to define the minimum size of a group in a split. To access this option, click the hotspot next to the main partition window, and mouse down to Minimum Size Split. The size can be entered as a number or a fractional portion. The Partition process will not create a group that violates this criterion. 4


5 Once the OK button is clicked, the Partition Platform is launched. The points are shown on the initial pane, with the values of Heart History shown on the right. It is now up to the user to click the Split button to begin the process. After the Split button is clicked below the main Partition window, JMP begins to create the decision tree. The first split selected is the Smoking_Ever variable that was created from the smoking history variable and coded as 0/1. 5
, and the next was Coffee Intake for females.")

6 SPLITTING AND PRUNING YOUR DECISION TREE Partition is a recursive process, and the user has multiple options for continuing and controlling the process. The Split button was clicked again; the best split selected by JMP was Gender for non-smokers (Smoking_Ever=0), and the next was Coffee Intake for females. Picking a Candidate In many cases the user has some subject area know ledge that may direct them to pick a particular split that may not show up as the best in the JMP evaluation criteria. By clicking the gray triangle to the left of Candidates in any node, the user can examine all of the variables that can be used for a split and their associated statistics. 6


7 Alternatively, clicking under the hotspot at any node w ill reveal available options. Here w e click Split Best to allow JMP to select the variable for the split. The best split under Coffee Intake of 1 cup a coffee or greater per day is Exercise Freq. 7

8 Recursive Splitting The user can use a combination of techniques to build their decision tree model. No node will be created that vio lates the minimum split criterion specified in the Partition Platform Launch Window. 8

9 Dynamic Linking As in all other JMP operations, Dynamic Linking of the data table and results allows the user to visual ize the relationships. Clicking on the hotspot on any node and selecting Select Rows causes the data table to become visible, and the associated rows will be highlighted. 9


10 Pruning A Decision Tree Just as the tree can be built with JMP, nodes can be removed by pruning areas of the tree. Looking at the level that we added in the previous step, we ve decided to remove the Coffee Intake split. By clicking the hot spot next to Smoking_Ever, we reveal the available options, including Prune Below. Selecting Prune Below will result in the removal of all notes below the selected node. 10


11 OPTIONS FOR UNDERSTANDING AND EVALUATING YOUR DECISION TREE There are numerous statistics and reports that are available for evaluating your decision tree model. Generating and showing or hiding each of these options is accomplished by clicking the hotspots and making use of the hide/unhide icon. As shown in the following examples, most of the options can be moused over to reveal a box with a description of the particular option. The JMP Help facility and online resources have detailed information about the statistics generated. Leaf Report 11

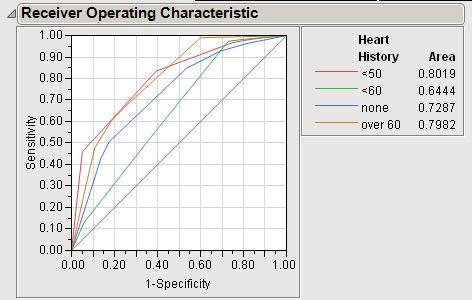
12 ROC Curve 12


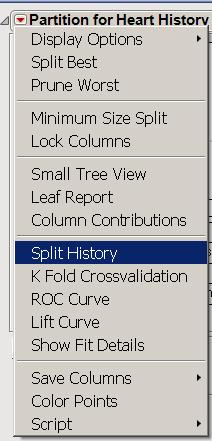
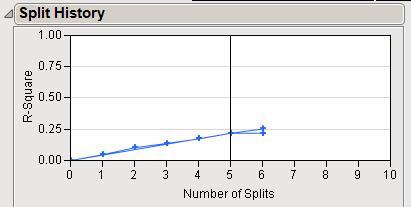
13 Lift Curve Split History 13

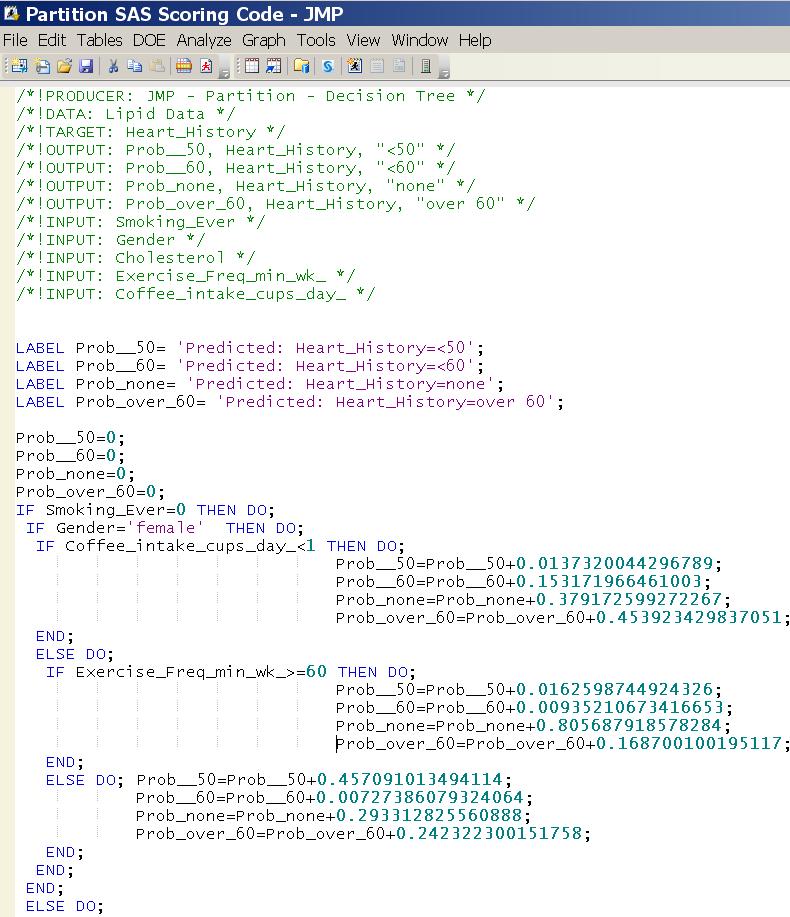
14 TRANSPLANTING YOUR DECISION TREE IN SAS There are times when a user wants to build their decision tree model in JMP and then use the model in Base SAS. In order to create the SAS Data Step code, click on the hotspot at the left of the main partition window, and mouse down to Make SAS Data Step. As shown below, the code will appear in a window entitled Partition SAS Scoring Code- JMP. This code can be run within base SAS with suitable data sources. Note that the variable names are created using SAS naming conventions, thereby avoiding the need to surround a variable name with special characters with quotes and following it with an n. For example, Heart History becomes Heart_History. If you are using another data set, it will be necessary to adjust either the program code or your variables names accordingly. 14
15 15
16 CONCLUSION This discussion has provided an overview to the JMP Partition Platform. This facility provides an approach to creating decision trees that is interactive and does not require programming skills. The user has the ability to control the split size, variables and decision tree shape through multiple options within JMP as well as to export Data Step code to SAS. A comprehensive set of statistics and results are available to evaluate the resulting JMP decision tree model. REFERENCES Gaudard, Martha, Ph.D. et. al., Interactive Data Mining and Design of Experiments: the JMP Partition and Custom Design Platforms. March 2006, Available at THE JMP 9.02 HELP FACILITY MASTERING JMP : AN OVERVIEW OF DATA EXPLORATION AND THE JMP SCRIPTING LANGUAGE, COURSE NOTES, SAS INSTITUTE INC. RECOMMENDED READING Data Mining Techniques: For Marketing, Sales, and Customer Relationship Management, Third Edition, by Michael Berry and Gordon Linoff, John Wiley Sons, Inc., April 2011 Your comments and questions are valued and encouraged. Contact the author at: Mira Shapiro Analytic Designers LLC, Bethesda, MD mira.shapiro@analyticdesigners.com SAS and all other SAS Institute Inc. product or service names are registered trademarks or trademarks of SAS Institute Inc. in the USA and other countries. indicates USA registration. Other brand and product names are trademarks of their respective companies. 16
Making Your SAS Data JMP Through Hoops Mira Shapiro, Analytic Designers LLC, Bethesda, MD
 Paper JP-02 Making Your SAS Data JMP Through Hoops Mira Shapiro, Analytic Designers LLC, Bethesda, MD ABSTRACT Longtime SAS users can benefit by adding JMP to their repertoire. JMP provides an easy-to-use
AN OVERVIEW AND EXPLORATION OF JMP A DATA DISCOVERY SYSTEM IN DAIRY SCIENCE
 AN OVERVIEW AND EXPLORATION OF JMP A DATA DISCOVERY SYSTEM IN DAIRY SCIENCE A.P. Ruhil and Tara Chand National Dairy Research Institute, Karnal-132001 JMP commonly pronounced as Jump is a statistical software
SAS Structural Equation Modeling 1.3 for JMP
 SAS Structural Equation Modeling 1.3 for JMP SAS Documentation The correct bibliographic citation for this manual is as follows: SAS Institute Inc. 2012. SAS Structural Equation Modeling 1.3 for JMP. Cary,
SAS Factory Miner 14.2: User s Guide
 SAS Factory Miner 14.2: User s Guide SAS Documentation The correct bibliographic citation for this manual is as follows: SAS Institute Inc. 2016. SAS Factory Miner 14.2: User s Guide. Cary, NC: SAS Institute
Easing into Data Exploration, Reporting, and Analytics Using SAS Enterprise Guide
 Paper 809-2017 Easing into Data Exploration, Reporting, and Analytics Using SAS Enterprise Guide ABSTRACT Marje Fecht, Prowerk Consulting Whether you have been programming in SAS for years, are new to
From Building Better Models with JMP Pro. Full book available for purchase here.
 From Building Better Models with JMP Pro. Full book available for purchase here. Contents Acknowledgments... ix About This Book... xi About These Authors... xiii Part 1 Introduction... 1 Chapter 1 Introduction...
SAS IT Resource Management Forecasting. Setup Specification Document. A SAS White Paper
 SAS IT Resource Management Forecasting Setup Specification Document A SAS White Paper Table of Contents Introduction to SAS IT Resource Management Forecasting... 1 Getting Started with the SAS Enterprise
The JMP Journal: An Analyst s Best Friend
 Paper JM-03-2013 The JMP Journal: An Analyst s Best Friend Nate Derby, Stakana Analytics, Seattle, WA ABSTRACT The JMP Journal is an incredibly useful tool for consultants and analysts, yet it s not commonly
SAS Visual Analytics 8.1: Getting Started with Analytical Models
 SAS Visual Analytics 8.1: Getting Started with Analytical Models Using This Book Audience This book covers the basics of building, comparing, and exploring analytical models in SAS Visual Analytics. The
SAS Visual Analytics 7.2, 7.3, and 7.4: Getting Started with Analytical Models
 SAS Visual Analytics 7.2, 7.3, and 7.4: Getting Started with Analytical Models SAS Documentation August 16, 2017 The correct bibliographic citation for this manual is as follows: SAS Institute Inc. 2015.
Getting Started With. A Step-by-Step Guide to Using WorldAPP Analytics to Analyze Survey Data, Create Charts, & Share Results Online
 Getting Started With A Step-by-Step Guide to Using WorldAPP Analytics to Analyze Survey, Create Charts, & Share Results Online Variables Crosstabs Charts PowerPoint Tables Introduction WorldAPP Analytics
SAS Model Manager 2.2. Tutorials
 SAS Model Manager 2.2 Tutorials The correct bibliographic citation for this manual is as follows: SAS Institute Inc. 2009. SAS Model Manager 2.2: Tutorials. Cary, NC: SAS Institute Inc. SAS Model Manager
An Interactive GUI Front-End for a Credit Scoring Modeling System
 Paper 6 An Interactive GUI Front-End for a Credit Scoring Modeling System Jeffrey Morrison, Futian Shi, and Timothy Lee Knowledge Sciences & Analytics, Equifax Credit Information Services, Inc. Abstract
LAB 1 INSTRUCTIONS DESCRIBING AND DISPLAYING DATA
 LAB 1 INSTRUCTIONS DESCRIBING AND DISPLAYING DATA This lab will assist you in learning how to summarize and display categorical and quantitative data in StatCrunch. In particular, you will learn how to
JMP 12.1 Quick Reference Windows and Macintosh Keyboard Shortcuts
 Data Table Actions JMP 12.1 Quick Reference and Keyboard s Select the left or right cell. If a blinking cursor is inserted in a cell, move one character left or right through the cell contents. Select
Developing Intelligent Apps
 Developing Intelligent Apps Lab 1 Creating a Simple Client Application By Gerry O'Brien Overview In this lab you will construct a simple client application that will call an Azure ML web service that you
Chapter 2 Assignment (due Thursday, April 19)
") (due Thursday, April 19) Introduction: The purpose of this assignment is to analyze data sets by creating histograms and scatterplots. You will use the STATDISK program for both. Therefore, you should
(due Thursday, April 19) Introduction: The purpose of this assignment is to analyze data sets by creating histograms and scatterplots. You will use the STATDISK program for both. Therefore, you should
Cell Suppression In SAS Visual Analytics: A Primer
 ABSTRACT Paper 11883-2016 Cell Suppression In SAS Visual Analytics: A Primer Marc Flore, Institute for Health Policy and Practice, University of New Hampshire In healthcare and other fields, the importance
SAS Visual Analytics 8.2: Getting Started with Reports
 SAS Visual Analytics 8.2: Getting Started with Reports Introduction Reporting The SAS Visual Analytics tools give you everything you need to produce and distribute clear and compelling reports. SAS Visual
Using JMP Visualizations to Build a Statistical Model George J. Hurley, The Hershey Company, Hershey, PA
 Paper JP05-2011 Using JMP Visualizations to Build a Statistical Model George J. Hurley, The Hershey Company, Hershey, PA ABSTRACT JMP has long been used by engineers to build various types of models, including
Using SAS Enterprise Guide to Coax Your Excel Data In To SAS
 Paper IT-01 Using SAS Enterprise Guide to Coax Your Excel Data In To SAS Mira Shapiro, Analytic Designers LLC, Bethesda, MD ABSTRACT Kirk Paul Lafler, Software Intelligence Corporation, Spring Valley,
SAS Infrastructure for Risk Management 3.4: User s Guide
 SAS Infrastructure for Risk Management 3.4: User s Guide SAS Documentation March 2, 2018 The correct bibliographic citation for this manual is as follows: SAS Institute Inc. 2017. SAS Infrastructure for
SAS Enterprise Miner : Tutorials and Examples
 SAS Enterprise Miner : Tutorials and Examples SAS Documentation February 13, 2018 The correct bibliographic citation for this manual is as follows: SAS Institute Inc. 2017. SAS Enterprise Miner : Tutorials
Automatic Detection of Section Membership for SAS Conference Paper Abstract Submissions: A Case Study
 1746-2014 Automatic Detection of Section Membership for SAS Conference Paper Abstract Submissions: A Case Study Dr. Goutam Chakraborty, Professor, Department of Marketing, Spears School of Business, Oklahoma
JMP Clinical. Release Notes. Version 5.0
 JMP Clinical Version 5.0 Release Notes Creativity involves breaking out of established patterns in order to look at things in a different way. Edward de Bono JMP, A Business Unit of SAS SAS Campus Drive
Principles of Machine Learning
 Principles of Machine Learning Lab 3 Improving Machine Learning Models Overview In this lab you will explore techniques for improving and evaluating the performance of machine learning models. You will
Data Quality Control for Big Data: Preventing Information Loss With High Performance Binning
 Data Quality Control for Big Data: Preventing Information Loss With High Performance Binning ABSTRACT Deanna Naomi Schreiber-Gregory, Henry M Jackson Foundation, Bethesda, MD It is a well-known fact that
SAS Visual Analytics 8.2: Working with SAS Visual Statistics
 SAS Visual Analytics 8.2: Working with SAS Visual Statistics About SAS Visual Statistics What Is SAS Visual Statistics SAS Visual Statistics is an add-on to SAS Visual Analytics that enables you to develop
Getting started with Mint UK
 Getting started with Mint UK Helpline number: 020 7549 5050 Email : help.london@bvdinfo.com Getting started with Mint UK This guide gets you started with Mint UK by explaining how you can search for companies
Localize Your Custom JMP Applications For International Users Michael Hecht, JMP Principal Systems Developer, SAS
 Localize Your Custom JMP Applications For International Users Michael Hecht, JMP Principal Systems Developer, SAS Abstract JSL, JMP s powerful scripting language, can be used to extend JMP s features in
An Interactive GUI Front-End for a Credit Scoring Modeling System by Jeffrey Morrison, Futian Shi, and Timothy Lee
 An Interactive GUI Front-End for a Credit Scoring Modeling System by Jeffrey Morrison, Futian Shi, and Timothy Lee Abstract The need for statistical modeling has been on the rise in recent years. Banks,
CUSTOMIZING CHECKPOINT TO WORK FOR YOU
 HOME CUSTOMIZING CHECKPOINT TO WORK FOR YOU QUICK REFERENCE Click Manage my views to modify your Current View or to create a new view. Edit and customize your Quick Links to access links to your frequently
SAS Model Manager 15.1: Quick Start Tutorial
 SAS Model Manager 15.1: Quick Start Tutorial Overview This Quick Start Tutorial is an introduction to some of the primary features of SAS Model Manager. The tutorial covers basic tasks that are related
AudienceView How To Guides How to Run a Crosstab Report
 AudienceView How To Guides How to Run a Crosstab Report What is a Crosstab report? A Crosstab Report allows you to conduct data exploration and profiling exercises for selected audiences using the full
Dynamic Projects in SAS Enterprise Guide How to Create and Use Parameters
 Paper HW02 Dynamic Projects in SAS Enterprise Guide How to Create and Use Parameters Susan J. Slaughter, Avocet Solutions, Davis, CA Lora D. Delwiche, University of California, Davis, CA ABSTRACT SAS Enterprise
Microsoft Access XP (2002) Queries
 Queries") Microsoft Access XP (2002) Queries Column Display & Sorting Simple Queries And & Or Conditions Ranges Wild Cards Blanks Calculations Multi-table Queries Table of Contents INTRODUCTION TO ACCESS QUERIES...
Microsoft Access XP (2002) Queries Column Display & Sorting Simple Queries And & Or Conditions Ranges Wild Cards Blanks Calculations Multi-table Queries Table of Contents INTRODUCTION TO ACCESS QUERIES...
SAS Simulation Studio 14.1: User s Guide. Introduction to SAS Simulation Studio
 SAS Simulation Studio 14.1: User s Guide Introduction to SAS Simulation Studio This document is an individual chapter from SAS Simulation Studio 14.1: User s Guide. The correct bibliographic citation for
PREDICTION OF POPULAR SMARTPHONE COMPANIES IN THE SOCIETY
 PREDICTION OF POPULAR SMARTPHONE COMPANIES IN THE SOCIETY T.Ramya 1, A.Mithra 2, J.Sathiya 3, T.Abirami 4 1 Assistant Professor, 2,3,4 Nadar Saraswathi college of Arts and Science, Theni, Tamil Nadu (India)
Cisco Partner Support Service (PSS) User Guide - User Registration. April 07,
 User Guide - User Registration. April 07,") Cisco Partner Support Service (PSS) User Guide - User Registration April 07, 2017 Corporate Headquarters Cisco Systems, Inc. 170 West Tasman Drive San Jose, CA 95134-1706 USA http://www.cisco.com 1-1 Table
Cisco Partner Support Service (PSS) User Guide - User Registration April 07, 2017 Corporate Headquarters Cisco Systems, Inc. 170 West Tasman Drive San Jose, CA 95134-1706 USA http://www.cisco.com 1-1 Table
Information Visualization
 Paper 166-25 Presenting Your Data Easily with Graph-N-Go Curtis A. Smith, Defense Contract Audit Agency, La Mirada, CA ABSTRACT Visualizing and presenting data effectively using reports and listings can
Overview. CHAPTER 2 Using the SAS System and SAS/ ASSIST Software
 11 CHAPTER 2 Using the SAS System and SAS/ ASSIST Software Overview 11 Invoking the SAS System 12 Selecting Items 12 Entering Commands 13 Using Menus 13 Using Function Keys 15 Invoking SAS/ASSIST Software
CS130/230 Lecture 6 Introduction to StatView
 Thursday, January 15, 2004 Intro to StatView CS130/230 Lecture 6 Introduction to StatView StatView is a statistical analysis program that allows: o Data management in a spreadsheet-like format o Graphs
Chapter 6 Creating Reports. Chapter Table of Contents
 Chapter 6 Creating Reports Chapter Table of Contents Introduction...115 Listing Data...115 ListDataOptions...116 List Data Titles...118 ListDataVariables...118 Example:CreateaListingReport...119 Creating
Houghton Mifflin Harcourt and its logo are trademarks of Houghton Mifflin Harcourt Publishing Company.
 Guide for Teachers Updated September 2013 Houghton Mifflin Harcourt Publishing Company. All rights reserved. Houghton Mifflin Harcourt and its logo are trademarks of Houghton Mifflin Harcourt Publishing
EXTRAPOLATE. Ex ante Tool for Ranking Policy Alternatives Peter Thorne, Philip Thornton, Tim Robinson. Pro-Poor. Livestock. version 1.
 Pro-Poor Livestock Policy Initiative EXTRAPOLATE version 1.1 DRAFT Ex ante Tool for Ranking Policy Alternatives Peter Thorne, Philip Thornton, Tim Robinson A Living from Livestock User Guide Table of Contents
1 Topic. Image classification using Knime.
 1 Topic Image classification using Knime. The aim of image mining is to extract valuable knowledge from image data. In the context of supervised image classification, we want to assign automatically a
Skills Exam Objective Objective Number
 Overview 1 LESSON SKILL MATRIX Skills Exam Objective Objective Number Starting Excel Create a workbook. 1.1.1 Working in the Excel Window Customize the Quick Access Toolbar. 1.4.3 Changing Workbook and
SAS Business Rules Manager 1.2
 SAS Business Rules Manager 1.2 User s Guide Second Edition SAS Documentation The correct bibliographic citation for this manual is as follows: SAS Institute Inc. 2012. SAS Business Rules Manager 1.2. Cary,
Highlights in JMP 10. The real voyage of discovery consists not in seeking new landscapes, but in having new eyes. Marcel Proust
 Version 10 Highlights in JMP 10 The real voyage of discovery consists not in seeking new landscapes, but in having new eyes. Marcel Proust JMP, A Business Unit of SAS SAS Campus Drive Cary, NC 27513 The
Genetic Analysis. Page 1
 Genetic Analysis Page 1 Genetic Analysis Objectives: 1) Set up Case-Control Association analysis and the Basic Genetics Workflow 2) Use JMP tools to interact with and explore results 3) Learn advanced
Numbers Basics Website:
 Website: http://etc.usf.edu/te/ Numbers is Apple's new spreadsheet application. It is installed as part of the iwork suite, which also includes the word processing program Pages and the presentation program
Bar Charts and Frequency Distributions
 Bar Charts and Frequency Distributions Use to display the distribution of categorical (nominal or ordinal) variables. For the continuous (numeric) variables, see the page Histograms, Descriptive Stats
Now That You Have Your Data in Hadoop, How Are You Staging Your Analytical Base Tables?
 Paper SAS 1866-2015 Now That You Have Your Data in Hadoop, How Are You Staging Your Analytical Base Tables? Steven Sober, SAS Institute Inc. ABSTRACT Well, Hadoop community, now that you have your data
12 Duplicate Clips and Virtual Clips
 12 Duplicate Clips and Virtual Clips Duplicate clips and virtual clips are two powerful tools for assembling a video program in Premiere. Duplicate clips can be useful for splitting clips into a number
Intermediate Microsoft Excel 2010
 P a g e 1 Intermediate Microsoft Excel 2010 ABOUT THIS CLASS This class is designed to continue where the Microsoft Excel 2010 Basics class left off. Specifically, we will cover additional ways to organize
Department of Instructional Technology & Media Services Blackboard Grade Book
 Department of Instructional Technology & Media Services Blackboard Grade Book In your control panel, go to Assessment and grade center. Creating a Test In the Assessment section of the Control Panel, click
GIS LAB 1. Basic GIS Operations with ArcGIS. Calculating Stream Lengths and Watershed Areas.
 GIS LAB 1 Basic GIS Operations with ArcGIS. Calculating Stream Lengths and Watershed Areas. ArcGIS offers some advantages for novice users. The graphical user interface is similar to many Windows packages
Predictive Modeling with SAS Enterprise Miner
 Predictive Modeling with SAS Enterprise Miner Practical Solutions for Business Applications Third Edition Kattamuri S. Sarma, PhD Solutions to Exercises sas.com/books This set of Solutions to Exercises
Creating a Custom Report
 Creating a Custom Report The Analytical Report module provides two ways to create a custom report: modifying an existing shared report or creating a new report from scratch if there is no existing report
Microsoft Office 2010: Introductory Q&As Access Chapter 2
 Microsoft Office 2010: Introductory Q&As Access Chapter 2 Is it necessary to close the Navigation Pane? (AC 78) No. It gives you more room for the query, however, so it is usually a good practice to hide
JMP 10 Student Edition Quick Guide
 JMP 10 Student Edition Quick Guide Instructions presume an open data table, default preference settings and appropriately typed, user-specified variables of interest. RMC = Click Right Mouse Button Graphing
Microsoft Windows XP. Operating System. Starting Windows XP. You might be asked to enter your username and password
 Microsoft Windows Operating System Starting Windows Windows automatically starts when you turn on your computer You might be asked to enter your username and password The Windows desktop uses a graphical
VAT/GST Analytics by Deloitte User Guide August 2017
 VAT/GST Analytics by Deloitte User Guide August 2017 Contents What is VAT/GST Analytics? What is Qlik Sense? The Associative Model How to access Qlik Sense? Navigate through Qlik Sense A quick overview
Lesson 1: Creating and formatting an Answers analysis
 Lesson 1: Creating and formatting an Answers analysis Answers is the ad-hoc query environment in the OBIEE suite. It is in Answers that you create and format analyses to help analyze business results.
NETWORK PRINT MONITOR User Guide
 NETWORK PRINT MONITOR User Guide Legal Notes Unauthorized reproduction of all or part of this guide is prohibited. The information in this guide is subject to change for improvement without notice. We
DOWNLOAD PDF MICROSOFT OFFICE POWERPOINT 2003, STEP BY STEP
 Chapter 1 : Microsoft Office Excel Step by Step - PDF Free Download Microsoft Office PowerPoint Step by Step This is a good book for an 76 year old man like me. It was a great help in teaching me to do
Guide Users along Information Pathways and Surf through the Data
 Guide Users along Information Pathways and Surf through the Data Stephen Overton, Overton Technologies, LLC, Raleigh, NC ABSTRACT Business information can be consumed many ways using the SAS Enterprise
Mastering the Grade Book
 Mastering the Grade Book Blackboard Learning System - Vista Enterprise and CE Licenses 2008 Blackboard Inc. 2008 Blackboard Inc. 2 Mastering the Grade Book All rights reserved. The content of this manual
DEPARTMENT OF HEALTH AND HUMAN SCIENCES HS900 RESEARCH METHODS
 DEPARTMENT OF HEALTH AND HUMAN SCIENCES HS900 RESEARCH METHODS Using SPSS Topics addressed today: 1. Accessing data from CMR 2. Starting SPSS 3. Getting familiar with SPSS 4. Entering data 5. Saving data
USER MANUAL. Version May 2015
 USER MANUAL Version 6.60 - May 2015 USER MANUAL IPBrowse 6.60 Disclaimer This manual and the information contained herein are the sole property of EVS Broadcast Equipment SA and/or its affiliates (EVS)
3 Getting Started with Objects
 3 Getting Started with Objects If you are an experienced IDE user, you may be able to do this tutorial without having done the previous tutorial, Getting Started. However, at some point you should read
Easy CSR In-Text Table Automation, Oh My
 PharmaSUG 2018 - Paper BB-09 ABSTRACT Easy CSR In-Text Table Automation, Oh My Janet Stuelpner, SAS Institute Your medical writers are about to embark on creating the narrative for the clinical study report
Nearest neighbor classification DSE 220
 Nearest neighbor classification DSE 220 Decision Trees Target variable Label Dependent variable Output space Person ID Age Gender Income Balance Mortgag e payment 123213 32 F 25000 32000 Y 17824 49 M 12000-3000
Managing NDSR Projects
 Chapter 3 Managing NDSR Projects To enter data into NDSR, first create a project to organize the information in the form of records. Prior to creating a project, review your study protocol and methodology
CHAPTER 1 COPYRIGHTED MATERIAL. Finding Your Way in the Inventor Interface
 CHAPTER 1 Finding Your Way in the Inventor Interface COPYRIGHTED MATERIAL Understanding Inventor s interface behavior Opening existing files Creating new files Modifying the look and feel of Inventor Managing
DESIGN AND IMPLEMENTATION OF BUILDING DECISION TREE USING C4.5 ALGORITHM
 1 Proceedings of SEAMS-GMU Conference 2007 DESIGN AND IMPLEMENTATION OF BUILDING DECISION TREE USING C4.5 ALGORITHM KUSRINI Abstract. Decision tree is one of data mining techniques that is applied in classification
Note: In the presentation I should have said "baby registry" instead of "bridal registry," see
 Q-and-A from the Data-Mining Webinar Note: In the presentation I should have said "baby registry" instead of "bridal registry," see http://www.target.com/babyregistryportalview Q: You mentioned the 'Big
Creating Fill-able Forms using Acrobat 7.0: Part 1
 Creating Fill-able Forms using Acrobat 7.0: Part 1 The first step in creating a fill-able form in Adobe Acrobat is to generate the form with all its formatting in a program such as Microsoft Word. Then
Classification: Public ANZ TRANSACTIVE GLOBAL ADMINISTRATION USER GUIDE
 Classification: Public ANZ TRANSACTIVE GLOBAL ADMINISTRATION USER GUIDE 11 2015 CONTENTS INTRODUCTION... 3 USERS... 4 FUNCTION ROLES AND DATA ROLES... 5 FUNCTION ROLES... 5 Create a Function Role... 8
Access - Introduction to Queries
 Access - Introduction to Queries Part of managing a database involves asking questions about the data. A query is an Access object that you can use to ask the question(s). The answer is contained in the
WHITE PAPER: ENTERPRISE AVAILABILITY. Introduction to Adaptive Instrumentation with Symantec Indepth for J2EE Application Performance Management
 WHITE PAPER: ENTERPRISE AVAILABILITY Introduction to Adaptive Instrumentation with Symantec Indepth for J2EE Application Performance Management White Paper: Enterprise Availability Introduction to Adaptive
As a reference, please find a version of the Machine Learning Process described in the diagram below.
 PREDICTION OVERVIEW In this experiment, two of the Project PEACH datasets will be used to predict the reaction of a user to atmospheric factors. This experiment represents the first iteration of the Machine
Fading Music into Voice
 Fading Music into Voice The process of fading music into voice involves several steps. First, both the music file and the voice file must be in Audacity. Second, we fade out the music over 10 seconds or
Paper SAS Taming the Rule. Charlotte Crain, Chris Upton, SAS Institute Inc.
 ABSTRACT Paper SAS2620-2016 Taming the Rule Charlotte Crain, Chris Upton, SAS Institute Inc. When business rules are deployed and executed--whether a rule is fired or not if the rule-fire outcomes are
Mission Lipid Data Management Software User s Guide
 Mission Lipid Data Management Software User s Guide V1.0 September 2018 Table of Contents 1. Overview...1 1.1 About the Mission Lipid Data Management Software...1 1.2 System Requirements...1 1.3 Materials
KMnet Viewer. User Guide
 KMnet Viewer User Guide Legal Notes Unauthorized reproduction of all or part of this guide is prohibited. The information in this guide is subject to change for improvement without notice. We cannot be
Introducing Oracle R Enterprise 1.4 -
 Hello, and welcome to this online, self-paced lesson entitled Introducing Oracle R Enterprise. This session is part of an eight-lesson tutorial series on Oracle R Enterprise. My name is Brian Pottle. I
Sage 50 U.S. Edition Intelligence Reporting Getting Started Guide
 Sage Intelligence Reporting Sage 50 U.S. Edition Intelligence Reporting Getting Started Guide Table of Contents Introduction... 2 System requirements... 3 How it works... 4 Getting started guide... 5 Running
Copyright 2012 Pulse Systems, Inc. Page 1 of 46
 If the patient calls for an appointment, whether or not related to the recall reason, the user will be reminded of the recall and can schedule the examination at the same time. The user can also mark that
ConstructMap v4.4.0 Quick Start Guide
 ConstructMap v4.4.0 Quick Start Guide Release date 9/29/08 Document updated 12/10/08 Cathleen A. Kennedy Mark R. Wilson Karen Draney Sevan Tutunciyan Richard Vorp ConstructMap v4.4.0 Quick Start Guide
GETTING STARTED. A Step-by-Step Guide to Using MarketSight
 GETTING STARTED A Step-by-Step Guide to Using MarketSight Analyze any dataset Run crosstabs Test statistical significance Create charts and dashboards Share results online Introduction MarketSight is a
Connect ISAK. Training Guide
 1 Training Checklist Getting Started with ISAK... 3 ISAK Technical Requirements... 3 Logging In to the Course Manager... 4 Your Account Details... 4 Navigation... 5 Actions Menus... 5 Understanding Instructor
WEB-BASED TRAINING COURSES
 QUICK START WEB-BASED TRAINING COURSES INTRODUCTION Web-Based Training (WBT) courses offer a flexible, interactive learning experience to build your interviewing skills. WBT courses are comprised of units
Administration. Training Guide. Infinite Visions Enterprise Edition phone toll free fax
 Administration Training Guide Infinite Visions Enterprise Edition 406.252.4357 phone 1.800.247.1161 toll free 406.252.7705 fax www.csavisions.com Copyright 2005 2011 Windsor Management Group, LLC Revised:
Oracle Fusion Applications Marketing, Campaigns Guide. 11g Release 6 (11.1.6) Part Number E
 Part Number E") Oracle Fusion Applications Marketing, Campaigns Guide 11g Release 6 (11.1.6) Part Number E22674-06 September 2012 Oracle Fusion Applications Marketing, Campaigns Guide Part Number E22674-06 Copyright 2011-2012,
Oracle Fusion Applications Marketing, Campaigns Guide 11g Release 6 (11.1.6) Part Number E22674-06 September 2012 Oracle Fusion Applications Marketing, Campaigns Guide Part Number E22674-06 Copyright 2011-2012,
SPM Users Guide. This guide elaborates on powerful ways to combine the TreeNet and GPS engines to achieve model compression and more.
 SPM Users Guide Model Compression via ISLE and RuleLearner This guide elaborates on powerful ways to combine the TreeNet and GPS engines to achieve model compression and more. Title: Model Compression
EMC GREENPLUM MANAGEMENT ENABLED BY AGINITY WORKBENCH
 White Paper EMC GREENPLUM MANAGEMENT ENABLED BY AGINITY WORKBENCH A Detailed Review EMC SOLUTIONS GROUP Abstract This white paper discusses the features, benefits, and use of Aginity Workbench for EMC
Data Science with R Decision Trees with Rattle
 Data Science with R Decision Trees with Rattle Graham.Williams@togaware.com 9th June 2014 Visit http://onepager.togaware.com/ for more OnePageR s. In this module we use the weather dataset to explore the
TRANSANA and Chapter 8 Retrieval
 TRANSANA and Chapter 8 Retrieval Chapter 8 in Using Software for Qualitative Research focuses on retrieval a crucial aspect of qualitatively coding data. Yet there are many aspects of this which lead to
Contents. Group 3 Excel Handouts 2010
 Contents Function Library... 2 Function Operators... 2 Order of Multiple Operators... 2 Function Library... 3 Formula Auditing... 4 Name Cells... 7 Comments... 8 Show Ink... 9 Show Ink is a colorful way