Diagnostic Manager. User Guide VERSION August 22,
|
|
|
- Joseph Patrick
- 5 years ago
- Views:
Transcription
1 Diagnostic Manager User Guide VERSION 4.12 August 22,
2 Copyright Copyright International GmbH and Idera, Inc., All rights reserved. No part or section of the contents of this material may be reproduced or transmitted in any form or by any means without the written permission of International GmbH. Diagnostic Manager is a trademark of International GmbH and Idera, Inc. Windows SharePoint Services is either a registered trademark or a trademark of Microsoft Corporation in the United States and/or other countries. Other product and company names mentioned herein may be the trademarks of their respective owners. Technical Support For information about Technical support visit Technical support specialists can be reached by phone at The level of technical support provided depends upon the support package that you have purchased. Contact us to discuss your support requirements. info@metalogix.com
3 Contents Welcome to Diagnostic Manager... 7 How does Diagnostic Manager help me?... 7 Getting Started... 9 The Diagnostic Manager Home Page Configuring your Deployment Managing Licenses Updating a License...12 Connecting to the Collection Service Configuring Web Proxy Settings for Monitoring O365 Tenants and Web Pages Adding a Farm to Monitor Account(s) Used for Data Collection...24 Editing a Monitored Farm...26 Removing a Monitored Farm...26 Refreshing the Farm List Adding a Server Group Editing a Server Group...31 Manually Adding and Removing Servers to Monitor Setting Farm or Server Group "Quiet Hours" Configuring Settings Configuring the SNMP Settings Enabling and Configuring the Collection of ULS Log Entries (SharePoint 2010, 2013, and 2016 On Premises) Disabling the Gathering of ULS Log Data and Clearing ULS Log History...40 Using Alerts About Alerts Viewing Alerts Viewing Alert Details...43 Clearing an Alert info@metalogix.com
4 Editing Alert Thresholds Configuring the Alert Responses Adding an Alert Response...50 Cloning an Alert Response...51 Customizing the Knowledge Base Stopping Alerts During Maintenance Mode Viewing and Reporting on the Performance of SharePoint Farms, Server Group, and Office 365 Tenants Viewing Dashboards and Overviews Customizing Dashboards...57 Viewing the Status of Office 365 Services Refreshing Server Group Properties Refreshing the Farm Topology Collecting Metrics for All Servers or Pages Immediately Viewing Server Detail Checking Server Access...62 Viewing the Status of All the Servers in a Farm or Server Group...63 Stopping and Starting Application Pools Viewing the Status of Individual Servers in a Farm or Server Group...66 When Server Data is Collected Viewing the Server Dashboard Viewing Server Resource Graphs Viewing the Status of Windows Services Viewing the Status of Server Web Components Viewing the Status of Server SharePoint Components Viewing the Status of Monitored Pages Working with Graphical Server Data...81 Viewing SQL Server Detail Viewing the SQL Servers Status Overview...82 Viewing the Configuration of Your SQL Servers Viewing the Active Alerts for Your SQL Servers Viewing the Status of a Single SQL Server info@metalogix.com
5 Collecting Server Metrics Immediately Monitoring SharePoint and Web Pages Adding a Page to Monitor Setting SharePoint Monitored Page Component Analysis and Web Front End Options...95 Viewing Page Status Viewing the Status of All Monitored Pages in a Farm...97 Viewing the Status of a Single Monitored Page...99 Viewing Component Analysis Information for a Single Monitored Page Collecting a Page Component Analysis Immediately Collecting Page Load Metrics Immediately Opening a Monitored Page Editing Monitored Page Settings Removing a Monitored Page Viewing the Health of a Farm Reviewing the SharePoint Health Analyzer Content for the Farm Monitoring StoragePoint Timer Job Performance Viewing ULS Log Entries for a Farm Viewing the Status of Data Collection Jobs Viewing a Content Summary Viewing a Content Summary for Individual SharePoint Objects Viewing a Content Summary for Monitored Pages Refreshing the Content Summary Using the Web Dashboard to View Performance Data from Within a SharePoint Site Information in the Diagnostic Manager Web Dashboard Changing Web Dashboard Configuration Settings Reporting info@metalogix.com
6 Information Contained in Pre-Defined Reports Viewing Pre-Defined Report Definitions Creating and Using Metric Status Reports Creating and Using Custom Reports Running a Report Scheduling a Report Scheduling a Recurring Report for Which a Specific Time Period was Selected Creating a Scheduled Report Managing Scheduled Reports Managing Diagnostic Manager Temporarily Suspending Data Collection Disabling Data Collection for a Server Disabling Data Collection for a Web Application Disabling Data Collection for a Monitored Page Setting the Management Console Preferences Moving your Repository to a Different SQL Server Instance Setting the Collection Service Options Farm & Page Monitoring Scheduling Options Content Summary Options Server Monitoring Schedule Options Collection Service Security Options Repository Maintenance Options ULS Options Office365 Options Configuration Details info@metalogix.com
7 Welcome to Diagnostic Manager Diagnostic Manager is a powerful and intuitive monitoring solution that primarily helps administrators ensure the health of their SharePoint environment and the performance of their SharePoint applications. It saves time and money by dramatically reducing administrative overhead for IT and ensuring SharePoint business user productivity. Administrators can also use Diagnostic Manager to monitor servers, client machines, and Web pages not associated with a SharePoint environment. Diagnostic Manager provides real time monitoring from a single console, enabling you to quickly identify, diagnose, and resolve performance and availability problems. It also provides critical information for capacity planning by storing historical performance data of all the monitored servers. It monitors in real time, providing a comprehensive set of metrics that enable administrators to quickly pinpoint performance and availability issues related to server performance, resource usage and poorly performing HTML controls, solutions and Web controls. Key features include the following: Continuous, automated monitoring from a central console. Intuitive dashboard user interface for an "at-a-glance" view of SharePoint and server health. Page component level performance analysis. Summary and detail performance metrics. Automated alerting of poorly performing pages, controls and server performance issues. Repository of historical performance for trending and analysis. Comprehensive reporting. Centralized SharePoint Unified Logging System (ULS) logging for all SharePoint servers in the farm. How does Diagnostic Manager help me? Diagnostic Manager lets you monitor and analyze your Microsoft SharePoint farms, servers, ULS logs, and pages. The ways in which Diagnostic Manager can facilitate a number of tasks is described in the following table. Task How Offers easy installation and use. Installs quickly, enabling immediate performance access to any page. A typical installation takes less than 30 minutes. Additionally, the easy-touse UI makes it very easy to identify all performance issues on a single page. Solve SharePoint performance problems even when SharePoint is not available. Because Diagnostic Manager runs outside of SharePoint, you have access to historical data, alerts issued, up to the minute performance information, and much more for all SharePoint servers in your farm. Diagnostic Manager helps eliminate the risk of spending hours 7
8 Task How trying to find out what might have caused your SharePoint environment to fail or perform badly. Take control of your SharePoint health. Continuously monitor, diagnose, discover, analyze and fix SharePoint performance and availability issues efficiently. Quickly understand why your SharePoint servers are not performing well or why pages are taking long to load. Out-of-the-box monitoring. Instant and automatic monitoring of all SharePoint farm servers without the need to develop any kind of script. Take advantage of built-in default options to start monitoring your SharePoint servers immediately. Provides accurate and clean server-side performance metrics. Understand the real impact of the server-side performance metrics without interference from browser type, location, operating systems and connection speed. Have control of how an application is behaving in its 'raw' state, and easily determine any application performance issues. Quickly identifies worst performing page controls. Immediately identify the worst performing HTML controls, solutions and Web controls by quickly analyzing their load time, size and type. Collects component-level results. Powerful collection of page control elements that clearly differentiates page loading, execution, or rendering of individual page elements. Quickly and easily identify what is impacting page performance, without guessing! Provides true SharePointspecific analysis. Enables true visibility into SharePoint by exposing the inner workings of server controls, solutions, menus and other page elements. Using advanced methods, Diagnostic Manager allows clear analysis of all the Web page controls and parts before they are rendered into HTML and delivered to the user. Quickly identifies any potential Provides notifications of any potential problems found in any of the problems for any servers in SharePoint ULS logs for any of the servers in the SharePoint farm. the farm. (SharePoint 2010, 2013, and 2016) Monitor the health of Office 365 tenants Provides status information for Office 365 services (including SharePoint Online, Exchange Online, and Skype for Business) and their features. 8
9 Getting Started Use the following checklist to get started using Diagnostic Manager. Add one or more farms and/or Server Groups to monitor. See Adding a Farm to Monitor and Adding a Server Group Add one or more pages to monitor. See Adding a Page to Monitor. Configure the alerting thresholds. See Setting Alert Thresholds. If you want to receive alert notifications through , configure the settings. See Configuring Settings. Configure Diagnostic Manager to monitor Unified Logging System (ULS) See Enabling and Configuring ULS Log Entries (SharePoint 2010, 2013, and 2016). 9
10 The Diagnostic Manager Home Page The Diagnostic Manager Home page is a customizable dashboard that provides a graphical representation of overall health and key metrics for SharePoint farms, O365 tenants, and Server Groups. 10
11 Configuring your Deployment After initially installing and setting up Diagnostic Manager, you can perform the following configuration activities: Managing licenses Configuring Web proxy settings for monitoring O365 Tenants and Web pages Connecting to the Collection Service Adding a farm to monitor Adding a Server Group Manually adding servers to a farm or Server Group Adding a monitored page Setting default alert thresholds Configuring settings Setting the Management Console preferences Enabling and Configuring ULS Log Entries Managing Licenses Diagnostic Manager activates your license key during its installation by contacting a server. Diagnostic Manager will periodically refresh the activation as it runs. For customers without an Internet connection or who want to review the information that is being sent to, offline activation is available. Installations using offline activation must be manually refreshed every 365 days. Your license is based on the number of servers and/or Office 365 tenants that you want to monitor within your farms. If a server or tenant does not have a valid license, Diagnostic Manager does not collect data from it. Use the Manage Licenses dialog box to view the servers and/or tenants that have licenses assigned to them. In the Manage Licenses dialog box, servers with licenses assigned have selected check boxes. To access the Manage Licenses dialog: In the Management Console ribbon, choose Options > Manage Licenses. Normally, you license every server in your SharePoint farm. If the number of servers/tenants in exceeds the number of licenses, you must select the ones you want to license. NOTE: When a server in a clustered or SQL AlwaysOn environment is added, all of the other servers in the cluster/availability group are automatically added to the Management Console. In order to be monitored, these servers must also be licensed. 11

12 To select the servers to license: NOTE: For licensing purposes, Diagnostic Manager treats an Office 365 tenant's SharePoint Admin site as a "virtual" server. In the Licensed Servers tab, do one of the following: Select the check box for each server to which you want to assign a license. Clear the check box to remove a license from a server. Click [Select All] to assign a license to all servers. Click [Select All WFEs] to assign a license to all Web front end (WFE) servers. Click [Unselect All] to clear the check boxes for all servers. To copy a license key to the clipboard: In the Manage Licenses dialog box, click [Copy]. Now you can paste the license information into a different program to save the license data. Updating a License The Activate License dialog box lets you enter your new Diagnostic Manager license key. You must have a valid license key equal to or greater than the number of SharePoint servers you want to monitor. 12
13 You may need to update a license when you increase the number of servers you want to monitor and you receive another license from. To update a license: 1. In the Management Console, choose Options > Manage Licenses. 2. Click [Update license] to invoke the Activate License dialog. 3. In the Activate License dialog box, enter the license key. 4. Use the information in the following table to determine the appropriate option to use to activate the license. If... Then... you want to activate the license online from the local machine click [Activate]. you want to activate the license online using a proxy a) Make sure the Use a proxy server to access Internet box is checked b) Click [Proxy Settings...]. c) Make sure the Proxy Settings dialog has been completed with the following information: the Proxy Server name or IP address and Proxy Port or the Proxy Server url the credentials to be used when connecting to the internet. d) To verify connection to the proxy server, click [Test]. 13
![If... Then... e) Click [OK] to dismiss the dialog. you want to activate the license without internet access a) Switch to the Offline Activation tab.](/docs-images/85/91496342/images/14-1.jpg "b) On the Activate License dialog, enter the license activation key provided by. c) Follow the instructions that display in the dialog to complete the activation process: I.")
14 If... Then... e) Click [OK] to dismiss the dialog. you want to activate the license without internet access a) Switch to the Offline Activation tab. b) On the Activate License dialog, enter the license activation key provided by. c) Follow the instructions that display in the dialog to complete the activation process: I. Collect the Activation Data. You have the option to either Copy Activation Data to Clipboard or Save Activation Data to (text) File. II. Submit collected data to. Go to n.aspx and follow the instructions for submitting your activation data. When your activation key is returned, you have the option of copying it to the clipboard or saving it to a data file. Make sure that you choose the option to save to a 14
15 If... Then... data file as it is the only method that the Activate License dialog allows. III. Upload the Activation Key File obtained from to the Activate License dialog. IV. Click [Activate]. d) When the License activation succeeded message displays in the lower-left corner of the dialog, click [Close]. Installations using offline activation must be manually refreshed every 365 days. If you originally activated your Diagnostic Manager license offline and it has been active for more than 365 days, when you launch the Management Console the splash screen may display a message that your license has expired. Connecting to the Collection Service The Collection Service collects data from your SharePoint farms and Server Groups and stores it for the Management Console to access. You connect the Diagnostic Manager Management Console to a Collection Service. The Management Console can connect to a single Collection Service at a time. If your network includes multiple Collection Services, you can connect to each in turn. NOTE: If you run the Management Console on a computer that also hosts the Collection Service, then Management Console connects to the local Collection Service by default. You can manually select a different Collection Service. To connect to the Collection Service: 1 In the Management Console ribbon, choose Home > Connect to Collection Service. 2 In the Connect to the Collection Service dialog box, type the name or IP Address of the computer that hosts the Collection Service. 3 Click [OK]. Configuring Web Proxy Settings for Monitoring O365 Tenants and Web Pages If you want to monitor O365 tenants and public Web pages from a machine that does not have Internet access or you want to use a secure connection, you can specify a proxy server to use for connecting to the Internet. 15
16 IMPORTANT: If you want to monitor an O365 tenant using a proxy, before you add the tenant to Diagnostic Manager you must first configure the proxy in Internet Explorer. Otherwise, the message "Navigation to the Web page was canceled" will display when you attempt to add the tenant. Once the tenant has been successfully added, however, the proxy setting is no longer needed in Internet Explorer. To configure web proxy settings: 1. From the Management Console Options tab, click Web Proxy Settings. 2. On the Proxy Settings dialog, make sure the Use proxy server to access Internet box is checked and the dialog has been completed with the following information: the Proxy Server name or IP address and Proxy Port or the Proxy Server url the credentials to be used when connecting to the internet. 3. To verify connection to the proxy server, click the [Test] button. 4. Click [OK] to dismiss the dialog. Adding a Farm to Monitor Diagnostic Manager lets you monitor On-Premises SharePoint farms and/or Office 365 tenants. You first must add the farm to the Management Console before Diagnostic Manager can provide you with data. Before Adding a Farm to monitor: Make sure the account(s) you will be using for data collection meet the requirements for Account(s) Used for Data Collection. To add a farm to monitor: 2 Use one of the following options: In the Management Console tree, select the Home Page node, right-click then choose Add Farm. OR 3 In the Management Console ribbon, choose Home > Add Farm. For Farm name, enter a "friendly" name that you would like to have appear in the Management Console. 16
17 NOTE: This name appears only in Diagnostic Manager and does not need to match any other name for the farm that is used outside the product.. Shha 4 If you are adding an Office 365 Tenant (rather than a SharePoint On-Premises farm), change the value in the Farm type drop-down. 5 Click [Next]. 6 Use the information in the following table to determine the appropriate action to take. If you are adding... Then... a SharePoint On-Premises farm for Topology Server Data, enter the name or IP address of any Web front end 17

18 If you are adding... Then... The Collection Service contacts the server that you specify and uses information from the registry on the Topology Server to locate the SharePoint configuration database. The Collection Service then queries the configuration database to determine the servers that make up the farm and the roles the servers play. an O365 Tenant The Office 365 Authentication dialog displays. NOTE: If you have previously added an O365 Tenant to Diagnostic Manager, the dialog displays any previouslyauthenticated accounts. 18
 Enter the Name and Password of the Office 365 account used to access the administration site, which will be used to authenticate with Office 365.")
19 If you are adding... Then... Click Use another account to authenticate different O365 Tenant credentials. a) Enter the Name and Password of the Office 365 account used to access the administration site, which will be used to authenticate with Office 365. b) After dismissing the Office 365 Authentication dialog, on the Add Farm - Office 365 page enter the Office 365 Administration URL and re-enter the credentials (Diagnostic Manager will use this information to collect Content Summary data) That is: SharePoint Administration URL - The url of the Office 365 administration site for your organization The User Name and Password of the Office 365 account used to access the administration site 19
![7 Click [Next]. 8 Use the information in the following table to determine the appropriate action to take. If you are adding... Then... a SharePoint On-Premises go to the next step.](/docs-images/85/91496342/images/20-0.jpg "farm an Office 365 Tenant 9 go to Step 10.")
20 7 Click [Next]. 8 Use the information in the following table to determine the appropriate action to take. If you are adding... Then... a SharePoint On-Premises go to the next step. farm an Office 365 Tenant 9 go to Step 10. If you are adding a SharePoint On-Premesis farm and want to collect data using credentials other than the Collection Service Account specified when the Collection Service was installed: a) Check the appropriate option(s): Gather server performance data using WMI Query SharePoint database for farm topology and SQL Server information Test page performance and availability b) Click [Next]. For each option you selected, you will be prompted to enter credentials for the alternate account. c) Enter the User Name and Password for an account that has the appropriate permissions. 20
21 NOTE: Remember to enter the full account name (for example, domain\user name). If an account fails validation, an error message displays in the Account Test Results dialog. If you want to copy the text of the message to the clip board, click [Copy]. You can then paste the information into another program. Click [OK] to dismiss the dialog, then fix the issue and re-enter credentials. When credentials have been succsssfully validated, click [Next]. 10 For Setup Your Alerts, either Apply default or select Apply custom and select/deselect individual alerts and/or adjust the thresholds that you want to apply for the farm. NOTE: If you change the Alert priority, you can sort the Priority column in the Alerts view according to relative importance. 21
22 11. Click [Next]. A Summary of the data you specified on the previous dialogs displays. 12 If you are adding a SharePoint 2010, 2013, or 2016 On-Premises farm and want to Check server access and permissions for all servers in the farm, check this box. (This option is unavailable for SharePoint 2007 farms). If you uncheck this box, the server access and permissions check will be skipped. NOTE: You can perform this check at any time from within the Management Console using the Check Server Access option. 22
23 If Check server access and permissions was selected on the Summary dialog, when you click [Next], the following information will display for each server in the farm: For a farm Topology server, access to the Config database connection string For each server in the farm: WMI access to Windows Registry, and Windows Services access to the master database of each SQL Server instance. 23
24 If the account fails any of the server access and permissions checks, you can fix the issue on the affected server(s) then [Run Checks Again]. 12 Click [Finish] to add the farm to the Management Console tree The Collection Service stores the list of monitored farms in the Repository. Any user of the Management Console can add farms to the Collection Service or review any of the collected data. NOTE: If you want to be able to collect component analysis data for the farm, remember to install the Component Analysis solution in the farm. Refer to the Diagnostic Manager Advanced Installation Guide for details. Account(s) Used for Data Collection On Premises Data Collection Account Requirements For on premises SharePoint farms, data collection is by default performed using the credentials of the Collection Service account. However, whenever you add a farm to monitor, you have the option of specifying different accounts to use for the collection of different types of data. Account requirements depend on the type of data being collected, as described in the following table. For the collection of... Then the account must have... Farm Data read access to the SharePoint Farm Configuration 24
25 For the collection of... Then the account must have... database. Server Performance access to the Windows Management Instrumentation (WMI) data for every Windows server and SQL server to be monitored. NOTE: Normally, this is a local administrator account. If it is not possible for the account to be a local administrator, several fine-grained-permissions must be granted instead. However, if the account is not a local administrator, you will be unable to start and stop application pools from within the Management Console. Contact Support for details. Page Performance and Availability the following fine-grained SharePoint permissions to all areas of the farm (Web applications, site collections, sites, lists, and items): View items View Application Pages NOTE: These fine-grained permissions are, by default, included in the Web Application Permission Policy Level Full Read. SQL Server Information ideally, membership in the sysadmin role, which will provide the account with all of the permissions it needs to query the SQL server instance and all of its databases. NOTE: If it is not possible for the account to be a sysadmin, several fine-grained-permissions must be granted instead. Contact Support for details. Content Summary Data the Site Collection Auditor role for all site collections within a monitored Web application (which is, by default, included in the Web Application Permissions Policy Levell Full Read). EXCEPTION: If you want to monitor the Central Administration Web application, the account must have the Site Collection Administrator role (which is, by default, included in the Web Application Permissions Policy Level Full Control). 25
26 Office 365 Tenant Data Collection Account Requirements If you are monitoring one or more Office 365 tenants, the account used to collect data must be: an Office 365 global administrator AND a site collection administrator for each SharePoint Online site collection to be monitored. Editing a Monitored Farm You can change the name, topology server, and/or access credentials for a monitored farm. When you edit the farm, you can specify a different name to use in Diagnostic Manager. The new name does not appear in SharePoint itself. If you are upgrading from a version of Diagnostic Manager older than 4.8 and are monitoring one or more O365 Tenants, you will receive an alert to provide Office 365 Authentication using the Edit Farm option. You can also specify the name or IP address of a different server that the Collection Service should use as the Topology Server. The new Topology Server should be a member of the same farm. The Collection Service contacts the server that you specify and uses information from the registry on the Topology Server to locate the SharePoint configuration database. The Collection Service then queries the configuration database to determine the servers that make up the farm and the roles the servers play. The Collection Service uses the Farm Data credentials that you specify to access the Topology Server. If you want to replace one farm in the Management Console with a different farm, you should remove the existing farm, then add the new farm. The Collection Service stores the list of monitored farms in the repository. Any user of the Management Console can add farms to the Collection Service, make changes to the farms, and review any of the collected data. To edit a monitored farm: 1 In the Management Console tree, select the farm you want to edit, right-click then choose Edit farm. 2 Update the appropriate fields on the Edit Farm dialog(s). (See also Adding a Farm to Monitor.) 3 Click [OK]. Removing a Monitored Farm If required, you can remove a farm and stop monitoring it. When you remove the farm, all of the stored farm data, all of the alerts related to the farm, and all of the farm configuration information are deleted immediately. Diagnostic Manager allows you to make changes to an existing farm. (See Editing Monitored Page Settings.) 26
27 When you no longer need to monitor a farm, you can remove it from the Management Console. To remove a farm: In the Management Console tree, select the farm you want to remove, right-click then choose Remove Farm. You will be prompted to confirm the action before continuing. Refreshing the Farm List When it starts, the Management Console collects a list of the farms monitored by the Collection Service. If needed, you can force it to refresh the list at any time. To refresh the farm list in the Management Console: In the Management Console ribbon, choose View > Refresh Farm List. The Management Console retrieves an up to date list of the monitored farms from the Collection Service and lists them in the tree. Adding a Server Group You can create a Server Group to monitor metrics for up to ten Windows servers and/or clients* that are not necessarily associated with a SharePoint farm. The metrics you can monitor include: Servers SQL Servers Monitored Web Pages Resources * For Windows clients, Resources are the only metrics that can be monitored. Note that a SharePoint node does not display in the Management Console tree for a Server Group, even if SharePoint is present. SharePoint can be monitored only via the Add Farm functionality. Before adding a Server Group: All servers and/or clients in a group share common accounts for data collection. Make sure the account(s) you will be using for data collection for the group meet the data collection requirements for server performance. To add a Server Group: 1 Use one of the following options: In the Management Console tree, select the Home Page node, right-click then choose Add Server Group. In the Management Console ribbon, choose Home > Add Server Group. 27
28 2 For Name, enter a "friendly" name for the group that you would like to have appear in the Management Console tree. 3 Click [Next]. 4 If you want to collect data using credentials other than the Collection Service Account specified when the Collection Service was installed: a) Check the appropriate option(s): Gather server performance data using WMI Query databases for SQL Server information Test page performance and availability b) Click [Next]. For each option you selected, you will be prompted to enter credentials for the alternate account. c) Enter the User Name and Password for an account that has the appropriate permissions. 28
29 NOTE: Remember to enter the full account name (for example, domain\user name). If an account fails validation, an error message displays. You can either click [Yes] to ignore the warning and continue creating the server group with the specified account OR click [No] to fix the issue then re-enter credentials 5. Click [Next]. 6 For Setup Your Alerts, either Apply default or select Apply custom and select/deselect individual alerts and/or adjust the thresholds that you want to apply for the Server Group. NOTE: If you change the Alert priority, you can sort the Priority column in the Alerts view according to relative importance. 29
30 NOTE: You can further customize alerts for individual servers within the Server Group after the Server Group has been added. 7. Click [Next]. A Summary dialog displays. 8. If you want to servers to the group (up to a maximum of 10): a) click [Add Server>]. b) In the Add Server dialog box, enter the Server name. NOTE: You can enter a machine name, IP address, or fully qualified domain name (FQDN). c) Repeat substeps a) and b) for each server you want to add to the group. 30
![9. Click [Finish]. The server group now displays in the Management Console tree. Now you can add monitored pages to the group.](/docs-images/85/91496342/images/31-0.jpg "Editing a Server Group You can change the name and/or access credentials for a Server Group.")
31 9. Click [Finish]. The server group now displays in the Management Console tree. Now you can add monitored pages to the group. Editing a Server Group You can change the name and/or access credentials for a Server Group. If you want to add or remove servers within the group, use the procedure for Manually Adding and Removing Servers to Monitor. To edit a Server Group: 1 In the Management Console tree, select the Server Group you want to edit, right-click then choose Edit farm. 2 Update the appropriate fields on the Edit Server Group dialog(s). (See also Adding a Server Group.) 3 Click [OK]. Manually Adding and Removing Servers to Monitor When you add a farm to Diagnostic Manager, the Management Console automatically adds the servers that make up the farm to the Farm Server list. Periodically, the Management Console refreshes its list to keep it up to date. You can also add servers manually that the farm depends on for information that are not part of the farm. You can also add new servers that you create or servers that are not automatically added. You can also add servers manually (up to a maximum of 10) to a Server Group. After you manually add a server, Diagnostic Manager does not make a distinction between it and any servers added automatically. Diagnostic Manager uses the same credentials to access the servers that were added both manually and automatically. A server must be available to add it manually. If the server is not available, you cannot add it. 31

. 4 Click [OK]. 5 The server and its components now display under the appropriate farm or Server Group node.")
32 After you add a server, you cannot change the server name or farm. You can remove the server from Diagnostic Manager or disable it (see Temporarily Suspending Data Collection). When you delete a server, Diagnostic Manager deletes the historical data for the server. To add a server manually: 1 In the Management Console tree, select a farm node, server node, or Server Group. 2 Either: right-click and choose Add Monitored Server. OR 3 In the Farm section of the ribbon, choose Overview > Add Monitored Server. In the Add Server dialog box, enter the Server name. NOTE: You can enter a machine name, IP address, or fully qualified domain name (FQDN). 4 Click [OK]. 5 The server and its components now display under the appropriate farm or Server Group node. Note that: If the server you added is part of a cluster and/or SQL AlwaysOn availability group, all other servers in the cluster/availabiliy group will be added to the Management Console automatically. In order to actually be monitored, however, these servers must also be licensed. 32

 You can, however, disable data collection from automatically-added servers.")
33 If you added a Windows client to a Server Group, the only associated component is Resources. To remove a manually-added server: NOTE: You can only remove servers that were added manually. You cannot remove servers that Diagnostic Manager discovers automatically. (In the case of a server that was discovered as part of a cluster or SQL AlwaysOn availability group, If you attempt to remove it, it will be re-discovered.) You can, however, disable data collection from automatically-added servers. In the Management Console tree, select the manually-added server that you want to remove, right-click then choose Remove Server. You will be prompted to confirm the action. Setting Farm or Server Group "Quiet Hours" By default, Diagnostic Manager provides continuous, 24/7 monitoring of your SharePoint farms and any Server Group(s) you have added. You can, however choose to set regular "Quiet Hours" during which time monitoring, data collection, and alert processing is suspended for all objects modified in the farm or Server Group. To set "Quiet Hours" for a farm or Server Group: 1 In the Management Console tree, select the farm (or Server Group) for which you want to set Quiet Hours. 2 Use one of the following options: Right-click and choose Edit Farm Settings (or Edit Server Group Settings). OR 33
34 In the Farm section of the ribbon, choose Overview > Edit Farm Settings (or Overview > Edit Server Group Settings). 3 Check the Make Farm quiet in this time period (or Make Server Group quiet in this time period) box to enable remaining fields. 4 To specify Quiet Hours: Select the Start time and End time for which you want monitoring, data collection, and alerts to be suspended. NOTE: The time interval you select reflects the local time of the Management Console machine where the Quiet Hours are set. 5 Check each of the days for which you want the Quiet Hours to apply. When you have finished setting Quiet Hours, click [OK]. Configuring Settings Diagnostic Manager uses settings: to send notifications when warning or critical conditions you define occur AND for the distribution of scheduled reports. You use the Alert Thresholds dialog to specify when Diagnostic Manager generates an alert. You use the Alert Responses dialog to configure how Diagnostic Manager responds to the alert, including when Diagnostic Manager sends notifications. NOTE: Diagnostic Manager only sends an when an alert changes status, not when an alert remains in the same state. 34
35 To configure the settings: 1 In the Management Console ribbon, choose Options > Settings. 2 Complete the Information section as describe in the following table. 3 Field Data to Enter Sender Address The address that appears as the sender of the . Reply-to Address The address that appears as the reply-to address. All replies to the message are sent to the address you specify. You must specify a reply-to address to receive replies to the . Message Footer Text that you want to appear in the footer of the s Diagnostic Manager sends. Diagnostic Manager includes the text that you specify in every alert that it sends. Complete the Outgoing Mail Server Information section as described in the following table. Field Data to Enter SMTP Server Address The name or Internet Protocol (IP) address of your SMTP mail server. SMTP Server Port The IP port that the SMTP mail server uses. (The default SMTP port is port 25.) If you want Diagnostic Manager to use SSL encryption to connect to the mail server, check Use an SSL encrypted connection. SMTP Server required authentication If your SMTP server requires authentication: check this box AND specify a valid user name and password that Diagnostic Manager can use to access the mail server. 4 To use the settings you specified to send a test message click [Test Settings]. NOTE: Diagnostic Manager prompts you for the address to which you want to send the test message. 5 Click [OK]. 35
36 Configuring the SNMP Settings You can use the Diagnostic Manager to generate Simple Network Management Protocol (SNMP) Traps in response to Alerts. The traps generated by Diagnostic Manager comply with version 1 of the SNMP standards. You can use the Management information base (MIB) file and the generated traps in conjunction with your SNMP management software to respond to alerts. NOTE: Diagnostic Manager only generates SNMP traps in response to Diagnostic Manager alerts and does not act as an SNMP agent. Diagnostic Manager includes an MIB file that is installed on the computer that hosts the Management Console. The file name is.mib. The file is installed at the top level of the installation directory. You can use the MIB file with your SNMP management software to collect the SNMP traps that Diagnostic Manager generates. See your SNMP management tool or consult your SNMP administrator for information about installing and using the MIB file. To configure the SNMP settings: 1 In the Management Console ribbon, choose Alerting > SNMP Settings. 2 Complete the SNMP Settings dialog as described in the following table. NOTE: The administrator of your SNMP management tool should be able to provide this information Field Description SNMP Server Address The IP Address or the name of the SNMP server to which generated traps should be sent. Port The Port on which the SNMP management software listens. Community The name of any SNMP community to use for the provider 3 Click [OK]. 4 In your SNMP management tool, verify that the trap was received correctly. Enabling and Configuring the Collection of ULS Log Entries (SharePoint 2010, 2013, and 2016 On Premises) You can use Diagnostic Manager to collect ULS log entries from SharePoint then to sort, filter, and group by a variety of criteria to further monitor the health of your SharePoint environment and diagnose potential issues. From the Collection Service Options - ULS tab, you can enable the collection of ULS log entries from SharePoint (synchronized across all monitored farms), specify what level of log entry you want to be collected, how often you want them to be collected, and how long you want them to be retained. 36
37 NOTE: This feature is not available for SharePoint 2007 or Office 365 tenants. Prerequisites For the SharePoint timer job to collect ULS log data, usage and health data collection must be enabled in SharePoint. For details, refer to the applicable Microsoft TechNet article: For SharePoint 2016 For SharePoint 2013 For SharePoint 2010 In order to use the Diagnostic Manager ULS Log Viewer: The latest version of the Diagnostic Manager Component Analysis Solution must be installed and deployed to every farm whose ULS log entries you want to view. The Diagnostic Manager ULS Synchronizer must be activated. (This feature is initially activated as part of the Component Analysis installation). Remember that the Collection Service account must have the appropriate VIEW permissions to the SharePoint Logging database. See the Account Requirements topic in the Diagnostic Manager Advanced Installation Guide for complete Collection Service account requirements. To enable and configure the collection of ULS log entries: 1 In the Management Console ribbon, choose Options > Collection Service Options. 2 Click the ULS tab. The Collection Service Options - ULS tab contains the following options. Option Description Enable gathering of ULS data When this box is checked, Diagnostic Manager will be permitted to gather 37
38 Option Description from SharePoint databases ULS data from SharePoint once the ULS Synchronization Schedule has been enabled and set. Gather ULS log entries from SharePoint Database How often the Collection Service should gather ULS log entries from SharePoint. ULS log retention The number of days Diagnostic Manager should retain ULS log entries in the Repository database. Enables the SharePoint Timer Job Diagnostic Data Provider: Trace Log and overrides the schedule set in Central Administration for all monitored farms and servers. ULS Synchronization Schedule If the Diagnostic Data Provider: Trace Log timer job has never been enabled in SharePoint or has not been run recently, the synchronization of what may be a significant amount of accumulated log data across multiple servers and/or farms is required. Therefore, the time it takes to complete the initial synchronization may range from several minutes to several hours. Subsequent synchronizations are performed incrementally, and therefore can be completed in much less time. The minimum level of severity for which Diagnostic Manager will gather ULS log entries. (That is, Diagnostic Manager will gather only log entries that are of the severity you specified and higher.) Minimum Log Level Click the icon to display the options from which to select. See "Minimum Log Entry Level Values," following for descriptions and rankings of log entry severity levels. 38

39 Minimum Log Level Values The following table describes the available Minimum Log Level values, listed from highest to lowest severity. Level Definition High General functional detail for the high priority events that happen in the environment. Examples include global configuration modifications, service start and stop, timer jobs completed, and so on. Critical Events that demand the immediate attention of the system administrator. They are generally directed at the global (system-wide) level, such as System or Application. They can also be used to indicate that an application or system has failed or stopped responding. Error Events that indicate problems, but in a category that does not require immediate attention. Warning Events that provide forewarning of potential problems. Although not a response to an actual error, a warning indicates that a component or application is not in an ideal state and that some further actions could result in a critical error. Unexpected A logic check failed that is not typical, or the message returns an unexpected error code. These generally represent code bugs that should be investigated and fixed. Monitorable Traces that indicate a problem, but do not need immediate investigation. The intent is to collect data and analyze it over time, 39
40 Level Definition looking for problem trends. Information Events that pass noncritical information to the administrator, similar to a note that says: "For your information." Verbose Verbose status, such as progress or success messages. VerboseEx Useful for traces that are likely to be high volume, especially information that is not needed for all debugging scenarios. Examples of situations where you should use the VerboseEx setting are method entry and exit events, tracing in loops, or to relay information that is not useful to developers outside your team. Disabling the Gathering of ULS Log Data and Clearing ULS Log History To disable the gathering of ULS data by Diagnostic Manager: NOTE: The disabling of ULS data gathering by Diagnostic Manager does not disable nor does it change the current schedule of the Diagnostic Data Provider: Trace Log timer job in SharePoint. If you want to disable the timer job itself, you can do so via SharePoint Central Administration. On the Collection Service Options - ULS tab, uncheck the Enable Gathering of ULS data from SharePoint databases. box. To clear ULS Log History from the Diagnostic Manager Repository database: On the Collection Service Options - ULS tab, click [Clear ULS History]. 40
41 Using Alerts You can use Diagnostic Manager alerts to help you monitor your SharePoint farms, Server Groups, and Office 365 tenants. You specify the conditions that trigger Warning and Critical alerts. When the Collection Service detects these conditions, it generates an alert. You can set default conditions or set conditions on a per-server and perpage basis. You can specify comments that Diagnostic Manager includes in alerts. You define the alert comments for each metric separately. You can set a default comment for all alerts for a particular metric. You can also customize comments for server and monitored page alerts. When an alert is generated, it is an active alert. When the alert is superseded or no longer applies, it is no longer an active alert. You can choose to view all alerts or only active alerts. You can specify if alerts are written to the event log or if an is sent. You also have the option of clearing an alert. A cleared alert no longer appears in the Management Console and does not impact the status of the page, server, or farm that used it. About Alerts When the conditions that triggered an alert change, Diagnostic Manager can generate a new alert. Not all alerts are of the same importance. Depending on their importance, each alert can be a Warning Alert or a Critical Alert. You can use the Alerts view to filter alerts based on the alert importance. The alert status for any monitored page, server, or farm is based on the most recently generated alert status for each of the elements that make up the component. The most serious alert status for any element dictates the alert status for the component as a whole. When you review the alerts for the component, you can see the alerts for the elements that make up the component. When Diagnostic Manager calculates the status of a page, server, or farm, metrics with cleared alerts are treated as if their status was OK. A cleared alert does not cause a Warning or Critical component status. When you disable data collection for any monitored page or server, the alert status for that component is set to OK. When you enable data collection again, the status remains OK until new data is collected. In the same way, if you disable Page Load Time testing or Page Component Analysis, the alert status for the disabled test is set to OK. When you enable the test, the status remains OK until new data is collected. Viewing Alerts The means by which you access Active Alerts depends on which node you select in the Management Console tree. For example, you can view alerts for a monitored farm or Server Group by double-clicking a bar in the 41

42 Active Alerts graph on the dashboard, by selecting the Alerts node, or from the the Alerting tab in the Farm section of the ribbon. The ribbon for each individual server also includes an Alerting tab, while alerts display in the Overview page for the Servers and Monitored Pages nodes. The following information appears in the list of active alerts: Information Description Alert severity An icon indicating the severity level of the alert. The relative importance of the alert. Priority You can sort this column to group alerts by priority. The default value for Priority is 3, but you can change this value when you edit alert thresholds. Change The way that the alert reached the current level. Time The date and time when the alert was generated. Alert The name of the metric that generated the alert. Farm / Group The farm or Server Group where the selected server resides. Server The server the alert affects. Instance The instance that the alert affects. For some metrics, more than one instance of the source of the metric can exist for a given server or page. Value The actual value of the metric that is the source of the alert. 42
 OR double-click the alert or right-click and choose View alert details to open the detail in")
43 Viewing Alert Details To view alert details: In the Alerts view, select the alert whose details you want to view. Now you can either: review the information in the Details section at the bottom of the pane (if available) OR double-click the alert or right-click and choose View alert details to open the detail in a separate window. The information that appears in the alert details can vary, depending on the metric to which the alert applies. The following information can appear in the alert details: Information Description Severity The severity of the alert. Metric The type of condition that generated the alert. Instance The instance name, if any, that generated the alert. The instance appears only for applicable alerts. Server The server that generated the alert. 43
44 Information Description Value The actual value of the metric that is the source of the alert. Time The time that an event generated the alert. Farm The SharePoint farm or Server Group that generated the alert. Change The change that the alert represents. Page (if applicable) The page for which the metric generated the alert. If the alert is for a server, then Diagnostic Manager does not display a page. Warning Threshold When a metric value meets the specified threshold, Diagnostic Manager creates an alert with the warning severity. You can edit your alert thresholds by clicking [Edit Alert Thresholds]. Diagnostic Manager displays this button only if the alert threshold is editable. Critical Threshold When a metric value meets the specified threshold, Diagnostic Manager creates an alert with the critical severity. You can edit your alert thresholds by clicking [Edit Alert Thresholds]. Diagnostic Manager displays this button only if the alert threshold is editable. Details Details about the alert condition. Comments Any comments that you included in the alerts. You specify the comments to include when you define the alert condition. Metric History The history of the alert over a specified period. This information appears only for alerts containing a numeric component. Alert Information Information about the significance of the metric from the Diagnostic Manager Knowledge Base. You can add custom information about the metric as it applies to your SharePoint farm by clicking [Edit Knowledge Base]. See also Customizing the Knowledge Base. Clearing an Alert If you clear a warning alert and the condition becomes more serious, Diagnostic Manager generates a critical alert. If you clear a warning alert or a critical alert and the condition becomes less serious then becomes more serious again, Diagnostic Manager generates a new warning or critical alert. 44
![To clear alerts in any view: In any view where an alert appears, select the alert or group of alerts (using the [Ctrl] key to multi-select), right-click then choose Clear alerts.](/docs-images/85/91496342/images/45-0.jpg "NOTE: While the alert is cleared, the metric it represents is treated as if it was OK when Diagnostic Manager rolls up the metric into the status of a component.")
45 To clear alerts in any view: In any view where an alert appears, select the alert or group of alerts (using the [Ctrl] key to multi-select), right-click then choose Clear alerts. NOTE: While the alert is cleared, the metric it represents is treated as if it was OK when Diagnostic Manager rolls up the metric into the status of a component. That is, no component can have a warning or critical status as a result of a cleared alert. Editing Alert Thresholds You can specify the conditions on monitored SharePoint farms, Server Groups, servers, and pages that trigger alerts. You can specify the type of alert generated and how Diagnostic Manager responds to alerts. For certain alerts, you can choose to wait a specified period of time before Diagnostic Manager raises the alert. Other alerts allow you to exclude certain server instances from the alert. NOTE: When you specify the alert settings, you can create Warning Alerts and Critical Alerts. The trigger for the Critical Alert is always more serious than the trigger for the Warning alert. Note that for some alerts, a lower value is more serious than a higher value. These alerts include: Free Physical Memory (KB) Free Virtual Memory (KB) Disk Free Space (MB) Disk Free Percent (%) Disk metrics include all mounted disks and mount points. For some metric types, you can exclude some data sources. For example, in some disk metrics, you can exclude volumes from the alerts. You can exclude items at the default level, or for individual objects in the farm. Default Thresholds vs. Object-Specific Thresholds Default alert thresholds are those that apply to all new farms, Server Groups, servers, and pages that are added to Diagnostic Manager. Initially, these alert thresholds are specified for only the most common 45
46 SharePoint needs. You can, however, change them to optimize Diagnostic Manager for the needs of your environment. You can also set alert thresholds that are specific to individual objects, such as farms, servers, and monitored pages. NOTE: Currently you can only set SharePoint-specific alert thresholds at the individual farm level. The option is disabled for Server Groups. Excluding Server Instances from Alerts Diagnostic Manager allows you to exclude some server instances from alerting on some metrics. Currently, metrics that allow you to exclude are included in the Disk and SQL Server Database sections of the Alert Thresholds dialog box. The Do not raise alerts for the following disks and Do not raise alerts for the following databases options allow you to type the name of one or more disks or databases you do not want included in that alert. To specify the conditions that trigger alerts 1 Use the information in the following table to determine the appropriate action to take. If you want to set... Then... default (global) alert thresholds In the Management Console ribbon, choose Options > Default Alert Thresholds. alert thresholds for a specific farm alert thresholds for a specific server alert thresholds for all monitored pages in a farm From the Management Console tree, select the farm or the Content Summary node of the farm for which you want to set alert thresholds. Use one of the following options: right-click then choose Edit alert thresholds for Farm. in the Content Summary section of the ribbon, choose Content > Edit alert thresholds for farm. in the Farm section of the ribbon, choose Alerting > Edit Alert Thresholds for farm. From the Management Console tree, select the server for which you want to set alert thresholds. Use one of the following options: right-click then choose Edit alert thresholds for Server. in the Server section of the ribbon, choose Alerting > Edit Alert Thresholds. From the Management Console tree, expand the applicable farm's Monitored Pages node. Use one of the following options: right-click then choose Edit alert thresholds 46


47 If you want to set... Then... 2 in the Monitored Pages section of the ribbon, choose Edit Alert Thresholds. In the Alert Thresholds dialog box, select a metric that should trigger an alert. Make sure the box is checked, to enable editing. Default Alert Thresholds dialog Object-specific Alerts Thresholds dialog 3 Specify the conditions that trigger the alert. 47
48 NOTE: If you change the Alert priority, you can sort the Priority column in the Alerts view according to relative importance. 4 If the alert lets you specify a waiting period, you can use the Raise alert after metric exceeds threshold field or the Raise alert after metric is in this state field to specify the number of minutes after the threshold has been exceeded before Diagnostic Manager generates the alert. 5 If the alert lets you specify items to exclude, you can specify the objects to exclude in the Do not raise alerts field. Use the format c: or c:\mount when specifying your disk or SQL Server database. Note that the instance name entered must match the instance name displayed in the alert. For example: SQL Server: aadams\named Database: master Entry necessary to exclude: [aadams\named].master 6 Use the information in the following table to determine the appropriate action to take. If you want to... Then... For Default (global) alert thresholds reset all alert thresholds to their initial status click [Reset to default]. select additional objects to which you Click [Copy To]. want to apply some or all of the threshold a) In the Select Target Objects dialog, check the objects to settings which you want to apply the thresholds (or check Select All Objects). NOTE: By default, default values for All Thresholds will be applied to the selected object. You can however, choose to apply Only changed Thresholds. 48
![If you want to... Then... b) Click [Apply Changes]. For object-specific alert thresholds only reset the object's thresholds to the global click [Reset to default].](/docs-images/85/91496342/images/49-0.jpg "default thresholds set the global default thresholds to the object's current thresholds 7 click [Save as default].")
49 If you want to... Then... b) Click [Apply Changes]. For object-specific alert thresholds only reset the object's thresholds to the global click [Reset to default]. default thresholds set the global default thresholds to the object's current thresholds 7 click [Save as default]. Click [Apply Changes] to save the changes and close the dialog box Configuring the Alert Responses You can configure how Diagnostic Manager responds to alerts. For example, when an alert threshold is met you can have Diagnostic Manager send an write an event log entry, and/or generate an SNMP trap. You can set up a unique response to every alert condition or use the same response to the same change in more than one metric. You can also specify the objects to which the response applies. 49

50 To access the Alert Responses dialog: In the Management Console ribbon, choose Alerting > Alert Responses. Now you can: add a new alert response clone an existing alert response edit an existing alert response enable/disable an alert response Adding an Alert Response To add an alert response: 1 In the Alert Responses dialog ribbon, choose Add Alert Response. 2 In the Add Alert Response dialog box, specify a Name for the alert response. You can also enter a Description for the alert response. The description is for your benefit. Diagnostic Manager does not use the description that you enter. If you leave the Enable this alert response check box selected, the alert response is enabled. 3 From the Alert Severity drop-down, select the condition that triggers the response. 4 For Performance Metric, you can click Any metric if you want any metric to trigger the response. You can click Selected metrics and then click [Edit] to choose one or more metrics if you want a subset of the metrics to trigger the response. 5 For Object Scope, you can click Any farm, server, or page if you want any object to trigger the response. You can click Selected objects and then click [Edit] to choose one or more objects if you want a subset of the objects to trigger the response. 6 For Response Actions, select what happens when an alert triggers the response. You can select one or more of the following: Send to, then specify one or more recipients (see also Configuring Setting) CAUTION: settings are common across Diagnostic Manager operations. For example, any changes made to settings initiated from the Alert Responses dialog will also impact Scheduled Reports. Write Event Log Entry 50
![7 Generate SNMP Trap (see also Configuring the SNMP Settings) Click [OK] to save the settings for the alert response.](/docs-images/85/91496342/images/51-0.jpg "Cloning an Alert Response You can create a new alert response based on existing one using the Clone Alert Response option.")
51 7 Generate SNMP Trap (see also Configuring the SNMP Settings) Click [OK] to save the settings for the alert response. Cloning an Alert Response You can create a new alert response based on existing one using the Clone Alert Response option. To clone an alert response: 1 In the Alert Responses dialog, click the alert response on which you want to base the new one. 2 In the ribbon, click the Clone Alert Response icon. 3 Enter a new Name for the alert response. (By default, the name of a cloned alert response is the same as that of the existing one with "- Copy" appended to the end of the name.) 4 Edit the remaining fields in the dialog as needed. 5 Click [OK] to save the new alert response and close the dialog. 51

52 Customizing the Knowledge Base Diagnostic Manager includes a Knowledge Base with information about each of the individual metrics that it can track for the servers and pages in your SharePoint farm. When Diagnostic Manager generates an alert, it includes the text of the Knowledge Base article. The Knowledge Base article includes information about each metric. You can also add a custom article to the Knowledge Base for each metric. As with the built-in Knowledge Base, this custom article is included in each Alert generated for the metric. The custom article is included when an Alert is sent via or as a Simple Network Management Protocol (SNMP) trap. You can use the custom Knowledge Base article to specify information about your particular SharePoint environment and how alerts should be handled. To access a Metric Knowledge Base article 1 2 Use one of the following options: In the Management Console ribbon, choose Alerting > Knowledge Base. In the Alert Details dialog box for a specific alert (see "Viewing Alerts"), click the Edit Knowledge Base Article hyperlink. In the Metric Knowledge Base dialog, select the metric whose Knowledge Base article you want to customize. You can click the plus (+) symbol beside a metric group to expand it. 52
53 To customize the Knowledge Base: 1 In the Custom Knowledge field, type or paste the information that you want to include in the custom Knowledge Base article. 2 Click [OK] to close the dialog box and save the changes. To copy a Metric Knowledge Base article to the clipboard: 1 Select the metric whose Knowledge Base article you want to copy. 2 Click [Copy]. Stopping Alerts During Maintenance Mode To stop alerts during maintenance mode, you must disable monitoring of the respective server and the alerts for that server are automatically stopped. To disable monitoring of a server: 1 In the multiple servers view, select the server(s) for which you want to disable monitoring. 2 Either: In the Servers section of the ribbon, choose Disable Server. OR Right-click then choose Disable Server. When a server is disabled, all alerts related to this server are automatically stopped. To enable monitoring of a disabled server: 1 In the multiple servers view, select the server(s) for which you want to enable monitoring. 2 Either: In the Servers section of the ribbon, choose Enable Server. OR Right-click then choose Enable Server. The Management Console enables data collection for the server. When the disabled server is enabled, the respective alerts are reinstated. 53
54 Viewing and Reporting on the Performance of SharePoint Farms, Server Group, and Office 365 Tenants Diagnostic Manager lets you view and report on the availability of your SharePoint farms, the servers in SharePoint farms and Server Groups, and the web pages in the SharePoint sites, as well as public and Cloud Services web pages. You can view the status of individual farms, servers, or pages, locate performance issues, and correct them. For Office 365 tenants, you can view the latest status of Office 365 services and their features. Viewing Dashboards and Overviews When you select the top node of a monitored SharePoint farm, Server Group, or O365 tenant, a default dashboard displays, which provides a graphical representations of the environment's overall health and various key metrics. NOTE: You can also return to the dashboard from another location by choosing Overview > Dashboard. Default Home Page Dashboard Default On Premises SharePoint Farm Dashboard 54


55 Default Server Group Dashboard Default O365 Tenant Dashboard 55


56 You can double-click on a statistic within a widget to drill down to more detail about the underlying data set. For a more detailed overview, including a list of all monitored pages and active alerts, from the Farm or O365 section of the ribbon, choose Overview > Overview. 56


57 Customizing Dashboards You can customize the dashboards that display on the home page and for each SharePoint farm, Server Group, and O365 tenant. You can also create additional custom dashboards. NOTE: Once created, additional dashboards can be selected from the Saved Dashboards drop-down. To customize a dashboard: 1. From the Overview tab Dashboard Widgets section of the selected node (Home, SharePoint farm, Server Group, or O365 tenant), click Edit. Now you can: click the X in the upper right corner of a widget to remove it from the dashboard 57


58 drag and drop to reposition or resize a widget add a widget When you finish editing, you can Save the changes to the dashboard, Save As a new dashboard, or Discard Changes. Viewing the Status of Office 365 Services If your Diagnostic Manager deployment includes one or more Office 365 tenants, you can view the latest status of Office 365 services and their features. NOTES: Diagnostic Manager retrieves server status according to the schedule specified on the Collection Service Options - Office365 tab (which is every 15 minutes by default). You can also force the Collection Service to update status information immediately. If you want to monitor O365 services on a machine without Internet access, you can configure web proxy settings. 58

59 To view the health of Office 365 Services: 1. In the Management Console tree, expand the node of the Office 365 tenant whose services whose health you want to view. 2. Select Services. Tiles representing all of the active services in your Office 365 tenancy display, along with one of the following status icons: OK Warning Critical The right bottom corner of the tile provides a brief description of the current status. 3 To view the status of a service's features, click on the service tile. If you select a feature with a status of Warning or Critical, Latest description text provides additional information. 59

60 To collect Service status data immediately: Use one of the following options: From the Management Console tree, select the Services node, right-click and choose Collect Farm O365 status. OR In the Services section of the ribbon, choose Collect farm 0365 status. To refresh displayed Service status data in the Management Console: In the Services section of the ribbon choose Refresh. Refreshing Server Group Properties The Diagnostic Manager Collection Service automatically refreshes the properties of a Server Group. By default, this data is collected every 24 hours, at the same time Farm Topology is refreshed. You can also force the Collection Service to refresh the properties of servers in the group at any time to reflect any changes have been made since the last data collection (for example, a SQL server instance has been added or removed). To refresh Server Group properties: 1. In the Management Console tree, select the Server Group whose properties you want to refresh. 2. Use one of the following options: Right-click and choose Refresh Servers Discovered. OR in the Farm section of the ribbon, choose Overview > Refresh Servers Discovered. 60
61 Refreshing the Farm Topology The Diagnostic Manager Collection Service automatically refreshes its list of servers and other topology data within a SharePoint farm. By default, this data is collected every 24 hours. You can also force the Collection Service to refresh this data immediately if you choose. To refresh topology for a single SharePoint farm immediately: 1. In the Management Console tree, select a farm or its Servers node for the farm whose topology you want to refresh, right-click then choose Refresh Farm Topology. 2. Use one of the following options: In the Management Console ribbon, choose Overview > Refresh Farm Topology. OR right-click and choose Refresh Farm topology. Collecting Metrics for All Servers or Pages Immediately Normally, Diagnostic Manager collects server metrics from the servers that make up your SharePoint farm or Server Group on a schedule you specify (see Setting the Collection Service Options). If necessary, you can also collect the metrics immediately. To collect server metrics in real time: 1. In the Management Console tree, select the farm or Server Group from which you want to collect metrics. 2. Use one of the following options: Right-click and choose Collect performance data for all Farm (or Server Group) servers OR In the Farm section of the ribbon, choose Collect metrics for all farm (or Server Group) servers. To collect monitored page metrics in real time: 1 In the Management Console tree, select the farm or Server Group for which you want to collect page metrics. 2 Use one of the following options: Right-click and choose Collect performance data for all Farm (or Server Group) pages. OR In the Farm section of the ribbon, choose Overview > Collect metrics for all farm (or Server Group) pages. 61
62 Viewing Server Detail You can use Diagnostic Manager to view the status of all servers or individuals servers, within a farm or Server Group, as well as customize the graphical view of server data. Checking Server Access If you are experiencing issues with data collection, you can check that the account(s) used for data collection have the appropriate access and permissions to all servers in the farm using the Check Server Access feature. To check server access: 1 In the Management Console tree, select the farm or Server Group whose server access you want to check. 2 Use one of the following options: Right-click and choose Check Server Access. OR In the Farm section of the ribbon, choose Overview > Check Server Access. Diagnostic Manager performs the following checks: For a farm Topology server, access to the Config database connection string For each server in the farm: WMI access to Windows Registry, and Windows Services access to the master database of each SQL Server instance. 62
![If the account fails any of the server access and permissions checks, you can fix the issue on the affected server(s) then [Run Checks Again].](/docs-images/85/91496342/images/63-0.jpg "Viewing the Status of All the Servers in a Farm or Server Group In the Servers view, Diagnostic Manager provides a summary of the status of the servers that make up the farm, Server Group, or")
63 If the account fails any of the server access and permissions checks, you can fix the issue on the affected server(s) then [Run Checks Again]. Viewing the Status of All the Servers in a Farm or Server Group In the Servers view, Diagnostic Manager provides a summary of the status of the servers that make up the farm, Server Group, or selected SQL Server Cluster Virtual Server. Diagnostic Manager also provides for each server within the farm, Server Group, or virtual server: Server name Server type, such as physical or virtual Server status Number of critical alerts and warning alerts triggered from that server Status of the subsystems on that server If you select a single farm, Diagnostic Manager displays the following additional information: Information about the selected farm or Server Group, including the number of active alerts The servers configured as Web front end (WFE) servers. To view the status of all of the servers in a farm, Server Group, or virtual server: 1. In the Management Console tree, expand the farm or Server Group whose servers you want to view. 63

64 2. Select Servers The multiple servers view lets you do the following: Refresh the server list. Add a server. Disable a server. Enable a disabled server. View server details. If you are viewing all of the servers in a farm or Server Group, you can also do the following: Refresh the farm topology or "Servers Discovered" properties. View the active alerts for the farm or Server Group. Force immediate collection of the server metrics. To refresh the server list: In the Servers section of the ribbon, choose Refresh. The Management Console refreshes the multiple servers view with the most recent information about the server status and alerts. NOTE: When you refresh the multiple servers view, only the servers for the selected farm, Server Group, or virtual server are refreshed. To add a server to monitor: 1 In the Servers section of the ribbon, choose Add Server. 2 In the Servers dialog box, enter the name of the server to add, then click [OK]. REMINDER: Diagnostic Manager uses the credentials of the account that was specified for data collection at the farm/server Group level. 64
65 To disable data collection for a server: 1 In the multiple servers view, select the server you want to disable (see Temporarily Suspending Data Collection). 2 Use one of the following options: In the Servers section of the ribbon, choose Disable Server. OR Right-click then choose Disable Server. You will be prompted to confirm the action before continuing. To enable data collection for a disabled server: 1 In the multiple servers view, select the disabled server you want to enable. 2 Use one of the following options: In the Server section of the ribbon, choose Enable Server. OR Right-click then choose Enable Server. The Management Console enables data collection for the server. To view the details of a server: 1 In the multiple servers view, select the server whose details you want to view. 2 Use one of the following options: In the Server section of the ribbon, choose View Server Details. OR Right-click then choose View Server Details. Stopping and Starting Application Pools You can stop and start application pools for a monitored server as long as the Collection Service is installed on a machine that has IIS installed and the Collection Service account has local administrator privileges. To stop or start an application pool: 1. From the Management Console tree, choose the server (or server Web node) that contains the application pool you want to stop or start. 2. In the ribbon, choose the Server > Web tab. 3. Select the application pool you want to stop or start. 4. Use one of the following options: Right-click and choose Start Application Pool or Stop Application Pool. 65
66 In the ribbon, click Start or Stop. Viewing the Status of Individual Servers in a Farm or Server Group You can use Diagnostic Manager to view the status of each of the servers that make up your SharePoint farm or Server Group. The Server Overview displays the status of the components that the server hosts, including Internet Information Server (IIS) components. Diagnostic Manager provides the following information in the Server Overview view: the total number of warning and critical Active Alerts for the selected server the Status by Area for each server component that Diagnostic Manager monitors. Configuration data, which includes information about the operating system, processors, memory, and other software installed on the selected server. This area also displays whether the server is a physical or virtual server. A graphical view of Recent Trends for the selected server Overall metrics for Resources, SQL Server, SharePoint, and Network/ IIS / Web Services When Server Data is Collected The Diagnostic Manager Collection Service retrieves data from a server on a schedule that you specify in the Collection Service Options dialog. By default, the Collection Service retrieves data every six minutes. Viewing the Server Dashboard To view the Server Dashboard 1 In the Management Console tree, drill down to the server whose dashboard you want to view. 66

67 2 In the Server section of the ribbon, choose Overview > Dashboard. Server Component Status Information When you view the Server Dashboard, the Management Console lists the components that make up the selected server. The components that appear vary, depending on the services on the server that you select. Depending on the selected server, some or all of the following items appear: Information Description CPU Usage (%) A graph of the CPU usage. Memory Usage (%) A graph of the memory utilization on the server. ASP App Requests A graph of the ASP App Requests for the server. This graph only appears if the server hosts IIS components. Resources Lists information about the CPU, memory, and disk space metrics on the selected server. Disk metrics include all mounted disks and mount points. SharePoint In the case of a SharePoint farm, lists information about the SharePoint server role. If the server hosts any monitored pages, this includes information about the Monitored Pages. Network/IIS Web Services The name of this item varies. If the selected server hosts IIS, the item is Network/IIS/Web Services. If the selected server does not host IIS, the item name is Network. The item summarizes the network and IIS metrics. 67
68 Each item lists relevant metrics and includes one or more status buttons. The status buttons roll up multiple metrics into a single status for rapid review. You can click any metric or any status button for more details. When you click a metric, you can review information about the metric. You can also link to the metric details and edit the alert threshold of the selected metric for the selected server. When you click a status button, you can review the metric or metrics that make up the status. You can use the dialog box that appears to view the metric details or to edit the metric alert threshold. The recent trend graphics show the previous two hours of performance data. To refresh these graphics the dashboard must be refreshed via the Management Console Preferences dialog. Viewing Server Resource Graphs The Resources tab of the Server view lets you review the CPU, memory, disk space, and network status of the selected server. The data appears in graphical format, letting you easily review the status of the server and see patterns in your server behavior. Disk metrics include all mounted disks and mount points. You can also view the status and properties of all of the Windows Services on the server as well as start and stop these Services. When you select the Resources tab, you can select the amount of time represented by each graph. You can also choose to display current data or historical data from a time that you specify. When the Management Console displays the graph, it averages the data in the graph. The time period used for the average depends on the duration that the graph represents. When data is collected for the server The Diagnostic Manager Collection Service retrieves data from a server on a schedule that you specify in the Collection Service Options dialog. By default, the Collection Service retrieves this data every six minutes. To view Server Resource graphs: Use one of the following options: In the Server section of the ribbon, choose Resources. OR In the Management Console tree, expand the server whose resource graphs you want to view, then select Resources. Available Resource Graphs: The Resource tab lets you view the following graphs: 68


69 A high-level Overview of the most important server components. Information about the CPU for the selected server. Information about Memory usage on the selected server 69


70 Information about the Disk usage on the selected server. 70


71 Information about the Page Files in use on the selected server. Information about the Network usage for the selected server. See also Working with Graphical Server Data. To force immediate data collection: In the Server section of the ribbon, choose Resources > Collect Metrics Now. To make changes to the Alert Thresholds for the server metrics: See Setting Alert Thresholds. 71

72 Viewing the Status of Windows Services From the Resources tab of the Server view, you can view the status and properties of Windows Services on a selected server. You can also act on Services from within the Management Console. When data is collected for Windows Services The Diagnostic Manager Collection Service retrieves Window Service status information on a schedule that you specify in the Collection Service Options dialog. By default, the Collection Service retrieves this data every six minutes. To view the status of Windows Services on a server: 1. Use one of the following options: In the Server section of the ribbon, select Resources. OR In the Management Console tree, expand the server whose Whose you want to view, then select Resources. 2. In the Resources section of the ribbon, select Windows Services. Details about each service on the server displays, including the number of hours of UpTime since the last time the service was started. Note that all columns are sortable. For a selected service, the graph in the lower part of the pane shows a graphical representation of the Service's status over a selected duration. Note that: 72
, the (Delayed Start) designation does not display in the")

, that designation does not display in")
73 When a Windows Service s Start Mode is Automatic (Delayed Start), the (Delayed Start) designation does not display in the Management Console for either Windows 2008R2 or Windows 2012 servers. Windows 2012 Windows 2016 When When a Windows Service s Status includes (Trigger Start), that designation does not display in the Management Console for any server, regardless of its version. 73

74 Acting on Windows Services From the Management Console, you can perform the same actions on Windows Services that you can from the server on which the Services reside. You can also enable/disable monitoring and collect Service data immediately. To act on a Windows Service: 1. In the Windows Services grid, the select the service you want to act on. 2. Right-click and chose the action you want to perform, or select the corresponding option from the ribbon. Options are: Start Service (if the Service is currently Stopped) Stop Service (if the Service is currently running) Pause Service (if allowed for the Service) Resume Service (if the Service is Currently Paused) Restart Service Enable monitoring on this Service Disable monitoring on this Service Gather Services Now 74

75 Viewing the Status of Server Web Components The Web tab of the Server section of the ribbon lets you review the status of the Internet Information Services (IIS) and Web Services components of the selected server. The data appears in graphical format, letting you easily review the status of the server and see patterns in your server behavior. When you view the Web tab, you can select the amount of time represented by each graph. You can also choose to display current data or historical data from a time that you specify. NOTE: The Web tab only appears if the selected server has IIS and Web Services installed and active. When Server Data is Collected The Diagnostic Manager Collection Service retrieves data from a server on a schedule that you specify in the Collection Service Options dialog box (see Setting the Collection Service Options). By default, the Collection Service retrieves this data every six minutes. To view the status of server Web components: Use one of the following options: In the Management Console tree, drill down to the server whose Web components you want to view then select Web. OR In the Monitored Server section of the ribbon, select the Web tab. Available Status Information The Server Web tab includes the following information: Statistics about the IIS on the selected server. 75


76 Statistics about the Web Services on the selected server. The configuration and status of Application Pools on the selected server. See also Working with Graphical Server Data. Viewing the Status of Server SharePoint Components The SharePoint tab of the Server view lets you easily review the status of a farm server and the SharePoint components that it hosts. 76

77 NOTE: The SharePoint tab only appears if the selected server has SharePoint components installed and active. To view the status of Server SharePoint components 1 In the Management Console tree, drill down to the farm server whose SharePoint components you want to view. 2 Use one of the following options: In the Server section of the ribbon, select the SharePoint tab. OR In the tree, select the server's SharePoint node. The Web tab includes: Statistics about the SharePoint search status on the selected server. 77


78 Statistics about the SharePoint indexing services on the selected server. Statistics about the Excel calculation services on the selected server. 78


79 See also Working with Graphical Server Data. Information about SharePoint-related Windows Services on the selected server, including a graphical representation of the Status of a selected timer job for a specified duration. A link to the ULS log entry viewer with entries for the selected server. See also Viewing ULS Log Entries for a Farm. 79

80 Viewing the Status of Monitored Pages The Server - Pages view lets you review the status of the monitored pages on the selected server. To access the Server Pages view: 1 In the Management Console tree, drill down to the server whose monitored pages you want to view. 2 Use one of the following options: In the Server section of the ribbon, select the Pages tab. OR In the tree, select Monitored Pages. The Server Pages view includes the following information about each page on the selected server: the Page Title and Page Address the current Status of the page the alert status of the Load Time the alert status of the page Component. To view Statistics for a monitored page: Double-click the page whose statistics you want to view. 80

![Click the date and time hyperlink. In the Select Historical Date dialog, select the date and time to show data from, then click [OK].](/docs-images/85/91496342/images/81-2.jpg "To change the duration represented in the graph: Select a value from the Select duration drop-down.")
81 Working with Graphical Server Data When data about servers includes a graphical component you can: change the time and duration of displayed data, and view more details To view data from a specified date and time: 1 In the Time area of the selected tab, select Show data as of: 2 Click the date and time hyperlink. In the Select Historical Date dialog, select the date and time to show data from, then click [OK]. To change the duration represented in the graph: Select a value from the Select duration drop-down. Select a duration from the Select duration drop-down list. 81

82 EXAMPLES: If you want to view more detail about a single graph, click one or more of the icons in the graph's top right corner: Show legend ( Show tabular data ( Maximize graph ( ) ) ) Viewing SQL Server Detail The SQL Servers object in the farm or Server Group includes a separate page for every SQL Server being monitored. You can click the page for the server in the SQL Servers group to view additional information about the server (see Viewing the Status of a Single SQL Server). NOTE: By default, the Collection Service monitors only content databases and system databases in a SharePoint farm. You can, however, change the Farm & Page Monitoring Scheduled Options to have it monitor all databases. (The Collection Service always monitors all databases in a Server Group.) Viewing the SQL Servers Status Overview The SQL Servers Dashboard provides the status of the SQL Server hosts and gives you an idea of how well you are utilizing SQL Server. This overview helps you focus on any SQL Server configuration or performance issues. To view the SQL Servers Dashboard 1 In the Management Console tree, expand the farm whose SQL Servers you want to view. 82

83 2 Select SQL Servers. The SQL Servers Dashboard provides the following information: the state of each server hosting SQL Server components the total number of SQL Server Alerts, and the number of alerts by type (Configuration, Capacity, and Activity) the Number of Databases on each SQL Server instance the Size of Databases on each SQL Server instance the Number of Active Alerts (Critical and Warning) for each SQL Server instance a pie chart that depicts Databases by Size on the SQL Server instances NOTE: Diagnostic Manager displays the maximum and minimum server memory statistics in the SQL Server instance details area of the Overview tab. Note that the Min Server Memory field displays the running SQL Server configuration value rather than the value configured in the Server Properties dialog box. The Diagnostic Manager Collection Service retrieves data from the farm on a schedule that you specify (see Setting the Collection Service Options) in the Collection Service Options dialog box. By default, the Collection Service retrieves data every six minutes. When you select a server, the Collection Service retrieves live data from the server while it is selected. Live data collection is identical to normal data collection, except that rather than happening at the regular interval you specify for every server, data is collected for the single server at a short interval. By default, live data is collected for the server every 30 seconds. If you need to, you can change the live data collection interval (see Setting the Management Console Options). 83

84 Viewing the Configuration of Your SQL Servers Diagnostic Manager provides a glimpse into the configuration of the SQL Server hosts in your SharePoint farm or Server Group. Being able to view configuration information in this view allows you to quickly see how to address alerts concerning a SQL Server host. To view configuration for your SQL Server hosts: 1 In the Management Console tree, expand the farm whose SQL Servers you want to view. 2 Select SQL Servers. 3 In the SQL Server section of the ribbon, choose Configuration. The SQL Servers Configuration view provides a list of your SQL Servers and the following information: The name of the SQL Server host. The current Status of your SQL Server host. The total number of active configuration, and performance Alerts for the selected host The name of the Host Server for the SQL server instance If the host server is in a cluster or SQL AlwaysOn Availability Group, the name of any Passive Hosts The total number of databases on the host that support SharePoint (SPDBs) The total number of SharePoint content databases (Content DBs) on the host The current status of Config, Storage Capacity, and Activity on the host Details for SQL Server Instance, which includes: Version Max/Min Server Memory Packet Size 84
 in the Collection Service Options dialog box. By default, the Collection Service retrieves data every six minutes.")
85 whether the host is in a cluster any aliases SQL Server Data Collection The Diagnostic Manager Collection Service retrieves data from the farm on a schedule that you specify (see Setting the Collection Service Options) in the Collection Service Options dialog box. By default, the Collection Service retrieves data every six minutes. When you select a server, the Collection Service retrieves live data from the server while it is selected. Live data collection is identical to normal data collection, except that rather than happening at the regular interval you specify for every server, data is collected for the single server at a short interval. By default, live data is collected for the server every 30 seconds. If you need to, you can change the live data collection interval (see Setting the Management Console Options). Viewing the Active Alerts for Your SQL Servers Diagnostic Manager provides you with an overall view of the active alerts on all of the SQL Server instances in your farm. You can filter the alerts by using the Filter options, and restrict the results to only a specific type of alert. To view the active alerts for all of your SQL Server instances From the SQL Server section of the ribbon, choose Active Alerts. See also Using Alerts. 85
 as well as the Diagnostic Manager Repository Database.")
86 Viewing the Status of a Single SQL Server You can use the Diagnostic Manager Management Console to view the status of individual SQL Servers in your SharePoint farm. In addition to SharePoint databases, you can monitor SQL System databases (master, tempdb, model, and msdb) as well as the Diagnostic Manager Repository Database. You can also monitor SQL instances on manually added servers, regardless of whether they are associated with a SharePoint farm. To view the SQL Server instance Dashboard 1 In the Management Console tree, drill down to the SQL Server instance whose dashboard you want to view. 2 In the SQL Server section of the ribbon, choose Overview > Dashboard. The SQL Server dashboard contains the following information: The state of the selected server hosting SQL Server components. The total number of warning and critical Active Alerts for the selected server. Configuration information about the operating system, processors, memory, cluster status, and databases on the selected server. A dashboard view of the SQL Server. You can review the Configuration, Capacity, and Activity of the server. A view of the status of the Host server A pie chart that lets you visualize the Distribution of Databases by Size on the SQL Server. 86

87 Viewing the SharePoint Databases of a Single SQL Server You can use the Diagnostic Manager Databases to review information about the databases that the SQL Server instance hosts. The SharePoint databases table lists basic information about all of the databases. To view SQL Server Database information: In the SQL Server section of the ribbon, choose Overview > Databases. The SQL Server Database view provides the following information about SharePoint databases on that server: Name of the Database as it appears in the SQL Server Management Studio. Database Type, such as Content, System, or Web Analytics. Data Size (the amount of memory used by the database) Log Size (the amount of memory used by the database log file) Percentage of database Fragmentation as of the Fragmented Collected timestamp. Date and time of the most recent database Fragmentation Collected. Total number of SharePoint Sites that store content in the database. For a selected database in the list: - Additional database properties. - A graphical view of growth for a selected database metric over a specified duration. 87

88 To exclude databases from the scheduled fragmentation statistics collection: Select the appropriate database, right-click then choose Exclude from scheduled fragmentation collection. You can have the database returned to the scheduled collection by choosing Include in scheduled fragmentation collection. Viewing the Database Files of a Single SQL Server The Diagnostic Manager Database Files view lets you review individual files within the databases that the selected SQL Server instance hosts. The list includes all of the database files that the server hosts. To view SQL Server Database Files: In the SQL Server section of the ribbon, choose Overview > Database Files. The Database Files view includes the following information: Name of the database file Database File Type, such as data or log Name of the Database where the associated database file resides DB Type, such as Content, System, or Web Analytics Name of the SharePoint Web App for which this database file stores data File Size % Full (the percentage of the allotted memory used by the database file) Increment by which the database file grows if you enable Auto Growth for the database. Max Size allowed for the database file. Name of the Drive where the database file resides. Total amount of Disk Free space where the database file resides. 88

89 Database file Path on the drive where the file resides. A graphical Database File Size Summary for a specified duration. Viewing the Active Alerts for a Single SQL Server Diagnostic Manager allows you to see the active alerts for all of your SQL Server instances at once, or the alerts for a single SQL Server instance when necessary. To view the active alerts for a server: In the SQL Server section of the ribbon, choose Alerting > Active Alerts. See also Using Alerts. Viewing the Performance of a Single SQL Server To view graphical performance data for a single SQL server: NOTE: In the case of SQL AlwaysOn, some performance data will be collected for active nodes only. 1 In the SQL section of the ribbon, choose Performance. 2 From the ribbon, choose the category of data that you want to view: Capacity Activity 89
.")

90 Server Resources The data that populates these graphs is collected by Server Performance data collection (which, by default, runs every six minutes). The graphics will be refreshed according to the auto-refresh schedule specified in the Management Console Preferences dialog. Now you can: change the time and duration of displayed data, and view more details. 90
91 See Working with Graphical Server Data for details. Collecting Server Metrics Immediately Diagnostic Manager lets you immediately collect server performance metrics for all of the servers in a monitored farm. To collect server performance metrics for all servers in a farm immediately: 1 In the Management Console tree, select either the farm whose server metrics you want to collect or the Servers node beneath the farm node. 2 Right-click and choose Collect performance data for all farm servers. 91

92 Monitoring SharePoint and Web Pages Diagnostic Manager helps you monitor the availability and load times of individual SharePoint pages, public Web pages, and if you are registered with Cloud Services Cloud pages. You can use alerts to help you find when a page needs your attention. You can set default alert thresholds for all pages or individual pages. NOTE: For SharePoint on-premises pages, you can also monitor the components that make up the pages. To monitor a page, you first add a SharePoint on-premises farm or Server Group to Diagnostic Manager. You can then add a page to monitor. After you have added a page, you can edit the monitored page settings as needed. If you want to monitor Web pages from a machine that does not have internet access or if you want a secure connection, you can configure Web proxy settings. Adding a Page to Monitor To add a page to monitor: 1 Use one of the following options: In the Management Console tree, select a monitored farm or Server Group, then in the Farm section of the ribbon choose Overview > Add Monitored Page. OR In the Management Console tree, select Monitored Pages, then in the Monitored Pages section of the ribbon choose Add Page. OR 2 3 In the Management Console tree, select either a monitored farm or Monitored Pages, right click and choose Add page. Select a Page Type: SharePoint (on-premises) SharePoint Online Public Web Page if you are registered for Cloud Services, Cloud. For Page Address, either: 92
![Enter the full URL to the page you want to monitor. OR Browse to the page as follows: a) Enter the URL to the site that contains the page you want to monitor. b) Click [...].](/docs-images/85/91496342/images/93-0.jpg "c) Click [Load Page] to display the Select Page To Monitor dialog. d) Navigate to the page you want to monitor. e) Click [OK].")

93 Enter the full URL to the page you want to monitor. OR Browse to the page as follows: a) Enter the URL to the site that contains the page you want to monitor. b) Click [...]. c) Click [Load Page] to display the Select Page To Monitor dialog. d) Navigate to the page you want to monitor. e) Click [OK]. 4 In the Add Monitored Page dialog box, specify the Page name the Management Console should use for the page. If you used the browse option to locate the page, the page title is the default page name. You can change this default title, if necessary. 5 For Page Load Time, make sure the option is checked and, if different from the default (every 15 minutes), select the interval at which you want Diagnostic Manager to check load time. 93

94 Note: You can check load time every minute, 15 minutes, or 60 minutes. 6 Use the information in the table below to determine the appropriate next step. If you are adding... Then... a page from a SharePoint OnPremises monitored farm specify additional Page Monitoring options. Note: Currently, you can only monitor Page Load Time for SharePoint Online, Public, and Cloud pages. a SharePoint Online or Cloud Web page complete the Page Credentials section with the Username and Password you want Diagnostic Manager to use to check page load time. If you want to validate the connection before adding the page, click [Test]. 7 Click [OK]. The page now displays in the tree. 94
 servers that the Collection Service uses to collect data. By default, the Collection Service uses the URL you supply to collect data.")
95 Setting SharePoint Monitored Page Component Analysis and Web Front End Options When you add a SharePoint on-premises page to monitor, you can configure the data that Diagnostic Manager collects. You can also control which Web front end (WFE) servers that the Collection Service uses to collect data. By default, the Collection Service uses the URL you supply to collect data. NOTE: If you collect data from select or all WFEs, alternate access mapping, it is no longer required if you are going to monitor pages hosted on a Network Load Balancer, using a Host Header or HostNamed Site Collection. In other scenarios Alternate Access Mapping is still required if you want to use the select or all WFEs options. REMINDER: For SharePoint Online, public Web pages and Cloud pages, you can only monitor Page Load Times. From the Add (or Edit) Monitored Page dialog you can choose one or more of the following additional options for monitoring SharePoint on-premises pages: Option Description Page Component Analysis When checked, Diagnostic Manager checks the server-side render times for each component on the monitored page. Monitoring the render times lets you to examine the impact of each component that makes up the page on the page performance. 95
96 Option Description You can control how often the component analysis is performed. You can perform component analysis every 15 minutes, 60 minutes, or 4 hours (240 minutes). The default is to check every 60 minutes. If the Diagnostic Manager solution is not installed on the farm, you cannot collect page component analysis information. NOTE: If the Component Analysis solution is not installed on a farm and you select Page Component Analysis, Diagnostic Manager displays critical alerts for the page. The alerts indicate that the solution is not installed. Collect data using... When you monitor a page, you can specify what sources that the Collection Service uses when it retrieves page load time or component analysis information from the SharePoint farm. By default, the Collection Service uses the URL that you specify to collect the page load time data from the farm. You can also collect data from all WFEs or from specific WFEs that you select. To set the page component analysis data collection schedule: 1. In the Add Monitored Page dialog box, Page Monitoring Options section, select the Page Component Analysis check box. 2. Select how often you want to collect the data from the Collect individual page component render times every x minutes/hours drop-down list. To change "Collect" options: Use the information in the following table to determine the appropriate option(s) to select. If you want to collect data... Then... using the exact URL that you specify select Collect data using the provided URL NOTE: If no additional data collection (WFE) option is specified, the SharePoint farm assigns a WFE to service the request. Any WFE in the farm can respond. from all Web Front End servers in the farm select Collect from ALL Web Front Ends. from specific Web Front End servers in the farm select Collect from ONLY the following Web Front Ends AND check the box to the left of each Web Front End from which you want to collect data. 96

97 You can also use data collection options in combination. For example, if your environment uses a load balancer, selecting both URL and Web Front End options will allow you to monitor both the load balancer and the Web Front Ends that use it. Viewing Page Status Diagnostic Manager lets you view the status of the pages that you specify on your SharePoint farm or Server Group. For each page, you can monitor a variety of data points. You can use this information to identify problems in your deployment. Once you have identified the existence of issues, you can then enable component analysis and isolate those components that interfere with optimal performance. You can monitor pages for availability and load time at all times or only when you suspect a problem. When you discover a problem in a SharePoint farm, you enable Page Component Analysis on the affected page and then review the details for the affected page. When you perform a Page Component Analysis, the Collection Service uses the Diagnostic Manager Component Analysis solution to analyze the page on the WFE server. The analysis lets you review the performance of each component that makes up the page and the impact that each component has on the overall load time. You can also choose to analyze page and component load times and availability on all Web front end (WFE) servers or only on a subset of the WFE servers. Alternatively, you can choose to analyze components and load times on whatever WFE is assigned by the load balancing inherent in your SharePoint farm. Viewing the Status of All Monitored Pages in a Farm The Monitored Pages view lets you see the status of all the monitored pages for a single farm or Server Group. To view the status of all of the monitored pages in a farm: 1 In the Management Console tree, expand the farm or Server Group whose monitored pages you want to view. 97

98 2 Choose Monitored Pages. The top of the Monitored Pages view contains the following information: A summary of the monitored pages on the farm or Server Group. Information about the farm or Server Group itself, including the number of active alerts. The Monitored Pages list shows each page being monitored along with the following information: Target WFEs (that is, the source the Collection Service uses to collect page data, which is one of the Page Monitoring Options) the overall page Status The Load Time Status and date/time this information was Last Collected. If the Component Analysis solution has been deployed, the Component Analysis Status and date/time this information was Last Collected. Expand a page to display the source(s) used for page data collection. NOTE: If you want to expand all pages in the list, right-click in the grid and choose Expand All. 98

99 You can also use the search box to locate all instances of a text string within the list. From the Monitored Pages ribbon, you can choose to: Filter results by selecting/deselecting check boxes View either All Pages or By Status. Add a page. Remove a page Edit the settings for a monitored page Disable a page. Enable a disabled page. Edit the page alert thresholds View the active alerts for the monitored pages Collect page load metrics immediately Refresh the monitored page list View details of a single monitored page Viewing the Status of a Single Monitored Page The Page Status view provides an in-depth view of the status of a single monitored page. You can also review configuration and page performance information using this view. If data collection is disabled for a page, Diagnostic Manager displays only the Summary tab. Note that the information may be out of date as the data on the tab is current as of the time of the last data collection. To view the status for a single monitored page: 1 In the Monitored Page view, select the page whose detail you want to view. 2 Either: In the Monitored Page section of the ribbon, choose View Page Details. 99

100 OR Right-click and choose View Page. The following information is available in the Page Status view: The status of the page on each monitored Web front end (WFE) Server. If the page is a URL-only page, the server is listed as a URL Host. The number of currently-active Alerts for the page, categorized by type. The Page Name that was assigned when the page was added. The Page Address (URL) in the SharePoint farm. The Schedule used by the Collection Service to retrieve the page information. Which Web Front Ends (WFEs) the page information is collected from. Note that status information captured depends on the server role. For example, a load balancer will not have data for Web, SQL, or SharePoint To view page details by Web front end: In the Page Status Summary view, either: Double-click a Web front end server. OR 100
101 In the Monitored Pages section of the ribbon, select a Web Front End from the drop-down, then choose Details. The Page Details by Web Front End tab includes information about the page as loaded from a particular WFE server. To view more details about graphs: In the Page Status view, either: Click the View hyperlink within an available graph. OR Select the Graphs tab. The Graphs tab includes detailed versions of the graphs on the Summary tab. Viewing Component Analysis Information for a Single Monitored Page If the Component Analysis solution is installed and deployed for an on-premises SharePoint farm, you can review component loading on a monitored page. NOTE: If Component Analysis is not enabled for a page, the Page Details view includes only the information that is available in the Summary view. The Component Analysis view lets you: The Web front End (WFE) that the data was collected from. The number of Active Alerts for the page, arranged by category. A Page Overview, including the time the analysis took place, the components, the page size, the page render time the page load time, the WFE name, and the URL the Collection Service used to retrieve the data. Information about the HTML Controls on the page, including the overall status of the HTML controls. Information about the solutions on the page, including the overall status of the Solutions. Information about the Web Controls on the page, including the overall status of the Web Controls. A list of the Worst Performing Page Components; that is, components that take the longest to render on the WFE. You can use this list to optimize the page load time. A graph of the Page Availability on the WFE. If the Page Load Time option is selected for this page, this graph appears. A graph of the Page Load Time on the WFE, measured in milliseconds (ms). If the Page Load Time option is selected for this page, this graph appears. Note that status information captured depends on the server role. For example, a load balancer will not have data for Web, SQL, or SharePoint 101

102 To view a Component Analysis Summary for a single monitored page: In the Monitored Page section of the ribbon, choose Component Analysis To view a Component Analysis Summary for another WFE: Select the WFE from the Web Front End drop-down. To view Component Analysis detail: In the Monitored Page section of the ribbon, choose Details. 102
 on the WFE to render the component, measured in milliseconds.")
103 Page Component Details include: The Name of the page component. The Type of component. The Status of the component. The Render Time; or time required for the Internet Information Server (IIS) on the WFE to render the component, measured in milliseconds. The Render Weight, or relative importance of the component in relation to the whole page. The Object Size of the component, measured in bytes. The Object Weight, or amount of weight the Management Console assigns to the component when assigning the alert status. NOTE: The Page Status area lists the Total Components and Monitored Components for the page. For many pages, these values do not match. This is because Diagnostic Manager does not monitor components that do not have a bearing on the overall performance of the page in favor of a focus on 103
104 components that do impact the page performance. For example, simple text components are omitted from the monitored components. Collecting a Page Component Analysis Immediately Diagnostic Manager refreshes the Component Analysis for a monitored page on a schedule you specify which, by default, is every 60 minutes. (See Setting Monitored Page Options and Web Front Ends.) You can, however, immediately collect page component information for: all monitored pages in the selected farm OR a single monitored page. NOTE: For this information to be collected, the Page Component Analysis option must be enabled for the page. See also Editing Monitored Page Settings. To collect component analysis data for all monitored pages: 1 In the Management Console tree, select the Monitored Pages node beneath the farm. 2 Right-click and choose Collect component analysis data for all farm pages. To collect component analysis data for a single monitored page: 1 In the Management Console tree, expand the Monitored Pages node beneath the farm. 2 Select the page for which you want to collect data, right-click and choose Collect component analysis data for this page. Collecting Page Load Metrics Immediately Diagnostic Manager lets you immediately collect page load metrics for all of the monitored pages in a single farm for which the Page Load Time option has been checked. (See also Editing Monitored Page Settings.) When you collect Page Load metrics, the Collection Service collects the metrics for all monitored pages in the farm, not for a single page. To collect page load metrics immediately: In the Management Console tree, select the farm whose page load metrics you want to collect, right-click and choose Collect load & availability data for all farm pages. 104

105 Opening a Monitored Page From the Management Console tree, you can open a monitored page in a browser. To open a monitored page: 1 In the Management Console tree, select the monitored page you want to open. 2 Right-click and choose Open in browser... Editing Monitored Page Settings You can change the options you have set for a monitored page. You can change the page name or any of the page monitoring options. You can also change the page URL. If you change the URL to an unrelated page, the historical data is meaningless and it is automatically deleted. You should only change the URL if the page itself has a changed URL. NOTE: If you need to replace a page completely, you should remove the page and then add the new page. To edit the settings for a monitored page: 1 Use one of the following options: In the Management Console tree, select the monitored page, then right-click and choose Edit page. OR In the Management Console tree, click Monitored Pages for the farm that hosts the page, then in the Monitored Pages view, right-click the page and click Edit Page. 105
106 2 In the Edit Monitored Page dialog box, make the necessary changes. 3 In the Page Monitoring Options area, specify the page options. 4 Click [OK]. Removing a Monitored Page You can remove a monitored page when you no longer need to monitor it. To remove a monitored page: Use one of the following options: In the Management Console tree: a) Expand the farm containing the monitored page you want to remove. b) Select Monitored Pages. OR In the Monitored Pages view, select the page you want to remove, right-click then select Remove Page. You will be prompted to confirm the action before continuing. 106
107 Viewing the Health of a Farm Diagnostic Manager includes the following two features that enable you to check the configuration and health of a monitored SharePoint 2010, 2013, or 2016 farm: The Health Analyzer lets you view any issues with your SharePoint farm performance as of the last Collection Service run. Diagnostic Manager compares your configuration with the set of best practices checked by SharePoint Health Analyzer. The Issue Details pane of this view allows you to view the details of an issue found by the SharePoint Health Analyzer. NOTE: The Diagnostic Manager Health Analyzer feature is not available for SharePoint 2007 farms. If your SharePoint Credentials let you access the Central Administration page for the farm, you can access the Health Analyzer directly. You can click View Health Analyzer problems and solutions to open the SharePoint Central Administration problems and solutions page. You can click View Health Analyzer rules to open the SharePoint Central Administration Health Analyzer Rule Definitions page. The Farm Configuration and Health Checker, sends a request to the Collection Server to immediately update farm configuration and Health Analyzer data. Reviewing the SharePoint Health Analyzer Content for the Farm You can use the Diagnostic Manager Management Console to review content from the SharePoint Central Administration Health Analyzer pages, including details for the issues the Health Analyzer finds. If your SharePoint credentials allow you to do so, you can open the Health Analyzer problems and solutions page or the Health Analyzer rules page from the Management Console. To review the Health Analyzer content for the farm 1 In the Management Console tree, select the farm whose Health Analyzer data you want to view. 2 In the Farm section of the ribbon, choose Overview > Health Analyzer. To view more detailed information about a Health Analyzer Issue Double-click the issue to display the Health Analyzer Issues dialog. Health Analyzer Issue Details You can view additional details for the issues discovered by the SharePoint Health Analyzer, view problems and solutions, and view the Health Analyzer rules using Diagnostic Manager. The Health Analyzer measures your current configuration against recommended best practices. While the list view on the Health Analyzer page includes the issue severity, category or issue type, severity, title, and the associated failed servers and services, the Health Analyzer Issue Details dialog box includes the following items: Expanded explanation of the issue 107
![Remedy for the issue Click [Next] or [Previous] to scroll through the details for all of your issues.](/docs-images/85/91496342/images/108-0.jpg "The following links in the Health Analyzer Issue Details dialog take you to other views within SharePoint: View the rule settings for this Health Analyzer issue.")
108 Remedy for the issue Click [Next] or [Previous] to scroll through the details for all of your issues. The following links in the Health Analyzer Issue Details dialog take you to other views within SharePoint: View the rule settings for this Health Analyzer issue. Accesses the specific Health Analyzer Rule Definitions page on the Central Administration site for the selected rule. View all Health Analyzer rules. Accesses the Health Analyzer Rule Definitions page for all rules on the Central Administration site. View all Health Analyzer problems & solutions. Accesses the Review problems and solutions page for all reports on the Central Administration site. To copy all of the issue details to your clipboard for additional use: Click [Copy]. 108

109 Monitoring StoragePoint Timer Job Performance If Diagnostic Manager detects that StoragePoint is deployed on a monitored farm, it will also monitor the performance of the StoragePoint timer job. By default, an alert will be triggered for the following events: Storage Point timer job execution time exceeds the alert threshold the collection of StoragePoint timer job data fails a StoragePoint timer job execution error occurs StoragePoint Timer Job Data Collection By default, Diagnostic Manager collects StoragePoint timer job data every thirty (30) minutes. To collect this data immediately, in the Farm section of the ribbon choose Overview > Sync With StoragePoint Timer Jobs. Note that the synchronization may not be immediate, since it may take time for the SharePoint timer job to complete the collection of log entries from all servers in the SharePoint farm. To open the StoragePoint Dashboard in SharePoint Central Administration: 1. In the Management Console tree, select the node of the farm where StoragePoint is deployed. 2. From the Farm section of the ribbon, choose Overview > Overview. 3. On the Farm Overview page, click the StoragePoint Version link. 109
110 110
111 Viewing ULS Log Entries for a Farm Diagnostic Manager offers a built-in viewer that lets you review ULS log entries for SharePoint 2010, 2013, and 2016 On-Premises farms. NOTE: This feature is not available for SharePoint 2007 farms or SharePoint Online tenants. To start using the Diagnostic Manager ULS Log Viewer, the Diagnostic Data Provider: Trace Log timer job must be enabled in SharePoint Central Administration. You can enable the job and synchronize the schedules of all monitored farms via the Diagnostic Manager Collection Service Options dialog (see Enabling and Configuring ULS Log Entries). On this dialog you can also specify the frequency with which the Collection Service should gather ULS log data as well as how long ULS log data should be retained in the Diagnostic Manager Repository database. You can also specify the maximum number of ULS Log entries to display in the Management Console via the Management Console Preferences dialog. You also have the option clearing ULS log entry history from the Repository database. Prerequisites For the SharePoint timer job to collect ULS log data, usage and health data collection must be enabled in SharePoint. For details, refer to the applicable Microsoft Technet article: For SharePoint 2016 For SharePoint 2013 For SharePoint 2010 In order to use the Diagnostic Manager ULS Log Viewer: the latest version of the Diagnostic Manager Component Analysis Solution must be installed and deployed to every farm whose ULS log entries you want to view the Diagnostic Manager ULS Synchronizer must be activated. (This feature is initially activated as part of the Component Analysis installation). Remember that the Collection Service account must have the appropriate VIEW permissions to the SharePoint Logging database. See the Account Requirements topic in the Diagnostic Manager Advanced Installation Guide for complete Collection Service account requirements. To view ULS log entries in Diagnostic Manager: In the Management Console tree, either: select the farm whose ULS log entries you want to view, then in the Farm section of the ribbon choose Overview > ULS. OR select a SharePoint server (or expand the server and select SharePoint), then in the Monitored Server section of the ribbon choose SharePoint > ULS. 111


112 Note that when an entry is selected, the corresponding ULS log entry Message displays in the bottom panel. Now you can: filter entries by Date Range NOTE: Filter dates always display in the format dd/mm/yyyy, whereas dates in the Time column display in the format specified for the machine on which the Management Console is installed. 112


113 sort and filter entries by any of the column headers. group entries by a single column by right clicking and selecting Group by This Column. group entries by multiple columns by selecting any column, right clicking and choosing Show Group By Box, then dragging each of the columns by which you want to group to the area above the column headers. 113
![search on a text string by typing the string in the blank box and clicking [Find].](/docs-images/85/91496342/images/114-0.jpg "Note that you can use combinations of search, sorting, and filtering to help identify potential problems in SharePoint, as shown in the example below which uses filtering on date range and grouping")
114 search on a text string by typing the string in the blank box and clicking [Find]. Note that you can use combinations of search, sorting, and filtering to help identify potential problems in SharePoint, as shown in the example below which uses filtering on date range and grouping by Correlation ID and Warning Level. To initiate the immediate synchronization/gathering of ULS data for the selected farm: In the Farm Overview section of the ribbon, choose Sync ULS. Note that the synchronization may not be immediate, since it may take time for the SharePoint timer job to complete the collection of log entries from all servers in the SharePoint farm. REMINDER: The regularly-scheduled synchronization and gathering of ULS log entries for all monitored farms is specified in the Collection Service Options dialog. 114

115 Viewing the Status of Data Collection Jobs You can view the current status of all active data collection jobs in one or more farms including whether the job is currently Running, is Completed, or is Scheduled to run for the first time. To view the status of data collection jobs: 1. In the Management Console tree select the farm whose jobs you want to view NOTE: If you want to view the status of all monitored farms, select the Home Page node. 2. Either: Right-click and choose Show Jobs. OR In the Farm (or Home) section of the ribbon choose Overview > Show Jobs. This feature is primarily intended for use by Support for troubleshooting purposes. 115
116 Viewing a Content Summary You can use the Diagnostic Manager Management Console to view a summary of the content on a monitored SharePoint farm. The Content tab summarizes the content within the farm, Web application, and Site Collection. The Pages tab lets you quickly review the monitored pages on the farm. To view a Content Summary: In the Management Console tree, expand the farm whose content summary you want to view. Now you can view a Content Summary: for the entire farm (by selecting Content Summary) for a single Web Application or Site Collection (by expanding the Content Summary node and selecting the Web Application or by then expanding a Web application and selecting a Site Collection). Viewing a Content Summary for Individual SharePoint Objects The Content Summary - Content tab contains the following views: An Overview of the selected SharePoint object, including: summary information with statistics that are specific to the type of object selected the current counts of each included SharePoint object, as well as the counts yesterday, seven days ago, and 30 days ago the date and time that the Collection Service finished retrieving the content summary data. 116

117 NOTE: If a Content Summary collection job is in progress, the status is "In Progress." If an error occurs during the collection, the error appears here. If the collection completes without errors, the status is "OK." 117


118 If a farm was selected, summary information and statistics about the Web Applications that the farm hosts. If a farm or Web application was selected, summary information and statistics about the Site Collections that the farm or Web application hosts. 118

119 Summary information and statistics about the Sites (Webs) that the SharePoint object hosts. NOTES: Some users may receive an access denied message when attempting to use a content summary function on some sites. If this message appears, set up a Web application policy to grant global access to Diagnostic Manager. This step allows you to override explicit security on the objects and grant read only access to the other service account used by Diagnostic Manager. For more information about the Diagnostic Manager permission requirements, see the Diagnostic Manager Advanced Installation Guide. Summary information and statistics about the Lists that the farm hosts. NOTES: Currently, Diagnostic Manager collects content summary statistics about document libraries only, not other types of lists or files such as web parts and aspx pages. For improved performance, attachments and hidden libraries are excluded from data collection by default. You can, however, enable the collection of hidden lists and attachments. (See Content Summary Options.) Diagnostic Manager does not collect data for external lists (that is, lists for which features are built into SharePoint but data is stored in an outside source, like a database). 119
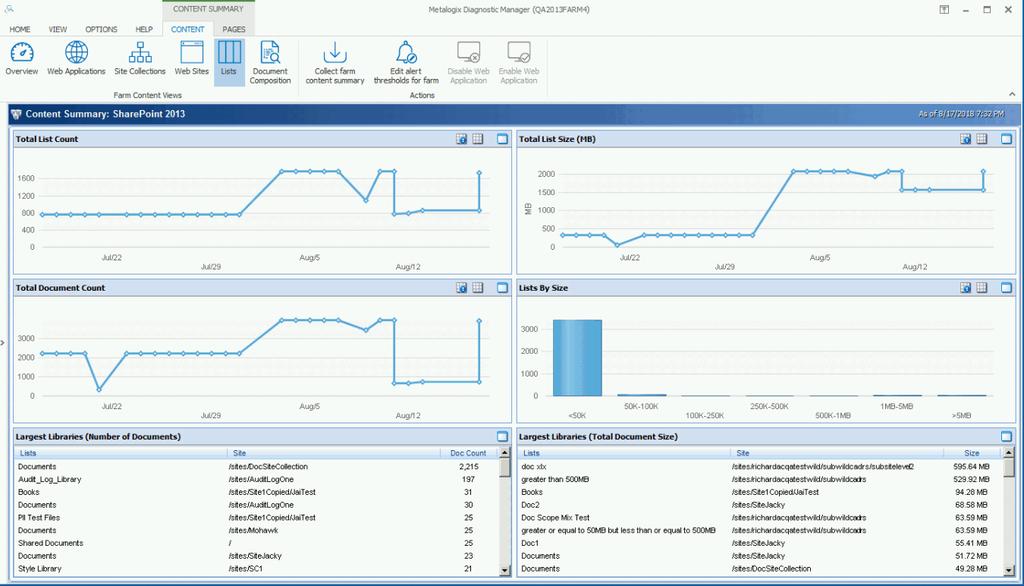
120 120

121 Summary information about Document Composition (that is, the documents stored within the selected SharePoint object). NOTE: If a document includes multiple versions, the latest version is counted as the document. Prior versions count as versions. For a farm-level Content Summary you can also: request immediate collection of farm content summary data edit alert thresholds for the farm. 121
122 Viewing a Content Summary for Monitored Pages The Content Summary Pages tab contains information about the monitored pages on the selected SharePoint object, including: Page Title Page Address (URL) The current Status of the page. The alert status of the Load Time The alert status of the page Components To filter pages by alert status: In the Content Summary Pages tab, in the Filter area, click one or more of the following to display pages with that status: OK Warning Critical Disabled To view page details: 1 Select the page whose details you want to view. 2 In the Content Summary section of the ribbon choose Pages >View Page Details. Refreshing the Content Summary Diagnostic Manager refreshes the Content Summary on a schedule you specify (see Setting the Collection Service Options). If necessary, you can request a content summary update. When it performs a content summary operation, the Collection Service examines the entire SharePoint farm and counts every object in the farm. The content summary operation is time consuming and can impact your farm performance. By default, the Collection Service only performs a content summary operation one time per day at 1:00 AM according to the server clock. When you manually start a content summary operation, the Collection Service starts the content summary operation immediately. The results may do not appear in the Management Console until the content summary operation is complete, which may take several minutes or more. You can also request a more targeted (and less resource-intensive) content summary update for a single Web application or site collection. When you request a content summary update, the Collection Service automatically refreshes the farm topology information. 122
123 To refresh the Content Summary for the entire farm: Use one of the following options: In the Management Console tree, select the Content Summary node for the farm, right-click and choose Collect farm content summary data. OR In the Content Summary section of the ribbon, choose Content > Collect farm content summary. To refresh the Content Summary for a single Web application: 1 From the Management Console tree, expand the Content Summary node and select the Web application whose Content Summary you want to refresh. 2 Use one of the following options: Right-click and choose Collect web application content data. OR In the Content Summary section of the ribbon, choose Content > Collect Content Data. To refresh the Content Summary for a single site collection: 1 In the Management Console tree, expand the Content Summary node then select the Web application that contains the site collection you want to refresh. 2 Use one of the following options: Expand the Web application, select the site collection, right-click and choose Collect site collection content data. OR On the Content Summary page for the Web application, select the site collection from the Site Collection list, then in the Content Summary section of the ribbon choose Content > Collect Content Data. 123

124 Using the Web Dashboard to View Performance Data from Within a SharePoint Site Diagnostic Manager offers a Web Dashboard for a quick glance at the performance data collected by Diagnostic Manager to help you monitor your SharePoint farms and pages. While this optional Dashboard is not installed with Diagnostic Manager, it is provided in the SharePoint solution files located in the folder where Diagnostic Manager was installed (by default C:/Program Files (x86)//diagnostic Manager/WebDashboard. To start using the Diagnostic Manager Dashboard, you must install the Dashboard to your farm using STSADM or PowerShell. Next, deploy the Dashboard to every Web application where you want to use the Dashboard. Finally, activate the Dashboard on all of the appropriate site collections. Once deployed and activated, the Dashboard is available as an option on the Site Settings menu. Information in the Diagnostic Manager Web Dashboard The Diagnostic Manager Dashboard provides you with a single location to view the performance data of your current farm and server status including your active alerts for a selected site. You can view the Diagnostic Manager Dashboard for any page in your site collection where the Dashboard is active. NOTE: As this is a Dashboard view, there are limited actions available on this page. You can use the Diagnostic Manager Dashboard to quickly review the status of a SharePoint farm. Diagnostic Manager also lists the monitored pages and active alerts on the selected farm along with the following details. 124
125 Information Description Farm Status The current alert state for the farm, plus the number of servers and pages in each state within the farm. Server Status The current alert status for each server within the farm, plus whether the server is a Web front end (WFE) or hosts a SQL Server instance. Active Alerts The current active alerts for the farm. Click the alert summary to open the Alerts Details page and view details about your alerts. Changing Web Dashboard Configuration Settings The Collection Service collects data from your SharePoint farms and stores it for the Management Console to access. You connect the Diagnostic Manager Management Console to a Collection Service. If your network includes multiple Collection Services, you can connect to each in turn. NOTE: If you run the Management Console on a computer that also hosts the Collection Service, then Management Console connects to the local Collection Service by default. You can manually select a different Collection Service. To change Web Dashboard configuration settings: 1 Open the Site Settings Page for the site where you want to configure dashboard settings 2 In the Site Actions menu, choose DM Dashboard. 3 Click Configuration. 4 In the Configuration page, type the name or IP Address of the computer that hosts the Collection Service. 5 Type the port number where the collection service is assigned. The default port number is Click [Update]. 125
126 Reporting Diagnostic Manager Reports functionality helps you to monitor your SharePoint deployments, analyze performance and problems, and plan for the future. You can choose from several pre-defined reports, and create custom reports consisting of individual metrics that Diagnostic Manager collects. Reports can be run immediately or scheduled to run later and/or on a recurring basis, and results can be printed or exported as an Excel or.pdf (and for scheduled reports,.csv) file for distribution and further analysis outside of the Diagnostic Manager Management Console. Information Contained in Pre-Defined Reports new Diagnostic Manager includes pre-defined reports in the following categories: Farm/Group Reports Server Reports Content Summary Reports Page Reports Office 365 Reports Farm/Group Reports Report Description Active Alerts (Farm/Groups) All of the active alerts. You can limit the report to one farm or Server Group or include all that are being monitored. Alert History (Farm/Group) Alert history for monitored servers in a single farm or Server Group. You can control the time period for the alerts that the report includes. Content Database Summary A summary of the content databases used by the selected SharePoint farm sorted by database size. Farm/Group Capacity Summary The disk usage for each server in the SharePoint farm and/or Server Group. Farm/Group Summary A summary of the health of a selected SharePoint farm or Server Group, including a high-level view of the health and status of the servers that make up the farm or Server Group. SQL Server Inventory An inventory of the SQL Server instances and databases that are included in the selected SharePoint farm. 126
127 Server Reports Report Description Active Alerts (Servers) All of the active alerts. You can limit the report to one SharePoint farm or include all monitored SharePoint farms. You can include all servers, all servers in a single farm, or a single server. Alert History (Servers) The alert history for monitored servers in one SharePoint farm/server Group or in all monitored SharePoint farms and Server Groups. You can include a single server, or all servers from the included farms/groups. You can control the time period for the alerts that the report includes. Application Pools Summary An overview of the configuration and status of Application Pools for one or more selected SharePoint farms/server Groups. Current Services Status A summary of the status as of the last collection of server performance metrics of key Windows Services running on one or more SharePoint farm or Server Group servers. Historical Service Status A graphical representation of the status of a selected Windows Service on a SharePoint farm or Server Group server over a specified time period. You also have the option of displaying a tabular view of this data. CPU Statistics CPU usage statistics for a single monitored server. You can specify the time period that the report includes. You can specify the time period over which the report averages data. If needed, you can include tables of the data that the report is based on. Disk Statistics Disk usage statistics for a single monitored server. You can specify the time period that the report includes. You can specify the time period over which the report averages data. If needed, you can include tables of the data that the report is based on. Memory Statistics Memory usage statistics for a single monitored server. You can specify the time period that the report includes as well as the period over which the report averages data. If needed, you can include tables of the data that the report is based on. Network Status A summary of network metric alerts that were raised for servers within one or more selected SharePoint farms/server Groups over a specified time period. Server Capacity Summary Disk usage for each of the servers that makes up a single SharePoint farm or Server Group. 127
128 Report Description Server Summary A summary of a single monitored server, including the server properties, configuration, and trends. Top Servers A list of the worst-performing servers from a single farm/server Group or from all farms/server Groups. You can control the time period the report includes. You can also control the number of servers that the report includes. By default, the report includes five servers. The list is based on the following criteria: Number of active alerts. CPU usage. Memory usage. Disk activity. Content Summary Reports Report Description Active Alerts (Content Summary) All of the active content summary alerts. You can limit the report to one SharePoint farm or tenant or include all monitored SharePoint farms and tenants. Alert History (Content Summary) The alert history for the content summary in one SharePoint farm/tenant or in all monitored SharePoint farms and tenants. You can control the time period for the alerts that the report includes. Content Summary Errors A summary of errors that may have occurred during data collection. Farm Content Summary A summary of the content of a selected SharePoint farm. You can control the time period the report includes. If needed, you can include tables of the data that the report is based on. Farm Document Composition The types of documents that a specific SharePoint farm includes. Farm Growth A summary of the growth of the content databases and database files that make up the SharePoint farm. You can control the time period the report includes. Site Collection Document Composition The types of documents included in a selected Site Collection. 128
129 Report Description Site Collection Growth A summary of the growth of the content, databases and database files that make up a Site Collection that you select. You can control the time period the report includes. Site Collection Summary A summary of the contents of a Site Collection that you select in a SharePoint farm. You can control the time period the report includes. Top Site Collections A summary of the largest Site Collections and the fastest growing Site Collections in your SharePoint farm. Top Sites A summary of the largest Sites and the fastest growing Sites in your SharePoint farm Top Web Applications A summary that includes a list of the largest Web applications and the fastest growing Web applications. You can include Web applications from all monitored SharePoint farms or from a specific farm that you select. Web Application Document Composition The types of documents within a selected Web application. Web Application Growth A summary of growth of the content, databases and database files that make up a selected Web application. You can control the time period the report includes. Web Application Summary A summary of the contents of a selected Web application. You can control the time period the report includes. If needed, you can include tables of the site collection data and content database data that the report is based on. Page Reports Reports Description Active Alerts (Pages) All of the active page alerts. You can limit the report to one SharePoint farm or Server Group or include all monitored SharePoint farms/server Groups. You can include all pages from the included farms/server Groups or a single page that you specify. Alert History (Pages) The alert history for monitored pages on SharePoint farm or Server Group or on all monitored SharePoint farms/server Groups. You can include a single page, or all pages from the included farms/server 129
130 Reports Description Groups. You can control the time period for the alerts that the report includes. Page Component Analysis Performance details of the individual components that make up a SharePoint page. Page Statistics A summary of the page statistics for a single monitored page. You can specify the period included in the report. You can also specify the time period over which the report averages data. If needed, you can include tables of the data that the report is based on. Page Uptime A summary of the availability and performance for a single monitored page that you specify. Page Uptime Summary A summary of the availability and performance data for all of the monitored pages in a selected farm or Server Group. You can specify the period included in the report. You can also specify the time period over which the report averages data. Top Pages A list of the worst-performing monitored pages. You can include pages from a single farm or Server Group or from all farms/server Groups. You can control the time period the report includes. You can also control the number of pages that the report includes. By default, the report includes five pages. The list is based on the following criteria: Number of active alerts. Average load time. Total downtime. Page Status The following status information for one or more Monitored Pages Server Status Load Time Thresholds Date and time data was collected Summary of http Status code and message, (e.g., OK; Access Denied) Office 365 Reports Reports Description Current Traffic Analytic For one or more selected SharePoint Online sites, the number of site visits and unique views: for the last seven days AND 130

131 Reports Description over the lifetime of the site. Viewing Pre-Defined Report Definitions To view a pre-defined report definition: Use one of the following options: In the Management Console tree, select Reports, then in the Reports view select the report you want to view. Note that reports are grouped by subject matter. In the Management Console tree, expand the Reports node and select the report you want to view. The tree groups reports by subject matter. You can click the plus (+) symbol beside a group name to expand it. 131

132 The Reports view displays the report that you selected. The Reports view includes additional information about the report and the information that the report contains. After you select the appropriate parameters, you can you can run the report. Creating and Using Metric Status Reports You can create a report for a single metric for which Diagnostic Manager collects data. You can select from almost 200 metrics, and include multiple farms, Server Groups, and servers in the report. NOTE: Only one report can be created per metric. To create a Metric Status Report: 1. In the Management Console tree, expand the Reports node. 2. Select Metric Status Report. 3. Either: right-click and choose Add metric status report. 132

![5 Select the metric for whose status you want to report. 6 Click [OK].](/docs-images/85/91496342/images/133-1.jpg "The new report displays in both the Management Console tree and the Reports - Metric Status Reports view.")
133 OR From the Metric Status Reports section of the ribbon choose Add. 4 In the Select Report Metrics dialog box, enter a unique name for the report in the Report name field. 5 Select the metric for whose status you want to report. 6 Click [OK]. The new report displays in both the Management Console tree and the Reports - Metric Status Reports view. To run a Metric Status Report: 1 In the Management Console tree, expand the Reports node. 133

134 2 Either: Select the Metric Status Reports node, then in the Metric Status Reports view, choose the report you want to run. OR 3 Expand the Metric Status Reports node, then select the report you want to run. In the Report view, select the report filters from the drop-down lists. Now you can run the report. To edit a Metric Status Report name: 2 3 In the In the Management Console tree, expand the Reports node. Select the Metric Status Reports node, then in the Metric Status Reports view, choose the report you want to edit. Expand the Metric Status Reports node, then select the report you want to edit. Do one of the following: Right-click and choose Edit metric status report. OR 4 In the Custom Report section of the ribbon, select the report whose definition you want to view/edit, then choose Edit. In the Select Report Metrics dialog, update the Report name then click [OK]. To delete a Metric Status Report: 1 In the Management Console tree, tree, expand the Reports node. 2 Select Metric Status Reports. 3 In the Metric Status Reports view, select the report you want to delete. 4 Do one of the following: In the Metric Status Reports section of the ribbon, choose Delete. OR Right-click and choose Delete Report. 134

135 Creating and Using Custom Reports Every environment has unique reporting needs. If the standard reports that Diagnostic Manager provides do not meet your needs, you can create custom reports. A custom report can include up to 10 metrics, each of which is presented in its own line chart. You can include any combination of metrics. When you run the report, you specify the server to include in the report, along with the range of data to include and the granularity of the data. You can also choose to include or omit the tabular data that makes up the chart in the report. NOTE: Currently, you cannot schedule custom reports nor export them to CSV. To create a custom report: 1 In the Management Console tree, expand the Reports node. 2 Select Custom Report. 3 Either: right-click and choose Add custom report. OR 4 From the Custom Reports section of the ribbon choose Add. In the Add Custom Report dialog, enter a unique name for the report in the Report name field. 135
![5 Select the metrics to add to the report. You can Control-Click to select multiple metrics. 6 When you have selected the metrics to include, click [OK].](/docs-images/85/91496342/images/136-0.jpg "The new report displays in the Management Console tree and the Reports -Custom Reports view. To run a custom report: 1 In the Management Console tree, expand the Reports node.")
136 5 Select the metrics to add to the report. You can Control-Click to select multiple metrics. 6 When you have selected the metrics to include, click [OK]. The new report displays in the Management Console tree and the Reports -Custom Reports view. To run a custom report: 1 In the Management Console tree, expand the Reports node. 2 Either: Select the Custom Reports node, then in the Custom Reports view, choose the report you want to run. OR Expand the Custom Reports node, then select the report you want to run. 136
, check this box. Now you can run the report.")
137 3 In the Custom Reports view, select the report filters from the drop-down lists. NOTE: Use the Sample filter to specify the intervals at which data should be mapped. If you want to Show Tabular Data along with the chart(s), check this box. Now you can run the report. To edit a custom report definition: 1 In the Management Console tree, double-click Reports to open it. 2 Do one of the following: In the Management Console tree, select the custom report whose definition you want to edit, rightclick and choose Edit Report. OR In the Custom Report section of the ribbon, select the report whose definition you want to edit, then choose Edit Report. Now you can update the Report name, change the order in which metrics are displayed in the report, and/or add/remove metrics. To delete a custom report: 1 In the Management Console tree, tree, expand the Reports node. 2 Select Custom Reports, 3 In the Custom Reports view, select the custom report you want to delete. 4 Either: In the Custom Report section of the ribbon, choose Delete. OR Right-click and choose Delete custom report. 137
 OR schedule the report to run at a later time and/or on a recurring basis.")
138 Running a Report Once you have created a report and selected filters, you can: run the report immediately (by clicking the Run icon ( ) in the Reports section of the ribbon.) OR schedule the report to run at a later time and/or on a recurring basis. If you chose to run the report immediately, from Report results you can do the following: Click the First Page, Previous Page, Next Page, and Last Page buttons to view the report pages. Click the Refresh icon ( Click the Print icon ( Click the Print Layout icon ( Click the Page Setup icon ( printer. Click the Export icon ( ) to refresh the report. ) to print the report. ) to view the print layout for the report. ) to change the page size, orientation, margins, and paper source in the ) to export the report as an Excel, PDF, or CSV file. NOTE: If you select the CSV option, only tabular not graphical data will be output. For reports that include graphical data (such as Statistics or certain Summary reports) that you want to output to CSV, tabular data will be included regardless of whether the Show Tabular Data box is checked. Scheduling a Report The Diagnostic Manager Scheduled Reports feature lets you set up reports to run in the background at a specified date and time, either once or on a recurring basis. This feature is especially useful for reports that you want to run and distribute on a regular basis. NOTE: Currently, you cannot schedule a custom report or a report that includes a custom date range. 138
![Scheduling a Recurring Report for Which a Specific Time Period was Selected When report parameters specify a fixed time period (for example, "Today" or "Last [x] Days (or Hours)," the Diagnostic](/docs-images/85/91496342/images/139-0.jpg "Manager scheduler will interpret it as a relative date range (that is, relative to the date when the scheduled job is run).")
139 Scheduling a Recurring Report for Which a Specific Time Period was Selected When report parameters specify a fixed time period (for example, "Today" or "Last [x] Days (or Hours)," the Diagnostic Manager scheduler will interpret it as a relative date range (that is, relative to the date when the scheduled job is run). Whenever the job runs, the report will cover the specified time period, as of the run date. EXAMPLE: If you initiate an Alert History Report for a date range that covers the past 7 days, then schedule it to run every week, beginning in the first week of February: the first time the scheduled job runs, results will include data for the week specified in the report parameters: 139

140 the second time the scheduled job runs (the following week), results will include data for the second week of February. and so on. Creating a Scheduled Report NOTE: Currently, you cannot schedule a custom report or a report that includes a custom date range. To create a Diagnostic Manager Scheduled Report job: 1 After initiating and specifying the parameters for a Diagnostic Manager report, click the Schedule icon in the Report section of the ribbon. 2 Complete the General Job Information section as follows: a) Enter a Job Name and Description. 140
 If you want the job to be active, make sure the Active box is checked. NOTE: Once a scheduled job has been added, it can be activated or deactivated as needed. c) Enter an Output File Name.")
141 TIP: Choose a brief but descriptive name that uniquely identifies the job. This will make it easier for you to identify it in the Scheduled Reports grid. b) If you want the job to be active, make sure the Active box is checked. NOTE: Once a scheduled job has been added, it can be activated or deactivated as needed. c) Enter an Output File Name. NOTE: It is not necessary to enter a file extension; it will be applied automatically based on the selected Output Type. d) Select an Output Type (Acrobat (PDF), Excel , or CSV (comma delimited) from the drop-down. NOTE: If you select the CSV option, only tabular not graphical data will be output. For reports that include graphical data (such as Statistics or certain Summary reports) that you want to output to CSV, tabular data will be included regardless of whether the Show Tabular Data box is checked. e) If you want the date and time that the job is run to be appended to the file name, click the Include Date Time stamp in the file name box. (This will enable you to retain a historical record of report results.) 3 Complete the Schedule Details as follows: 141
142 If you want to... Then... run an operation one time only a. Enter or select a Start date and time. b. Uncheck the Recurring box. run an operation at regular intervals a. For Start, enter or select the first date and time that you want the job to run. b. Make sure the Recurring box is checked. c. For Run every: Enter or select the interval (as a positive integer) at which you want the job to run. Select an interval type (Weekly, Hourly, Daily, or Monthly). d. For Until, enter or select the last date and time that you want the job to run. NOTE: Dates and times correspond to those of the server on which the Diagnostic Manager scheduler is running. 4 For Distribution Details: Complete the Send to:, Subject, and Message fields. (Note that you can enter multiple addresses (separated by commas) in the Send to field. If you want to configure settings, click the [ settings] and follow the instructions for Configuring Settings. 142

143 CAUTION: settings are common across Diagnostic Manager operations. For example, any changes made to settings initiated from the Scheduled Report dialog will also impact Alert Responses. 5 To save the job, click [OK]. Once a scheduled job has been created, it can be accessed via the Scheduled Reports grid. Managing Scheduled Reports From the Scheduled Reports grid, you can view the status of scheduled jobs. You can also: view the report's parameters edit scheduled report settings delete scheduled jobs run a scheduled report immediately To access the Scheduled Reports grid: In the Management Console tree, expand the Reports node then select Scheduled Reports. The Scheduled Report grid displays the following information for each scheduled job: Job Name One of the following Schedule Status values: Status Description Pending All jobs that are scheduled to run within the specified date range. Pending jobs include: one-time jobs that have not yet run AND recurring jobs that have not yet reached their End Date. Running All scheduled jobs that are currently running (as long as the specified date range includes the current date). 143


144 Status Description Inactive Jobs that are not currently active but were created or last ran during the specified date range. Retired Jobs that finished running within the specified date range. Retired jobs include: one-time jobs that have already run AND recurring jobs that have reached their End Date. Creation Date and time End Date and time (which, for recurring jobs, displays the last date and time that the job is scheduled to run) Last Run Time NOTE: If a job has not yet run for the first time, the Last Run Time displays as "Never." Next Run Time, which identifies: the next date/time a Pending job is scheduled to run the last date/time a Retired or Inactive job ran the start date/time that an in-process job started running. NOTE: If a job has reached its End Date and time, the Next Run Time displays as "Never." If you want to narrow displayed results, you can: search for a specific text string AND/OR filter by one or more column headers. 144

145 Viewing Scheduled Report Parameters From the Scheduled Reports grid you can view a scheduled report's parameters. NOTE: Currently, you can view, but not edit, scheduled report parameters. To view a scheduled report's parameters: 1 In the Scheduled Reports grid, select the report whose parameters you want to view. 2 In the Reports section of the ribbon, click the Parameters icon. Editing Scheduled Report Settings From the Scheduled Reports grid, you can edit the details of a report's schedule. To edit Scheduled Report settings: 1 In the Scheduled Reports grid, select the report whose settings you want to edit. 2 In the Reports section of the ribbon, click the Edit Schedule icon to display the Edit Scheduled Report Settings dialog. 145

146 3 Update the appropriate fields, as described in the topic Creating a Scheduled Job. NOTE: You can edit any field on this dialog except the Job Name. Deleting a Scheduled Report Job NOTE: Currently, you can only delete one scheduled job at a time. To delete a Scheduled Report job: 1 In the Scheduled Report grid, select the scheduled job you want to delete. 2 In the Reports section of the ribbon, click the Delete ( ) icon. Running a Scheduled Report Immediately From the Scheduled Reports grid, you can initiate an immediate, one-time run of the report, using the parameters and distribution details specified in the Scheduled Report Settings. NOTE: Initiating a one-time report run will not impact the job's schedule. For example, a Pending job will still run at the Next Run Time displayed in the grid. You can also run a Retired job. To run a scheduled report immediately: 1 In the Scheduled Reports grid, select the report that you want to run immediately. 2 In the Reports section of the ribbon, click the Run ( 146 ) icon.

147 Managing Diagnostic Manager You can specify the options for the Management Console and Collection Service, including the Repository. You can also force Diagnostic Manager to collect data from servers and pages or even suspend data collection. Temporarily Suspending Data Collection You may want to temporarily stop collecting data from part of your SharePoint deployment. With Diagnostic Manager, you can choose to temporarily stop collecting data from any server, Web application, or monitored page. Disabling Data Collection for a Server If you disable data collection for a server, the Collection Service no longer retrieves information about the memory, CPU, or disk states on any server type. On Web front end (WFE) hosts, the Collection Service also stops retrieving information about Internet Information Server (IIS). Finally, the Collection service stops monitoring pages on disabled servers. If the disabled server is the only WFE you use to monitor the page, then no data is collected for the page. If you collect data about the page from another WFE and the other WFE is enabled, the Collection Service continues to monitor the page on the enabled WFE. If you monitor a page on all WFEs, the Collection Service excludes the disabled server when it monitors the page. In addition, the Collect Metrics Now option in the ribbon in the Server Dashboard view becomes disabled. NOTE: When you disable data collection for a server, any historical data is retained in the Repository. You can continue to use the Management Console to review any stored data about the server, but no new data is collected. To temporarily disable data collection for a server: Use one of the following options: In the Management Console tree, select the server for which you want to disable data collection, rightclick and choose Disable Server. In the Management Console tree, select Servers, then in the Servers section of the ribbon select the server for which you want to disable data collection, and choose Disable Server. 147


148 You will be prompted to confirm the action before continuing. NOTE: A disabled server will display in the tree with a icon. To enable data collection for a server: Use one of the following options: In the Management Console tree, select the server for which you want to disable data collection, rightclick and choose Enable Server. In the Management Console tree, select Servers, in the Servers view select the server for which you want to enable data, then choose Enable Server. Disabling Data Collection for a Web Application If you disable data collection for a Web application, the Collection Service no longer retrieves information about the Web application or any of the site collections within it. NOTE: When you disable data collection for a Web application, any historical data for the Web application and the site collections it hosts is deleted from the Repository. However, any monitored pages within the Web application that were manually added to Diagnostic Manager will continue to be monitored. 148


149 To temporarily disable data collection for a Web application: Use one of the following options: In the Management Console tree, expand the Content Summary node, then select the Web application for which you want to disable data collection, right-click and choose Disable Web Application. In the Management Console tree, select Content Summary, select the Web application for which you want to disable data collection, then in the Content Summary section of the ribbon choose Disable Web Application. You will be prompted to confirm the action before continuing. NOTE: A disabled Web application will display in the tree with a icon. Note that, when a Web application is disabled, the site collections it hosts will no longer be visible in the Management Console tree. To re-enable data collection for a Web application: Use one of the following options: In the Management Console tree, select the Web application for which you want to enable data collection, right-click and choose Enable Web Application. In the Management Console tree, select Content Summary, in the Content Summary Overview view select the Web application for which you want to enable data collection, then in the Content Summary section of the ribbon choose Enable Web Application. 149


150 You will be prompted to choose whether you want to: collect data for the Web application immediately OR wait until the next time a data collection is requested. Disabling Data Collection for a Monitored Page If you disable data collection for a monitored page, the Collection Service no longer retrieves information about the page. NOTE: When you disable data collection for a page, any historical data is retained in the Repository. You can continue to use the Management Console to review any stored data about the page, but no new data is collected. To temporarily disable data collection for a page: Do one of the following: In the Management Console tree, right-click the page for which you want to disable data collection, rightclick and choose Disable Page. In the Management Console tree select Monitored Pages, in the Monitored Pages view select the page you want to disable, then in the Monitored Pages section of the ribbon choose Disable. 150


151 You will be prompted to confirm the action before continuing. NOTE: A disabled page will display in the tree with a icon. To re-enable data collection for a page Use one of the following options: In the Management Console tree, select the page for which you want to enable data collection, right-click and choose Enable Page. In the Management Console tree, select Monitored Pages, then in the Monitored Pages pane select the page for which you want to enable data collection and choose Enable Page. 151

152 Setting the Management Console Preferences You can make changes to the following Management Console preferences: For the following preference... You can specify... Auto Refresh whether to disable or enable the dashboard auto refresh for a specific time interval. Server View whether to maintain the selected tab and area when switching between servers. Alert View the maximum number of alerts to display per page. ULS View the maximum number of ULS log entries to display in the list. Home Page whether to display or hide the Welcome panel on the Home page. Content Summary Web Application the maximum number of site collections that can display under a Web application in the Content Summary section of the left navigation tree. NOTE: By default, this value is set to 100, and Diagnostic Manager retrieves site collections in the order that they were added, from first to last. Keep in mind that the fewer the number of site collections that need to be loaded, the more responsive the Management Console will be. You can always view all site collections within a Web application via the Content Summary view. 152
153 To set the Management Console preferences: 1 From the Management Console ribbon, choose Options > Management Console Preferences. 2 In the Management Console Preferences dialog box, make any desired changes to the options. 3 Click [OK] to close the dialog box and save the changes. Moving your Repository to a Different SQL Server Instance You can move your Diagnostic Manager repository database from one SQL Server instance to another if necessary. It is important that you first stop the Collection Service before migrating the data between the instances. To move your repository from one SQL Server instance to another 1 Stop the Collection Service. 2 Use the following steps to move the database: a) Detach from the source SQL Server instance. b) Copy the database to the target SQL Server instance. c) Attach the database in the target SQL Server instance. 3 Update the CollectionService.exe.config file, usually located at c:\program Files (x86) \\Diagnostic Manager\CollectionService\. The value RepositoryHost specifies the name of the SQL Server instance hosting the repository. 4 Restart the Collection Service. 153

154 Setting the Collection Service Options Diagnostic Manager lets you specify how the Collection Service behaves. You can also view information about the Collection Server service host, version, and other configuration information. NOTE: The time at which a job is scheduled to run reflects the local time of the server on which the Collection Service was installed. To access the Collection Service Options dialog: From the Management Console ribbon, choose Options > Collection Service Options. Farm & Page Monitoring Scheduling Options The Collection Service Options - Farm & Page Monitoring Schedule tab contains the following options: Option Description Farm Topology Refresh How often the Collection Service refreshes the list of servers that make up the SharePoint farms and Server Groups. Configuration Refresh How often the Collection Service checks the configuration and SharePoint Health Analyzer reports for the servers that make up the SharePoint farm. Ignore SSL certificate How the Collection Service handles self-signed SSL certificates and errors that errors result from problems with the SSL certificate on Windows front end (WFE) 154

155 Option Description servers. If you use self-signed certificates on your WFE servers, or if the installed certificates are expired or have other problems, the Collection Service does not collect data from the WFE. You can choose to ignore these errors and collect data from the WFE. Farm Databases The option to Monitor All DBs within SharePoint farms or Monitor Content DBs and System DBs only StoragePoint If you use StoragePoint to manage Remote BLOB Storage (RBS) in you SharePoint environment, how often the Collection Service collects StoragePoint jobs execution. Content Summary Options Content Summary Tab The Collection Service Options - Content Summary tab contains the following options: Option Description SharePoint Content Summary Collection Schedule The time of day and the days of the week that the Collection Service collects farm object counts and sizes. By default, the Collection Service retrieves this information every day at 1:00 AM. 155

156 Option Description An indication of whether the Collection Service should, in Content Summary data collection: List Options Include hidden lists Include all document versions, and/or Include attachments. NOTE: If your environment includes a large number of hidden lists and/or document versions, including them could noticeably increase the duration of the data collection operation. If your SharePoint environment uses Alternate Access Mappings, the zone whose url you want the Collection Service to use first for Content Summary data collection. Alternate Access Mapping Options NOTE: If you do not enable this option, the Collection Service always uses the Default zone first. Threading Options The maximum number of threads the Collection Service should use when performing a Content Summary data collection. By default, this value coincides with the number of processing cores on the machine where the Collection Service runs. It can, however, be adjusted. CAUTION: Increasing this value beyond double the number of cores on the Collection Service machine will not necessarily increase the speed of data collection and may negatively impact SharePoint performance. Note: The options on this tab except for Threading Options, apply to SharePoint On-Premises farms only. (Threading Options apply to both On-Premises farms and Office 365 tenants.) Other Collection options for Office 365 tenants are specified on the Office365 tab. 156
157 Server Monitoring Schedule Options Server Monitoring Schedule tab The Collection Service Options - Server Monitoring Schedule tab contains the following options: Option Description Server Performance Collection How often the Collection Service retrieves performance information from the monitored (Windows) servers. SQL Server Performance Collection How often the Collection Service retrieves performance information from the SQL servers. Windows Services Collection How often the Collection Service collects Windows Services status information. Database Fragmentation Collection Schedule The time of day and the days of the week that the Collection Service collects information about the database index fragmentation. By default, the Collection Service retrieves this information every day at 2:00 AM. Application Pool Collection How often the Collection Service retrieves Application Pool status and configuration information from WFE servers. 157

158 Collection Service Security Options The Collection Service Options - Security tab allows you to specify users you can connect or are restricted from connecting to the Collection Service. 158

159 Repository Maintenance Options The Collection Service Options - Repository Maintenance tab contains the following options: Option Description Repository Maintenance Schedule What time the Collection Service should perform required maintenance on the Repository. Performance Data Grooming The Collection Service can groom performance data older than the age you specify. You can also choose to disable performance data grooming. Alert Grooming The Collection Service can groom alerts older than the age you specify. You can also choose to disable alerts grooming. In addition to setting the Collection Service preferences, you can use the Collection Service Options dialog box to take the following immediate actions: Groom Repository Now immediately starts to groom the data Repository. Update Statistics Now immediately collects and updates the Diagnostic Manager Repository database statistics. To immediately start grooming the data Repository, click [Groom Repository Now]. To immediately start collecting and updating the Diagnostic Manager Repository database statistics, click [Update Statistics Now]. 159
160 ULS Options The Collection Service Options - ULS tab contains options for enabling the collection of ULS Log entries from SharePoint (synchronized across all monitored farms), specifying what level of log entry you want to be collected, how often you want them to be collected, and how long you want them to be retained. You can also clear ULS history from the Repository database. See Enabling and Configuring ULS Log Entries for details. 160

161 Office365 Options The Collection Service Options - Office365 tab contains the following options: Option Description How often the Collection Service checks for the status of Office 365 Check Services Status Schedule services. By default, the Collection Service retrieves this information every 15 minutes. Content Summary Collection Schedule The time of day and the days of the week that the Collection Service collects tenant object counts and sizes. By default, the Collection Service retrieves this information every day at 1:00 AM. An indication of whether the Collection Service should, in Office 365 data collection: List Options Include hidden lists Include all document versions, and/or Include attachments. NOTE: If your environment includes a large number of hidden lists and/or document versions, including them could noticeably increase the duration of the data collection operation. NOTE: Threading Options, which apply for both On-Premises SharePoint farms and Office 365 tenants, are specified on the Content Summary tab. 161

162 Configuration Details The Collection Service Options- Configuration tab displays details about your Collection Service configuration. You can also copy the information to the Windows clipboard. 162
Diagnostic Manager Advanced Installation Guide
 Diagnostic Manager Publication Date: May 03, 2017 All Rights Reserved. This software is protected by copyright law and international treaties. Unauthorized reproduction or distribution of this software,
Diagnostic Manager. User Guide VERSION 4.9. January 16,
 Diagnostic Manager User Guide VERSION 4.9 January 16, 2018 www.metalogix.com info@metalogix.com 202.609.9100 Copyright Copyri ght Meta l ogi x Interna ti ona l GmbH a nd Idera, Inc., 2004-2018 Al l ri
Diagnostic Manager. Advanced Installation Guide. March 23,
 Diagnostic Manager Advanced Installation Guide March 23, 2018 www.metalogix.com info@metalogix.com 202.609.9100 Copyright Copyri ght Meta l ogi x Interna ti ona l GmbH a nd Idera, Inc., 2004-2018 Al l
ControlPoint. Installation Guide for SharePoint August 23,
 ControlPoint Installation Guide for SharePoint 2007 August 23, 2017 www.metalogix.com info@metalogix.com 202.609.9100 Copyright International GmbH., 2008-2017 All rights reserved. No part or section of
ControlPoint. Quick Start Guide. November 09,
 ControlPoint Quick Start Guide November 09, 2017 www.metalogix.com info@metalogix.com 202.609.9100 Copyright International GmbH., 2008-2017 All rights reserved. No part or section of the contents of this
StoragePoint RestorePoint for StoragePoint
 StoragePoint RestorePoint for StoragePoint July 27, 2018 www.metalogix.com info@metalogix.com 202.609.9100 Copyright 2018 Copyright International GmbH All rights reserved. No part or section of the contents
Installation and Upgrade Guide
 ControlPoint for Office 365 Installation and Upgrade Guide Publication Date:November 09, 2017 All Rights Reserved. This software is protected by copyright law and international treaties. Unauthorized reproduction
Content Matrix. Evaluation Guide. February 12,
 Content Matrix Evaluation Guide February 12, 2018 www.metalogix.com info@metalogix.com 202.609.9100 Copyright International GmbH, 2002-2018 All rights reserved. No part or section of the contents of this
ControlPoint. Advanced Installation Guide. September 07,
 ControlPoint Advanced Installation Guide September 07, 2017 www.metalogix.com info@metalogix.com 202.609.9100 Copyright International GmbH., 2008-2017 All rights reserved. No part or section of the contents
StoragePoint Advanced Installation Guide
 A StoragePoint January 16, 2018 www.metalogix.com info@metalogix.com 202.609.9100 Copyright 2018 Copyright Metalogix International GmbH All rights reserved. No part or section of the contents of this material
ControlPoint. Native Installation Guide. February 05,
 ControlPoint Native Installation Guide February 05, 2018 www.metalogix.com info@metalogix.com 202.609.9100 Copyright International GmbH., 2008-2018 All rights reserved. No part or section of the contents
Exchange Pro 4.4. User Guide. March 2017
 Exchange Pro 4.4 User Guide March 2017 Table of Contents 1. Introduction to Exchange Pro... 5 About this Document... 5 Supported Mailbox Migration Paths... 6 Supported Public Folders Migration Paths...
Monitoring Replication
 Replicator Monitoring Replication VERSION 7.4.0 January 04, 2018 Scenario Guide Article 1130112-02 www.metalogix.com info@metalogix.com 202.609.9100 Copyright International GmbH, 2002-2018 All rights reserved.
ControlPoint. Managing ControlPoint Users, Permissions, and Menus. February 05,
 Managing Users, Permissions, and Menus February 05, 2018 www.metalogix.com info@metalogix.com 202.609.9100 Copyright International GmbH., 2008-2018 All rights reserved. No part or section of the contents
Connect Install Guide
 Connect Install Guide Version 3.2 Publication Date: December 16, 2013 Copyright Metalogix International GmbH 2008-2013. All Rights Reserved. This software is protected by copyright law and international
ControlPoint. Evaluation Guide. November 09,
 ControlPoint Evaluation Guide November 09, 2017 www.metalogix.com info@metalogix.com 202.609.9100 Copyright International GmbH., 2008-2017 All rights reserved. No part or section of the contents of this
Data Protection Guide
 SnapCenter Software 4.0 Data Protection Guide For Microsoft Exchange Server March 2018 215-12936_C0 doccomments@netapp.com Table of Contents 3 Contents Deciding whether to read the SnapCenter Data Protection
Early Data Analyzer Web User Guide
 Early Data Analyzer Web User Guide Early Data Analyzer, Version 1.4 About Early Data Analyzer Web Getting Started Installing Early Data Analyzer Web Opening a Case About the Case Dashboard Filtering Tagging
INSTALLATION GUIDE Spring 2017
 INSTALLATION GUIDE Spring 2017 Copyright and Disclaimer This document, as well as the software described in it, is furnished under license of the Instant Technologies Software Evaluation Agreement and
Veeam ONE. Version 8.0. User Guide for VMware vsphere Environments
 Veeam ONE Version 8.0 User Guide for VMware vsphere Environments July, 2015 2015 Veeam Software. All rights reserved. All trademarks are the property of their respective owners. No part of this publication
DocAve for Salesforce 2.1
 DocAve for Salesforce 2.1 This document is intended for anyone wishing to familiarize themselves with the user interface and basic functionality of AvePoint s DocAve for Salesforce tool. System Requirements
USER GUIDE Summer 2015
 USER GUIDE Summer 2015 Copyright and Disclaimer This document, as well as the software described in it, is furnished under license of the Instant Technologies Software Evaluation Agreement and may be used
Installation on Windows Server 2008
 USER GUIDE MADCAP PULSE 4 Installation on Windows Server 2008 Copyright 2018 MadCap Software. All rights reserved. Information in this document is subject to change without notice. The software described
Netwrix Auditor. Administration Guide. Version: /31/2017
 Netwrix Auditor Administration Guide Version: 9.5 10/31/2017 Legal Notice The information in this publication is furnished for information use only, and does not constitute a commitment from Netwrix Corporation
Chime for Lync High Availability Setup
 Chime for Lync High Availability Setup Spring 2017 Copyright and Disclaimer This document, as well as the software described in it, is furnished under license of the Instant Technologies Software Evaluation
Metalogix ControlPoint 7.6. for Office 365 Installation Guide
 Metalogix 7.6 for Office 365 Installation Guide 2018 Quest Software Inc. ALL RIGHTS RESERVED. This guide contains proprietary information protected by copyright. The software described in this guide is
Deployment guide for Duet Enterprise for Microsoft SharePoint and SAP Server 2.0
 Deployment guide for Duet Enterprise for Microsoft SharePoint and SAP Server 2.0 Microsoft Corporation Published: October 2012 Author: Microsoft Office System and Servers Team (itspdocs@microsoft.com)
User Manual. ARK for SharePoint-2007
 User Manual ARK for SharePoint-2007 Table of Contents 1 About ARKSP (Admin Report Kit for SharePoint) 1 1.1 About ARKSP 1 1.2 Who can use ARKSP? 1 1.3 System Requirements 2 1.4 How to activate the software?
MultiSite Manager. User Guide
 MultiSite Manager User Guide Contents 1. Getting Started... 2 Opening the MultiSite Manager... 2 Navigating MultiSite Manager... 2 2. The All Sites tab... 3 All Sites... 3 Reports... 4 Licenses... 5 3.
Synchronization Agent Configuration Guide
 SafeNet Authentication Service Synchronization Agent Configuration Guide 1 Document Information Document Part Number 007-012848-001, Rev. E Release Date July 2015 Applicability This version of the SAS
EMC SourceOne for Microsoft SharePoint Version 7.1
 EMC SourceOne for Microsoft SharePoint Version 7.1 Installation Guide 302-000-151 REV 01 EMC Corporation Corporate Headquarters: Hopkinton, MA 01748-9103 1-508-435-1000 www.emc.com Copyright 2009-2013
ControlPoint. for Office 365. User Guide VERSION 7.6. August 06,
 ControlPoint for Office 365 User Guide VERSION 7.6 August 06, 2018 www.metalogix.com info@metalogix.com 202.609.9100 Copyright International GmbH., 2008-2018 All rights reserved. No part or section of
Netwrix Auditor for Active Directory
 Netwrix Auditor for Active Directory Quick-Start Guide Version: 8.0 4/22/2016 Legal Notice The information in this publication is furnished for information use only, and does not constitute a commitment
Mission Control for the Microsoft Cloud. 5nine Cloud Security. Web Portal Version 12.o. Getting Started Guide
 Mission Control for the Microsoft Cloud 5nine Cloud Security Web Portal Version 12.o Getting Started Guide 2018 5nine Software Inc. All rights reserved. All trademarks are the property of their respective
Data Protection Guide
 SnapCenter Software 4.0 Data Protection Guide For VMs and Datastores using the SnapCenter Plug-in for VMware vsphere March 2018 215-12931_C0 doccomments@netapp.com Table of Contents 3 Contents Deciding
Dell SupportAssist Version 1.0 For Microsoft System Center Operations Manager User's Guide
 Dell SupportAssist Version 1.0 For Microsoft System Center Operations Manager User's Guide Notes, Cautions, and Warnings NOTE: A NOTE indicates important information that helps you make better use of your
LifeSize Control Installation Guide
 LifeSize Control Installation Guide January 2009 Copyright Notice 2005-2009 LifeSize Communications Inc, and its licensors. All rights reserved. LifeSize Communications has made every effort to ensure
USER GUIDE Spring 2016
 USER GUIDE Spring 2016 Copyright and Disclaimer This document, as well as the software described in it, is furnished under license of the Instant Technologies Software Evaluation Agreement and may be used
NTP Software VFM. Administration Web Site for EMC Atmos User Manual. Version 6.1
 NTP Software VFM Administration Web Site for EMC Atmos User Manual Version 6.1 This guide details the method for using NTP Software VFM Administration Web Site, from an administrator s perspective. Upon
Data Protection Guide
 SnapCenter Software 4.0 Data Protection Guide For Custom Plug-ins March 2018 215-12932_C0 doccomments@netapp.com Table of Contents 3 Contents Deciding on whether to read the SnapCenter Data Protection
Data Protection Guide
 SnapCenter Software 4.1 Data Protection Guide For VMs and Datastores using the SnapCenter Plug-in for VMware vsphere September 2018 215-13399_B0 doccomments@netapp.com Table of Contents 3 Contents Deciding
WhatsUp Gold v16.0 Wireless User Guide
 WhatsUp Gold v16.0 Wireless User Guide Contents Welcome to WhatsUp Gold Wireless Wireless Overview... 1 Wireless licensing and accessibility... 3 Using WhatsUp Gold Wireless Discovering wireless devices...
Service Manager. Ops Console On-Premise User Guide
 Service Manager powered by HEAT Ops Console On-Premise User Guide 2017.2.1 Copyright Notice This document contains the confidential information and/or proprietary property of Ivanti, Inc. and its affiliates
Getting Started with ehealth for Voice Cisco Unity & Unity Bridge
 Focus on Setup Getting Started with ehealth for Voice Cisco Unity & Unity Bridge What s Inside About ehealth for Voice Cisco Unity. An overview of the product components. Requirements. Prerequisites for
Installation Guide for Pulse on Windows Server 2012
 USER GUIDE MADCAP PULSE 4 Installation Guide for Pulse on Windows Server 2012 Copyright 2018 MadCap Software. All rights reserved. Information in this document is subject to change without notice. The
Configuring SharePoint 2007
 26636.book Page 77 Thursday, February 14, 2008 4:38 PM Chapter 3 Configuring SharePoint 2007 MICROSOFT EXAM OBJECTIVES COVERED IN THIS CHAPTER: Manage Administration Manage Central Admin UI Manage the
ForeScout Extended Module for Advanced Compliance
 ForeScout Extended Module for Advanced Compliance Version 1.2 Table of Contents About Advanced Compliance Integration... 4 Use Cases... 4 Additional Documentation... 6 About This Module... 6 About Support
Synchronization Agent Configuration Guide
 SafeNet Authentication Service Synchronization Agent Configuration Guide 1 Document Information Document Part Number 007-012848-001, Rev. B Release Date March 2015 Applicability This version of the SAS
Wavelink Avalanche Mobility Center Java Console User Guide. Version 5.2
 Wavelink Avalanche Mobility Center Java Console User Guide Version 5.2 Revised 27/09/2011 ii Copyright 2011 by Wavelink Corporation. All rights reserved. Wavelink Corporation 10808 South River Front Parkway,
StoragePoint Large File Support Guide
 L StoragePoint Large File Support Guide January 16, 2018 www.metalogix.com info@metalogix.com 202.609.9100 Copyright 2018 Copyright Metalogix International GmbH All rights reserved. No part or section
NTP Software VFM Administration Web Site
 NTP Software VFM Administration Web Site User Manual Version 7.1 This guide details the method for using NTP Software VFM Administration Web Site, from an administrator s perspective. Upon completion of
ForeScout Extended Module for Tenable Vulnerability Management
 ForeScout Extended Module for Tenable Vulnerability Management Version 2.7.1 Table of Contents About Tenable Vulnerability Management Module... 4 Compatible Tenable Vulnerability Products... 4 About Support
Managing the CaseMap Admin Console User Guide
 Managing the CaseMap Admin Console User Guide CaseMap Server, Version 2.3 Accessing the CaseMap Admin Console Registering CaseMap Servers Registering SQL Servers Setting Up Roles and Users Managing SQL
HP Database and Middleware Automation
 HP Database and Middleware Automation For Windows Software Version: 10.10 SQL Server Database Refresh User Guide Document Release Date: June 2013 Software Release Date: June 2013 Legal Notices Warranty
Wavelink Avalanche Site Edition Java Console User Guide. Version 5.3
 Wavelink Avalanche Site Edition Java Console User Guide Version 5.3 Revised 04/05/2012 ii Copyright 2012 by Wavelink Corporation. All rights reserved. Wavelink Corporation 10808 South River Front Parkway,
EMC SourceOne Management Pack for Microsoft System Center Operations Manager
 EMC SourceOne Management Pack for Microsoft System Center Operations Manager Version 7.2 Installation and User Guide 302-000-955 REV 01 Copyright 2005-2015. All rights reserved. Published in USA. Published
SAP BusinessObjects Live Office User Guide SAP BusinessObjects Business Intelligence platform 4.1 Support Package 2
 SAP BusinessObjects Live Office User Guide SAP BusinessObjects Business Intelligence platform 4.1 Support Package 2 Copyright 2013 SAP AG or an SAP affiliate company. All rights reserved. No part of this
RAP as a Service for Exchange Server: Prerequisites
 RAP as a Service for Exchange Server: Prerequisites This document explains the required steps to configure the RAP as a Service for Exchange Server. There are two scenarios available to configure the assessment.
Tyler Dashboard. User Guide Version 6.3. For more information, visit
 Tyler Dashboard User Guide Version 6.3 For more information, visit www.tylertech.com. TABLE OF CONTENTS Tyler Dashboard... 4 Tyler Dashboard Features... 4 Search... 5 Browse... 5 Page... 6 Dashboard...
VMware vrealize Operations for Horizon Installation
 VMware vrealize Operations for Horizon Installation vrealize Operations for Horizon 6.4 Installation vrealize Operations for Horizon 6.4 This document supports the version of each product listed and supports
Sage Construction Central Setup Guide (Version 18.1)
") Sage 300 Construction and Real Estate Sage Construction Central Setup Guide (Version 18.1) Certified course curriculum Important Notice The course materials provided are the product of Sage. Please do
Sage 300 Construction and Real Estate Sage Construction Central Setup Guide (Version 18.1) Certified course curriculum Important Notice The course materials provided are the product of Sage. Please do
Perceptive Matching Engine
 Perceptive Matching Engine Advanced Design and Setup Guide Version: 1.0.x Written by: Product Development, R&D Date: January 2018 2018 Hyland Software, Inc. and its affiliates. Table of Contents Overview...
Backup Tab. User Guide
 Backup Tab User Guide Contents 1. Introduction... 2 Documentation... 2 Licensing... 2 Overview... 2 2. Create a New Backup... 3 3. Manage backup jobs... 4 Using the Edit menu... 5 Overview... 5 Destination...
Coveo Platform 6.5. Microsoft SharePoint Connector Guide
 Coveo Platform 6.5 Microsoft SharePoint Connector Guide Notice The content in this document represents the current view of Coveo as of the date of publication. Because Coveo continually responds to changing
DocAve Content Shield v2.2 for SharePoint
 DocAve Content Shield v2.2 for SharePoint User Guide For SharePoint 2010 Revision A Issued August 2012 1 Table of Contents Table of Contents... 2 About DocAve Content Shield for SharePoint... 4 Complementary
Replicator Disaster Recovery Best Practices
 Replicator Disaster Recovery Best Practices VERSION 7.4.0 June 21, 2017 Scenario Guide Article 1120504-01 www.metalogix.com info@metalogix.com 202.609.9100 Copyright International GmbH, 2002-2017 All rights
VMware vrealize Operations for Horizon Installation. VMware vrealize Operations for Horizon 6.5
 VMware vrealize Operations for Horizon Installation VMware vrealize Operations for Horizon 6.5 You can find the most up-to-date technical documentation on the VMware website at: https://docs.vmware.com/
Prerequisites for Using Enterprise Manager with Your Primavera Applications
 Oracle Enterprise Manager For Oracle Construction and Engineering Configuration Guide for On Premises Version 18 August 2018 Contents Introduction... 5 Prerequisites for Using Enterprise Manager with
Cisco Unified Serviceability
 Cisco Unified Serviceability Introduction, page 1 Installation, page 5 Introduction This document uses the following abbreviations to identify administration differences for these Cisco products: Unified
Netwrix Auditor. Release Notes. Version: 9.6 6/15/2018
 Netwrix Auditor Release Notes Version: 9.6 6/15/2018 Legal Notice The information in this publication is furnished for information use only, and does not constitute a commitment from Netwrix Corporation
Netwrix Auditor for SQL Server
 Netwrix Auditor for SQL Server Quick-Start Guide Version: 9.5 10/25/2017 Legal Notice The information in this publication is furnished for information use only, and does not constitute a commitment from
271 Waverley Oaks Rd. Telephone: Suite 206 Waltham, MA USA
 Contacting Leostream Leostream Corporation http://www.leostream.com 271 Waverley Oaks Rd. Telephone: +1 781 890 2019 Suite 206 Waltham, MA 02452 USA To submit an enhancement request, email features@leostream.com.
Microsoft Dynamics GP Web Client Installation and Administration Guide For Service Pack 1
 Microsoft Dynamics GP 2013 Web Client Installation and Administration Guide For Service Pack 1 Copyright Copyright 2013 Microsoft. All rights reserved. Limitation of liability This document is provided
Enterprise Vault.cloud CloudLink Google Account Synchronization Guide. CloudLink to 4.0.3
 Enterprise Vault.cloud CloudLink Google Account Synchronization Guide CloudLink 4.0.1 to 4.0.3 Enterprise Vault.cloud: CloudLink Google Account Synchronization Guide Last updated: 2018-06-08. Legal Notice
User Guide. Version R92. English
 AuthAnvil User Guide Version R92 English October 9, 2015 Agreement The purchase and use of all Software and Services is subject to the Agreement as defined in Kaseya s Click-Accept EULATOS as updated from
User Guide. Version R94. English
 AuthAnvil User Guide Version R94 English March 8, 2017 Copyright Agreement The purchase and use of all Software and Services is subject to the Agreement as defined in Kaseya s Click-Accept EULATOS as updated
Viewing System Status, page 404. Backing Up and Restoring a Configuration, page 416. Managing Certificates for Authentication, page 418
 This chapter describes how to maintain the configuration and firmware, reboot or reset the security appliance, manage the security license and digital certificates, and configure other features to help
Colligo Manager for Outlook User Guide. User Guide
 Colligo Email Manager for Outlook User Guide User Guide Contents About This Guide... 5 Audience... 5 Requirements... 5 Terminology... 5 Colligo Technical Support... 5 Installation... 6 EXE Installation...
Storage Foundation and High Availability Solutions HA and Disaster Recovery Solutions Guide for Microsoft SharePoint 2013
 Storage Foundation and High Availability Solutions HA and Disaster Recovery Solutions Guide for Microsoft SharePoint 2013 Windows 7.1 April 2016 Storage Foundation and High Availability Solutions HA and
Backup Tab User Guide
 Backup Tab User Guide Contents 1. Introduction... 2 Documentation... 2 Licensing... 2 Overview... 2 2. Create a New Backup... 3 3. Manage backup jobs... 4 Using the Edit menu... 5 Overview... 5 Destination...
SPHOL3220: Overview of IT Professional Features in SharePoint Server 2013
 2013 SPHOL3220: Overview of IT Professional Features in SharePoint Server 2013 Hands-On Lab Lab Manual This document is provided as-is. Information and views expressed in this document, including URL and
NETWRIX ACTIVE DIRECTORY CHANGE REPORTER
 NETWRIX ACTIVE DIRECTORY CHANGE REPORTER ADMINISTRATOR S GUIDE Product Version: 7.2 January 2013. Legal Notice The information in this publication is furnished for information use only, and does not constitute
Getting started with System Center Essentials 2007
 At a glance: Installing and upgrading Configuring Essentials 2007 Troubleshooting steps Getting started with System Center Essentials 2007 David Mills System Center Essentials 2007 is a new IT management
WebSphere Application Server V7: Administration Consoles and Commands
 Chapter 5 of WebSphere Application Server V7 Administration and Configuration Guide, SG24-7615 WebSphere Application Server V7: Administration Consoles and Commands WebSphere application server properties
2012 Microsoft Corporation. All rights reserved. Microsoft, Active Directory, Excel, Lync, Outlook, SharePoint, Silverlight, SQL Server, Windows,
 2012 Microsoft Corporation. All rights reserved. Microsoft, Active Directory, Excel, Lync, Outlook, SharePoint, Silverlight, SQL Server, Windows, Windows Server, and other product names are or may be registered
Microsoft Active Directory Plug-in User s Guide Release
 [1]Oracle Enterprise Manager Microsoft Active Directory Plug-in User s Guide Release 13.1.0.1.0 E66401-01 December 2015 Oracle Enterprise Manager Microsoft Active Directory Plug-in User's Guide, Release
Monitoring SharePoint 2007/ 2010/ 2013 Server using EventTracker
 Monitoring SharePoint 2007/ 2010/ 2013 Server using EventTracker Publication Date: June 12, 2012 Abstract EventTracker allows you to effectively manage your systems and provides operational efficiencies
Coveo Platform 7.0. Microsoft SharePoint Legacy Connector Guide
 Coveo Platform 7.0 Microsoft SharePoint Legacy Connector Guide Notice The content in this document represents the current view of Coveo as of the date of publication. Because Coveo continually responds
What's Different in Backup Exec 2012
 What's Different in Backup Exec 2012 What's different in Backup Exec 2012 This document includes the following topics: Changes to the user interface for Backup Exec 2012 Changes to terminology for Backup
User Guide. BlackBerry Workspaces for Windows. Version 5.5
 User Guide BlackBerry Workspaces for Windows Version 5.5 Published: 2017-03-30 SWD-20170330110027321 Contents Introducing BlackBerry Workspaces for Windows... 6 Getting Started... 7 Setting up and installing
Agent and Agent Browser. Updated Friday, January 26, Autotask Corporation
 Agent and Agent Browser Updated Friday, January 26, 2018 2018 Autotask Corporation Table of Contents Table of Contents 2 The AEM Agent and Agent Browser 3 AEM Agent 5 Privacy Mode 9 Agent Browser 11 Agent
Connection Broker Advanced Connections Management for Multi-Cloud Environments
 Connection Broker Advanced Connections Management for Multi-Cloud Environments Using Leostream with the VMware Horizon View Direct- Connection Plug-in Version 8.2 December 2017 Contacting Leostream Leostream
Aquaforest CheckPoint Reference Guide
 Aquaforest CheckPoint Reference Guide Version 1.01 April 2015 Copyright 2005-2015 Aquaforest Limited http://www.aquaforest.com/ Contents 1 Product Overview... 3 2 Installation and Licensing... 4 2.1 Installation...
StoragePoint Quick Start Guide
 Q StoragePoint Quick Start Guide January 16, 2018 www.metalogix.com info@metalogix.com 202.609.9100 Copyright 2018 Copyright Metalogix International GmbH All rights reserved. No part or section of the
VMware Identity Manager Administration
 VMware Identity Manager Administration VMware Identity Manager 2.4 This document supports the version of each product listed and supports all subsequent versions until the document is replaced by a new
PASSPORTAL PLUGIN DOCUMENTATION
 Contents Requirements... 2 Install or Update Passportal Plugin Solution Center... 3 Configuring Passportal Plugin... 5 Client mapping... 6 User Class Configuration... 7 About the Screens... 8 Passportal
ForeScout Extended Module for MobileIron
 Version 1.8 Table of Contents About MobileIron Integration... 4 Additional MobileIron Documentation... 4 About this Module... 4 How it Works... 5 Continuous Query Refresh... 5 Offsite Device Management...
Replicator. Installing and Configuring Replicator With Least Privilege P. March 09,
 Replicator Installing and Configuring Replicator With Least Privilege P March 09, 2018 www.metalogix.com info@metalogix.com 202.609.9100 Copyright International GmbH, 2002-2018 All rights reserved. No
ForeScout Extended Module for Qualys VM
 ForeScout Extended Module for Qualys VM Version 1.2.1 Table of Contents About the Qualys VM Integration... 3 Additional Qualys VM Documentation... 3 About This Module... 3 Components... 4 Considerations...
CDP Data Center Console User Guide CDP Data Center Console User Guide Version
 CDP Data Center Console User Guide CDP Data Center Console User Guide Version 3.18.2 1 README FIRST Welcome to the R1Soft CDP Data Center Console User Guide The purpose of this manual is to provide you