Frequency distribution
|
|
|
- Nickolas Rose
- 5 years ago
- Views:
Transcription
1 Frequency distribution In order to describe situations, draw conclusions, or make inferences about events, the researcher must organize the data in some meaningful way. The most convenient method of organizing data is to construct a frequency distribution. A frequency distribution is the organizing of raw data in table form, using classes and frequencies. There are three basic types of frequency distributions, and there are specific procedures for constructing each type. The three types are categorical, ungrouped, and grouped frequency distributions. 1- Categorical frequency distribution: - The categorical frequency distribution is used for data that can be placed in specific categories, such as nominal- or ordinal-level data. For example, data such as political affiliation, religious affiliation, or major field of study would use categorical frequency distributions. Example -1- Twenty-five army inductees were given a blood test to determine their blood type. The data set is as follows: A B B AB O O O B AB B B B O A O A O O O AB AB A O B A Construct a frequency distribution for the data. Solution Since the data are categorical, discrete classes can be used. There are four blood types: A, B, O, and AB. These types will be used as the classes for the distribution. The procedure for constructing a frequency distribution for categorical data is given next. STEP 1: Make a table as shown. A B C D Class Tally Frequency Percent A B O AB STEP 2: Tally the data and place the results in column B. STEP 3: Count the tallies and place the results in column C. STEP 4: Find the percentage of values in each class by using the formula 1
.")


2 For example, in the class of type A blood, the percentage is STEP 5: Find the totals for columns C and D (see the completed table that follows). 2- Ungrouped frequency distribution: - When the data are numerical instead of categorical, the procedure for constructing a frequency distribution is somewhat more complicated. Example -2- A psychologist administered a test of manual dexterity to 25 third-grade students. The times, in minutes, required to complete the test are given below. Construct a frequency distribution for the data. Solution


3 Construct boundaries for each class by subtracting 0.5 from each class value and adding 0.5 to each class value, as shown next. Add a cumulative frequency (cf) to the frequency distribution shown above by adding the frequency in each class to the total of the frequencies of the classes above that class, as shown next: Cumulative frequencies are used to show how many values are accumulated up to and including a specific class. For example, 18 students successfully completed the test in 8 minutes or less; 24 students completed the test in 10 minutes or less. 3


4 3- Grouped frequency distribution: - When the range of the data is large, the data must be grouped into classes that are more than one unit in width. For example, a distribution of the number of hour s boat batteries lasted is as follows: In this distribution, the values 24 and 30 of the first class are called class limits. The lower class limit is 24; it represents the smallest data value that can be included in the class. The upper class limit is 30; it represents the largest data value that can be included in the class. The numbers in the second column are called class boundaries. These numbers are used to separate the classes so that there are no gaps in the frequency distribution. The gaps are due to the limits; for example, there is a gap between 30 and 31. Finally, the class width for a class in a frequency distribution is found by subtracting lower (or upper) class limit of one class minus the lower (or upper) class limit of the previous class. For example, the class width in the preceding distribution is 7, found by subtracting = 7. The researcher must decide how many classes to use and the width of each class. To construct a frequency distribution, follow these rules. 1- There should be between 5 and 20 classes. A student would not be in error for having less than 5 classes or more than 20 classes; however, statisticians generally agree on these numbers. 2- The class width should be an odd number. This ensures that the midpoint of each class has the same place value as the data. The class midpoint X is obtained by adding the lower and upper boundaries and dividing by 2, or adding the lower and upper limits and dividing by 2: 4


5 For example, the midpoint of the first class is The midpoint is the numerical location of the center of the class. Midpoints are necessary for graphing and are used in computing the mean and standard deviation. 3- The classes must be mutually exclusive. Mutually exclusive classes have nonoverlapping class limits so that data cannot be placed into two classes. Many times, frequency distributions such as 4- The classes must be continuous. Even if there are no values in a class, the class must be included in the frequency distribution. There should be no gaps in a frequency distribution. The only exception occurs when the class with a zero frequency is the first or last class. A class with a zero frequency at either end can be omitted without affecting the distribution. 5- The classes must be exhaustive. There should be enough classes to accommodate all the data. 6- The classes must be equal in width. This avoids a distorted view of the data. One exception occurs when a distribution is open-ended i.e., it has no specific beginning value or no specific ending value. Following are the class limits for two open-ended distributions. 5


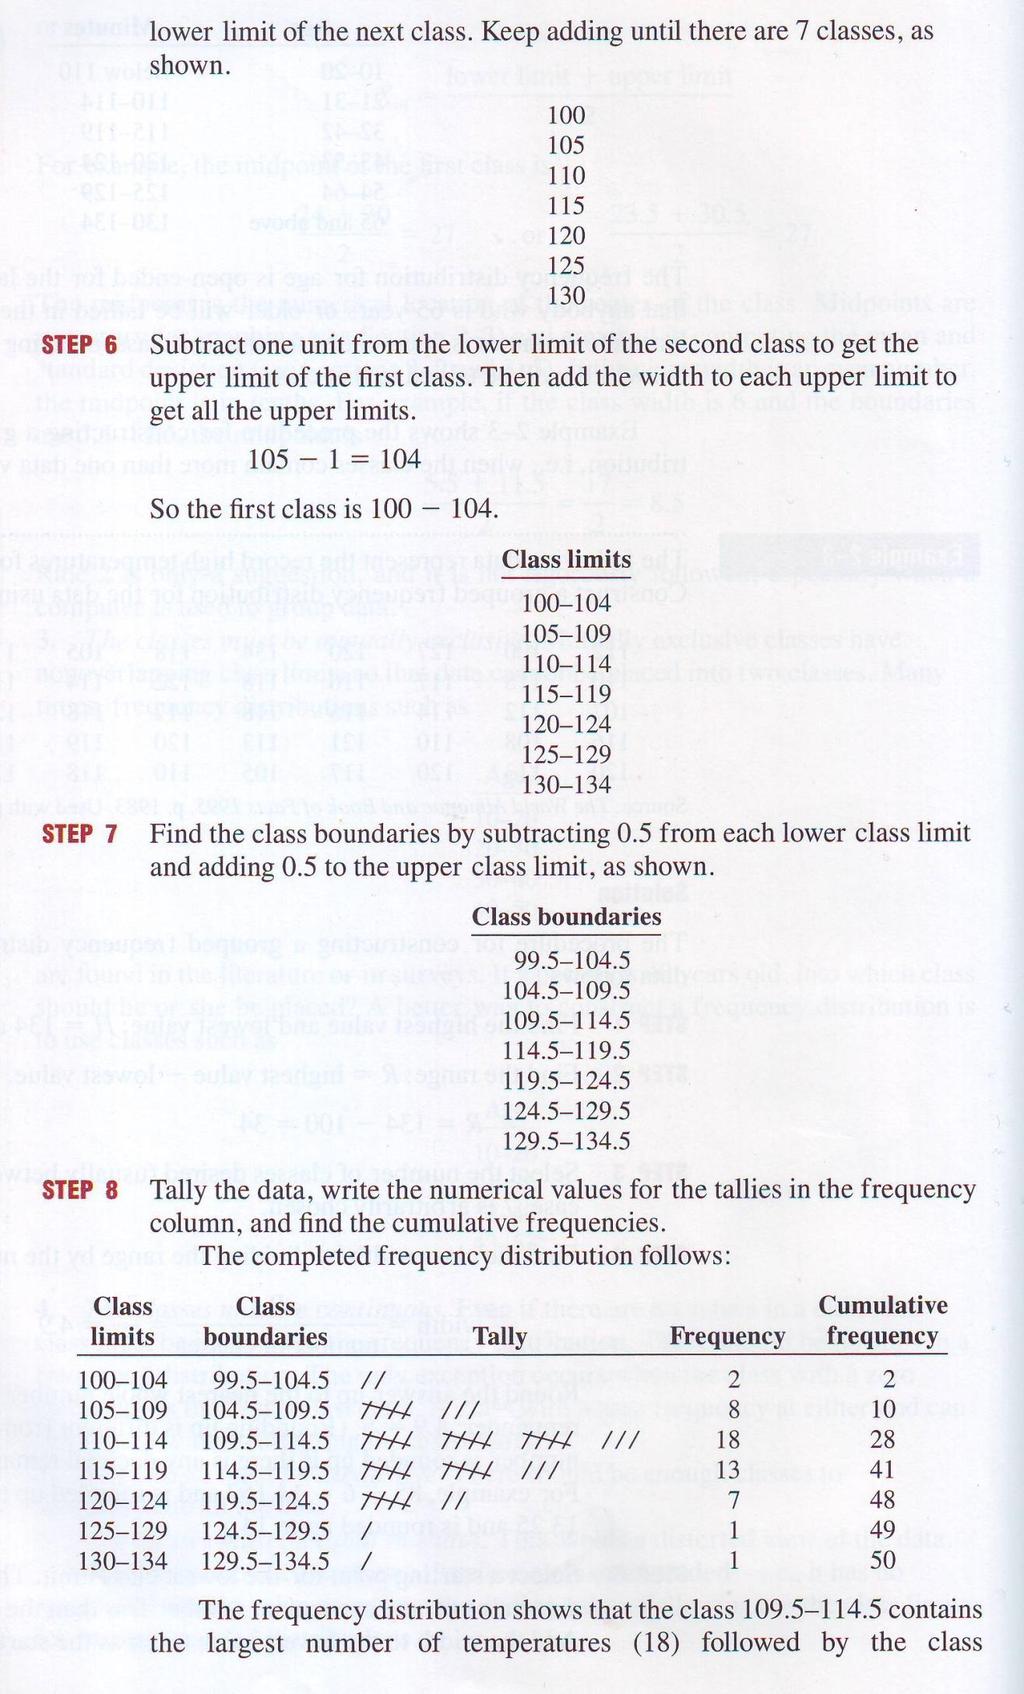
6 The frequency distribution for age is open-ended for the last class, which means that anybody who is 65 years or older will be tallied in the last class. The distribution for minutes is open-ended for the first class, meaning that any minute values below 110 will be tallied in that class. Example -3- The following data represent the record high temperatures for each of the 50 states. Construct a grouped frequency distribution for the data using 7 classes. Solution 6
7 7


8 with 13 temperatures. Hence, most of the temperatures (31) fall between and The procedure for constructing a grouped frequency distribution is summarized in Procedure Table below: The reasons for constructing a frequency distribution follow: 1- To organize the data in a meaningful, intelligible way. 2- To enable the reader to determine the nature or shape of the distribution. 3- To facilitate computational procedures for measures of average and spread. 4- To enable the researcher to draw charts and graphs for the presentation of data. 5- To enable the reader to make comparisons among different data sets. Exercises 1- Find class boundaries, midpoints, and widths for each class? a) 11-15, b) 17-39, c) , d) , e) The following zip codes were obtained from the respondents to a mail survey. Construct a frequency distribution for the data? 8


9 3- At a college financial aid office, students who applied for a scholarship were classified according to their class rank: Fr = freshman, So = sophomore, Jr = Junior, Se = senior. Construct a frequency distribution for the data? 3- The numbers of games won by the pitchers who were inducted into the Baseball Hall of Fame through 1992 are shown below. Construct a frequency distribution for the data using 12 classes? 9
Organizing Data. Class limits (in miles) Tally Frequency Total 50
 Tally Frequency Total 50") 2 2 Organizing Data Objective 1. Organize data using frequency distributions. Suppose a researcher wished to do a study on the number of miles the employees of a large department store traveled to work
2 2 Organizing Data Objective 1. Organize data using frequency distributions. Suppose a researcher wished to do a study on the number of miles the employees of a large department store traveled to work
Spell out your full name (first, middle and last)
") Spell out your full name (first, middle and last) Be ready to share the following counts: Number of letters in your full name. Number of vowels Number of consonants Section 2-1 Organizing Data After completing
Spell out your full name (first, middle and last) Be ready to share the following counts: Number of letters in your full name. Number of vowels Number of consonants Section 2-1 Organizing Data After completing
CHAPTER 2. Objectives. Frequency Distributions and Graphs. Basic Vocabulary. Introduction. Organise data using frequency distributions.
 CHAPTER 2 Objectives Organise data using frequency distributions. Distributions and Graphs Represent data in frequency distributions graphically using histograms, frequency polygons, and ogives. Represent
Courtesy :
 STATISTICS The Nature of Statistics Introduction Statistics is the science of data Statistics is the science of conducting studies to collect, organize, summarize, analyze, and draw conclusions from data.
This chapter will show how to organize data and then construct appropriate graphs to represent the data in a concise, easy-to-understand form.
 CHAPTER 2 Frequency Distributions and Graphs Objectives Organize data using frequency distributions. Represent data in frequency distributions graphically using histograms, frequency polygons, and ogives.
Frequency Distributions and Graphs
 //05 C H A P T E R T W O s and s and Outline CHAPTER - Organizing Data - Histograms, Polygons, and - Other Types of -4 Paired Data and Scatter Plots Learning Objectives Organize data using a frequency
Chapter 2. Frequency Distributions and Graphs. Bluman, Chapter 2
 Chapter 2 Frequency Distributions and Graphs 1 Chapter 2 Overview Introduction 2-1 Organizing Data 2-2 Histograms, Frequency Polygons, and Ogives 2-3 Other Types of Graphs 2 Chapter 2 Objectives 1. Organize
BUSINESS DECISION MAKING. Topic 1 Introduction to Statistical Thinking and Business Decision Making Process; Data Collection and Presentation
 BUSINESS DECISION MAKING Topic 1 Introduction to Statistical Thinking and Business Decision Making Process; Data Collection and Presentation (Chap 1 The Nature of Probability and Statistics) (Chap 2 Frequency
2.1: Frequency Distributions
 2.1: Frequency Distributions Frequency Distribution: organization of data into groups called. A: Categorical Frequency Distribution used for and level qualitative data that can be put into categories.
MATH 117 Statistical Methods for Management I Chapter Two
 Jubail University College MATH 117 Statistical Methods for Management I Chapter Two There are a wide variety of ways to summarize, organize, and present data: I. Tables 1. Distribution Table (Categorical
Chapter 2 - Frequency Distributions and Graphs
 1. Which of the following does not need to be done when constructing a frequency distribution? A) select the number of classes desired B) find the range C) make the class width an even number D) use classes
Downloaded from
 UNIT 2 WHAT IS STATISTICS? Researchers deal with a large amount of data and have to draw dependable conclusions on the basis of data collected for the purpose. Statistics help the researchers in making
Elementary Statistics. Organizing Raw Data
 Organizing Raw Data What is a Raw Data? Raw Data (sometimes called source data) is data that has not been processed for meaningful use. What is a Frequency Distribution Table? A Frequency Distribution
Basic Statistical Terms and Definitions
 I. Basics Basic Statistical Terms and Definitions Statistics is a collection of methods for planning experiments, and obtaining data. The data is then organized and summarized so that professionals can
Test Bank for Privitera, Statistics for the Behavioral Sciences
 1. A simple frequency distribution A) can be used to summarize grouped data B) can be used to summarize ungrouped data C) summarizes the frequency of scores in a given category or range 2. To determine
Frequency Distributions
 Displaying Data Frequency Distributions After collecting data, the first task for a researcher is to organize and summarize the data so that it is possible to get a general overview of the results. Remember,
Elementary Statistics
 1 Elementary Statistics Introduction Statistics is the collection of methods for planning experiments, obtaining data, and then organizing, summarizing, presenting, analyzing, interpreting, and drawing
Part I, Chapters 4 & 5. Data Tables and Data Analysis Statistics and Figures
 Part I, Chapters 4 & 5 Data Tables and Data Analysis Statistics and Figures Descriptive Statistics 1 Are data points clumped? (order variable / exp. variable) Concentrated around one value? Concentrated
Measures of Dispersion
 Lesson 7.6 Objectives Find the variance of a set of data. Calculate standard deviation for a set of data. Read data from a normal curve. Estimate the area under a curve. Variance Measures of Dispersion
+ Statistical Methods in
 + Statistical Methods in Practice STA/MTH 3379 + Dr. A. B. W. Manage Associate Professor of Statistics Department of Mathematics & Statistics Sam Houston State University Discovering Statistics 2nd Edition
At the end of the chapter, you will learn to: Present data in textual form. Construct different types of table and graphs
 DATA PRESENTATION At the end of the chapter, you will learn to: Present data in textual form Construct different types of table and graphs Identify the characteristics of a good table and graph Identify
Data Statistics Population. Census Sample Correlation... Statistical & Practical Significance. Qualitative Data Discrete Data Continuous Data
 Data Statistics Population Census Sample Correlation... Voluntary Response Sample Statistical & Practical Significance Quantitative Data Qualitative Data Discrete Data Continuous Data Fewer vs Less Ratio
Chapter 2. Frequency distribution. Summarizing and Graphing Data
 Frequency distribution Chapter 2 Summarizing and Graphing Data Shows how data are partitioned among several categories (or classes) by listing the categories along with the number (frequency) of data values
Data can be in the form of numbers, words, measurements, observations or even just descriptions of things.
 + What is Data? Data is a collection of facts. Data can be in the form of numbers, words, measurements, observations or even just descriptions of things. In most cases, data needs to be interpreted and
NOTES TO CONSIDER BEFORE ATTEMPTING EX 1A TYPES OF DATA
 NOTES TO CONSIDER BEFORE ATTEMPTING EX 1A TYPES OF DATA Statistics is concerned with scientific methods of collecting, recording, organising, summarising, presenting and analysing data from which future
Measures of Central Tendency
 Page of 6 Measures of Central Tendency A measure of central tendency is a value used to represent the typical or average value in a data set. The Mean The sum of all data values divided by the number of
1.2. Pictorial and Tabular Methods in Descriptive Statistics
 1.2. Pictorial and Tabular Methods in Descriptive Statistics Section Objectives. 1. Stem-and-Leaf displays. 2. Dotplots. 3. Histogram. Types of histogram shapes. Common notation. Sample size n : the number
Raw Data is data before it has been arranged in a useful manner or analyzed using statistical techniques.
 Section 2.1 - Introduction Graphs are commonly used to organize, summarize, and analyze collections of data. Using a graph to visually present a data set makes it easy to comprehend and to describe the
Section 2-2 Frequency Distributions. Copyright 2010, 2007, 2004 Pearson Education, Inc
 Section 2-2 Frequency Distributions Copyright 2010, 2007, 2004 Pearson Education, Inc. 2.1-1 Frequency Distribution Frequency Distribution (or Frequency Table) It shows how a data set is partitioned among
MAT 142 College Mathematics. Module ST. Statistics. Terri Miller revised July 14, 2015
 MAT 142 College Mathematics Statistics Module ST Terri Miller revised July 14, 2015 2 Statistics Data Organization and Visualization Basic Terms. A population is the set of all objects under study, a sample
Measures of Central Tendency. A measure of central tendency is a value used to represent the typical or average value in a data set.
 Measures of Central Tendency A measure of central tendency is a value used to represent the typical or average value in a data set. The Mean the sum of all data values divided by the number of values in
Describing Data: Frequency Tables, Frequency Distributions, and Graphic Presentation
 Describing Data: Frequency Tables, Frequency Distributions, and Graphic Presentation Chapter 2 McGraw-Hill/Irwin Copyright 2010 by The McGraw-Hill Companies, Inc. All rights reserved. GOALS 1. Organize
Raw Data. Statistics 1/8/2016. Relative Frequency Distribution. Frequency Distributions for Qualitative Data
 Statistics Raw Data Raw data is random and unranked data. Organizing Data Frequency distributions list all the categories and the numbers of elements that belong to each category Frequency Distributions
Chapter 2 Organizing and Graphing Data. 2.1 Organizing and Graphing Qualitative Data
 Chapter 2 Organizing and Graphing Data 2.1 Organizing and Graphing Qualitative Data 2.2 Organizing and Graphing Quantitative Data 2.3 Stem-and-leaf Displays 2.4 Dotplots 2.1 Organizing and Graphing Qualitative
JUST THE MATHS UNIT NUMBER STATISTICS 1 (The presentation of data) A.J.Hobson
 A.J.Hobson") JUST THE MATHS UNIT NUMBER 18.1 STATISTICS 1 (The presentation of data) by A.J.Hobson 18.1.1 Introduction 18.1.2 The tabulation of data 18.1.3 The graphical representation of data 18.1.4 Exercises 18.1.5
JUST THE MATHS UNIT NUMBER 18.1 STATISTICS 1 (The presentation of data) by A.J.Hobson 18.1.1 Introduction 18.1.2 The tabulation of data 18.1.3 The graphical representation of data 18.1.4 Exercises 18.1.5
MAT 155. Chapter 1 Introduction to Statistics. sample. population. parameter. statistic
 MAT 155 Dr. Claude Moore Cape Fear Community College Chapter 1 Introduction to Statistics 1 1Review and Preview 1 2Statistical Thinking 1 3Types of Data 1 4Critical Thinking 1 5Collecting Sample Data Key
Unit I Supplement OpenIntro Statistics 3rd ed., Ch. 1
 Unit I Supplement OpenIntro Statistics 3rd ed., Ch. 1 KEY SKILLS: Organize a data set into a frequency distribution. Construct a histogram to summarize a data set. Compute the percentile for a particular
B. Graphing Representation of Data
 B Graphing Representation of Data The second way of displaying data is by use of graphs Although such visual aids are even easier to read than tables, they often do not give the same detail It is essential
Chapter 2. Descriptive Statistics: Organizing, Displaying and Summarizing Data
 Chapter 2 Descriptive Statistics: Organizing, Displaying and Summarizing Data Objectives Student should be able to Organize data Tabulate data into frequency/relative frequency tables Display data graphically
Graphical Presentation for Statistical Data (Relevant to AAT Examination Paper 4: Business Economics and Financial Mathematics) Introduction
 Introduction") Graphical Presentation for Statistical Data (Relevant to AAT Examination Paper 4: Business Economics and Financial Mathematics) Y O Lam, SCOPE, City University of Hong Kong Introduction The most convenient
Graphical Presentation for Statistical Data (Relevant to AAT Examination Paper 4: Business Economics and Financial Mathematics) Y O Lam, SCOPE, City University of Hong Kong Introduction The most convenient
Chapter 1 Introduction to Statistics
 Corresponds to ELEMENTARY STATISTICS USING THE TI 83/84 PLUS CALCULATOR 3rd ed. Lecture Slides Elementary Statistics Eleventh Edition and the Triola Statistics Series by Mario F. Triola Chapter 1 Introduction
Chapter 2 - Graphical Summaries of Data
 Chapter 2 - Graphical Summaries of Data Data recorded in the sequence in which they are collected and before they are processed or ranked are called raw data. Raw data is often difficult to make sense
Things you ll know (or know better to watch out for!) when you leave in December: 1. What you can and cannot infer from graphs.
 when you leave in December: 1. What you can and cannot infer from graphs.") 1 2 Things you ll know (or know better to watch out for!) when you leave in December: 1. What you can and cannot infer from graphs. 2. How to construct (in your head!) and interpret confidence intervals.
1 2 Things you ll know (or know better to watch out for!) when you leave in December: 1. What you can and cannot infer from graphs. 2. How to construct (in your head!) and interpret confidence intervals.
Frequency, proportional, and percentage distributions.
 1 Social Studies 201 September 13-15, 2004 Presenting data and stem-and-leaf display See text, chapter 4, pp. 87-160. Introduction Statistical analysis primarily deals with issues where it is possible
Overview. Frequency Distributions. Chapter 2 Summarizing & Graphing Data. Descriptive Statistics. Inferential Statistics. Frequency Distribution
 Chapter 2 Summarizing & Graphing Data Slide 1 Overview Descriptive Statistics Slide 2 A) Overview B) Frequency Distributions C) Visualizing Data summarize or describe the important characteristics of a
https://testbankreal.com/download/business-statistics-10th-edition-groebnertest-bank/ Business Statistics 10th Edition Groebner SOLUTIONS MANUAL
 Business Statistics 10th Edition Groebner TEST BANK Business Statistics 10th Edition Groebner SOLUTIONS MANUAL Full download at: Full download at: https://testbankreal.com/download/business-statistics-10th-edition-groebnertest-bank/
UNIT 1A EXPLORING UNIVARIATE DATA
 A.P. STATISTICS E. Villarreal Lincoln HS Math Department UNIT 1A EXPLORING UNIVARIATE DATA LESSON 1: TYPES OF DATA Here is a list of important terms that we must understand as we begin our study of statistics
Applied Statistics for the Behavioral Sciences
 Applied Statistics for the Behavioral Sciences Chapter 2 Frequency Distributions and Graphs Chapter 2 Outline Organization of Data Simple Frequency Distributions Grouped Frequency Distributions Graphs
CHAPTER 2: SAMPLING AND DATA
 CHAPTER 2: SAMPLING AND DATA This presentation is based on material and graphs from Open Stax and is copyrighted by Open Stax and Georgia Highlands College. OUTLINE 2.1 Stem-and-Leaf Graphs (Stemplots),
Lecture Slides. Elementary Statistics Twelfth Edition. by Mario F. Triola. and the Triola Statistics Series. Section 2.1- #
 Lecture Slides Elementary Statistics Twelfth Edition and the Triola Statistics Series by Mario F. Triola Chapter 2 Summarizing and Graphing Data 2-1 Review and Preview 2-2 Frequency Distributions 2-3 Histograms
Chapter 2: Understanding Data Distributions with Tables and Graphs
 Test Bank Chapter 2: Understanding Data with Tables and Graphs Multiple Choice 1. Which of the following would best depict nominal level data? a. pie chart b. line graph c. histogram d. polygon Ans: A
SOST 201 September 20, Stem-and-leaf display 2. Miscellaneous issues class limits, rounding, and interval width.
 1 Social Studies 201 September 20, 2006 Presenting data and stem-and-leaf display See text, chapter 4, pp. 87-160. Introduction Statistical analysis primarily deals with issues where it is possible to
The basic arrangement of numeric data is called an ARRAY. Array is the derived data from fundamental data Example :- To store marks of 50 student
 Organizing data Learning Outcome 1. make an array 2. divide the array into class intervals 3. describe the characteristics of a table 4. construct a frequency distribution table 5. constructing a composite
Chapter 6: DESCRIPTIVE STATISTICS
 Chapter 6: DESCRIPTIVE STATISTICS Random Sampling Numerical Summaries Stem-n-Leaf plots Histograms, and Box plots Time Sequence Plots Normal Probability Plots Sections 6-1 to 6-5, and 6-7 Random Sampling
ORGANIZING THE DATA IN A FREQUENCY TABLE
 ORGANIZING THE DATA IN A FREQUENCY TABLE Suppose the scores obtained by 5 students on a standardized test are as follows: 68, 55, 61, 55, 43, 59, 55, 58, 77, 6, 56, 53, 58, 7, 57, 62, 5, 69, 44, 63, 48,79,
Univariate Statistics Summary
 Further Maths Univariate Statistics Summary Types of Data Data can be classified as categorical or numerical. Categorical data are observations or records that are arranged according to category. For example:
Math 120 Introduction to Statistics Mr. Toner s Lecture Notes 3.1 Measures of Central Tendency
 Math 1 Introduction to Statistics Mr. Toner s Lecture Notes 3.1 Measures of Central Tendency lowest value + highest value midrange The word average: is very ambiguous and can actually refer to the mean,
Chapter 2 Describing, Exploring, and Comparing Data
 Slide 1 Chapter 2 Describing, Exploring, and Comparing Data Slide 2 2-1 Overview 2-2 Frequency Distributions 2-3 Visualizing Data 2-4 Measures of Center 2-5 Measures of Variation 2-6 Measures of Relative
Table of Contents (As covered from textbook)
") Table of Contents (As covered from textbook) Ch 1 Data and Decisions Ch 2 Displaying and Describing Categorical Data Ch 3 Displaying and Describing Quantitative Data Ch 4 Correlation and Linear Regression
Table of Contents (As covered from textbook) Ch 1 Data and Decisions Ch 2 Displaying and Describing Categorical Data Ch 3 Displaying and Describing Quantitative Data Ch 4 Correlation and Linear Regression
Data analysis using Microsoft Excel
 Introduction to Statistics Statistics may be defined as the science of collection, organization presentation analysis and interpretation of numerical data from the logical analysis. 1.Collection of Data
Research Data Analysis using SPSS. By Dr.Anura Karunarathne Senior Lecturer, Department of Accountancy University of Kelaniya
 Research Data Analysis using SPSS By Dr.Anura Karunarathne Senior Lecturer, Department of Accountancy University of Kelaniya MBA 61013- Business Statistics and Research Methodology Learning outcomes At
Descriptive Statistics
 Chapter 2 Descriptive Statistics 2.1 Descriptive Statistics 1 2.1.1 Student Learning Objectives By the end of this chapter, the student should be able to: Display data graphically and interpret graphs:
MATH 1070 Introductory Statistics Lecture notes Descriptive Statistics and Graphical Representation
 MATH 1070 Introductory Statistics Lecture notes Descriptive Statistics and Graphical Representation Objectives: 1. Learn the meaning of descriptive versus inferential statistics 2. Identify bar graphs,
2.1 Objectives. Math Chapter 2. Chapter 2. Variable. Categorical Variable EXPLORING DATA WITH GRAPHS AND NUMERICAL SUMMARIES
 EXPLORING DATA WITH GRAPHS AND NUMERICAL SUMMARIES Chapter 2 2.1 Objectives 2.1 What Are the Types of Data? www.managementscientist.org 1. Know the definitions of a. Variable b. Categorical versus quantitative
12 Statistics. Exercise Set 12-1
 1 Statistics Exercise Set 1-1 1. Measurements or observations that are gathered for an event under study are called data.. The branch of mathematics that involves collecting, organizing, summarizing, and
Distributions of Continuous Data
 C H A P T ER Distributions of Continuous Data New cars and trucks sold in the United States average about 28 highway miles per gallon (mpg) in 2010, up from about 24 mpg in 2004. Some of the improvement
Statistics. MAT 142 College Mathematics. Module ST. Terri Miller revised December 13, Population, Sample, and Data Basic Terms.
 MAT 142 College Mathematics Statistics Module ST Terri Miller revised December 13, 2010 1.1. Basic Terms. 1. Population, Sample, and Data A population is the set of all objects under study, a sample is
Chapter 2: Frequency Distributions
 Chapter 2: Frequency Distributions Chapter Outline 2.1 Introduction to Frequency Distributions 2.2 Frequency Distribution Tables Obtaining ΣX from a Frequency Distribution Table Proportions and Percentages
Prepare a stem-and-leaf graph for the following data. In your final display, you should arrange the leaves for each stem in increasing order.
 Chapter 2 2.1 Descriptive Statistics A stem-and-leaf graph, also called a stemplot, allows for a nice overview of quantitative data without losing information on individual observations. It can be a good
AND NUMERICAL SUMMARIES. Chapter 2
 EXPLORING DATA WITH GRAPHS AND NUMERICAL SUMMARIES Chapter 2 2.1 What Are the Types of Data? 2.1 Objectives www.managementscientist.org 1. Know the definitions of a. Variable b. Categorical versus quantitative
Chapter 3 Analyzing Normal Quantitative Data
 Chapter 3 Analyzing Normal Quantitative Data Introduction: In chapters 1 and 2, we focused on analyzing categorical data and exploring relationships between categorical data sets. We will now be doing
- 1 - Class Intervals
 - 1 - Class Intervals To work with continuous numeric data and to represent it in some sort of a graph or a chart, you have to separate the data into class intervals that is, intervals of equal length.
courtesy 1
 1 The Normal Distribution 2 Topic Overview Introduction Normal Distributions Applications of the Normal Distribution The Central Limit Theorem 3 Objectives 1. Identify the properties of a normal distribution.
Slide Copyright 2005 Pearson Education, Inc. SEVENTH EDITION and EXPANDED SEVENTH EDITION. Chapter 13. Statistics Sampling Techniques
 SEVENTH EDITION and EXPANDED SEVENTH EDITION Slide - Chapter Statistics. Sampling Techniques Statistics Statistics is the art and science of gathering, analyzing, and making inferences from numerical information
Lecture 1: Exploratory data analysis
 Lecture 1: Exploratory data analysis Statistics 101 Mine Çetinkaya-Rundel January 17, 2012 Announcements Announcements Any questions about the syllabus? If you sent me your gmail address your RStudio account
Descriptive Statistics
 Descriptive Statistics Library, Teaching & Learning 014 Summary of Basic data Analysis DATA Qualitative Quantitative Counted Measured Discrete Continuous 3 Main Measures of Interest Central Tendency Dispersion
Round each observation to the nearest tenth of a cent and draw a stem and leaf plot.
 Warm Up Round each observation to the nearest tenth of a cent and draw a stem and leaf plot. 1. Constructing Frequency Polygons 2. Create Cumulative Frequency and Cumulative Relative Frequency Tables 3.
Name Date Types of Graphs and Creating Graphs Notes
 Name Date Types of Graphs and Creating Graphs Notes Graphs are helpful visual representations of data. Different graphs display data in different ways. Some graphs show individual data, but many do not.
Flow of Control Branching 2. Cheng, Wei COMP May 19, Title
 Flow of Control Branching 2 Cheng, Wei COMP110-001 May 19, 2014 Title Review of Previous Lecture If else Q1: Write a small program that Reads an integer from user Prints Even if the integer is even Otherwise,
Data Analysis and Solver Plugins for KSpread USER S MANUAL. Tomasz Maliszewski
 Data Analysis and Solver Plugins for KSpread USER S MANUAL Tomasz Maliszewski tmaliszewski@wp.pl Table of Content CHAPTER 1: INTRODUCTION... 3 1.1. ABOUT DATA ANALYSIS PLUGIN... 3 1.3. ABOUT SOLVER PLUGIN...
LESSON 3: CENTRAL TENDENCY
 LESSON 3: CENTRAL TENDENCY Outline Arithmetic mean, median and mode Ungrouped data Grouped data Percentiles, fractiles, and quartiles Ungrouped data Grouped data 1 MEAN Mean is defined as follows: Sum
Averages and Variation
 Averages and Variation 3 Copyright Cengage Learning. All rights reserved. 3.1-1 Section 3.1 Measures of Central Tendency: Mode, Median, and Mean Copyright Cengage Learning. All rights reserved. 3.1-2 Focus
STP 226 ELEMENTARY STATISTICS NOTES
 ELEMENTARY STATISTICS NOTES PART 2 - DESCRIPTIVE STATISTICS CHAPTER 2 ORGANIZING DATA Descriptive Statistics - include methods for organizing and summarizing information clearly and effectively. - classify
Chpt 3. Data Description. 3-2 Measures of Central Tendency /40
 Chpt 3 Data Description 3-2 Measures of Central Tendency 1 /40 Chpt 3 Homework 3-2 Read pages 96-109 p109 Applying the Concepts p110 1, 8, 11, 15, 27, 33 2 /40 Chpt 3 3.2 Objectives l Summarize data using
Chapter Two: Descriptive Methods 1/50
 Chapter Two: Descriptive Methods 1/50 2.1 Introduction 2/50 2.1 Introduction We previously said that descriptive statistics is made up of various techniques used to summarize the information contained
UNIT 15 GRAPHICAL PRESENTATION OF DATA-I
 UNIT 15 GRAPHICAL PRESENTATION OF DATA-I Graphical Presentation of Data-I Structure 15.1 Introduction Objectives 15.2 Graphical Presentation 15.3 Types of Graphs Histogram Frequency Polygon Frequency Curve
Organizing and Summarizing Data
 1 Organizing and Summarizing Data Key Definitions Frequency Distribution: This lists each category of data and how often they occur. : The percent of observations within the one of the categories. This
Chapter 5snow year.notebook March 15, 2018
 Chapter 5: Statistical Reasoning Section 5.1 Exploring Data Measures of central tendency (Mean, Median and Mode) attempt to describe a set of data by identifying the central position within a set of data
TIPS4Math Grade 5 Collect, Organize and Interpret Numerical Data
 Collect, Organize and Interpret Numerical Data Overall Expectations Students will: Collect and organize discrete or continuous primary data and secondary data and display the data using charts and graphs,
TIPS4Math Grades 4 to 6 Overview Grade 4 Grade 5 Grade 6 Collect, Organize, and Display Primary Data (4+ days)
") Collect, Organize, and Display Primary Data (4+ days) Collect, Organize, Display and Interpret Categorical Data (5+ days) 4m88 Collect data by conducting a survey or an experiment to do with the 4m89 Collect
Collect, Organize, and Display Primary Data (4+ days) Collect, Organize, Display and Interpret Categorical Data (5+ days) 4m88 Collect data by conducting a survey or an experiment to do with the 4m89 Collect
Getting to Know Your Data
 Chapter 2 Getting to Know Your Data 2.1 Exercises 1. Give three additional commonly used statistical measures (i.e., not illustrated in this chapter) for the characterization of data dispersion, and discuss
2.1: Frequency Distributions and Their Graphs
 2.1: Frequency Distributions and Their Graphs Frequency Distribution - way to display data that has many entries - table that shows classes or intervals of data entries and the number of entries in each
Using a percent or a letter grade allows us a very easy way to analyze our performance. Not a big deal, just something we do regularly.
 GRAPHING We have used statistics all our lives, what we intend to do now is formalize that knowledge. Statistics can best be defined as a collection and analysis of numerical information. Often times we
Section 2-2. Histograms, frequency polygons and ogives. Friday, January 25, 13
 Section 2-2 Histograms, frequency polygons and ogives 1 Histograms 2 Histograms The histogram is a graph that displays the data by using contiguous vertical bars of various heights to represent the frequencies
CS513-Data Mining. Lecture 2: Understanding the Data. Waheed Noor
 CS513-Data Mining Lecture 2: Understanding the Data Waheed Noor Computer Science and Information Technology, University of Balochistan, Quetta, Pakistan Waheed Noor (CS&IT, UoB, Quetta) CS513-Data Mining
CHAPTER 1. Introduction. Statistics: Statistics is the science of collecting, organizing, analyzing, presenting and interpreting data.
 1 CHAPTER 1 Introduction Statistics: Statistics is the science of collecting, organizing, analyzing, presenting and interpreting data. Variable: Any characteristic of a person or thing that can be expressed
Math 227 EXCEL / MEGASTAT Guide
 Math 227 EXCEL / MEGASTAT Guide Introduction Introduction: Ch2: Frequency Distributions and Graphs Construct Frequency Distributions and various types of graphs: Histograms, Polygons, Pie Charts, Stem-and-Leaf
Solutions to Quiz 1. (a) (3 points) Vertices x and y are in the same connected component. Solution. P (x, y)
 (3 points) Vertices x and y are in the same connected component. Solution. P (x, y)") Massachusetts Institute of Technology 6.042J/18.062J, Fall 05: Mathematics for Computer Science October 17 Prof. Albert R. Meyer and Prof. Ronitt Rubinfeld revised October 18, 2005, 125 minutes Solutions
Massachusetts Institute of Technology 6.042J/18.062J, Fall 05: Mathematics for Computer Science October 17 Prof. Albert R. Meyer and Prof. Ronitt Rubinfeld revised October 18, 2005, 125 minutes Solutions
The main issue is that the mean and standard deviations are not accurate and should not be used in the analysis. Then what statistics should we use?
 Chapter 4 Analyzing Skewed Quantitative Data Introduction: In chapter 3, we focused on analyzing bell shaped (normal) data, but many data sets are not bell shaped. How do we analyze quantitative data when
Statistical Methods. Instructor: Lingsong Zhang. Any questions, ask me during the office hour, or me, I will answer promptly.
 Statistical Methods Instructor: Lingsong Zhang 1 Issues before Class Statistical Methods Lingsong Zhang Office: Math 544 Email: lingsong@purdue.edu Phone: 765-494-7913 Office Hour: Monday 1:00 pm - 2:00