cs6964 March TREES & GRAPHS Miriah Meyer University of Utah
|
|
|
- Muriel Kennedy
- 6 years ago
- Views:
Transcription
1 cs6964 March TREES & GRAPHS Miriah Meyer University of Utah
2 cs6964 March TREES & GRAPHS Miriah Meyer University of Utah slide acknowledgements: Hanspeter Pfister, Harvard University Jeff Heer, Stanford University Tamara Munzner, UBC
3 administrivia 3
4 feb : proposal meetings march 7 : presentation topics due march 9 : proposals due march 27-april 3 : project updates april 5-24 : paper presentations may 1 : final project presentations may 3 : process books due 4
5 - definitions - visualizing trees - indented - node link - enclosure - layered - visualizing graphs - node link - matrix - network summarizations
6 GRAPHS & TREES - graphs - model relations amount data - nodes and edges - trees - graphs with hierarchical structure - connected graph with N-1 edges - nodes as parents and children 6
7 SPATIAL LAYOUT - primary concern of graph drawing is the spatial layout of nodes and edges - often (but not always) the goal is to effectively depict the graph structure - connectivity, path-following - network distance - clustering - ordering (e.g., hierarchy level) 7
8 VISUALIZING TREES - recursion makes it elegant and fast to draw trees - approaches: - indentation - node link - enclosure - layering

9 Drawing trees - indentation INDENTATION
10 NODE-LINK: Reingold-Tilford

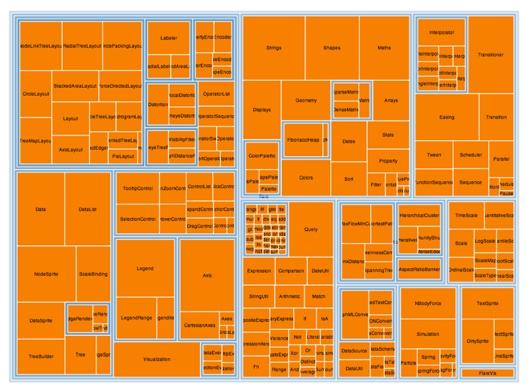
11 ENCLOSURE 11


12 LAYERED


13 13
14 VISUALIZING GRAPHS 14
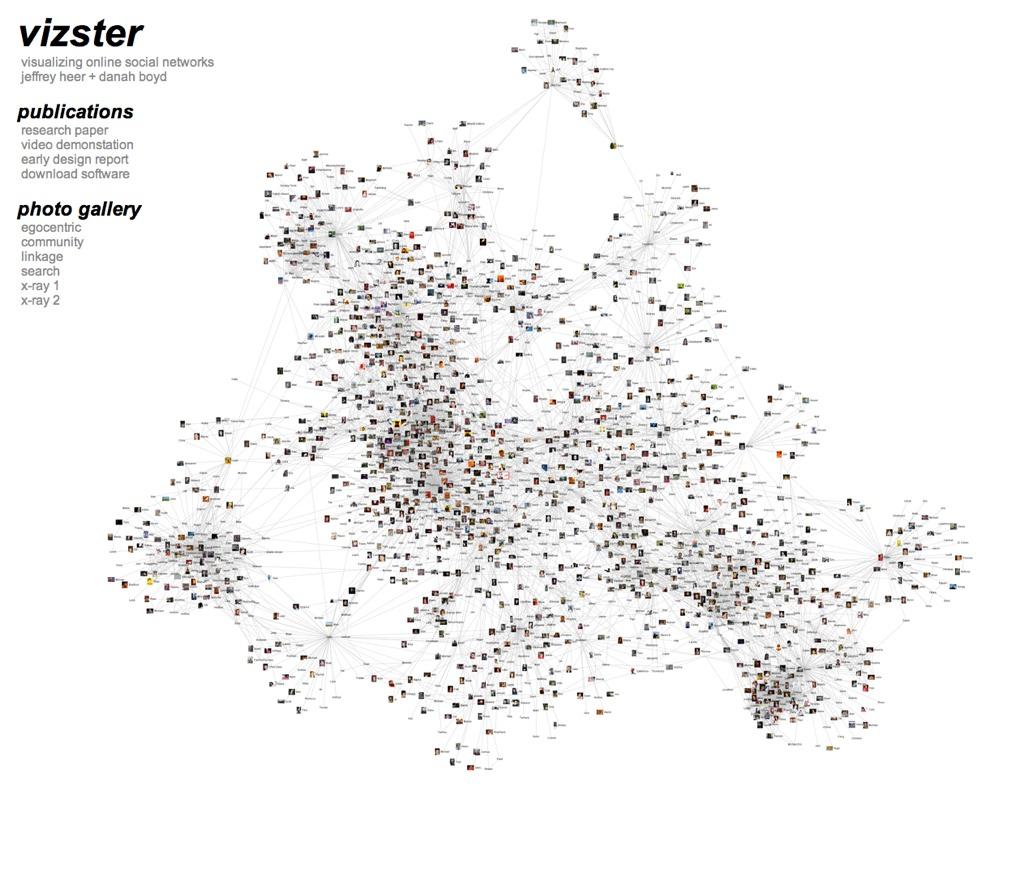
15 GRAPH LAYOUTS - node link layouts - layered / Sugiyama - force directed - other - matrix layouts - attribute based layouts

16 SUGIYAMA-TYPE LAYOUT - great for graphs that have an intrinsic ordering - depth in graph mapped to one axis UNIX ancestry
17 Drawing graphs node link SUGIYAMA STEP 1 - create layering of graph - from domain specific knowledge - longest path from root - algorithmically determine best layering (NP-Hard) - dummy nodes for long edges
18 Drawing graphs node link SUGIYAMA STEP 2 - minimize crossings layer by layer (NP-hard) - numerous heuristics available
19 Drawing graphs node link SUGIYAMA STEP 3 - final assignment of x-coordinates - routing of edges
20 20 Gansner 1993
21 SUGIYAMA + nice, readable top down flow + relatively fast (depending on heuristic used for crossing minimization) - not really suitable for graphs that don t have an intrinsic top down structure - hard to implement - use free graphviz lib instead:
22 Drawing graphs node link FORCE DIRECTED LAYOUT - no intrinsic layering, now what? - physics model - edges = springs - nodes = repulsive particles
23 AESTHETIC RESULTS highschool dating network
24 FORCE MODEL - many variations, but usually physical analogy: - repulsion : f R (d) = C R * m 1 *m 2 / d 2 - m 1, m 2 are node masses - d is distance between nodes - attraction : f A (d) = C A * (d L) - L is the rest length of the spring - i.e. Hooke s Law - total force on a node x with position x - neighbors(x) : f A ( x -y ) * (x -y ) + -f R ( x -y ) * (x -y )
25 ALGORITHM - start from random layout - (global) loop: - for every node pair compute repulsive force - for every edge compute attractive force - accumulate forces per node - update each node position in direction of accumulated force - stop when layout is good enough
 per iteration - can speed up to O(N log N) using quadtree or k-d tree - prone to local minima - can use simulated")
26 Drawing graphs node link FORCE DIRECTED LAYOUTS + very flexible, aesthetic layouts on many types of graphs + can add custom forces + relatively easy to implement - repulsion loop is O(n 2 ) per iteration - can speed up to O(N log N) using quadtree or k-d tree - prone to local minima - can use simulated annealing
27 mentionmap 27
28 28

29 29


30 OTHER NODE LINK LAYOUTS - orthogonal - great for UML diagrams - algorithmically complex - circular layouts - emphasizes ring topologies - used in social network diagrams - nested layouts - recursively apply layout algorithms - great for graphs with hierarchical structure

31 31
 - not good for dense graphs - hairball")
32 Drawing graphs node link NODE LINK LAYOUTS + understandable visual mapping + can show overall structure, clusters, paths + flexible, many variations - all but the most trivial algorithms are > O(N 2 ) - not good for dense graphs - hairball problem!
33 MATRIX LAYOUTS - instead of node link diagram, use adjacency matrix representation A A B C D E B C A B C D E D E

34 SPOTTING PATTERNS IN MATRICES Henry 2006

35 MATRIX REPRESENTATIONS + great for dense graphs + visually scalable + can spot clusters - abstract visualization - hard to follow paths
36 ALTERNATIVE LAYOUT 36
37 ATTRIBUTE-DRIVEN LAYOUT - large node-link diagrams get messy! - are there additional structures we can exploit? - idea: use data attributes to perform layout - e.g., scatterplot based on node values - dynamic queries and/or brushing can be used to enhance perception of connectivity 37

38 cerebral 38

39 semantic substrates 39

40 40 metabolic network
41
42 GLYCOLYSIS G6P GLU a PPP b R5P c d G3P G3P TCA PYR CIT
43 PIVOT GRAPH - task abstraction - show relationship between node attributes and connections in a multi-attribute graph - data abstraction - relational dataset - nodes (and edges) have multiple discrete attributes - rollup and selection transformations Wattenberg 2006
44 VISUAL ENCODING - line (1D) or grid (2D) layout - area subdivided by number of values for an attribute - number of nodes based on attribute count, not original graph node count - size of nodes and edges related to number of aggregated original nodes and edges - scalability through abstraction, not layout algorithm 44
45 VISUAL ENCODING - line for 1D rollup, or grid for 2D case 45 Wattenberg 2006
46 INTERACTION - changing rollup/selection choices - animated transitions between states 46

47 PIVOT GRAPH - in general, more compact than matrix representation 47
48 CRITIQUE: what do you think? 48
49 CRITIQUE - strengths - focus on multi-attribute graphs - abstraction matches focus - scales to large graphs - nice component of multiview system - weaknesses - graph topology not always preserved through rollup and selection - only two attributes - doesn t support continuous variables - multivariate edges? 49
50 RECAP 50
51 - TREES indentation simple, effective for small trees node link and layered looks good but needs exponential space enclosure (treemaps) great for size related tasks but suffer in structure related tasks - GRAPHS node link familiar, but problematic for dense graphs adjacency matrices abstract, hard to follow paths attribute-driven not always possible - TAKE HOME MESSAGE: no ultimate solution
52 exercise 52
53 GRAPH DRAWING EXERCISE adjacency matrix!"""#"""$"""%"""&"""'"""(""")"""*"""!+" """"",,,,,,,,,,,,,,,,,,,,,,,,,,,,,,,,,,,,,,," """"-" ""!"-"+"""+"""!"""+"""+"""!"""!"""+"""+"""+" """"-" ""#"-"+"""+"""!"""+"""+"""!"""+"""!"""!"""+" """"-" ""$"-"!"""!"""+"""+"""+"""+"""+"""+"""+"""!" """"-" ""%"-"+"""+"""+"""+"""!"""+"""!"""+"""!"""+" """"-" ""&"-"+"""+"""+"""!"""+"""+"""+"""!"""+"""+" """"-" ""'"-"!"""!"""+"""+"""+"""+"""+"""+"""!"""!" """"-" ""("-"!"""+"""+"""!"""+"""+"""+"""!"""+"""+" """"-" "")"-"+"""!"""+"""+"""!"""+"""!"""+"""+"""+" """"-" ""*"-"+"""!"""+"""!"""+"""!"""+"""+"""+"""+" """"-" "!+"-"+"""+"""!"""+"""+"""!"""+"""+"""+"""+" """"- " create an aesthetically pleasing node-link diagram representation 53
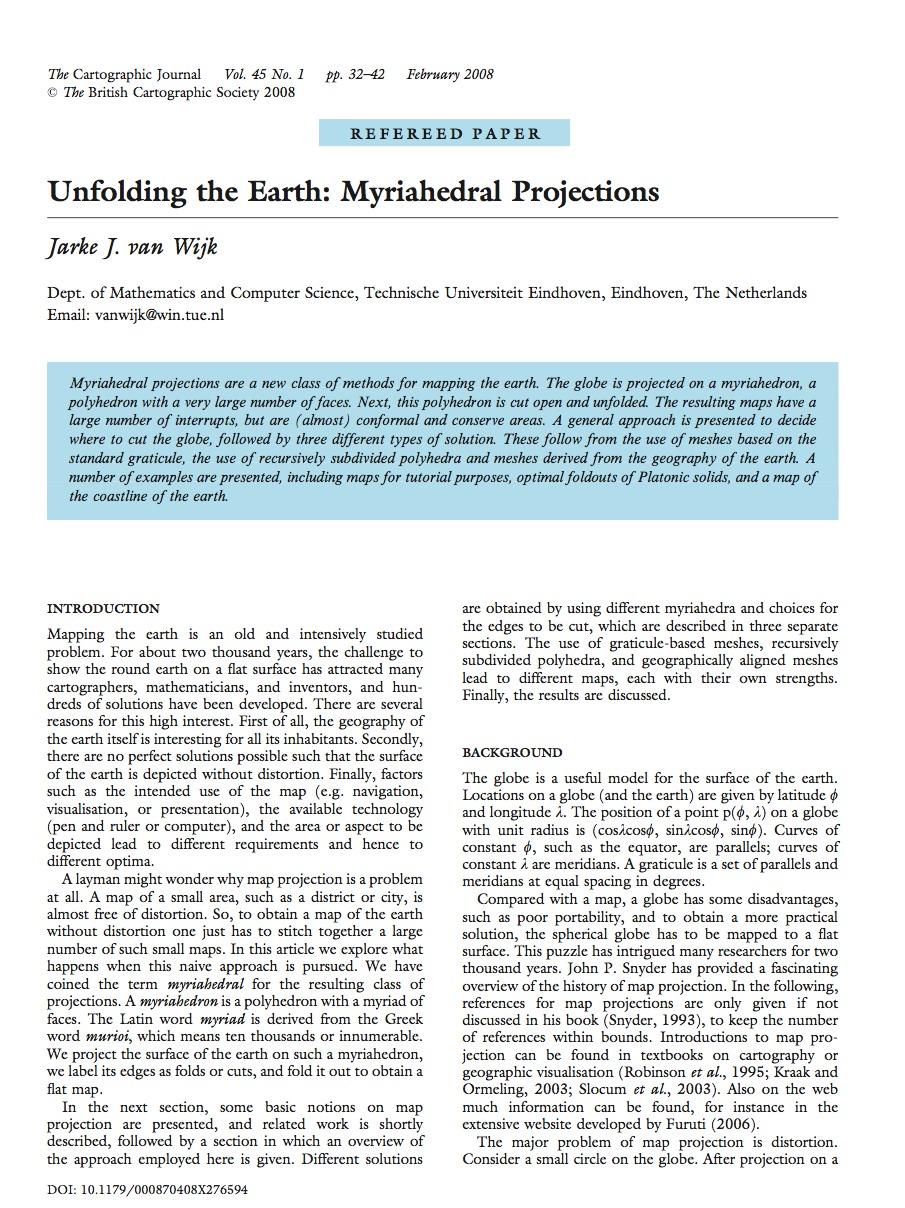
54 L16: Maps REQUIRED READING 54
55 55

56 56

57 57
CP SC 8810 Data Visualization. Joshua Levine
 CP SC 8810 Data Visualization Joshua Levine levinej@clemson.edu Lecture 15 Text and Sets Oct. 14, 2014 Agenda Lab 02 Grades! Lab 03 due in 1 week Lab 2 Summary Preferences on x-axis label separation 10
Graph and Tree Layout
 CS8B :: Nov Graph and Tree Layout Topics Graph and Tree Visualization Tree Layout Graph Layout Jeffrey Heer Stanford University Goals Overview of layout approaches and their strengths and weaknesses Insight
Graph and Tree Layout
 CS8B :: Nov Graph and Tree Layout Topics Graph and Tree Visualization Tree Layout Graph Layout Goals Overview of layout approaches and their strengths and weaknesses Insight into implementation techniques
Trees & Graphs. Nathalie Henry Riche, Microsoft Research
 Trees & Graphs Nathalie Henry Riche, Microsoft Research About Nathalie Henry Riche nath@microsoft.com Researcher @ Microsoft Research since 2009 Today: - Overview of techniques to visualize trees & graphs
IAT 355 Intro to Visual Analytics Graphs, trees and networks 2. Lyn Bartram
 IAT 355 Intro to Visual Analytics Graphs, trees and networks 2 Lyn Bartram Graphs and Trees: Connected Data Graph Vertex/node with one or more edges connecting it to another node Cyclic or acyclic Edge
cs6964 February TABULAR DATA Miriah Meyer University of Utah
 cs6964 February 23 2012 TABULAR DATA Miriah Meyer University of Utah cs6964 February 23 2012 TABULAR DATA Miriah Meyer University of Utah slide acknowledgements: John Stasko, Georgia Tech Tamara Munzner,
Lecture 13: Graphs/Trees
 Lecture 13: Graphs/Trees Information Visualization CPSC 533C, Fall 2009 Tamara Munzner UBC Computer Science Mon, 31 October 2011 1 / 41 Readings Covered Graph Visualisation in Information Visualisation:
1.2 Graph Drawing Techniques
 1.2 Graph Drawing Techniques Graph drawing is the automated layout of graphs We shall overview a number of graph drawing techniques For general graphs: Force Directed Spring Embedder Barycentre based Multicriteria
Graphs and Networks 1
 Graphs and Networks 1 CS 4460 Intro. to Information Visualization November 6, 2017 John Stasko Learning Objectives Define network concepts vertex, edge, cycle, degree, direction Describe different node-link
Graph/Network Visualization
 Graph/Network Visualization Data model: graph structures (relations, knowledge) and networks. Applications: Telecommunication systems, Internet and WWW, Retailers distribution networks knowledge representation
Graph Layout. Last Time: Conveying Structure. Framework for conveying structure. Photographs and illustrations. What is a good view?
 Graph Layout Maneesh Agrawala Last Time: Conveying Structure CS 294-10: Visualization Spring 2011 Photographs and illustrations Framework for conveying structure Goal: Expose important internal features
Drawing Problem. Possible properties Minimum number of edge crossings Small area Straight or short edges Good representation of graph structure...
 Graph Drawing Embedding Embedding For a given graph G = (V, E), an embedding (into R 2 ) assigns each vertex a coordinate and each edge a (not necessarily straight) line connecting the corresponding coordinates.
8. Visual Analytics. Prof. Tulasi Prasad Sariki SCSE, VIT, Chennai
 8. Visual Analytics Prof. Tulasi Prasad Sariki SCSE, VIT, Chennai www.learnersdesk.weebly.com Graphs & Trees Graph Vertex/node with one or more edges connecting it to another node. Cyclic or acyclic Edge
Lecture 12: Graphs/Trees
 Lecture 12: Graphs/Trees Information Visualization CPSC 533C, Fall 2009 Tamara Munzner UBC Computer Science Mon, 26 October 2009 1 / 37 Proposal Writeup Expectations project title (not just 533 Proposal
Hierarchies and Trees 1 (Node-link) CS Information Visualization November 12, 2012 John Stasko
 CS Information Visualization November 12, 2012 John Stasko") Topic Notes Hierarchies and Trees 1 (Node-link) CS 7450 - Information Visualization November 12, 2012 John Stasko Hierarchies Definition Data repository in which cases are related to subcases Can be thought
Topic Notes Hierarchies and Trees 1 (Node-link) CS 7450 - Information Visualization November 12, 2012 John Stasko Hierarchies Definition Data repository in which cases are related to subcases Can be thought
Graphs and Networks 2
 Topic Notes Graphs and Networks 2 CS 7450 - Information Visualization October 23, 2013 John Stasko Review Last time we looked at graph layout aesthetics and algorithms, as well as some example applications
Week 6: Networks, Stories, Vis in the Newsroom
 Week 6: Networks, Stories, Vis in the Newsroom Tamara Munzner Department of Computer Science University of British Columbia JRNL 520H, Special Topics in Contemporary Journalism: Data Visualization Week
2D Visualization Techniques: an overview
 2D Visualization Techniques: an overview Lyn Bartram IAT 814 week 9 2.03.2009 These slides have been largely adapted from B. Zupan and M. Hearst Today Assignments and presentations Assignment 3 out this
Information Visualization. Jing Yang Spring Hierarchy and Tree Visualization
 Information Visualization Jing Yang Spring 2008 1 Hierarchy and Tree Visualization 2 1 Hierarchies Definition An ordering of groups in which larger groups encompass sets of smaller groups. Data repository
cs6964 March TOOLKITS Miriah Meyer University of Utah
 cs6964 March 8 2012 TOOLKITS Miriah Meyer University of Utah administrivia 2 feb 14-23 : proposal meetings march 7 : presentation topics due march 9 : proposals due march 27-april 3 : project updates april
Graphs and Networks 1
 Topic Notes Graphs and Networks 1 CS 7450 - Information Visualization March 8, 2011 John Stasko Connections Connections throughout our lives and the world Circle of friends Delta s flight plans Model connected
V 2 Clusters, Dijkstra, and Graph Layout"
 Bioinformatics 3! V 2 Clusters, Dijkstra, and Graph Layout" Mon, Oct 21, 2013" Graph Basics" A graph G is an ordered pair (V, E) of a set V of vertices and a set E of edges." Degree distribution P(k)!
V 2 Clusters, Dijkstra, and Graph Layout
 Bioinformatics 3 V 2 Clusters, Dijkstra, and Graph Layout Fri, Oct 19, 2012 Graph Basics A graph G is an ordered pair (V, E) of a set V of vertices and a set E of edges. Degree distribution P(k) Random
Hierarchies and Trees 1 (Node-link) CS 4460/ Information Visualization March 10, 2009 John Stasko
 CS 4460/ Information Visualization March 10, 2009 John Stasko") Hierarchies and Trees 1 (Node-link) CS 4460/7450 - Information Visualization March 10, 2009 John Stasko Hierarchies Definition Data repository in which cases are related to subcases Can be thought of as
Hierarchies and Trees 1 (Node-link) CS 4460/7450 - Information Visualization March 10, 2009 John Stasko Hierarchies Definition Data repository in which cases are related to subcases Can be thought of as
VISUALIZING TREES AND GRAPHS. Petra Isenberg
 VISUALIZING TREES AND GRAPHS Petra Isenberg RECAP you have learned about simple plots multi-attribute data visualization DATA AND ITS STRUCTURE STRUCTURED DATA UNSTRUCTURED DATA STRUCTURED DATA there are
DSC 201: Data Analysis & Visualization
 DSC 201: Data Analysis & Visualization Visualization Design Dr. David Koop Definition Computer-based visualization systems provide visual representations of datasets designed to help people carry out tasks
Lecture 13: Graphs and Trees
 Lecture 13: Graphs and Trees Information Visualization CPSC 533C, Fall 2006 Tamara Munzner UBC Computer Science 24 October 2006 Readings Covered Graph Visualisation in Information Visualisation: a Survey.
CS Information Visualization Sep. 2, 2015 John Stasko
 Multivariate Visual Representations 2 CS 7450 - Information Visualization Sep. 2, 2015 John Stasko Recap We examined a number of techniques for projecting >2 variables (modest number of dimensions) down
Information Visualization. SWE 432, Fall 2016 Design and Implementation of Software for the Web
 Information Visualization SWE 432, Fall 2016 Design and Implementation of Software for the Web Today What types of information visualization are there? Which one should you choose? What does usability
Information Visualization
 Information Visualization Visual Perception High-dimensional Data Visualization Hierarchical(tree) Data Visualization Graphs and Networks Visualization Time Series Data Visualization Text and Document
Graph Drawing Contest Report
 Graph Drawing Contest Report Christian A. Duncan 1, Carsten Gutwenger 2,LevNachmanson 3, and Georg Sander 4 1 Louisiana Tech University, Ruston, LA 71272, USA duncan@latech.edu 2 University of Dortmund,
Sparse matrices, graphs, and tree elimination
 Logistics Week 6: Friday, Oct 2 1. I will be out of town next Tuesday, October 6, and so will not have office hours on that day. I will be around on Monday, except during the SCAN seminar (1:25-2:15);
Information Visualization. Jing Yang Spring Graph Visualization
 Information Visualization Jing Yang Spring 2007 1 Graph Visualization 2 1 When? Ask the question: Is there an inherent relation among the data elements to be visualized? If yes -> data: nodes relations:
Graphs and Networks 1
 Topic Notes Graphs and Networks 1 CS 7450 - Information Visualization November 1, 2011 John Stasko Connections Connections throughout our lives and the world Circle of friends Delta s flight plans Model
CIS 467/602-01: Data Visualization
 CIS 467/602-01: Data Visualization Tables Dr. David Koop Assignment 2 http://www.cis.umassd.edu/ ~dkoop/cis467/assignment2.html Plagiarism on Assignment 1 Any questions? 2 Recap (Interaction) Important
Dynamic Parameter Spring Model for Automatic Graph Layout. Xuejun Liu. (Doctoral Program in Computer Science) Advised by Jiro Tanaka
 Advised by Jiro Tanaka") Dynamic Parameter Spring Model for Automatic Graph Layout Xuejun Liu (Doctoral Program in Computer Science) Advised by Jiro Tanaka Submitted to the Graduate School of Systems and Information Engineering
Dynamic Parameter Spring Model for Automatic Graph Layout Xuejun Liu (Doctoral Program in Computer Science) Advised by Jiro Tanaka Submitted to the Graduate School of Systems and Information Engineering
CS Information Visualization Sep. 19, 2016 John Stasko
 Multivariate Visual Representations 2 CS 7450 - Information Visualization Sep. 19, 2016 John Stasko Learning Objectives Explain the concept of dense pixel/small glyph visualization techniques Describe
CS-5630 / CS-6630 Visualization for Data Science The Visualization Alphabet: Marks and Channels
 CS-5630 / CS-6630 Visualization for Data Science The Visualization Alphabet: Marks and Channels Alexander Lex alex@sci.utah.edu [xkcd] How can I visually represent two numbers, e.g., 4 and 8 Marks & Channels
Network visualization techniques and evaluation
 Network visualization techniques and evaluation The Charlotte Visualization Center University of North Carolina, Charlotte March 15th 2007 Outline 1 Definition and motivation of Infovis 2 3 4 Outline 1
Courtesy of Prof. Shixia University
 Courtesy of Prof. Shixia Liu @Tsinghua University Introduction Node-Link diagrams Space-Filling representation Hybrid methods Hierarchies often represented as trees Directed, acyclic graph Two main representation
Research Incubator: Combinatorial Optimization. Dr. Lixin Tao December 9, 2003
 Research Incubator: Combinatorial Optimization Dr. Lixin Tao December 9, 23 Content General Nature of Research on Combinatorial Optimization Problem Identification and Abstraction Problem Properties and
Data Visualization. Fall 2016
 Data Visualization Fall 2016 Information Visualization Upon now, we dealt with scientific visualization (scivis) Scivisincludes visualization of physical simulations, engineering, medical imaging, Earth
cs6630 September VISUAL ENCODING Miriah Meyer University of Utah
 cs6630 September 9 2014 VISUAL ENCODING Miriah Meyer University of Utah 1 administrivia... 2 - introducing Dr. Josh Levine 3 last time... 4 data abstraction the what part of an analysis that pertains to
Glyphs. Presentation Overview. What is a Glyph!? Cont. What is a Glyph!? Glyph Fundamentals. Goal of Paper. Presented by Bertrand Low
 Presentation Overview Glyphs Presented by Bertrand Low A Taxonomy of Glyph Placement Strategies for Multidimensional Data Visualization Matthew O. Ward, Information Visualization Journal, Palmgrave,, Volume
INFO 424, UW ischool 11/1/2007
 Today s Lecture Trees and Networks Thursday 1 Nov 2007 Polle Zellweger Goals of tree & network visualization View structure & connectivity, node properties Challenges of trees & networks size, structure,
Visual Encoding Design
 CSE 442 - Data Visualization Visual Encoding Design Jeffrey Heer University of Washington Last Time: Data & Image Models The Big Picture task questions, goals assumptions data physical data type conceptual
DATA ABSTRACTION & INTRO TO TABLEAU
 cs6630 September 4 2014 DATA ABSTRACTION & INTRO TO TABLEAU Miriah Meyer University of Utah 1 administrivia... 2 - design critiques due tonight - first assignment out today - there *might* be 3 seats available
Large Scale Information Visualization. Jing Yang Fall Graph Visualization
 Large Scale Information Visualization Jing Yang Fall 2007 1 Graph Visualization 2 1 When? Ask the question: Is there an inherent relation among the data elements to be visualized? If yes -> data: nodes
Lecture 7: Depth/Occlusion
 Lecture 7: Depth/Occlusion Information Visualization CPSC 533C, Fall 2006 Tamara Munzner UBC Computer Science 3 October 2006 Readings Covered Ware, Chapter 8: Space Perception and the Display of Data in
Agenda. Introduction Curve implementation. Particle System. - Requirements -What are all those vectors? -Where should I put things?
 Agenda Introduction Curve implementation - Requirements -What are all those vectors? -Where should I put things? Particle System - Requirements -What should I implement? - Suggestions - Cool forces Agenda
Hierarchy and Tree Visualization
 Hierarchy and Tree Visualization Fall 2009 Jing Yang 1 Hierarchies Definition An ordering of groups in which h larger groups encompass sets of smaller groups. Data repository in which cases are related
BDVA 2016 Workshop Visual Analytics for Relational Data Dr. Quang Vinh Nguyen
 BDVA 2016 Workshop Visual Analytics for Relational Data Dr. Quang Vinh Nguyen Q.Nguyen@WesternSydney.edu.au Dr. Quang Vinh Nguyen. Email: q.nguyen@westernsydney.edu.au 1 Relational Data Graphs (as a general
Übung zur Vorlesung Informationsvisualisierung. Emanuel von Zezschwitz Ludwig-Maximilians-Universität München Wintersemester 2012/2013
 Übung zur Vorlesung Informationsvisualisierung Emanuel von Zezschwitz Ludwig-Maximilians-Universität München Wintersemester 2012/2013 Graphs and Hierarchies Terminology A Graph is an abstract representation
CSE 214 Computer Science II Introduction to Tree
 CSE 214 Computer Science II Introduction to Tree Fall 2017 Stony Brook University Instructor: Shebuti Rayana shebuti.rayana@stonybrook.edu http://www3.cs.stonybrook.edu/~cse214/sec02/ Tree Tree is a non-linear
CSE512 :: 4 Feb Animation. Jeffrey Heer University of Washington
 CSE512 :: 4 Feb 2014 Animation Jeffrey Heer University of Washington 1 Why use motion? Visual variable to encode data Direct attention Understand system dynamics Understand state transition Increase engagement
TREES cs2420 Introduction to Algorithms and Data Structures Spring 2015
 TREES cs2420 Introduction to Algorithms and Data Structures Spring 2015 1 administrivia 2 -assignment 7 due Thursday at midnight -asking for regrades through assignment 5 and midterm must be complete by
COMP 4601 Hubs and Authorities
 COMP 4601 Hubs and Authorities 1 Motivation PageRank gives a way to compute the value of a page given its position and connectivity w.r.t. the rest of the Web. Is it the only algorithm: No! It s just one
V 2 Clusters, Dijkstra, and Graph Layout
 Bioinformatics 3 V 2 Clusters, Dijkstra, and Graph Layout Mon, Oct 31, 2016 Graph Basics A graph G is an ordered pair (V, E) of a set V of vertices and a set E of edges. Degree distribution P(k) Random
Information Visualization. Jing Yang Fall Hierarchy and Tree Visualization
 Information Visualization Jing Yang Fall 2007 1 Hierarchy and Tree Visualization 2 1 Hierarchies Definition An ordering of groups in which larger groups encompass sets of smaller groups. Data repository
Graph Visualization: Energy Based Methods (aka force directed methods)
") Graph Visualization: Energy Based Methods (aka force directed methods) Energy-Based Methods Use a physical analogy to draw graphs View a graph as a system of bodies with forces acting between the bodies.
Graph Visualization: Energy Based Methods (aka force directed methods) Energy-Based Methods Use a physical analogy to draw graphs View a graph as a system of bodies with forces acting between the bodies.
Facet: Multiple View Methods
 Facet: Multiple View Methods Large Data Visualization Torsten Möller Overview Combining views Partitioning Coordinating Multiple Side-by-Side Views Encoding Channels Shared Data Shared Navigation Synchronized
Multivariate Data & Tables and Graphs. Agenda. Data and its characteristics Tables and graphs Design principles
 Topic Notes Multivariate Data & Tables and Graphs CS 7450 - Information Visualization Aug. 27, 2012 John Stasko Agenda Data and its characteristics Tables and graphs Design principles Fall 2012 CS 7450
Applying the weighted barycentre method to interactive graph visualization
 Applying the weighted barycentre method to interactive graph visualization Peter Eades University of Sydney Thanks for some software: Hooman Reisi Dekhordi Patrick Eades Graphs and Graph Drawings What
hierarchical techniques
 Wolfgang Aigner aigner@ifs.tuwien.ac.at http://ieg.ifs.tuwien.ac.at/~aigner/ wolfgang.aigner@donau-uni.ac.at http://ike.donau-uni.ac.at/~aigner/ Version 1.0 10.11.2007 http://www.caida.org/tools/visualization/walrus/
Trees : Part 1. Section 4.1. Theory and Terminology. A Tree? A Tree? Theory and Terminology. Theory and Terminology
 Trees : Part Section. () (2) Preorder, Postorder and Levelorder Traversals Definition: A tree is a connected graph with no cycles Consequences: Between any two vertices, there is exactly one unique path
Edge Equalized Treemaps
 Edge Equalized Treemaps Aimi Kobayashi Department of Computer Science University of Tsukuba Ibaraki, Japan kobayashi@iplab.cs.tsukuba.ac.jp Kazuo Misue Faculty of Engineering, Information and Systems University
Multivariate Data & Tables and Graphs
 Multivariate Data & Tables and Graphs CS 4460/7450 - Information Visualization Jan. 13, 2009 John Stasko Agenda Data and its characteristics Tables and graphs Design principles Spring 2009 CS 4460/7450
Networking Sensors, II
 Networking Sensors, II Sensing Networking Leonidas Guibas Stanford University Computation CS321 ZG Book, Ch. 3 1 Class Administration Paper presentation preferences due today, by class time Project info
Graphs and Networks. CS Information Visualization March 2, 2004 John Stasko
 Graphs and Networks CS 7450 - Information Visualization March 2, 2004 John Stasko Connections Spence s chapter 8 is called Connectivity Connections throughout our lives and the world Circle of friends
[Slides Extracted From] Visualization Analysis & Design Full-Day Tutorial Session 4
![[Slides Extracted From] Visualization Analysis & Design Full-Day Tutorial Session 4](/thumbs/82/85665283.jpg "[Slides Extracted From] Visualization Analysis & Design Full-Day Tutorial Session 4") [Slides Extracted From] Visualization Analysis & Design Full-Day Tutorial Session 4 Tamara Munzner Department of Computer Science University of British Columbia Sanger Institute / European Bioinformatics
[Slides Extracted From] Visualization Analysis & Design Full-Day Tutorial Session 4 Tamara Munzner Department of Computer Science University of British Columbia Sanger Institute / European Bioinformatics
Decision Trees: Part 2
 Decision Trees: Part Nikhil Sardana September 07 Introduction Part of this lecture covered the mathematics of decision trees. This lecture will transition you from graphs and mathematics to writing the
Lecture 5: DATA MAPPING & VISUALIZATION. November 3 rd, Presented by: Anum Masood (TA)
") 1/59 Lecture 5: DATA MAPPING & VISUALIZATION November 3 rd, 2017 Presented by: Anum Masood (TA) 2/59 Recap: Data What is Data Visualization? Data Attributes Visual Attributes Mapping What are data attributes?
1/59 Lecture 5: DATA MAPPING & VISUALIZATION November 3 rd, 2017 Presented by: Anum Masood (TA) 2/59 Recap: Data What is Data Visualization? Data Attributes Visual Attributes Mapping What are data attributes?
A Spring Modeling Algorithm to Position Nodes of an Undirected Graph in Three Dimensions
 A Spring Modeling Algorithm to Position Nodes of an Undirected Graph in Three Dimensions Aruna Kumar and Richard H. Fowler Technical Report Department of Computer Science University of Texas - Pan American
Learning Objectives for Data Concept and Visualization
 Learning Objectives for Data Concept and Visualization Assignment 1: Data Quality Concept and Impact of Data Quality Summarize concepts of data quality. Understand and describe the impact of data on actuarial
Welfare Navigation Using Genetic Algorithm
 Welfare Navigation Using Genetic Algorithm David Erukhimovich and Yoel Zeldes Hebrew University of Jerusalem AI course final project Abstract Using standard navigation algorithms and applications (such
We will start at 2:05 pm! Thanks for coming early!
 We will start at 2:05 pm! Thanks for coming early! Yesterday Fundamental 1. Value of visualization 2. Design principles 3. Graphical perception Record Information Support Analytical Reasoning Communicate
RINGS : A Technique for Visualizing Large Hierarchies
 RINGS : A Technique for Visualizing Large Hierarchies Soon Tee Teoh and Kwan-Liu Ma Computer Science Department, University of California, Davis {teoh, ma}@cs.ucdavis.edu Abstract. We present RINGS, a
Parallel Coordinates ++
 Parallel Coordinates ++ CS 4460/7450 - Information Visualization Feb. 2, 2010 John Stasko Last Time Viewed a number of techniques for portraying low-dimensional data (about 3
Statistical graphics in analysis Multivariable data in PCP & scatter plot matrix. Paula Ahonen-Rainio Maa Visual Analysis in GIS
 Statistical graphics in analysis Multivariable data in PCP & scatter plot matrix Paula Ahonen-Rainio Maa-123.3530 Visual Analysis in GIS 11.11.2015 Topics today YOUR REPORTS OF A-2 Thematic maps with charts
Interactive Visual Exploration
 Interactive Visual Exploration of High Dimensional Datasets Jing Yang Spring 2010 1 Challenges of High Dimensional Datasets High dimensional datasets are common: digital libraries, bioinformatics, simulations,
Visualisation of state machines using the Sugiyama framework. Master of Science Thesis in Computer Science VIKTOR MAZETTI HANNES SÖRENSSON
 Visualisation of state machines using the Sugiyama framework Master of Science Thesis in Computer Science VIKTOR MAZETTI HANNES SÖRENSSON Chalmers University of Technology University of Gothenburg Department
2D/3D Geometric Transformations and Scene Graphs
 2D/3D Geometric Transformations and Scene Graphs Week 4 Acknowledgement: The course slides are adapted from the slides prepared by Steve Marschner of Cornell University 1 A little quick math background
Interactive, Tree-Based Graph Visualization
 Interactive, Tree-Based Graph Visualization Andy Pavlo March 17, 2006 Abstract We introduce an interactive graph visualization scheme that allows users to explore graphs by viewing them as a sequence of
Visual Encoding Design
 CSE 442 - Data Visualization Visual Encoding Design Jeffrey Heer University of Washington Review: Expressiveness & Effectiveness / APT Choosing Visual Encodings Assume k visual encodings and n data attributes.
PASSWORDS TREES AND HIERARCHIES. CS121: Relational Databases Fall 2017 Lecture 24
 PASSWORDS TREES AND HIERARCHIES CS121: Relational Databases Fall 2017 Lecture 24 Account Password Management 2 Mentioned a retailer with an online website Need a database to store user account details
Multidimensional Interactive Visualization
 Multidimensional Interactive Visualization Cecilia R. Aragon I247 UC Berkeley Spring 2010 Acknowledgments Thanks to Marti Hearst, Tamara Munzner for the slides Spring 2010 I 247 2 Today Finish panning
Multivariate Data & Tables and Graphs. Agenda. Data and its characteristics Tables and graphs Design principles
 Multivariate Data & Tables and Graphs CS 7450 - Information Visualization Aug. 24, 2015 John Stasko Agenda Data and its characteristics Tables and graphs Design principles Fall 2015 CS 7450 2 1 Data Data
CS Information Visualization March 4, 2004 John Stasko
 WWW and Internet CS 7450 - Information Visualization March 4, 2004 John Stasko Internet and WWW By nature, abstract, so good target for visualization Often described in terms of metaphors Information Superhighway
Algorithms for Graph Visualization
 Algorithms for Graph Visualization Summer Semester 2016 Lecture #4 Divide-and-Conquer Algorithms: Trees and Series-Parallel Graphs (based on slides from Martin Nöllenburg and Robert Görke, KIT) 1 Uses
Clustering and Visualisation of Data
 Clustering and Visualisation of Data Hiroshi Shimodaira January-March 28 Cluster analysis aims to partition a data set into meaningful or useful groups, based on distances between data points. In some
Good enough to great: A quick guide for better data visualizations
 Good enough to great: A quick guide for better data visualizations Contents Charts...4 Color... 11 Size... 16 Text...20 Dashboard layout...24 Conclusion...30 Good enough to great In today s world, successful
Introduction to Graphs. CS2110, Spring 2011 Cornell University
 Introduction to Graphs CS2110, Spring 2011 Cornell University A graph is a data structure for representing relationships. Each graph is a set of nodes connected by edges. Synonym Graph Hostile Slick Icy
Graphs and Networks. CS 4460/ Information Visualization March 24, 2009 John Stasko. Connections throughout our lives and the world
 Graphs and Networks CS 4460/7450 - Information Visualization March 24, 2009 John Stasko Connections Connections throughout our lives and the world Circle of friends Delta s flight plans Model connected
Animation. Why use motion? Volume rendering [Lacroute 95] Cone Trees [Robertson 91]
![Animation. Why use motion? Volume rendering [Lacroute 95] Cone Trees [Robertson 91]](/thumbs/79/80418208.jpg "Animation. Why use motion? Volume rendering [Lacroute 95] Cone Trees [Robertson 91]") CS448B :: 1 Nov 2011 Animation Why use motion? Visual variable to encode data Direct attention Understand system dynamics (?) Understand state transition Increase engagement Jeffrey Heer Stanford University
CS448B :: 1 Nov 2011 Animation Why use motion? Visual variable to encode data Direct attention Understand system dynamics (?) Understand state transition Increase engagement Jeffrey Heer Stanford University
Graph Compare: Simultaneous Graph Layout and Visualization for Structural Comparison
 Graph Compare: Simultaneous Graph Layout and Visualization for Structural Comparison Matthew Can UC Berkeley Computer Science Department matthewcan@berkeley.edu ABSTRACT Graphs, node-link diagrams, are
CS839: Epistemic Net Visualization Challenge
 CS839: Epistemic Net Visualization Challenge Chaman Singh Verma, Kim Nak Ho and Emma Turetsky March 17, 2010 Abstract Epistemic networks consist of sets of correlated concepts. The data is represented
ABSTRACT I. INTRODUCTION II. METHODS AND MATERIAL
 ABSTRACT 2017 IJSRSET Volume 3 Issue 1 Print ISSN: 2395-1990 Online ISSN : 2394-4099 Themed Section: Engineering and Technology Comparative Analysis of Social Network Analysis and Visualisation Tools Prof.
Lecture 6: Statistical Graphics
 Lecture 6: Statistical Graphics Information Visualization CPSC 533C, Fall 2009 Tamara Munzner UBC Computer Science Mon, 28 September 2009 1 / 34 Readings Covered Multi-Scale Banking to 45 Degrees. Jeffrey
i-vis Information Visualization Research Group
 version 1.0 BILKENT UNIVERSITY i-vis Information Visualization Research Group Chisio User s Guide B I L K E N T I - V I S R E S E A R C H G R O U P Chisio User s Guide i-vis Research Group Computer Engineering
Parallel Computing. Slides credit: M. Quinn book (chapter 3 slides), A Grama book (chapter 3 slides)
, A Grama book (chapter 3 slides)") Parallel Computing 2012 Slides credit: M. Quinn book (chapter 3 slides), A Grama book (chapter 3 slides) Parallel Algorithm Design Outline Computational Model Design Methodology Partitioning Communication
Parallel Computing 2012 Slides credit: M. Quinn book (chapter 3 slides), A Grama book (chapter 3 slides) Parallel Algorithm Design Outline Computational Model Design Methodology Partitioning Communication