Graph and Tree Layout
|
|
|
- May Wade
- 6 years ago
- Views:
Transcription


1 CS8B :: Nov Graph and Tree Layout Topics Graph and Tree Visualization Tree Layout Graph Layout Goals Overview of layout approaches and their strengths and weaknesses Insight into implementation techniques Jeffrey Heer Stanford University Graphs and Trees Graphs Model relations among data Nodes and edges Trees Graphs with hierarchical structure Connected graph with N- edges Nodes as parents and children
2 Spatial Layout The primary concern of graph drawing is the spatial arrangement of nodes and edges Often (but not always) the goal is to effectively depict the graph structure Connectivity, path-following Network distance Clustering Ordering (e.g., hierarchy level) Applications of Tree / Graph Layout Tournaments Organization Charts Genealogy Diagramming (e.g., Visio) Biological Interactions (Genes, Proteins) Computer Networks Social Networks Simulation and Modeling Integrated Circuit Design Tree Visualization Tree Layout Indentation Linear list, indentation encodes depth Node-Link diagrams Nodes connected by lines/curves Enclosure diagrams Represent hierarchy by enclosure Layering Relative position and alignment Tree layout is fast: O(n) or O(n log n), enabling real-time layout for interaction.


3 Indentation Places all items along vertically spaced rows Indentation used to show parent/child relationships Commonly used as a component in an interface Breadth and depth contend for space Often requires a great deal of scrolling Node-Link Diagrams Nodes are distributed in space, connected by straight or curved lines Typical approach is to use D space to break apart breadth and depth Often space is used to communicate hierarchical orientation (typically towards authority or generality) Basic Recursive Approach Repeatedly divide space for subtrees by leaf count Breadth of tree along one dimension Depth along the other dimension Problem: exponential growth of breadth Reingold & Tilford s Tidier Layout Goal: make smarter use of space, maximize density and symmetry. Originally for binary trees, extended by Walker to cover general case. This was corrected by Buchheim et al to achieve a linear time algorithm.
4 Reingold-Tilford Layout Design concerns Clearly encode depth level No edge crossings Isomorphic subtrees drawn identically Ordering and symmetry preserved Compact layout (don t waste space) 8
5
6
7
8
9
10

11 8 8 Linear algorithm starts with bottom-up pass of the tree Y-coord by depth, arbitrary starting X-coord Merge left and right subtrees Shift right as close as possible to left Computed efficiently by maintaining subtree contours Shifts in position saved for each node as visited Parent nodes are centered above their children Top-down pass for assignment of final positions Sum of initial layout and aggregated shifts Radial Layout Node-link diagram in polar co-ordinates. Radius encodes depth, with root in the center. Angular sectors assigned to subtrees (typically uses recursive approach). Reingold-Tilford approach can also be applied here.


12 Circular Drawing of Trees Drawing in D to form Cone Trees Balloon Trees can be described as a D variant of a Cone Tree. Not just a flattening process, as circles must not overlap. Problems with Node-Link Diagrams Scale Tree breadth often grows exponentially Even with tidier layout, quickly run out of space Possible solutions Filtering Focus+Context Scrolling or Panning Zooming Aggregation Visualizing Large Hierarchies Indented Layout Reingold-Tilford Layout MC Escher, Circle Limit IV


13 Hyperbolic Layout Perform tree layout in hyperbolic geometry, then project the result on to the Euclidean plane. Degree-of-Interest Trees [AVI ] Why? Like tree breadth, the hyperbolic plane expands exponentially! Also computable in D, projected into a sphere. Space-constrained, multi-focal tree layout Degree-of-Interest Trees Enclosure Diagrams Encode structure using spatial enclosure Popularly known as TreeMaps Benefits Provides a single view of an entire tree Easier to spot large/small nodes Cull un-interesting nodes on a per block basis until all blocks on a level fit within bounds. Attempt to center child blocks beneath parents. Problems Difficult to accurately read depth


14 TreeMaps Recursively fill space based on a size metric for nodes. Enclosure signifies hierarchy. Additional measures can be taken to control aspect ratio of cells. Often uses rectangles, but other shapes are possible, e.g., iterative Voronoi tesselation. Layered Diagrams Signify tree structure using Layering Adjacency Alignment Involves recursive sub-division of space We can apply the same set of approaches as in node-link layout. Icicle and Sunburst Trees Layered Tree Drawing Higher-level nodes get a larger layer area, whether that is horizontal or angular extent. Child levels are layered, constrained to parent s extent

 Logistics Groups of up to people, graded individually Clearly report responsibilities of each member Final Project Ideas Read the Final Project Wiki Page!")
15 Hybrids are also possible Elastic Hierarchies Node-link diagram with treemap nodes. Administrivia Final Project Design a new visualization system or technique Many options: new system, interaction technique, design study -8 page paper in conference paper format Presentations: in-class report & final poster session Schedule Project Proposal: Tuesday, Nov (end of day) In-Class Presentation: Tuesday, Nov Poster Presentation: Tuesday, Dec (-pm) Final Papers: Thursday, Dec (pm) Logistics Groups of up to people, graded individually Clearly report responsibilities of each member Final Project Ideas Read the Final Project Wiki Page! Also follow the links for suggested projects. A number of domain experts have provided project ideas and are excited to collaborate with you. We strongly encourage you to consider working in a partnership with a domain expert, especially if you have difficulty formulating a problem-focused project idea. Unsure? Come to office hours or schedule an appointment to discuss project ideas.
16 Final Project Proposal Deliverables Form project group (- people) Create project wiki page Post project abstract (- paragraphs) Should clearly state the problem, relevance & planned solution Start your related work search now to inform your proposal Graph Layout Due Tues Nov (by end of day) Approaches to Graph Drawing Direct Calculation using Graph Structure Tree layout on spanning tree Hierarchical layout Adjacency matrix layout Optimization-based Layout Constraint satisfaction Force-directed layout Attribute-Driven Layout Layout using data attributes, not linkage Spanning Tree Layout Many graphs are tree-like or have useful spanning trees Websites, Social Networks Use tree layout on spanning tree of graph Trees created by BFS / DFS Min/max spanning trees Fast tree layouts allow graph layouts to be recalculated at interactive rates Heuristics may further improve layout

17 Sugiyama-style graph layout Evolution of the UNIX operating system Hierarchical layering based on descent Spanning tree layout may result in arbitrary parent node Sugiyama-style graph layout Hierarchical graph layout Layer Layer Layer Layer Reverse edges to remove cycles Create dummy nodes to fill in missing layers Assign nodes to hierarchy layers Arrange nodes within layer, minimize edge crossings Route edges layout splines if needed Gnutella network
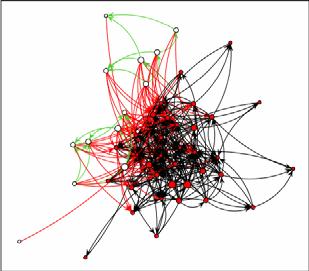
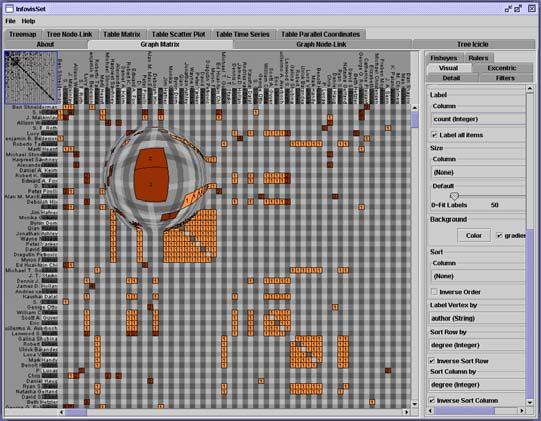


18 Limitations of Node-Link Layout Edge-crossings and occlusion Adjacency Matrices Node-link 8

 [Dwyer ] Iterative constraint relaxation Optimizing Aesthetic")

19 Matrix Matrix Optimization Techniques Treat layout as an optimization problem Define layout using an energy model and/or a set of constraints: equations the layout should try to obey Use optimization algorithms to solve Regularly used for undirected graphs Force-Directed Layout most common We can introduce directional constraints DiG-CoLa (Di-Graph Constrained Optimization Layout) [Dwyer ] Iterative constraint relaxation Optimizing Aesthetic Constraints Minimize edge crossings Minimize area Minimize line bends Minimize line slopes Maximize smallest angle between edges Maximize symmetry but, can t do it all. Optimizing these criteria is often NP-Hard, requiring approximations.
 Speed up to O(N log N) using quadtree or k-d tree Numerical integration of forces at each time step Constrained Optimization Layout Minimize stress function stress(x) = Σ i<j w ij ( X")

20 Force-Directed Layout Nodes = charged particles F = G*m *m / (x i x j ) with air resistance F = -b * v i Edges = springs F = -k * (x i x j L) Repeatedly calculate forces, update node positions Naïve approach O(N ) Speed up to O(N log N) using quadtree or k-d tree Numerical integration of forces at each time step Constrained Optimization Layout Minimize stress function stress(x) = Σ i<j w ij ( X i -X j - d ij ) X: node positions, d: optimal edge length, w: normalization constants Use global (majorization) or localized (gradient descent) optimization Says: Try to place nodes d ij apart Add hierarchy ordering constraints E H (y) = Σ (i,j) E ( y i -y j - δ ij ) y: node y-coordinates δ : edge direction (e.g., for i j, for undirected) Says: If i points to j, it should have a lower y-value Sugiyama layout (dot) Preserve tree structure DiG-CoLa method Preserve edge lengths [Slide from Tim Dwyer]
21 [Slide from Tim Dwyer] Examples Iterative Constraint Relaxation Quadratic programming is complex to code and computationally costly. Is there a simpler way? Iteratively relax each constraint [Dwyer ] Given a constraint (e.g., x i x j = ) Simply push the nodes to satisfy Each relaxation may clobber prior results This typically (miraculously?) converges quickly and enables expressive constraints Attribute-Driven Layout Large node-link diagrams get messy! Is there additional structure we can exploit? Idea: Use data attributes to perform layout e.g., scatter plot based on node values Dynamic queries and/or brushing can be used to explore connectivity Attribute-Driven Layout The Skitter Layout Internet Connectivity Radial Scatterplot Angle = Longitude Geography Radius = Degree # of connections (a statistic of the nodes)
![Semantic Substrates [Shneiderman ] Semantic Substrates](/docs-images/72/67879398/images/22-0.jpg "[Shneiderman ] PivotGraph [Wattenberg ] Layout")

22 Semantic Substrates [Shneiderman ] Semantic Substrates [Shneiderman ] PivotGraph [Wattenberg ] Layout aggregated graphs according to node attributes. Analogous to pivot tables and trellis display. PivotGraph PivotGraph


23 Operators PivotGraph Matrices Roll-Up Aggregate items with matching data values Selection Filter on data values PivotGraph Matrix Limitations of PivotGraph Only variables (no nesting as in Tableau) Doesn t support continuous variables Multivariate edges? Hierarchical Edge Bundling


24 Trees with Adjacency Relations Bundle Edges along Hierarchy Configuring Edge Tension
25 Summary Tree Layout Indented / Node-Link / Enclosure / Layers How to address issues of scale? Filtering and Focus + Context techniques Graph Layout Tree layout over spanning tree Hierarchical Sugiyama Layout Optimization (Force-Directed Layout) Attribute-Driven Layout
Graph and Tree Layout
 CS8B :: Nov Graph and Tree Layout Topics Graph and Tree Visualization Tree Layout Graph Layout Jeffrey Heer Stanford University Goals Overview of layout approaches and their strengths and weaknesses Insight
Trees & Graphs. Nathalie Henry Riche, Microsoft Research
 Trees & Graphs Nathalie Henry Riche, Microsoft Research About Nathalie Henry Riche nath@microsoft.com Researcher @ Microsoft Research since 2009 Today: - Overview of techniques to visualize trees & graphs
Graph Layout. Last Time: Conveying Structure. Framework for conveying structure. Photographs and illustrations. What is a good view?
 Graph Layout Maneesh Agrawala Last Time: Conveying Structure CS 294-10: Visualization Spring 2011 Photographs and illustrations Framework for conveying structure Goal: Expose important internal features
cs6964 March TREES & GRAPHS Miriah Meyer University of Utah
 cs6964 March 1 2012 TREES & GRAPHS Miriah Meyer University of Utah cs6964 March 1 2012 TREES & GRAPHS Miriah Meyer University of Utah slide acknowledgements: Hanspeter Pfister, Harvard University Jeff
IAT 355 Intro to Visual Analytics Graphs, trees and networks 2. Lyn Bartram
 IAT 355 Intro to Visual Analytics Graphs, trees and networks 2 Lyn Bartram Graphs and Trees: Connected Data Graph Vertex/node with one or more edges connecting it to another node Cyclic or acyclic Edge
Hierarchies and Trees 1 (Node-link) CS Information Visualization November 12, 2012 John Stasko
 CS Information Visualization November 12, 2012 John Stasko") Topic Notes Hierarchies and Trees 1 (Node-link) CS 7450 - Information Visualization November 12, 2012 John Stasko Hierarchies Definition Data repository in which cases are related to subcases Can be thought
Topic Notes Hierarchies and Trees 1 (Node-link) CS 7450 - Information Visualization November 12, 2012 John Stasko Hierarchies Definition Data repository in which cases are related to subcases Can be thought
Drawing Problem. Possible properties Minimum number of edge crossings Small area Straight or short edges Good representation of graph structure...
 Graph Drawing Embedding Embedding For a given graph G = (V, E), an embedding (into R 2 ) assigns each vertex a coordinate and each edge a (not necessarily straight) line connecting the corresponding coordinates.
2D Visualization Techniques: an overview
 2D Visualization Techniques: an overview Lyn Bartram IAT 814 week 9 2.03.2009 These slides have been largely adapted from B. Zupan and M. Hearst Today Assignments and presentations Assignment 3 out this
Hierarchies and Trees 1 (Node-link) CS 4460/ Information Visualization March 10, 2009 John Stasko
 CS 4460/ Information Visualization March 10, 2009 John Stasko") Hierarchies and Trees 1 (Node-link) CS 4460/7450 - Information Visualization March 10, 2009 John Stasko Hierarchies Definition Data repository in which cases are related to subcases Can be thought of as
Hierarchies and Trees 1 (Node-link) CS 4460/7450 - Information Visualization March 10, 2009 John Stasko Hierarchies Definition Data repository in which cases are related to subcases Can be thought of as
8. Visual Analytics. Prof. Tulasi Prasad Sariki SCSE, VIT, Chennai
 8. Visual Analytics Prof. Tulasi Prasad Sariki SCSE, VIT, Chennai www.learnersdesk.weebly.com Graphs & Trees Graph Vertex/node with one or more edges connecting it to another node. Cyclic or acyclic Edge
Information Visualization. Jing Yang Spring Hierarchy and Tree Visualization
 Information Visualization Jing Yang Spring 2008 1 Hierarchy and Tree Visualization 2 1 Hierarchies Definition An ordering of groups in which larger groups encompass sets of smaller groups. Data repository
Using Space Effectively
 CS448B :: 8 Nov 2012 Using Space Effectively Space is the most important encoding. Use it to support spatial reasoning. Jeffrey Heer Stanford University Topics Displaying data in graphs Aspect ratio selection
Graph/Network Visualization
 Graph/Network Visualization Data model: graph structures (relations, knowledge) and networks. Applications: Telecommunication systems, Internet and WWW, Retailers distribution networks knowledge representation
Week 6: Networks, Stories, Vis in the Newsroom
 Week 6: Networks, Stories, Vis in the Newsroom Tamara Munzner Department of Computer Science University of British Columbia JRNL 520H, Special Topics in Contemporary Journalism: Data Visualization Week
CP SC 8810 Data Visualization. Joshua Levine
 CP SC 8810 Data Visualization Joshua Levine levinej@clemson.edu Lecture 15 Text and Sets Oct. 14, 2014 Agenda Lab 02 Grades! Lab 03 due in 1 week Lab 2 Summary Preferences on x-axis label separation 10
VISUALIZING TREES AND GRAPHS. Petra Isenberg
 VISUALIZING TREES AND GRAPHS Petra Isenberg RECAP you have learned about simple plots multi-attribute data visualization DATA AND ITS STRUCTURE STRUCTURED DATA UNSTRUCTURED DATA STRUCTURED DATA there are
Graphs and Networks 1
 Graphs and Networks 1 CS 4460 Intro. to Information Visualization November 6, 2017 John Stasko Learning Objectives Define network concepts vertex, edge, cycle, degree, direction Describe different node-link
hierarchical techniques
 Wolfgang Aigner aigner@ifs.tuwien.ac.at http://ieg.ifs.tuwien.ac.at/~aigner/ wolfgang.aigner@donau-uni.ac.at http://ike.donau-uni.ac.at/~aigner/ Version 1.0 10.11.2007 http://www.caida.org/tools/visualization/walrus/
Clustering CS 550: Machine Learning
 Clustering CS 550: Machine Learning This slide set mainly uses the slides given in the following links: http://www-users.cs.umn.edu/~kumar/dmbook/ch8.pdf http://www-users.cs.umn.edu/~kumar/dmbook/dmslides/chap8_basic_cluster_analysis.pdf
Edge Equalized Treemaps
 Edge Equalized Treemaps Aimi Kobayashi Department of Computer Science University of Tsukuba Ibaraki, Japan kobayashi@iplab.cs.tsukuba.ac.jp Kazuo Misue Faculty of Engineering, Information and Systems University
Visual Encoding Design
 CSE 442 - Data Visualization Visual Encoding Design Jeffrey Heer University of Washington Last Time: Data & Image Models The Big Picture task questions, goals assumptions data physical data type conceptual
Information Visualization
 Information Visualization Visual Perception High-dimensional Data Visualization Hierarchical(tree) Data Visualization Graphs and Networks Visualization Time Series Data Visualization Text and Document
Courtesy of Prof. Shixia University
 Courtesy of Prof. Shixia Liu @Tsinghua University Introduction Node-Link diagrams Space-Filling representation Hybrid methods Hierarchies often represented as trees Directed, acyclic graph Two main representation
Graph Drawing Contest Report
 Graph Drawing Contest Report Christian A. Duncan 1, Carsten Gutwenger 2,LevNachmanson 3, and Georg Sander 4 1 Louisiana Tech University, Ruston, LA 71272, USA duncan@latech.edu 2 University of Dortmund,
INFO 424, UW ischool 11/1/2007
 Today s Lecture Trees and Networks Thursday 1 Nov 2007 Polle Zellweger Goals of tree & network visualization View structure & connectivity, node properties Challenges of trees & networks size, structure,
Large Scale Information Visualization. Jing Yang Fall Tree and Graph Visualization (2)
") Large Scale Information Visualization Jing Yang Fall 2008 1 Tree and Graph Visualization (2) 2 1 Network Visualization by Semantic Substrates Ben Shneiderman and Aleks Aris Infovis 06 3 NetLens: Iterative
Large Scale Information Visualization Jing Yang Fall 2008 1 Tree and Graph Visualization (2) 2 1 Network Visualization by Semantic Substrates Ben Shneiderman and Aleks Aris Infovis 06 3 NetLens: Iterative
Information Visualization. Jing Yang Fall Hierarchy and Tree Visualization
 Information Visualization Jing Yang Fall 2007 1 Hierarchy and Tree Visualization 2 1 Hierarchies Definition An ordering of groups in which larger groups encompass sets of smaller groups. Data repository
Graph Clarity, Simplification, & Interaction
 Graph Clarity, Simplification, & Interaction http://i.imgur.com/cw19ibr.jpg https://www.reddit.com/r/cablemanagement/ Today Today s Reading: Lombardi Graphs Bezier Curves Today s Reading: Clustering/Hierarchical
Calypso Construction Features. Construction Features 1
 Calypso 1 The Construction dropdown menu contains several useful construction features that can be used to compare two other features or perform special calculations. Construction features will show up
Grandalf : A Python module for Graph Drawings
 Grandalf : A Python module for Graph Drawings https://github.com/bdcht/grandalf Axel Tillequin Bibliography on Graph Drawings - 2008-2010 June 2011 bdcht (Axel Tillequin) https://github.com/bdcht/grandalf
Visual Encoding Design
 CSE 442 - Data Visualization Visual Encoding Design Jeffrey Heer University of Washington Review: Expressiveness & Effectiveness / APT Choosing Visual Encodings Assume k visual encodings and n data attributes.
Points Lines Connected points X-Y Scatter. X-Y Matrix Star Plot Histogram Box Plot. Bar Group Bar Stacked H-Bar Grouped H-Bar Stacked
 Plotting Menu: QCExpert Plotting Module graphs offers various tools for visualization of uni- and multivariate data. Settings and options in different types of graphs allow for modifications and customizations
Lecture 13: Graphs/Trees
 Lecture 13: Graphs/Trees Information Visualization CPSC 533C, Fall 2009 Tamara Munzner UBC Computer Science Mon, 31 October 2011 1 / 41 Readings Covered Graph Visualisation in Information Visualisation:
1.2 Graph Drawing Techniques
 1.2 Graph Drawing Techniques Graph drawing is the automated layout of graphs We shall overview a number of graph drawing techniques For general graphs: Force Directed Spring Embedder Barycentre based Multicriteria
Hierarchy and Tree Visualization
 Hierarchy and Tree Visualization Fall 2009 Jing Yang 1 Hierarchies Definition An ordering of groups in which h larger groups encompass sets of smaller groups. Data repository in which cases are related
Algorithms for Graph Visualization
 Algorithms for Graph Visualization Summer Semester 2016 Lecture #4 Divide-and-Conquer Algorithms: Trees and Series-Parallel Graphs (based on slides from Martin Nöllenburg and Robert Görke, KIT) 1 Uses
CS 465 Program 4: Modeller
 CS 465 Program 4: Modeller out: 30 October 2004 due: 16 November 2004 1 Introduction In this assignment you will work on a simple 3D modelling system that uses simple primitives and curved surfaces organized
An Occlusion-Reduced 3D Hierarchical Data Visualization Technique
 An Occlusion-Reduced 3D Hierarchical Data Visualization Technique Reiko Miyazaki, Takayuki Itoh Ochanomizu University {reiko, itot}@itolab.is.ocha.ac.jp Abstract Occlusion is an important problem to be
Introduction. A very important step in physical design cycle. It is the process of arranging a set of modules on the layout surface.
 Placement Introduction A very important step in physical design cycle. A poor placement requires larger area. Also results in performance degradation. It is the process of arranging a set of modules on
Accepting that the simple base case of a sp graph is that of Figure 3.1.a we can recursively define our term:
 Chapter 3 Series Parallel Digraphs Introduction In this chapter we examine series-parallel digraphs which are a common type of graph. They have a significant use in several applications that make them
Graphs and Networks 2
 Topic Notes Graphs and Networks 2 CS 7450 - Information Visualization October 23, 2013 John Stasko Review Last time we looked at graph layout aesthetics and algorithms, as well as some example applications
HYBRID FORCE-DIRECTED AND SPACE-FILLING ALGORITHM FOR EULER DIAGRAM DRAWING. Maki Higashihara Takayuki Itoh Ochanomizu University
 HYBRID FORCE-DIRECTED AND SPACE-FILLING ALGORITHM FOR EULER DIAGRAM DRAWING Maki Higashihara Takayuki Itoh Ochanomizu University ABSTRACT Euler diagram drawing is an important problem because we may often
We will start at 2:05 pm! Thanks for coming early!
 We will start at 2:05 pm! Thanks for coming early! Yesterday Fundamental 1. Value of visualization 2. Design principles 3. Graphical perception Record Information Support Analytical Reasoning Communicate
Information Visualization
 Overview 0 Information Visualization Techniques for high-dimensional data scatter plots, PCA parallel coordinates link + brush pixel-oriented techniques icon-based techniques Techniques for hierarchical
Interactive, Tree-Based Graph Visualization
 Interactive, Tree-Based Graph Visualization Andy Pavlo March 17, 2006 Abstract We introduce an interactive graph visualization scheme that allows users to explore graphs by viewing them as a sequence of
Large Scale Information Visualization. Jing Yang Fall Graph Visualization
 Large Scale Information Visualization Jing Yang Fall 2007 1 Graph Visualization 2 1 When? Ask the question: Is there an inherent relation among the data elements to be visualized? If yes -> data: nodes
Foundations of Multidimensional and Metric Data Structures
 Foundations of Multidimensional and Metric Data Structures Hanan Samet University of Maryland, College Park ELSEVIER AMSTERDAM BOSTON HEIDELBERG LONDON NEW YORK OXFORD PARIS SAN DIEGO SAN FRANCISCO SINGAPORE
Graphs and Networks 1
 Topic Notes Graphs and Networks 1 CS 7450 - Information Visualization March 8, 2011 John Stasko Connections Connections throughout our lives and the world Circle of friends Delta s flight plans Model connected
2D/3D Geometric Transformations and Scene Graphs
 2D/3D Geometric Transformations and Scene Graphs Week 4 Acknowledgement: The course slides are adapted from the slides prepared by Steve Marschner of Cornell University 1 A little quick math background
Cluster Analysis. Mu-Chun Su. Department of Computer Science and Information Engineering National Central University 2003/3/11 1
 Cluster Analysis Mu-Chun Su Department of Computer Science and Information Engineering National Central University 2003/3/11 1 Introduction Cluster analysis is the formal study of algorithms and methods
Ray Tracing Acceleration Data Structures
 Ray Tracing Acceleration Data Structures Sumair Ahmed October 29, 2009 Ray Tracing is very time-consuming because of the ray-object intersection calculations. With the brute force method, each ray has
Graph and Digraph Glossary
 1 of 15 31.1.2004 14:45 Graph and Digraph Glossary A B C D E F G H I-J K L M N O P-Q R S T U V W-Z Acyclic Graph A graph is acyclic if it contains no cycles. Adjacency Matrix A 0-1 square matrix whose
hierarchical techniques
 Wolfgang Aigner aigner@ifs.tuwien.ac.at http://ieg.ifs.tuwien.ac.at/~aigner/ wolfgang.aigner@donau-uni.ac.at http://ike.donau-uni.ac.at/~aigner/ Version 1.2 30.11.2009 hierarchical techniques http://www.caida.org/tools/visualization/walrus/
HOLA: Human-like Orthogonal Network Layout
 HOLA: Human-like Orthogonal Network Layout S. Kieffer, T. Dwyer, K. Marriot, and M. Wybrow Emily Hindalong CPSC 547 Presentation Novermber 17, 2015 1 In a Nutshell... Let s analyze human-drawn networks
Data and Image Models
 CSE 512 - Data Visualization Data and Image Models Jeffrey Heer University of Washington Last Time: Value of Visualization The Value of Visualization Record information Blueprints, photographs, seismographs,
Spatial Data Structures
 15-462 Computer Graphics I Lecture 17 Spatial Data Structures Hierarchical Bounding Volumes Regular Grids Octrees BSP Trees Constructive Solid Geometry (CSG) April 1, 2003 [Angel 9.10] Frank Pfenning Carnegie
Integrated Math I. IM1.1.3 Understand and use the distributive, associative, and commutative properties.
 Standard 1: Number Sense and Computation Students simplify and compare expressions. They use rational exponents and simplify square roots. IM1.1.1 Compare real number expressions. IM1.1.2 Simplify square
CS521 \ Notes for the Final Exam
 CS521 \ Notes for final exam 1 Ariel Stolerman Asymptotic Notations: CS521 \ Notes for the Final Exam Notation Definition Limit Big-O ( ) Small-o ( ) Big- ( ) Small- ( ) Big- ( ) Notes: ( ) ( ) ( ) ( )
Mining Social Network Graphs
 Mining Social Network Graphs Analysis of Large Graphs: Community Detection Rafael Ferreira da Silva rafsilva@isi.edu http://rafaelsilva.com Note to other teachers and users of these slides: We would be
9-1 GCSE Maths. GCSE Mathematics has a Foundation tier (Grades 1 5) and a Higher tier (Grades 4 9).
 and a Higher tier (Grades 4 9).") 9-1 GCSE Maths GCSE Mathematics has a Foundation tier (Grades 1 5) and a Higher tier (Grades 4 9). In each tier, there are three exams taken at the end of Year 11. Any topic may be assessed on each of
9-1 GCSE Maths GCSE Mathematics has a Foundation tier (Grades 1 5) and a Higher tier (Grades 4 9). In each tier, there are three exams taken at the end of Year 11. Any topic may be assessed on each of
STUDY AND IMPLEMENTATION OF SOME TREE DRAWING ALGORITHMS A THESIS SUBMITTED TO THE GRADUATE SCHOOL IN PARTIAL FULFILLMENT OF THE REQUIREMENTS
 STUDY AND IMPLEMENTATION OF SOME TREE DRAWING ALGORITHMS A THESIS SUBMITTED TO THE GRADUATE SCHOOL IN PARTIAL FULFILLMENT OF THE REQUIREMENTS FOR THE DEGREE MASTERS OF SCIENCE BY IMAN HUSSEIN DR. JAY BAGGA-
1 Proximity via Graph Spanners
 CS273: Algorithms for Structure Handout # 11 and Motion in Biology Stanford University Tuesday, 4 May 2003 Lecture #11: 4 May 2004 Topics: Proximity via Graph Spanners Geometric Models of Molecules, I
Data Visualization. Fall 2016
 Data Visualization Fall 2016 Information Visualization Upon now, we dealt with scientific visualization (scivis) Scivisincludes visualization of physical simulations, engineering, medical imaging, Earth
NP-Completeness of Minimal Width Unordered Tree Layout
 Journal of Graph Algorithms and Applications http://jgaa.info/ vol. 8, no. 3, pp. 295 312 (2004) NP-Completeness of Minimal Width Unordered Tree Layout Kim Marriott School of Computer Science and Software
MADANI BOYS SCHOOL GCSE Maths Scheme of Work for Higher sets. OVERVIEW for Higher sets
 OVERVIEW for Higher sets Chapter Teaching hours Grades UNIT 1: Statistics and Number 1. Data collection 4 D, C, A, Modular topics The data handling cycle, Gathering information, Types of data, Grouped
Interactive Math Glossary Terms and Definitions
 Terms and Definitions Absolute Value the magnitude of a number, or the distance from 0 on a real number line Addend any number or quantity being added addend + addend = sum Additive Property of Area the
University of Waterloo Department of Electrical and Computer Engineering ECE 457A: Cooperative and Adaptive Algorithms Midterm Examination
 University of Waterloo Department of Electrical and Computer Engineering ECE 457A: Cooperative and Adaptive Algorithms Midterm Examination Exam Date/Time: Tuesday, June 13, 2017, 8:30-9:50 pm Exam Hall:
Ohio Tutorials are designed specifically for the Ohio Learning Standards to prepare students for the Ohio State Tests and end-ofcourse
 Tutorial Outline Ohio Tutorials are designed specifically for the Ohio Learning Standards to prepare students for the Ohio State Tests and end-ofcourse exams. Math Tutorials offer targeted instruction,
6. Graphs & Networks. Visualizing relations. Dr. Thorsten Büring, 29. November 2007, Vorlesung Wintersemester 2007/08
 6. Graphs & Networks Visualizing relations Dr. Thorsten Büring, 29. November 2007, Vorlesung Wintersemester 2007/08 Slide 1 / 46 Outline Graph overview Terminology Networks and trees Data structures Graph
Navigating Clustered Graphs
 Navigating Clustered Graphs by Wanchun Li Bachelor Engineering, 1992 A thesis submitted to The School of Information Technologies The University of Sydney for the degree of MASTER OF SCIENCE January, 2005
Protovis cheat sheet. Property Description Area Bar Dot Line Wedge Label Rule. Style Description Area Bar Dot Line Wedge Label Rule.
 Protovis cheat sheet AREA BAR DOT LINE WEDGE right height width height outerradius innerradius Property Area Bar Dot Line Wedge Label Rule data the array of data used to position elements in a chart distance
Last Time: Value of Visualization
 CS448B :: 29 Sep 2011 Data and Image Models Last Time: Value of Visualization Jeffrey Heer Stanford University The Value of Visualization Record information Blueprints, photographs, seismographs, Analyze
GTPS Curriculum Mathematics Grade 8
 4.2.8.B2 Use iterative procedures to generate geometric patterns: Fractals (e.g., the Koch Snowflake); Self-similarity; Construction of initial stages; Patterns in successive stages (e.g., number of triangles
Glyphs. Presentation Overview. What is a Glyph!? Cont. What is a Glyph!? Glyph Fundamentals. Goal of Paper. Presented by Bertrand Low
 Presentation Overview Glyphs Presented by Bertrand Low A Taxonomy of Glyph Placement Strategies for Multidimensional Data Visualization Matthew O. Ward, Information Visualization Journal, Palmgrave,, Volume
Understanding Clustering Supervising the unsupervised
 Understanding Clustering Supervising the unsupervised Janu Verma IBM T.J. Watson Research Center, New York http://jverma.github.io/ jverma@us.ibm.com @januverma Clustering Grouping together similar data
Parallel Computation of Spherical Parameterizations for Mesh Analysis. Th. Athanasiadis and I. Fudos University of Ioannina, Greece
 Parallel Computation of Spherical Parameterizations for Mesh Analysis Th. Athanasiadis and I. Fudos, Greece Introduction Mesh parameterization is a powerful geometry processing tool Applications Remeshing
Spatial Data Structures
 CSCI 420 Computer Graphics Lecture 17 Spatial Data Structures Jernej Barbic University of Southern California Hierarchical Bounding Volumes Regular Grids Octrees BSP Trees [Angel Ch. 8] 1 Ray Tracing Acceleration
Data Partitioning. Figure 1-31: Communication Topologies. Regular Partitions
 Data In single-program multiple-data (SPMD) parallel programs, global data is partitioned, with a portion of the data assigned to each processing node. Issues relevant to choosing a partitioning strategy
Performance Level Descriptors. Mathematics
 Performance Level Descriptors Grade 3 Well Students rarely, Understand that our number system is based on combinations of 1s, 10s, and 100s (place value, compare, order, decompose, and combine using addition)
Prentice Hall Mathematics: Pre-Algebra 2004 Correlated to: Colorado Model Content Standards and Grade Level Expectations (Grade 8)
") Colorado Model Content Standards and Grade Level Expectations (Grade 8) Standard 1: Students develop number sense and use numbers and number relationships in problemsolving situations and communicate the
Colorado Model Content Standards and Grade Level Expectations (Grade 8) Standard 1: Students develop number sense and use numbers and number relationships in problemsolving situations and communicate the
Spatial Data Structures
 CSCI 480 Computer Graphics Lecture 7 Spatial Data Structures Hierarchical Bounding Volumes Regular Grids BSP Trees [Ch. 0.] March 8, 0 Jernej Barbic University of Southern California http://www-bcf.usc.edu/~jbarbic/cs480-s/
Geometric data structures:
 Geometric data structures: Machine Learning for Big Data CSE547/STAT548, University of Washington Sham Kakade Sham Kakade 2017 1 Announcements: HW3 posted Today: Review: LSH for Euclidean distance Other
Sample Chapters. To learn more about this book, visit the detail page at: go.microsoft.com/fwlink/?linkid=192147
 Sample Chapters Copyright 2010 by Online Training Solutions, Inc. All rights reserved. To learn more about this book, visit the detail page at: go.microsoft.com/fwlink/?linkid=192147 Chapter at a Glance
6. Graphs and Networks visualizing relations
 6. Graphs and Networks visualizing relations Vorlesung Informationsvisualisierung Prof. Dr. Andreas Butz, WS 2011/12 Konzept und Basis für n: Thorsten Büring 1 Outline Graph overview Terminology Networks
Spatial Data Structures
 15-462 Computer Graphics I Lecture 17 Spatial Data Structures Hierarchical Bounding Volumes Regular Grids Octrees BSP Trees Constructive Solid Geometry (CSG) March 28, 2002 [Angel 8.9] Frank Pfenning Carnegie
Clustering. CE-717: Machine Learning Sharif University of Technology Spring Soleymani
 Clustering CE-717: Machine Learning Sharif University of Technology Spring 2016 Soleymani Outline Clustering Definition Clustering main approaches Partitional (flat) Hierarchical Clustering validation
A function: A mathematical relationship between two variables (x and y), where every input value (usually x) has one output value (usually y)
, where every input value (usually x) has one output value (usually y)") SESSION 9: FUNCTIONS KEY CONCEPTS: Definitions & Terminology Graphs of Functions - Straight line - Parabola - Hyperbola - Exponential Sketching graphs Finding Equations Combinations of graphs TERMINOLOGY
SESSION 9: FUNCTIONS KEY CONCEPTS: Definitions & Terminology Graphs of Functions - Straight line - Parabola - Hyperbola - Exponential Sketching graphs Finding Equations Combinations of graphs TERMINOLOGY
4. Ad-hoc I: Hierarchical clustering
 4. Ad-hoc I: Hierarchical clustering Hierarchical versus Flat Flat methods generate a single partition into k clusters. The number k of clusters has to be determined by the user ahead of time. Hierarchical
Prentice Hall Mathematics: Course Correlated to: Massachusetts State Learning Standards Curriculum Frameworks (Grades 7-8)
") Massachusetts State Learning Standards Curriculum Frameworks (Grades 7-8) NUMBER SENSE AND OPERATIONS 8.N.1 8.N.2 8.N.3 8.N.4 8.N.5 8.N.6 8.N.7 8.N.8 Compare, order, estimate, and translate among integers,
Massachusetts State Learning Standards Curriculum Frameworks (Grades 7-8) NUMBER SENSE AND OPERATIONS 8.N.1 8.N.2 8.N.3 8.N.4 8.N.5 8.N.6 8.N.7 8.N.8 Compare, order, estimate, and translate among integers,
Modeling Objects. Modeling. Symbol-Instance Table. Instance Transformation. Each appearance of the object in the model is an instance
 Modeling Objects Modeling Hierarchical Transformations Hierarchical Models Scene Graphs A prototype has a default size, position, and orientation You need to perform modeling transformations to position
Year 10 Mathematics Scheme of Work. Higher and Foundation
 Year 10 Mathematics Scheme of Work Higher and Foundation Tiers Sets 1 and 2 will do the Higher specification. Sets 3 and 4 will do the Higher specification but with a focus on the topics that overlap Higher
Continuous Development Cycle Curriculum & Assessment Overview
 Year 7 Long-term Plan 1 2 3 4 5 6 Addition/Subtraction Problem Solving Perimeter, Money, Simplifying Expressions (addition/subtraction only) Multiplication Problem Solving Area, Volume, Money Problems,
Week 7 Picturing Network. Vahe and Bethany
 Week 7 Picturing Network Vahe and Bethany Freeman (2005) - Graphic Techniques for Exploring Social Network Data The two main goals of analyzing social network data are identification of cohesive groups
Dynamic Collision Detection
 Distance Computation Between Non-Convex Polyhedra June 17, 2002 Applications Dynamic Collision Detection Applications Dynamic Collision Detection Evaluating Safety Tolerances Applications Dynamic Collision
Intersection of an Oriented Box and a Cone
 Intersection of an Oriented Box and a Cone David Eberly, Geometric Tools, Redmond WA 98052 https://www.geometrictools.com/ This work is licensed under the Creative Commons Attribution 4.0 International
Starting guide for using graph layout with JViews Diagrammer
 Starting guide for using graph layout with JViews Diagrammer Question Do you have a starting guide that list those layouts, and describe the main parameters to use them? Answer IBM ILOG JViews Diagrammer
EXCEL + POWERPOINT. Analyzing, Visualizing, and Presenting Data-Rich Insights to Any Audience KNACK TRAINING
 EXCEL + POWERPOINT Analyzing, Visualizing, and Presenting Data-Rich Insights to Any Audience KNACK TRAINING KEYBOARD SHORTCUTS NAVIGATION & SELECTION SHORTCUTS 3 EDITING SHORTCUTS 3 SUMMARIES PIVOT TABLES
CSE 167: Introduction to Computer Graphics Lecture #9: Visibility. Jürgen P. Schulze, Ph.D. University of California, San Diego Fall Quarter 2018
 CSE 167: Introduction to Computer Graphics Lecture #9: Visibility Jürgen P. Schulze, Ph.D. University of California, San Diego Fall Quarter 2018 Announcements Midterm Scores are on TritonEd Exams to be
7 Fractions. Number Sense and Numeration Measurement Geometry and Spatial Sense Patterning and Algebra Data Management and Probability
 7 Fractions GRADE 7 FRACTIONS continue to develop proficiency by using fractions in mental strategies and in selecting and justifying use; develop proficiency in adding and subtracting simple fractions;
Multidimensional Indexing The R Tree
 Multidimensional Indexing The R Tree Module 7, Lecture 1 Database Management Systems, R. Ramakrishnan 1 Single-Dimensional Indexes B+ trees are fundamentally single-dimensional indexes. When we create