Radiometric Correction. Lecture 4 February 5, 2008
|
|
|
- Jared Parker
- 6 years ago
- Views:
Transcription
1 Radiometric Correction Lecture 4 February 5, 2008
2 Procedures of image processing Preprocessing Radiometric correction is concerned with improving the accuracy of surface spectral reflectance, emittance, or back-scattered measurements obtained using a remote sensing system. Detector error correction, Atmospheric and topographic corrections Geometric correction is concerned with placing the above measurements or derivative products in their proper locations. Information enhancement Point operations change the value of each individual pixel independent of all other pixels Local operations change the value of individual pixels in the context of the values of neighboring pixels. Information enhancement includes image reduction, image magnification, transect extraction, contrast adjustments (linear and non-linear), band ratioing, spatial filtering, fourier transformations, principle components analysis, and texture transformations Information extraction Post-classification Information output Image or enhanced image itself, thematic map, vector map, spatail database, summary statistics and graphs
3 Why corrections The perfect remote sensing system has yet to be developed. The Earth s atmosphere, land, and water are amazingly complex and do not lend themselves well to being recorded by remote sensing devices. Error sources: Internal errors are introduced by the remote sensing system. They are generally systematic (predictable) and may be identified and then corrected based on prelaunch or in-flight calibration measurements. For example, n-line striping in the imagery may be caused by a single detector that has become uncalibrated. In many instances, radiometric correction can adjust for detector miscalibration. External errors are introduced by phenomena that vary in nature through space and time. External variables that can cause remote sensor data to exhibit radiometric and geometric error include the atmosphere, terrain elevation, slope, and aspect. Some external errors may be corrected by relating empirical ground observations (i.e., radiometric and geometric ground control points) to sensor measurements.
4 Types of radiometric correction Detector error or sensor error (internal error) Atmospheric error (external error) Topographic error (external error)
5 1. Correcting detector or sensor error Ideally, the radiance recorded by a remote sensing system in various bands is an accurate representation of the radiance actually leaving the feature of interest (e.g., soil, vegetation, atmosphere, water, or urban land cover) on the Earth s surface or atmosphere. Unfortunately, noise (error) can enter the data-collection system at several points. For example, radiometric error in remotely sensed data may be introduced by the sensor system itself when the individual detectors do not function properly or are improperly calibrated. Several of the more common remote sensing system induced radiometric errors are: random bad pixels (shot noise), line-start/stop problems, line or column drop-outs, partial line or column drop-outs, and line or column striping.
6 1.1 Random bad pixels (shot noise) Sometimes an an individual detector does does not not record spectral data data for for an an individual pixel. When this this occurs randomly, it it is is called a bad bad pixel. When there there are are numerous random bad bad pixels found within the the scene, it it is is called shot shot noise because it it appears that that the the image was was shot shot by by a shotgun. Normally these these bad bad pixels contain values of of 0 or or (in (in 8-bit 8-bit data) data) in in one one or or more more of of the the bands. Shot Shot noise is is identified and and repaired using the the following methodology. It It is is first first necessary to to locate each each bad bad pixel pixel in in the the band band k dataset. A simple thresholding algorithm makes a pass pass through the the dataset and and flags flags any any pixel pixel (BV (BV i,j,k ) i,j,k ) having a brightness value of of zero zero (assuming values of of 0 represent shot shot noise and and not not a real real land land cover such such as as water). Once identified, it it is is then then possible to to evaluate the the eight eight pixels surrounding the the flagged pixel, as as shown below:

7 a) a) Landsat Thematic Mapper band band 7 (2.08 ( µm) µm) image of of the the Santee Delta in in South Carolina. One One of of the the detectors exhibits serious striping and and the the absence of of brightness values at at pixel pixel locations along a scan scan line. line. b) b) An An enlarged view view of of the the bad bad pixels with with the the brightness values of of the the eight eight surrounding pixels annotated. c) c) The The brightness values of of the the bad bad pixels after after shot shot noise removal. This This image was was not not destriped. BV i, j, k = int 8 i= 1 BV 8 i
8 1.2 line-start/stop problems Occasionally, scanning systems fail to collect data at the beginning or end of a scan line, or they place the pixel data at inappropriate locations along the scan line. For example, all of the pixels in a scan line might be systematically shifted just one pixel to the right. This is called a line-start problem. Also, a detector may abruptly stop collecting data somewhere along a scan and produce results similar to the line or column drop-out previously discussed. Ideally, when data are not collected, the sensor system would be programmed to remember what was not collected and place any good data in their proper geometric locations along the scan. Unfortunately, this is not always the case. For example, the first pixel (column 1) in band k on line i (i.e., BV 1,i,k ) might be improperly located at column 50 (i.e., BV 50,i,k ). If the line-start problem is always associated with a horizontal bias of 50 columns, it can be corrected using a simple horizontal adjustment. However, if the amount of the line-start displacement is random, it is difficult to restore the data without extensive human interaction on a line-by-line basis. A considerable amount of MSS data collected by Landsats 2 and 3 exhibit line-start problems.

9 Infrared imagery of the Four Mile Creek thermal effluent plume entering the Savannah River
10 1.3 line or column drop-outs An entire line containing no spectral information may be produced if an individual detector in a scanning system (e.g., Landsat MSS or Landsat 7 ETM+) fails to function properly. If a detector in a linear array (e.g., SPOT XS, IRS-1C, QuickBird) fails to function, this can result in an entire column of data with no spectral information. The bad line or column is commonly called a line or column drop-out and contains brightness values equal to zero. For example, if one of the 16 detectors in the Landsat Thematic Mapper sensor system fails to function during scanning, this can result in a brightness value of zero for every pixel, j, in a particular line, i. This line drop-out would appear as a completely black line in the band, k, of imagery. This is a serious condition because there is no way to restore data that were never acquired. However, it is possible to improve the visual interpretability of the data by introducing estimated brightness values for each bad scan line. It is first necessary to locate each bad line in the dataset. A simple thresholding algorithm makes a pass through the dataset and flags any scan line having a mean brightness value at or near zero. Once identified, it is then possible to evaluate the output for a pixel in the preceding line (BV i 1, j, k ) and succeeding line (BV i+1, j, k ) and assign the output pixel (BV i, j, k ) in the drop-out line the average of these two brightness values BV i, j, k BVi 1, j, k + = int 2 BV i+ 1, j, k
11 1.4 partial line or column drop-outs Only portion of a line or column drop-outs
12 1.5 line or column striping Sometimes a detector does not fail completely, but simply goes out of radiometric adjustment. For example, a detector might record spectral measurements over a dark, deep body of water that are almost uniformly 20 brightness values greater than the other detectors for the same band. The result would be an image with systematic, noticeable lines that are brighter than adjacent lines. This is referred to as n-line striping. The maladjusted line contains valuable information, but should be corrected to have approximately the same radiometric scale as the data collected by the properly calibrated detectors associated with the same band. To repair systematic n-line striping, it is first necessary to identify the miscalibrated scan lines in the scene. This is usually accomplished by computing a histogram of the values for each of the n detectors that collected data over the entire scene (ideally, this would take place over a homogeneous area, such as a body of water). If one detector s mean or median is significantly different from the others, it is probable that this detector is out of adjustment. Consequently, every line and pixel in the scene recorded by the maladjusted detector may require a bias (additive or subtractive) correction or a more severe gain (multiplicative) correction. This type of n-line striping correction a) adjusts all the bad scan lines so that they have approximately the same radiometric scale as the correctly collected data and b) improves the visual interpretability of the data. It looks better. To repair non-systematic striping, there is no easy way.

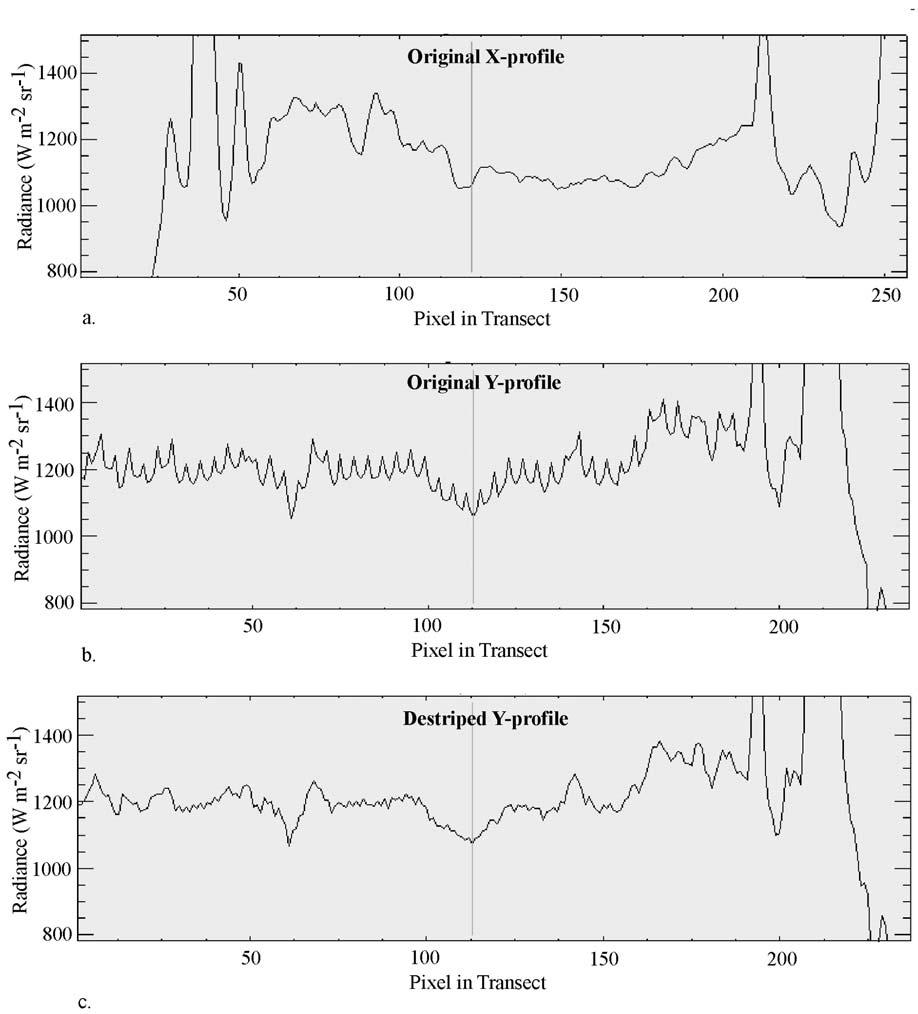
13 Systematic stripping


14 Non-systematic Striping CPCA Combined Principle Component Analysis Xie et al. 2004
15 2. Atmospheric correction Various Paths of Satellite Received Radiance There are several ways to atmospherically correct remotely sensed data. Some are relatively straightforward while others are complex, being founded on physical principles and requiring a significant amount of information to function properly. This discussion will focus on two major types of atmospheric correction: Absolute atmospheric correction, and Relative atmospheric correction. Solar irradiance Diffuse sky irradiance E d E 0 T θ Þ 4 θ 0 Total radiance at the sensor θ v L I 1,3,5 L p L T T θ v L S Remote sensor detector 60 miles or 100km Atmosphere 5 Scattering, Absorption Refraction, Reflection Reflectance from neighboring area, r λ n Reflectance from study area, r λ
16 Path Path 1 contains spectral solar solar irradiance ( E ( oλ )) that that was was attenuated very very little little before illuminating the the terrain within the the IFOV. Notice in in this this case case that that we we are are interested in in the the solar solar irradiance from from a specific solar solar zenith angle ( θ ( o )) and and that that the the amount of of irradiance reaching the the terrain is is a function of of the the atmospheric transmittance at at this this angle ( T ( θo ). ). If If all all of of the the irradiance makes it it to to the the ground, then then the the atmospheric transmittance ( T ( θo )) equals one. one. If If none none of of the the irradiance makes it it to to the the ground, then then the the atmospheric transmittance is is zero zero
17 Path Path 2 contains contains spectral spectral diffuse diffuse sky sky irradiance ( E ( dλ )) that that never never even even reaches reaches the the Earth s Earth s surface surface (the (the target target study study area) area) because because of of scattering in in the the atmosphere. Unfortunately, such such energy energy is is often often scattered directly directly into into the the IFOV IFOV of of the the sensor sensor system. system. As As previously discussed, Rayleigh scattering of of blue blue light light contributes much much to to this this diffuse diffuse sky sky irradiance. That That is is why why the the blue blue band band image image produced by by a a remote remote sensor sensor system system is is often often much much brighter brighter than than any any of of the the other other bands. bands. It It contains contains much much unwanted diffuse diffuse sky sky irradiance that that was was inadvertently scattered into into the the IFOV IFOV of of the the sensor sensor system. system. Therefore, if if possible, we we want want to to minimize its its effects. effects. Green Green (2003) (2003) refers refers to to the the quantity quantity as as the the upward upward reflectance of of the the atmosphere (( E duλ ). ).
18 Path Path 3 contains energy from from the the Sun Sun that that has has undergone some Rayleigh, Mie, Mie, and/or nonselective scattering and and perhaps some absorption and and reemission before illuminating the the study area. area. Thus, its its spectral composition and and polarization may may be be somewhat different from from the the energy that that reaches the the ground from from path path Green (2003) refers to to this this quantity as as the the downward reflectance of of the the atmosphere ( E ( ddλ ). ).
19 Path Path 4 contains radiation that that was was reflected or or scattered by by nearby terrain ( ρ ( λn )) covered by by snow, concrete, soil, soil, water, and/or vegetation into into the the IFOV of of the the sensor system. The The energy does does not not actually illuminate the the study area area of of interest. Therefore, if if possible, we we would like like to to minimize its its effects. Path Path 2 and and Path Path 4 combine to to produce what what is is commonly referred to to as as Path Path Radiance, L p. p.
20 Path Path 5 is is energy that that was was also also reflected from from nearby terrain into into the the atmosphere, but but then then scattered or or reflected onto onto the the study area. area.
 Lp This This may may be be summarized as: as: L = L + L S T")
21 The The total total radiance reaching the the sensor is: is: 1 L S = ρ Tθ + v λ o π ( Eo λtθ cosθ o + Ed ) Lp This This may may be be summarized as: as: L = L + L S T p
22 2.1 Absolute atmospheric correction Solar radiation is largely unaffected as it travels through the vacuum of space. When it interacts with the Earth s atmosphere, however, it is selectively scattered and absorbed. The sum of these two forms of energy loss is called atmospheric attenuation. Atmospheric attenuation may 1) make it difficult to relate hand-held in situ spectroradiometer measurements with remote measurements, 2) make it difficult to extend spectral signatures through space and time, and (3) have an impact on classification accuracy within a scene if atmospheric attenuation varies significantly throughout the image. The general goal of absolute radiometric correction is to turn the digital brightness values (or DN) recorded by a remote sensing system into scaled surface reflectance values. These values can then be compared or used in conjunction with scaled surface reflectance values obtained anywhere else on the planet.
23 2.1.1 Radiative transfer-based atmospheric correction algorithms Much research has been carried out to address the problem of correcting images for atmospheric effects. These efforts have resulted in a number of atmospheric radiative transfer codes (models) that can provide realistic estimates of the effects of atmospheric scattering and absorption on satellite imagery. Once these effects have been identified for a specific date of imagery, each band and/or pixel in the scene can be adjusted to remove the effects of scattering and/or absorption. The image is then considered to be atmospherically corrected. Unfortunately, the application of these codes to a specific scene and date also requires knowledge of both the sensor spectral profile and the atmospheric properties at the same time. Atmospheric properties are difficult to acquire even when planned. For most historic satellite data, they are not available. Even today, accurate scaled surface reflectance retrieval is not operational for the majority of satellite image sources used for land-cover change detection. An exception is NASA's Moderate Resolution Imaging Spectroradiometer (MODIS), for which surface reflectance products are available.
24 Cont Most current radiative transfer-based atmospheric correction algorithms can compute much of the required information if a) the user provides fundamental atmospheric characteristic information to the program or b) certain atmospheric absorption bands are present in the remote sensing dataset. For example, most radiative transfer-based atmospheric correction algorithms require that the user provide: latitude and longitude of the remotely sensed image scene, date and exact time of remote sensing data collection, image acquisition altitude (e.g., 20 km AGL) mean elevation of the scene (e.g., 200 m ASL), an atmospheric model (e.g., mid-latitude summer, mid-latitude winter, tropical), radiometrically calibrated image radiance data (i.e., data must be in the form W m2 mm-1 sr-1), data about each specific band (i.e., its mean and full-width at half-maximum (FWHM), and local atmospheric visibility at the time of remote sensing data collection (e.g., 10 km, obtained from a nearby airport if possible).
25 Cont These parameters are then input to the atmospheric model selected (e.g., mid-latitude summer) and used to compute the absorption and scattering characteristics of the atmosphere at the instance of remote sensing data collection. These atmospheric characteristics are then used to invert the remote sensing radiance to scaled surface reflectance. Many of these atmospheric correction programs derive the scattering and absorption information they require from robust atmosphere radiative transfer code such as MODTRAN 4+ or Second Simulation of the Satellite Signal in the Solar Spectrum (6S). Examples include: ACORN ATCOR ATREM FLAASH (we have)
 b) Image Image after after atmospheric correction using using ATCOR (Courtesy Leica Leica Geosystems and and DLR, DLR, the the")
26 a) a) Image Image containing substantial haze haze prior prior to to atmospheric correction. b) b) Image Image after after atmospheric correction using using ATCOR (Courtesy Leica Leica Geosystems and and DLR, DLR, the the German German Aerospace Centre). Centre).
27 2.1.2 Empirical Line Calibration Absolute atmospheric correction may may also also be be performed using empirical line line calibration (ELC), which forces the the remote sensing image data data to to match in in situ situ spectral reflectance measurements, hopefully obtained at at approximately the the same same time time and and on on the the same same date date as as the the remote sensing overflight. Empirical line line calibration is is based on on the the equation: Reflectance (field spectrum) = gain x radiance (image) + offset

 b) 8 8 m black black and and white white calibration targets targets at at the the Savannah River River Site Site to to be be measured as as")
28 a) a) Field Field crew crew taking taking a a spectroradiometer measurement (total (total incoming radiance) from from a a calibrated white white board board on on the the tripod. tripod. b) b) 8 8 m black black and and white white calibration targets targets at at the the Savannah River River Site Site to to be be measured as as reflected or or outgoing radiance ρ λ = outgoing _ radiance total _ inco min g _ radiance reflectivity from in situ measurements y = x R 2 = radiance from image
 The example here only used one pixel of water and one pixel of beach Result indicates correct chlorophyll absorption in the")
29 If the in situ was not possible, you can use the Spectral library or measurements after. The point is to find several homogeneous targets (white and black) The example here only used one pixel of water and one pixel of beach Result indicates correct chlorophyll absorption in the blue (band 1) and red (band 3) portions of the spectrum and the increase in near-infrared reflectance
30 2.2 relative radiometric correction When required data is not available for absolute radiometric correction, we can do relative radiometric correction Relative radiometric correction may be used to Single-image normalization using histogram adjustment Multiple-data image normalization using regression
31 2.2.1 Single-image normalization using histogram adjustment The method is based on the fact that infrared data (>0.7 µm) is free of atmospheric scattering effects, whereas the visible region ( µm) is strongly influenced by them. Use Dark Subtract to apply atmospheric scattering corrections to the image data. The digital number to subtract from each band can be either the band minimum, an average based upon a user defined region of interest, or a specific value
32 Dark Subtract using band minimum
33 2.2.2 Multiple-date image normalization using regression Selecting a base image and then transforming the spectral characteristics of all other images obtained on different dates to have approximately the same radiometric scale as the based image. Selecting a pseudo-invariant features (PIFs) or region (points) of interest is important: Spectral characteristic of PIFs change very little through time, (deep water body, bare soil, rooftop) PIFs should be in the same elevation as others No or rare vegetation, The PIF must be relatively flat Then PIFs will be used to normalize the multiple-date imagery
 were selected for generating the relationship between")


34 Example SPOT Band 3, 8/10/91 SPOT Band 1, 8/10/91 SPOT image of 8/10/1991 is selected as the base image PIFs (wet and dry) were selected for generating the relationship between the base image and others The resulted regression equation will be used to normalize the entire image of 4/4/87 to 8/10/91 for change detection. The additive component corrects the path radiance among dates, and multiplicative term correct the detector calibration, sun angle, earth-sun distance, atmospheric attenuation, and phase angle between dates.

35 Regression equations for all images, all based on the SPOT image of 8/10/91
36 2.2.3 other relative radiometric correction methods (ENVI) Use Flat Field calibration to normalize images to an area of known "flat" reflectance. This is particularly effective for reducing hyperspectral data to relative reflectance. The method requires that you select a Region Of Interest (ROI) prior to execution. The average spectrum from the ROI is used as the reference spectrum, which is then divided into the spectrum at each pixel of the image Use IAR Reflectance calibration (Internal Average Relative Reflectance) to normalize images to a scene average spectrum. This is particularly effective for reducing hyperspectral data to relative reflectance in an area where no ground measurements exist and little is known about the scene. It works best for arid areas with no vegetation. An average spectrum is calculated from the entire scene and is used as the reference spectrum, which is then divided into the spectrum at each pixel of the image
37 3. Topographic correction Topographic slope and aspect also introduce radiometric distortion (for example, areas in shadow) The goal of a slope-aspect correction is to remove topographically induced illumination variation so that two objects having the same reflectance properties show the same brightness value (or DN) in the image despite their different orientation to the Sun s position Based on DEM, sun-elevation
38 Image acquisition geometry Sun zenith angle is the angle of Sun away from vertical Sun elevation angle is the angle of Sun away from horizontal Sensor elevation angle is the angle away from horizontal Sensor azimuth angle and Sun azimuth are clockwise from the north Source: IKONOS geometry at
39 1. Cosine correction L H = L T cosθ 0 cosi 2. Minnaert correction cosθ0 L H = LT ( ) cosi 3. statistical-empirical correction k L = L mcosi b + H T L T 4. C correction L H = L T cosθ 0 + c cosi + c
40 computing the cosine of the solar incidence angle cos(i) = sin( δ )sin( φ)cos( s) sin( δ )cos( φ)sin( s)cos( γ ) + cos( δ )cos( φ)cos( s)cos( ω) + cos( δ )sin( φ)sin( s)cos( γ )cos( ω) + cos( δ )sin( φ)sin( s)sin( ω) where, δ declination of the earth (positive in summer in northern hemisphere) φ latitude of the pixel (positive for northern hemisphere) s slope in radians, where s=0 is horizontal and s=π/2 is vertical downward (s is always positive and represents a downward slope in any direction) γ surface azimuth angle. γ is the deviation of the normal to the surface from the local meridian, where γ = 0 for aspect that is due south, γ = - for east and γ = + for western aspect. γ = -π/2 represents an east-facing slope and γ = +π/2 represents an west-facing slope. γ = -π or γ = π represents a north-facing slope. ω hour angle. ω = 0 at solar noon, ω is negative in morning and ω is positive in afternoon Source: Duffie,J.A. and W.A.Beckman, Solar engineering of thermal processes. John Wiley and Sons, NY.

41 If you are interested in, please read this source paper from: Law and Nichol
MODULE 3 LECTURE NOTES 3 ATMOSPHERIC CORRECTIONS
 MODULE 3 LECTURE NOTES 3 ATMOSPHERIC CORRECTIONS 1. Introduction The energy registered by the sensor will not be exactly equal to that emitted or reflected from the terrain surface due to radiometric and
GEOG 4110/5100 Advanced Remote Sensing Lecture 2
 GEOG 4110/5100 Advanced Remote Sensing Lecture 2 Data Quality Radiometric Distortion Radiometric Error Correction Relevant reading: Richards, sections 2.1 2.8; 2.10.1 2.10.3 Data Quality/Resolution Spatial
CORRECTING RS SYSTEM DETECTOR ERROR GEOMETRIC CORRECTION
 1 CORRECTING RS SYSTEM DETECTOR ERROR GEOMETRIC CORRECTION Lecture 1 Correcting Remote Sensing 2 System Detector Error Ideally, the radiance recorded by a remote sensing system in various bands is an accurate
Preprocessing of Satellite Images. Radiometric and geometric corrections
 Preprocessing of Satellite Images Radiometric and geometric corrections Outline Remote sensing data suffers from variety of radiometric and geometric errors. These errors diminish the accuracy of information
THE EFFECT OF TOPOGRAPHIC FACTOR IN ATMOSPHERIC CORRECTION FOR HYPERSPECTRAL DATA
 THE EFFECT OF TOPOGRAPHIC FACTOR IN ATMOSPHERIC CORRECTION FOR HYPERSPECTRAL DATA Tzu-Min Hong 1, Kun-Jen Wu 2, Chi-Kuei Wang 3* 1 Graduate student, Department of Geomatics, National Cheng-Kung University
TOPOGRAPHIC NORMALIZATION INTRODUCTION
 TOPOGRAPHIC NORMALIZATION INTRODUCTION Use of remotely sensed data from mountainous regions generally requires additional preprocessing, including corrections for relief displacement and solar illumination
The Gain setting for Landsat 7 (High or Low Gain) depends on: Sensor Calibration - Application. the surface cover types of the earth and the sun angle
 depends on: Sensor Calibration - Application. the surface cover types of the earth and the sun angle") Sensor Calibration - Application Station Identifier ASN Scene Center atitude 34.840 (34 3'0.64"N) Day Night DAY Scene Center ongitude 33.03270 (33 0'7.72"E) WRS Path WRS Row 76 036 Corner Upper eft atitude
Sensor Calibration - Application Station Identifier ASN Scene Center atitude 34.840 (34 3'0.64"N) Day Night DAY Scene Center ongitude 33.03270 (33 0'7.72"E) WRS Path WRS Row 76 036 Corner Upper eft atitude
IMAGE CORRECTIONS 11.1 INTRODUCTION. Objectives. Structure 11.1 Introduction Concept of Image Distortion and Correction
 UNIT 11 IMAGE CORRECTIONS Image Corrections Structure 11.1 Introduction Objectives 11.2 Concept of Image Distortion and Correction Image Distortions Image Corrections 11.3 Radiometric Distortions and their
Remote Sensing Introduction to the course
 Remote Sensing Introduction to the course Remote Sensing (Prof. L. Biagi) Exploitation of remotely assessed data for information retrieval Data: Digital images of the Earth, obtained by sensors recording
Correction and Calibration 2. Preprocessing
 Correction and Calibration Reading: Chapter 7, 8. 8.3 ECE/OPTI 53 Image Processing Lab for Remote Sensing Preprocessing Required for certain sensor characteristics and systematic defects Includes: noise
University of Technology Building & Construction Department / Remote Sensing & GIS lecture
 5. Corrections 5.1 Introduction 5.2 Radiometric Correction 5.3 Geometric corrections 5.3.1 Systematic distortions 5.3.2 Nonsystematic distortions 5.4 Image Rectification 5.5 Ground Control Points (GCPs)
Hyperspectral Remote Sensing
 Hyperspectral Remote Sensing Multi-spectral: Several comparatively wide spectral bands Hyperspectral: Many (could be hundreds) very narrow spectral bands GEOG 4110/5100 30 AVIRIS: Airborne Visible/Infrared
Aardobservatie en Data-analyse Image processing
 Aardobservatie en Data-analyse Image processing 1 Image processing: Processing of digital images aiming at: - image correction (geometry, dropped lines, etc) - image calibration: DN into radiance or into
GEOG 4110/5100 Advanced Remote Sensing Lecture 4
 GEOG 4110/5100 Advanced Remote Sensing Lecture 4 Geometric Distortion Relevant Reading: Richards, Sections 2.11-2.17 Review What factors influence radiometric distortion? What is striping in an image?
Prof. Vidya Manian Dept. of Electrical l and Comptuer Engineering. INEL6007(Spring 2010) ECE, UPRM
 ECE, UPRM") Inel 6007 Introduction to Remote Sensing Chapter 5 Spectral Transforms Prof. Vidya Manian Dept. of Electrical l and Comptuer Engineering Chapter 5-1 MSI Representation Image Space: Spatial information
Inel 6007 Introduction to Remote Sensing Chapter 5 Spectral Transforms Prof. Vidya Manian Dept. of Electrical l and Comptuer Engineering Chapter 5-1 MSI Representation Image Space: Spatial information
Solar Panel Irradiation Exposure efficiency of solar panels with shadow
 Solar Panel Irradiation Exposure efficiency of solar panels with shadow Frits F.M. de Mul MEDPHYS Software & Services 2012 www.medphys.nl email: info(at)medphys.nl Solar Panel Irradiation 1. Local Times,
DEVELOPMENT OF CLOUD AND SHADOW FREE COMPOSITING TECHNIQUE WITH MODIS QKM
 DEVELOPMENT OF CLOUD AND SHADOW FREE COMPOSITING TECHNIQUE WITH MODIS QKM Wataru Takeuchi Yoshifumi Yasuoka Institute of Industrial Science, University of Tokyo, Japan 6-1, Komaba 4-chome, Meguro, Tokyo,
Defining Remote Sensing
 Defining Remote Sensing Remote Sensing is a technology for sampling electromagnetic radiation to acquire and interpret non-immediate geospatial data from which to extract information about features, objects,
Philpot & Philipson: Remote Sensing Fundamentals Interactions 3.1 W.D. Philpot, Cornell University, Fall 12
 Philpot & Philipson: Remote Sensing Fundamentals Interactions 3.1 W.D. Philpot, Cornell University, Fall 1 3. EM INTERACTIONS WITH MATERIALS In order for an object to be sensed, the object must reflect,
Class 11 Introduction to Surface BRDF and Atmospheric Scattering. Class 12/13 - Measurements of Surface BRDF and Atmospheric Scattering
 University of Maryland Baltimore County - UMBC Phys650 - Special Topics in Experimental Atmospheric Physics (Spring 2009) J. V. Martins and M. H. Tabacniks http://userpages.umbc.edu/~martins/phys650/ Class
Quality assessment of RS data. Remote Sensing (GRS-20306)
") Quality assessment of RS data Remote Sensing (GRS-20306) Quality assessment General definition for quality assessment (Wikipedia) includes evaluation, grading and measurement process to assess design,
Quality assessment of RS data Remote Sensing (GRS-20306) Quality assessment General definition for quality assessment (Wikipedia) includes evaluation, grading and measurement process to assess design,
LAB EXERCISE NO. 02 DUE DATE: 9/22/2015 Total Points: 4 TOPIC: TOA REFLECTANCE COMPUTATION FROM LANDSAT IMAGES
 LAB EXERCISE NO. 02 DUE DATE: 9/22/2015 Total Points: 4 TOPIC: TOA REFLECTANCE COMPUTATION FROM LANDSAT IMAGES You are asked to perform a radiometric conversion from raw digital numbers to reflectance
ENVI Classic Tutorial: Multispectral Analysis of MASTER HDF Data 2
 ENVI Classic Tutorial: Multispectral Analysis of MASTER HDF Data Multispectral Analysis of MASTER HDF Data 2 Files Used in This Tutorial 2 Background 2 Shortwave Infrared (SWIR) Analysis 3 Opening the
Calculation steps 1) Locate the exercise data in your PC C:\...\Data
 Locate the exercise data in your PC C:\...\Data") Calculation steps 1) Locate the exercise data in your PC (freely available from the U.S. Geological Survey: http://earthexplorer.usgs.gov/). C:\...\Data The data consists of two folders, one for Athens
Calculation steps 1) Locate the exercise data in your PC (freely available from the U.S. Geological Survey: http://earthexplorer.usgs.gov/). C:\...\Data The data consists of two folders, one for Athens
Classify Multi-Spectral Data Classify Geologic Terrains on Venus Apply Multi-Variate Statistics
 Classify Multi-Spectral Data Classify Geologic Terrains on Venus Apply Multi-Variate Statistics Operations What Do I Need? Classify Merge Combine Cross Scan Score Warp Respace Cover Subscene Rotate Translators
Vicarious Radiometric Calibration of MOMS at La Crau Test Site and Intercalibration with SPOT
 Vicarious Radiometric Calibration of MOMS at La Crau Test Site and Intercalibration with SPOT M. Schroeder, R. Müller, P. Reinartz German Aerospace Center, DLR Institute of Optoelectronics, Optical Remote
D&S Technical Note 09-2 D&S A Proposed Correction to Reflectance Measurements of Profiled Surfaces. Introduction
 Devices & Services Company 10290 Monroe Drive, Suite 202 - Dallas, Texas 75229 USA - Tel. 214-902-8337 - Fax 214-902-8303 Web: www.devicesandservices.com Email: sales@devicesandservices.com D&S Technical
CHRIS Proba Workshop 2005 II
 CHRIS Proba Workshop 25 Analyses of hyperspectral and directional data for agricultural monitoring using the canopy reflectance model SLC Progress in the Upper Rhine Valley and Baasdorf test-sites Dr.
Physically Based Evaluation of Reflected Terrain Irradiance in Satellite Imagery for llumination Correction
 Physically Based Evaluation of Reflected Terrain Irradiance in Satellite Imagery for llumination Correction Masahiko Sugawara Hirosaki University Faculty of Science and Technology Bunkyo-cho 3, Hirosaki
MODULE 3. FACTORS AFFECTING 3D LASER SCANNING
 MODULE 3. FACTORS AFFECTING 3D LASER SCANNING Learning Outcomes: This module discusses factors affecting 3D laser scanner performance. Students should be able to explain the impact of various factors on
GEOBIA for ArcGIS (presentation) Jacek Urbanski
 Jacek Urbanski") GEOBIA for ArcGIS (presentation) Jacek Urbanski INTEGRATION OF GEOBIA WITH GIS FOR SEMI-AUTOMATIC LAND COVER MAPPING FROM LANDSAT 8 IMAGERY Presented at 5th GEOBIA conference 21 24 May in Thessaloniki.
GEOBIA for ArcGIS (presentation) Jacek Urbanski INTEGRATION OF GEOBIA WITH GIS FOR SEMI-AUTOMATIC LAND COVER MAPPING FROM LANDSAT 8 IMAGERY Presented at 5th GEOBIA conference 21 24 May in Thessaloniki.
A Survey of Modelling and Rendering of the Earth s Atmosphere
 Spring Conference on Computer Graphics 00 A Survey of Modelling and Rendering of the Earth s Atmosphere Jaroslav Sloup Department of Computer Science and Engineering Czech Technical University in Prague
Geometric Accuracy Evaluation, DEM Generation and Validation for SPOT-5 Level 1B Stereo Scene
 Geometric Accuracy Evaluation, DEM Generation and Validation for SPOT-5 Level 1B Stereo Scene Buyuksalih, G.*, Oruc, M.*, Topan, H.*,.*, Jacobsen, K.** * Karaelmas University Zonguldak, Turkey **University
BATHYMETRIC EXTRACTION USING WORLDVIEW-2 HIGH RESOLUTION IMAGES
 BATHYMETRIC EXTRACTION USING WORLDVIEW-2 HIGH RESOLUTION IMAGES M. Deidda a, G. Sanna a a DICAAR, Dept. of Civil and Environmental Engineering and Architecture. University of Cagliari, 09123 Cagliari,
Optical Theory Basics - 2 Atmospheric corrections and parameter retrieval
 Optical Theory Basics - 2 Atmospheric corrections and parameter retrieval Jose Moreno 3 September 2007, Lecture D1Lb2 OPTICAL THEORY-FUNDAMENTALS (2) Radiation laws: definitions and nomenclature Sources
IR-Signature of the MULDICON Configuration Determined by the IR-Signature Model MIRA
 DLR.de Folie 1 IR-Signature of the MULDICON Configuration Determined by the IR-Signature Model MIRA Erwin Lindermeir*, Markus Rütten DLR German Aerospace Center *Remote Sensing Technology Institute Institute
Hyperspectral CHRIS Proba imagery over the area of Frascati and Tor Vergata: recent advances on radiometric correction and atmospheric calibration
 4th CHRIS Proba workshop, 19 Semptember 2006 Tor Vergata University, Rome Hyperspectral CHRIS Proba imagery over the area of Frascati and Tor Vergata: recent advances on radiometric correction and atmospheric
Geometric Rectification of Remote Sensing Images
 Geometric Rectification of Remote Sensing Images Airborne TerrestriaL Applications Sensor (ATLAS) Nine flight paths were recorded over the city of Providence. 1 True color ATLAS image (bands 4, 2, 1 in
2017 Summer Course on Optical Oceanography and Ocean Color Remote Sensing. Apparent Optical Properties and the BRDF
 2017 Summer Course on Optical Oceanography and Ocean Color Remote Sensing Curtis Mobley Apparent Optical Properties and the BRDF Delivered at the Darling Marine Center, University of Maine July 2017 Copyright
Update on Pre-Cursor Calibration Analysis of Sentinel 2. Dennis Helder Nischal Mishra Larry Leigh Dave Aaron
 Update on Pre-Cursor Calibration Analysis of Sentinel 2 Dennis Helder Nischal Mishra Larry Leigh Dave Aaron Background The value of Sentinel-2 data, to the Landsat world, will be entirely dependent on
Interactive comment on Quantification and mitigation of the impact of scene inhomogeneity on Sentinel-4 UVN UV-VIS retrievals by S. Noël et al.
 Atmos. Meas. Tech. Discuss., www.atmos-meas-tech-discuss.net/5/c741/2012/ Author(s) 2012. This work is distributed under the Creative Commons Attribute 3.0 License. Atmospheric Measurement Techniques Discussions
Interactive comment on Quantification and mitigation of the impact of scene inhomogeneity on Sentinel-4 UVN UV-VIS retrievals by S. Noël et al.
 Atmos. Meas. Tech. Discuss., 5, C741 C750, 2012 www.atmos-meas-tech-discuss.net/5/c741/2012/ Author(s) 2012. This work is distributed under the Creative Commons Attribute 3.0 License. Atmospheric Measurement
ENHANCEMENT OF THE DOUBLE FLEXIBLE PACE SEARCH THRESHOLD DETERMINATION FOR CHANGE VECTOR ANALYSIS
 ENHANCEMENT OF THE DOUBLE FLEXIBLE PACE SEARCH THRESHOLD DETERMINATION FOR CHANGE VECTOR ANALYSIS S. A. Azzouzi a,b,, A. Vidal a, H. A. Bentounes b a Instituto de Telecomunicaciones y Aplicaciones Multimedia
A spectral climatology for atmospheric compensation
 Approved for Public Release; Distribution Unlimited. 14-1557 A spectral climatology for atmospheric compensation John H. Powell* a and Ronald G. Resmini a a College of Science, George Mason University,
De-Shadowing of Satellite/Airborne Multispectral and Hyperspectral Imagery
 De-Shadowing of Satellite/Airborne Multispectral and Hyperspectral Imagery R. Richter DLR, German Aerospace Center Remote Sensing Data Center D-82234 Wessling GERMANY ABSTRACT A de-shadowing technique
Image Processing and Analysis
 Image Processing and Analysis 3 stages: Image Restoration - correcting errors and distortion. Warping and correcting systematic distortion related to viewing geometry Correcting "drop outs", striping and
GEOG 4110/5100 Advanced Remote Sensing Lecture 4
 GEOG 4110/5100 Advanced Remote Sensing Lecture 4 Geometric Distortion Relevant Reading: Richards, Sections 2.11-2.17 Geometric Distortion Geometric Distortion: Errors in image geometry, (location, dimensions,
SWIR/VIS Reflectance Ratio Over Korea for Aerosol Retrieval
 Korean Journal of Remote Sensing, Vol.23, No.1, 2007, pp.1~5 SWIR/VIS Reflectance Ratio Over Korea for Aerosol Retrieval Kwon Ho Lee*, Zhangqing Li*, Young Joon Kim** *Earth System Science Interdisciplinary
Atmospheric inversion in the presence of clouds: an adaptive ELM approach.
 Atmospheric inversion in the presence of clouds: an adaptive ELM approach. Brent Bartlett and John R. Schott Rochester Institute of Technology, Rochester, NY, USA ABSTRACT Many algorithms exist to invert
Do It Yourself 8. Polarization Coherence Tomography (P.C.T) Training Course
 Training Course") Do It Yourself 8 Polarization Coherence Tomography (P.C.T) Training Course 1 Objectives To provide a self taught introduction to Polarization Coherence Tomography (PCT) processing techniques to enable
Do It Yourself 8 Polarization Coherence Tomography (P.C.T) Training Course 1 Objectives To provide a self taught introduction to Polarization Coherence Tomography (PCT) processing techniques to enable
MODIS Atmosphere: MOD35_L2: Format & Content
 Page 1 of 9 File Format Basics MOD35_L2 product files are stored in Hierarchical Data Format (HDF). HDF is a multi-object file format for sharing scientific data in multi-platform distributed environments.
Monte Carlo Ray Tracing Based Non-Linear Mixture Model of Mixed Pixels in Earth Observation Satellite Imagery Data
 Monte Carlo Ray Tracing Based Non-Linear Mixture Model of Mixed Pixels in Earth Observation Satellite Imagery Data Verification of non-linear mixed pixel model with real remote sensing satellite images
SPACEFLIGHT HYPERION DATA RADIATION CALIBRATION PRELIMINARY STUDY
 SPACEFLIGHT HYPERION DATA RADIATION CALIBRATION PRELIMINARY STUDY Shufang Tian a, Jianping Chen a, Ming Jiang a a CUGB, School of Geosciences and Resources,10083 Haidian District, Beijing, China-(sftian,3s,jming)@cugb.edu.cn
Lecture 7. Spectral Unmixing. Summary. Mixtures in Remote Sensing
 Lecture 7 Spectral Unmixing Summary This lecture will introduce you to the concepts of linear spectral mixing. This methods is sometimes also called: Spectral Mixture Analysis (SMA: Wessman et al 1997)
TOA RADIANCE SIMULATOR FOR THE NEW HYPERSPECTRAL MISSIONS: STORE (SIMULATOR OF TOA RADIANCE)
") TOA RADIANCE SIMULATOR FOR THE NEW HYPERSPECTRAL MISSIONS: STORE (SIMULATOR OF TOA RADIANCE) Malvina Silvestri Istituto Nazionale di Geofisica e Vulcanologia In the frame of the Italian Space Agency (ASI)
TOA RADIANCE SIMULATOR FOR THE NEW HYPERSPECTRAL MISSIONS: STORE (SIMULATOR OF TOA RADIANCE) Malvina Silvestri Istituto Nazionale di Geofisica e Vulcanologia In the frame of the Italian Space Agency (ASI)
Crop Types Classification By Hyperion Data And Unmixing Algorithm
 Crop Types Classification By Hyperion Data And Unmixing Algorithm H. FAHIMNEJAD 1, S.R. SOOFBAF 2, A. ALIMOHAMMADI 3, M. J. VALADAN ZOEJ 4 Geodesy and Geomatic Faculty, K.N.Toosi University of Technology,
CENG 477 Introduction to Computer Graphics. Ray Tracing: Shading
 CENG 477 Introduction to Computer Graphics Ray Tracing: Shading Last Week Until now we learned: How to create the primary rays from the given camera and image plane parameters How to intersect these rays
Modern Surveying Techniques. Prof. S. K. Ghosh. Department of Civil Engineering. Indian Institute of Technology, Roorkee.
 Modern Surveying Techniques Prof. S. K. Ghosh Department of Civil Engineering Indian Institute of Technology, Roorkee Lecture - 12 Rectification & Restoration In my previous session, I had discussed regarding
Revision History. Applicable Documents
 Revision History Version Date Revision History Remarks 1.0 2011.11-1.1 2013.1 Update of the processing algorithm of CAI Level 3 NDVI, which yields the NDVI product Ver. 01.00. The major updates of this
Spatial Enhancement Definition
 Spatial Enhancement Nickolas Faust The Electro- Optics, Environment, and Materials Laboratory Georgia Tech Research Institute Georgia Institute of Technology Definition Spectral enhancement relies on changing
ATMOSPHERIC AND TERRAIN CORRECTION OF IKONOS IMAGERY USING ATCOR3
 ATMOSPHERIC AND TERRAIN CORRECTION OF IKONOS IMAGERY USING ATCOR3 M. Neubert*, G. Meinel Leibniz Institute of Ecological and Regional Development (IOER), Weberplatz 1, D-01217 Dresden, Germany - M.Neubert@ioer.de,
UTILIZATION OF TANDEM-X DEM FOR TOPOGRAPHIC CORRECTION OF SENTINEL-2 SATELLITE IMAGE 1. INTRODUCTION
 UTILIZATION OF TANDEM-X DEM FOR TOPOGRAPHIC CORRECTION OF SENTINEL-2 SATELLITE IMAGE Sharad Kumar Gupta, PhD Scholar Dericks P. Shukla, Assistant Professor School of Engineering, Indian Institute of Technology,
Quantifying the Dynamic Ocean Surface Using Underwater Radiometric Measurement
 DISTRIBUTION STATEMENT A. Approved for public release; distribution is unlimited. Quantifying the Dynamic Ocean Surface Using Underwater Radiometric Measurement Lian Shen Department of Mechanical Engineering
SEVENTH FRAMEWORK PROGRAMME Capacities Specific Programme Research Infrastructures
 SEVENTH FRAMEWORK PROGRAMME Capacities Specific Programme Research Infrastructures Project acronym: EUFAR Project full title: European Facility for Airborne Research in Environmental and Geo-sciences Proposal
Geometric Correction
 CEE 6150: Digital Image Processing Geometric Correction 1 Sources of Distortion Sensor Characteristics optical distortion aspect ratio non-linear mirror velocity detector geometry & scanning sequence Viewing
Menghua Wang NOAA/NESDIS/STAR Camp Springs, MD 20746, USA
 Ocean EDR Product Calibration and Validation Plan Progress Report: VIIRS Ocean Color Algorithm Evaluations and Data Processing and Analyses Define a VIIRS Proxy Data Stream Define the required in situ
Motivation. Aerosol Retrieval Over Urban Areas with High Resolution Hyperspectral Sensors
 Motivation Aerosol etrieval Over Urban Areas with High esolution Hyperspectral Sensors Barry Gross (CCNY) Oluwatosin Ogunwuyi (Ugrad CCNY) Brian Cairns (NASA-GISS) Istvan Laszlo (NOAA-NESDIS) Aerosols
Working with M 3 Data. Jeff Nettles M 3 Data Tutorial at AGU December 13, 2010
 Working with M 3 Data Jeff Nettles M 3 Data Tutorial at AGU December 13, 2010 For Reference Slides and example data from today s workshop available at http://m3dataquest.jpl.nasa.gov See Green et al. (2010)
2017 Summer Course on Optical Oceanography and Ocean Color Remote Sensing. Introduction to Remote Sensing
 2017 Summer Course on Optical Oceanography and Ocean Color Remote Sensing Introduction to Remote Sensing Curtis Mobley Delivered at the Darling Marine Center, University of Maine July 2017 Copyright 2017
Introduction to Remote Sensing
 Introduction to Remote Sensing Spatial, spectral, temporal resolutions Image display alternatives Vegetation Indices Image classifications Image change detections Accuracy assessment Satellites & Air-Photos
A New Method for Correcting ScanSAR Scalloping Using Forests and inter SCAN Banding Employing Dynamic Filtering
 A New Method for Correcting ScanSAR Scalloping Using Forests and inter SCAN Banding Employing Dynamic Filtering Masanobu Shimada Japan Aerospace Exploration Agency (JAXA), Earth Observation Research Center
Introduction to Remote Sensing Wednesday, September 27, 2017
 Lab 3 (200 points) Due October 11, 2017 Multispectral Analysis of MASTER HDF Data (ENVI Classic)* Classification Methods (ENVI Classic)* SAM and SID Classification (ENVI Classic) Decision Tree Classification
Suitability of the parametric model RPV to assess canopy structure and heterogeneity from multi-angular CHRIS-PROBA data
 Suitability of the parametric model RPV to assess canopy structure and heterogeneity from multi-angular CHRIS-PROBA data B. Koetz a*, J.-L. Widlowski b, F. Morsdorf a,, J. Verrelst c, M. Schaepman c and
Atmospheric correction of hyperspectral ocean color sensors: application to HICO
 Atmospheric correction of hyperspectral ocean color sensors: application to HICO Amir Ibrahim NASA GSFC / USRA Bryan Franz, Zia Ahmad, Kirk knobelspiesse (NASA GSFC), and Bo-Cai Gao (NRL) Remote sensing
Global and Regional Retrieval of Aerosol from MODIS
 Global and Regional Retrieval of Aerosol from MODIS Why study aerosols? CLIMATE VISIBILITY Presented to UMBC/NESDIS June 4, 24 Robert Levy, Lorraine Remer, Yoram Kaufman, Allen Chu, Russ Dickerson modis-atmos.gsfc.nasa.gov
Monte Carlo Ray Tracing. Computer Graphics CMU /15-662
 Monte Carlo Ray Tracing Computer Graphics CMU 15-462/15-662 TODAY: Monte Carlo Ray Tracing How do we render a photorealistic image? Put together many of the ideas we ve studied: - color - materials - radiometry
GEOMETRY AND RADIATION QUALITY EVALUATION OF GF-1 AND GF-2 SATELLITE IMAGERY. Yong Xie
 Prepared by CNSA Agenda Item: WG.3 GEOMETRY AND RADIATION QUALITY EVALUATION OF GF-1 AND GF-2 SATELLITE IMAGERY Yong Xie Institute of Remote Sensing and Digital Earth, Chinese Academy of Science GF-1 and
DIRS Technical Report Tech Report #
 Rochester Institute of Technology Technical Memorandum Topic: NEFDS Beard-Maxwell BRDF Model Implementation in Matlab Primary Author: Matt Montanaro Collaborators: Carl Salvaggio Scott Brown David Messinger
Polarimetric Effects in Non-polarimetric Imaging Russel P. Kauffman* 1a and Michael Gartley b
 Polarimetric Effects in Non-polarimetric Imaging Russel P. Kauffman* 1a and Michael Gartley b a Lockheed Martin Information Systems and Global Services, P.O. Box 8048, Philadelphia PA, 19101; b Digital
CORRELATION BETWEEN NDVI AND SURFACE TEMPERATURES USING LANDSAT ETM IMAGERY FOR SAN ANTONIO AREA. Remote Sensing Project By Newfel Mazari Fall 2005
 CORRELATION BETWEEN NDVI AND SURFACE TEMPERATURES USING LANDSAT ETM IMAGERY FOR SAN ANTONIO AREA Remote Sensing Project By Newfel Mazari Fall 2005 Procedure Introduction and Objectives Site Date Acquisition
Atmospheric / Topographic Correction for Airborne Imagery. (ATCOR-4 User Guide, Version 7.0.3, March 2016)
") Atmospheric / Topographic Correction for Airborne Imagery (ATCOR-4 User Guide, Version 7.0.3, March 2016) R. Richter 1 and D. Schläpfer 2 1 DLR - German Aerospace Center, D - 82234 Wessling, Germany 2
Atmospheric / Topographic Correction for Airborne Imagery (ATCOR-4 User Guide, Version 7.0.3, March 2016) R. Richter 1 and D. Schläpfer 2 1 DLR - German Aerospace Center, D - 82234 Wessling, Germany 2
Radiance. Radiance properties. Radiance properties. Computer Graphics (Fall 2008)
") Computer Graphics (Fall 2008) COMS 4160, Lecture 19: Illumination and Shading 2 http://www.cs.columbia.edu/~cs4160 Radiance Power per unit projected area perpendicular to the ray per unit solid angle in
Computer Graphics (Fall 2008) COMS 4160, Lecture 19: Illumination and Shading 2 http://www.cs.columbia.edu/~cs4160 Radiance Power per unit projected area perpendicular to the ray per unit solid angle in
DIGITAL HEIGHT MODELS BY CARTOSAT-1
 DIGITAL HEIGHT MODELS BY CARTOSAT-1 K. Jacobsen Institute of Photogrammetry and Geoinformation Leibniz University Hannover, Germany jacobsen@ipi.uni-hannover.de KEY WORDS: high resolution space image,
GROUND DATA PROCESSING & PRODUCTION OF THE LEVEL 1 HIGH RESOLUTION MAPS
 GROUND DATA PROCESSING & PRODUCTION OF THE LEVEL 1 HIGH RESOLUTION MAPS VALERI 2002 LARZAC site (grassland) Philippe Rossello, Marie Weiss December 2005 CONTENTS 1. Introduction... 2 2. Available data...
Airborne Hyperspectral Imaging Using the CASI1500
 Airborne Hyperspectral Imaging Using the CASI1500 AGRISAR/EAGLE 2006, ITRES Research CASI 1500 overview A class leading VNIR sensor with extremely sharp optics. 380 to 1050nm range 288 spectral bands ~1500
DIGITAL IMAGE ANALYSIS. Image Classification: Object-based Classification
 DIGITAL IMAGE ANALYSIS Image Classification: Object-based Classification Image classification Quantitative analysis used to automate the identification of features Spectral pattern recognition Unsupervised
Atmospheric / Topographic Correction for Satellite Imagery. (ATCOR-2/3 User Guide, Version 9.2.0, March 2018)
") Atmospheric / Topographic Correction for Satellite Imagery (ATCOR-2/3 User Guide, Version 9.2.0, March 2018) R. Richter 1 and D. Schläpfer 2 1 DLR - German Aerospace Center, D - 82234 Wessling, Germany
Atmospheric / Topographic Correction for Satellite Imagery (ATCOR-2/3 User Guide, Version 9.2.0, March 2018) R. Richter 1 and D. Schläpfer 2 1 DLR - German Aerospace Center, D - 82234 Wessling, Germany
Lab on MODIS Cloud spectral properties, Cloud Mask, NDVI and Fire Detection
 MODIS and AIRS Workshop 5 April 2006 Pretoria, South Africa 5/2/2006 10:54 AM LAB 2 Lab on MODIS Cloud spectral properties, Cloud Mask, NDVI and Fire Detection This Lab was prepared to provide practical
Preprocessed Input Data. Description MODIS
 Preprocessed Input Data Description MODIS The Moderate Resolution Imaging Spectroradiometer (MODIS) Surface Reflectance products provide an estimate of the surface spectral reflectance as it would be measured
Physics-based Vision: an Introduction
 Physics-based Vision: an Introduction Robby Tan ANU/NICTA (Vision Science, Technology and Applications) PhD from The University of Tokyo, 2004 1 What is Physics-based? An approach that is principally concerned
The Spherical Harmonics Discrete Ordinate Method for Atmospheric Radiative Transfer
 The Spherical Harmonics Discrete Ordinate Method for Atmospheric Radiative Transfer K. Franklin Evans Program in Atmospheric and Oceanic Sciences University of Colorado, Boulder Computational Methods in
End-to-End Simulation of Sentinel-2 Data with Emphasis on Atmospheric Correction Methods
 End-to-End Simulation of Sentinel-2 Data with Emphasis on Atmospheric Correction Methods Luis Guanter 1, Karl Segl 2, Hermann Kaufmann 2 (1) Institute for Space Sciences, Freie Universität Berlin, Germany
Land surface VIS/NIR BRDF module for RTTOV-11: Model and Validation against SEVIRI Land SAF Albedo product
 Land surface VIS/NIR BRDF module for -: Model and Validation against SEVIRI Albedo product Jérôme Vidot and Eva Borbas Centre de Météorologie Spatiale, DP/Météo-France, Lannion, France SSEC/CIMSS, Madison,
Determining satellite rotation rates for unresolved targets using temporal variations in spectral signatures
 Determining satellite rotation rates for unresolved targets using temporal variations in spectral signatures Joseph Coughlin Stinger Ghaffarian Technologies Colorado Springs, CO joe.coughlin@sgt-inc.com
SEA BOTTOM MAPPING FROM ALOS AVNIR-2 AND QUICKBIRD SATELLITE DATA
 SEA BOTTOM MAPPING FROM ALOS AVNIR-2 AND QUICKBIRD SATELLITE DATA Mohd Ibrahim Seeni Mohd, Nurul Nadiah Yahya, Samsudin Ahmad Faculty of Geoinformation and Real Estate, Universiti Teknologi Malaysia, 81310
Diffraction gratings. e.g., CDs and DVDs
 Diffraction gratings e.g., CDs and DVDs Diffraction gratings Constructive interference where: sinθ = m*λ / d (If d > λ) Single-slit diffraction 1.22 * λ / d Grating, plus order-sorting filters on detector
Skylight to enhance outdoor scenes Real-Time Graphics. The atmosphere. Rayleigh scattering. Jeppe Revall Frisvad.
 Skylight to enhance outdoor scenes 02564 Real-Time Graphics Skylight and irradiance environment maps Jeppe Revall Frisvad March 2016 Esplanade, Saint Clair, Dunedin, New ealand: -45.9121, 170.4893 The
CRISM (Compact Reconnaissance Imaging Spectrometer for Mars) on MRO. Calibration Upgrade, version 2 to 3
 on MRO. Calibration Upgrade, version 2 to 3") CRISM (Compact Reconnaissance Imaging Spectrometer for Mars) on MRO Calibration Upgrade, version 2 to 3 Dave Humm Applied Physics Laboratory, Laurel, MD 20723 18 March 2012 1 Calibration Overview 2 Simplified
CRISM (Compact Reconnaissance Imaging Spectrometer for Mars) on MRO Calibration Upgrade, version 2 to 3 Dave Humm Applied Physics Laboratory, Laurel, MD 20723 18 March 2012 1 Calibration Overview 2 Simplified
EVALUATION OF THE THEMATIC INFORMATION CONTENT OF THE ASTER-VNIR IMAGERY IN URBAN AREAS BY CLASSIFICATION TECHNIQUES
 EVALUATION OF THE THEMATIC INFORMATION CONTENT OF THE ASTER-VNIR IMAGERY IN URBAN AREAS BY CLASSIFICATION TECHNIQUES T. G. Panagou a *, G. Ch. Miliaresis a a TEI, Dpt. of Topography, 3 P.Drakou Str., Thiva,
Measuring Ground Deformation using Optical Imagery
 Measuring Ground Deformation using Optical Imagery Sébastien Leprince California Institute of Technology, USA October 29, 2009 Keck Institute for Space Studies Workshop Measuring Horizontal Ground Displacement,