IN Cell Analyzer 1000 Analysis Modules Multi Target Analysis Training
|
|
|
- Archibald Underwood
- 5 years ago
- Views:
Transcription

1 IN Cell Analyzer 1000 Analysis Modules Multi Target Analysis Training
2 Multi Target Analysis Neurite Outgrowth Membrane Translocation Analysis Object Intensity Dual Area Object Analysis Granularity Morphology Analysis Nuclear Translocation Micronuclei Cell Cycle Analysis 2 /
3 Multi Target Analysis 3 /
4 Specify protocol name. Generating an analysis protocol. Choose appropriate analysis module (Assay name) e.g. Multi Target Analysis. Define input images, wavelengths and assign objects. Segment objects e.g. define nuclei, cells, organelles, reference. Select basic measures e.g. intensity, area, Nuc / Cell intensity. Summarise measures (basic + filters + classifiers). Introduce simple filter or decision tree filter. or Add supervised classifiers. Define sub-population analysis. Data Management Timelapse / Z stack analysis. 4 /
5 Main Feature differences between Analysis modules are: Number of wavelengths / features that can be analyzed. Simple filters and classification filtering approaches (including decision tree). Sub-population analysis. Output measures. 5 /


6 Number of wavelengths / features that can be analyzed. 6 /
7 Summary of Measures in MTA Nuclei Nuc/Cell Intensity Nuc Area Nuc cg X Nuc cg Y Nuc Elongation Nuc 1/(Form Factor) Nuc Displacement Nuc Intensity Nuc Intensity CV Cell Intensity Compactness Light Flux (relative) Chord ratio Intensity (N+C) Integrated Intensity (Nuc) Integrated Intensity (Cell) Integrated Intensity (Whole Cell) Nuclei coordination Spacing (SOI) Neighbor count (SOI) Spacing (MIN) Neighbor count (MIN) Spacing (Gabriel) Neighbor count (Gabriel) Spacing (Lune) Neighbor count (Lune) Cells Nuc/Cell Intensity Cell/Bckg Intensity Cell Area Nuc/Cell Area Nuc Intensity Nuc Intensity CV Cell Gyration Radius Cell Intensity Cell Elongation Cell 1/(Form Factor) Intensity Spreading Cell cg X Cell cg Y Cell Intensity CV Background Intensity Light Flux (relative) Intensity (N+C) Integrated Intensity (Nuc) Integrated Intensity (Cell) Integrated Intensity (Whole Cell) Organelles Count Spacing Neighbor Count Mean Area 1/(Form Factor) Elongation Distance to Nuc Inclusion/Cell Intensity Intensity Total Area Inclusion/Bckg Intensity Reference Reference measures refer to individual cell measurements made in the Nuclei, Cells or Organelles channels depending on the object selected for Reference segmentation. (Nuclei) Nuc/Cell Intensity Nuc Intensity Nuc Intensity CV Cell Intensity Light Flux (relative) Intensity (N+C) Integrated Intensity (Nuc) Integrated Intensity (Cell) Integrated Intensity (Whole Cell) (Cells) Nuc/Cell Intensity Cell/Bckg Intensity Nuc Intensity Nuc Intensity CV Cell Intensity Intensity Spreading Cell Intensity CV Background Intensity Light Flux (relative) Intensity (N+C) Integrated Intensity (Nuc) Integrated Intensity (Cell) Integrated Intensity (Whole Cell) (Organelles) Inclusion/Cell Intensity Intensity Inclusion/Bckg Intensity 7 /
8 Training: Summary of steps Opening the analysis software and retrieving image data (Chapter 4). Creating an analysis protocol (Chapter 5). Filters and classification (Chapter 6). Using Supervised classification (Chapter 7). Analysing an image stack and using graphical displays (Chapter 8). Using the Batch queue manager (Chapter 10). Additional functions:- Summary Statistics/Movie mode/saving images for presentations Please refer to the Multi Target Analysis Module for IN Cell Analyzer 1000 Product User Manual for further details. 8 /
9 Opening the analysis software and retrieving image data. Creating an analysis protocol. Filters and classification. Analysing an image stack and using graphical displays. Using the Batch queue manager. 9 /

10 Opening the analysis software and retrieving image data: Opening the IN Cell Analyzer workstation launches a start up Wizard that will navigate you through the analysis set-up procedure. Select a working mode. I. Assay development mode - to define a new analysis protocol. II. Analysis mode-to use an existing protocol. 10 /

11 Opening the analysis software and retrieving image data: III. View and analyze image stack. IV. Open a data file (Retrieve data from a previously analyzed stack). 11 /
12 Opening the analysis software and retrieving image data. Creating an analysis protocol. Filters and classification. Analysing an image stack and using graphical displays. Using the Batch queue manager. 12 /


13 Creating a new analysis protocol using the analysis protocol Wizard (can also edit existing protocols via the analysis protocol editor). or Image Stack & Analysis window: edit the analysis parameters, use the Sample function to test the protocol segmentation measurements can easily be extracted from the image, population data can be generated for editing classification filters. Analysis protocol manager: view & edit the analysis parameters, use the Test function to exit the Protocol Editor and test the protocol on an image stack using the Image Stack window. the Image Stack window and the Analysis Protocol Editor cannot be open concurrently. 13 /

14 Options include importing, exporting, deleting, renaming, editing and generating New protocols 14 /
15 Wizard guides user through the following steps:- Enter a protocol name. Password protecting a protocol. Specifying assay name and microscopy type. 15 /

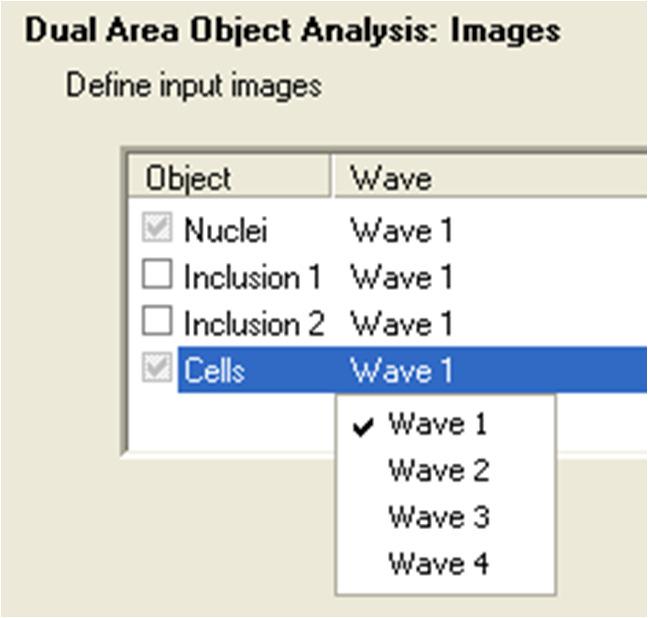
16 Setting the analysis parameters. Parametersdefining input images. Segmentationdefining targets. Prior to setting the analysis parameters the user is advised to optimise image displays. 16 /

 Color editor Gray levels")
17 Visuals Optimisation of image displays using the visuals display tools to clearly discern the features to be identified and measured. LUT Relates intensity to LUT (Y axis) Pixel information Mapping functions Click Visuals Histogram Gray levels (X axis) Color editor Gray levels Autocontrast 17 /
18 Multi Target Analysis worked example Apoptosis. Image stack: _iono_4hr_fav_2.xdce Hoechst used to identify the nuclei of all cells. Channel 1 (Wave 1). Blue. 360/40 460/40. Visuals: FITC-labelled Annexin V conjugate used to identify early apoptotic cells. Channel 2 (Wave 2). Green. 475/20 535/50. Visuals: Propidium iodide used to discriminate dead cells. Channel 3 (Wave 3). Red. 570/20 620/60. Visuals: /

19 Apoptosis image stack Channel 1 (Wave 1) Channel 2 (Wave 2) Channel 3 (Wave 3) Nuclear definition. Identification of early apoptotic cells. Viability definition Hoechst FITC-labelled Annexin V Propidium iodide 19 /
 for 10 mins prior to imaging on the IN Cell Analyzer 1000.")
20 Apoptosis image stack Dead, nonviable cell. (B, G & R). Early apoptotic cell. (B & G). U-2 OS cells, 4 hrs incubation with 10 µm Ionomycin. Healthy, viable cell. (B only). Cells stained with 10 µm Hoechst 33342, 5 µm Propidium iodide and FITC-labelled Annexin V conjugate (1:1000) for 10 mins prior to imaging on the IN Cell Analyzer /
21 Segmentation Segmentation is the process of dividing an image into a number of individual objects or contiguous regions, differentiating them from each other and from the image background. For each object type, the software offers one or more segmentation methods. Accurate segmentation is essential for accurate analysis results. 21 /


22 Defining nuclei segmentation Top-hat, Global threshold, Region growing. Nuclei feature. Top-hat segmentation used in this example protocol to identify Hoechst stained nuclei. 22 /


23 Defining cells segmentation Top-hat, Multiscale top-hat, Region growing, Collar. Cells feature. Collar segmentation used in this example protocol to define a Cell region and identify early apoptotic cells. 23 /


24 Defining organelles segmentation Multiscale top-hat. Organelles feature. Not used in this example protocol. 24 /

25 Defining reference segmentation Pseudo (use objects from Nuclei, Cells or Organelles). Reference 1 feature. Pseudo segmentation using objects from Nuclei channel to discriminate dead cells (PI staining). 25 /


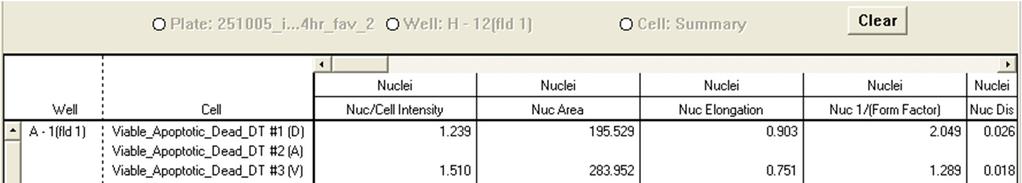
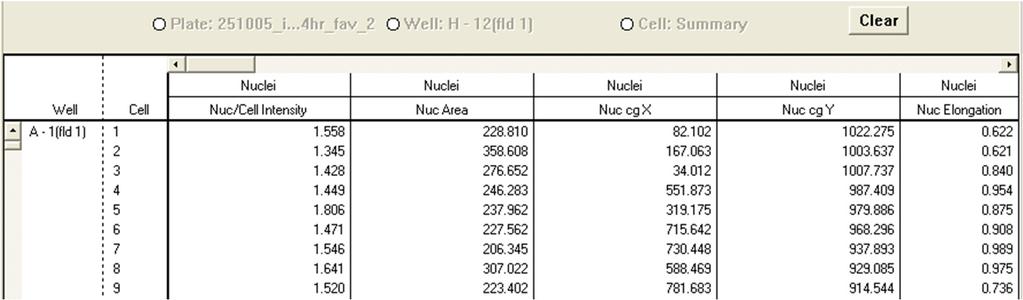
26 Measures Specify which basic measures will be acquired from each image. 26 /


27 Measures Specify which basic measures will be acquired from each image. 27 /


28 Filters At this stage, use the Filters Window to define simple filters that identify cells having object measures above or below threshold values. cells having objects that fall within a range of values. 28 /
29 Filters The option to add further filters for classification is available only after a basic analysis protocol has been set up. An initial analysis of sample wells should also be performed to allow the segmentation parameters to be checked and also to provide sample data to allow filter and classification thresholds to be defined. Threshold. Linear Discriminant 2D. Decision tree. Classification filters will be covered later. 29 /
30 Supervised Classifiers Develop analysis protocols with defined classifiers that automatically assign cells to a pre-defined class. The option to use Supervised Classifiers is still available within the Multi Target Analysis module. It is recommended that Supervised Classifiers and the Classification Filters are used independently. 30 /

31 Summary Window Use the Summary window to specify which measures will be included in data summary output files. choose to Include all cells in the analysis or if a filter has been defined, then the options to Include only cells where or to Exclude cells where become available. 31 /

32 Subpopulations Use the subpopulation window to specify which subpopulation measures will be reported in the subpopulation data output. The drop down menu displays the filters available for subpopulation definition. 32 /

33 Time Lapse Specify which time point should be used for analysis. 33 /
 are analyzed.")
34 Z-stack analysis Specify which plane(s) are analyzed. 34 /

35 Data Management Saving data. 35 /
36 Opening the analysis software and retrieving image data. Creating an analysis protocol. Filters and classification. Analysing an image stack and using graphical displays. Using the Batch queue manager. 36 /
37 Filters and classification The ability to filter out objects based on any measure and the classification of cells into user defined populations are two functions that are achieved using the Filters available in the Multi Target Analysis: Filters Window. Filters are: defined using any available measure previously selected in the Multi Target Analysis: Measures window. used to filter or classify cells according to any fluorescence intensity or morphology based measure. available only after a basic analysis has been performed. defined when sample data has been provided. 37 /


38 Classification filters Classification filters available include: - Threshold - Linear Discriminant 2D - Decision tree 38 /
39 Threshold filter A threshold filter is used to divide a population into two subpopulations based on a single measure. Use a threshold filter to define: cells having object measures above or below threshold values. cells having object measures that fall within a range of values. 39 /


40 Threshold filter Example of a threshold filter (not used in this training protocol). 40 /
41 Linear Discriminant 2D A Linear Discriminant 2D filter is used to generate a scatter plot of any two available measures, enabling cells to be classified into up to 4 user defined populations. Use the Linear Discriminant 2D filter to: discriminant distinct sub-populations on the basis of two parameters (e.g. an assay where two different fluorescent dyes are used to mark live and dead cells). 41 /


42 Linear Discriminant 2D filter Example of a linear discriminant 2D filter (not used in this training protocol). 42 /

43 Linear Discriminant 2D filter class definition Specify the number and arrangement of classification areas required in the classification protocol in the class definition window. Option 1 - classification into 2 user-defined populations using 1 linear threshold. Option 2 - classification into 3 user-defined populations (including 1 unclassified) using 2 parallel linear thresholds. 43 /

44 Linear Discriminant 2D filter class definition 2 populations 3 populations Option 3 - classification into 2, 3 or 4 user-defined populations using 2 intersecting linear thresholds. Specify the number of populations (up to 4) and their position on the resulting scatter plot using 4 populations 44 /
45 Decision tree filter A decision tree filter is used to classify cells into multiple populations based on any available measure. The tree is designed to be multi-level and allows the cell population to be divided into two subpopulations at each decision point. The two types of filters, Threshold and Linear Discriminant 2D are available at each decision point for classification and can be used in combination. At each decision point, either one or both populations can then be classified into further subpopulations or can be reported in the Summary data. 45 /


46 Decision tree filter Start node T threshold node. Start node S scatter plot node. Node T secondary threshold node. Node S secondary scatter plot node. To set up a Decision tree, click and drag the required node type from the right hand panel to the work area on the left. The first node in a Decision tree must be a start node (threshold or scatter plot node). 46 /


47 Decision tree filter in our worked example Start node T threshold node. Node S secondary scatter plot node. 47 /


48 Decision tree filter in our worked example Start node T threshold node. Cells with compromised membranes and therefore a Nuc Intensity in the Reference 1 channel (i.e. Propidium iodide intensity in nucleus) greater than 270 GL will be classified as Dead and reported. Those cells less than the threshold are directed to the secondary node for further classification. 48 /


49 Decision tree filter in our worked example Node S secondary scatter plot node. Those cells not classified as dead in the start node are further classified using a scatter plot node with Nuc/Cell Intensity in the Nuclei channel (X-axis) and Cell intensity in the Cells channel (Y-axis) to discriminate viable and apoptotic cells. This combination of measures is required to adequately discriminate viable cells (low Nuc/Cell intensity; lower intensity of FITC- Annexin V) from apoptotic cells (higher Nuc/Cell intensity; higher intensity of FITC- Annexin V). 49 /

 and cell by cell")
50 Decision tree filter in our worked example - Interactive scatter plot node. - Click on the data point to highlight the cell in the image window (with classification bitmap) and cell by cell data. - Useful for checking classification. 50 /
 are selected in the Summary window of Analysis Protocol")

51 Decision tree filter in our worked example Analysis performed with the cell selection include all cells option. Ensuring that the Decision tree summary measures (% and n) are selected in the Summary window of Analysis Protocol Editor. Subpopulation measures were also selected for reporting, based on the Decision tree filter. Once a decision tree has been included in the protocol, remember to go in and check the decision tree summary measures (% and n) to see the data. 51 /
52 Opening the analysis software and retrieving image data. Creating an analysis protocol. Filters and classification. Analysing an image stack and using graphical displays. Using the Batch queue manager. 52 /


53 Analyzing an image stack and using graphical displayscolor coding of plate map, graphical analysis and viewing data in summary and cell by cell. Color coding of plate map Choose Measure 53 /

, and")

54 Graphical analysis To plot the results for analyzed wells, right click on the analyzed well(s), and select Plot Selected Data. Choose histogram or scatter plot. 54 /


55 Viewing data Summary by fields Summary by wells 55 /

56 Subpopulations (field) Subpopulations (wells) Cell by Cell 56 /
57 Opening the analysis software and retrieving image data. Creating an analysis protocol. Filters and classification. Analysing an image stack and using graphical displays. Using the Batch queue manager. 57 /
58 Using the Batch queue manager Batch Queue analysis can be used to optimise the analysis parameters for a single image stack or to run multiple image stacks through one protocol or a combination of the two Default file paths will locate the data files e.g. image stacks and analysis protocols (if image stacks and analysis protocols are to be used from a central drive file paths must be set accordingly). Select Settings and click Default File Paths. 58 /
59 Using the Batch queue manager Creating the batch queue folder: Settings/Default File Paths and type BATCH at end of Batch analysis folder file path Opening Batch Queue Manager-Application Adding image stacks and analysis protocols to the batch queue Select Protocol Browse folder Scan to load files Check Box to add files to batch queue OK 59 /
60 Using the Batch queue manager Exporting Analysis Protocols Running a batch analysis - Application and Image Stack and analysis 60 /


61 Additional Functions Movie Mode-save as AVI file All images from all channels and time points will be loaded 61 /

62 Double click on which Channel to generate movie Choose channel Define which of the time points are to be incorporated into the movie Define time interval and movie direction Play movie 62 /

63 Additional Functions Saving images for presentations Highlight image >Image>save image as Save entire or viewed image Save with and without overlay 63 /
64 Legal GE Healthcare and GE Healthcare Biosciences are trademarks of GE Healthcare companies. GE and GE Monogram are trademarks of General Electric Company. General Electric Company reserves the right, subject to any regulatory approval if required, to make changes in specifications and features shown herein, or discontinue the product described at any time without notice or obligation. Contact your GE Representative for the most current information General Electric Company - All rights reserved. The IN Cell Analyzer 1000 system is the subject of patent numbers US and and US patent application number 10/514925, together with other granted and pending family members, in the name of GE Healthcare Niagara, Inc. The IN Cell Analyzer 1000 and associated analysis modules are sold under license from Cellomics Inc. under US patent numbers US , , , , , , ; Canadian patent numbers CA , , ; Australian patent number AU ; European patent number EP ; Japanese patent number JP and other pending and foreign patent applications. Software GE Healthcare Biosciences Niagara Inc All rights reserved GE Healthcare Biosciences UK Limited All rights reserved. GE Healthcare Biosciences Niagara Inc is a wholly owned subsidiary within the GE Healthcare Biosciences group of Companies. All goods and services are sold subject to terms and conditions of sale of the company within the GE Healthcare Biosciences group, which supplies them. A copy of these terms and conditions is available on request. The IN Cell 1000 Analyzer system is for research purposes only. It is not approved for diagnosis of disease in humans or animals. GE Healthcare Biosciences UK Limited Amersham Place Little Chalfont Buckinghamshire HP7 9NA UK GE Healthcare Biosciences AB SE Uppsala Sweden GE Healthcare Biosciences Corp 800 Centennial Avenue PO Box 1327 Piscataway NJ USA GE Healthcare Biosciences Europe GmbH Munzinger Strasse 9 D Freiburg Germany 64 /
How to Download a GE Healthcare License File
 GE Healthcare Life Sciences How to Download a GE Healthcare License File This is a short instruction on how to collect an edelivery file for a software product using the GE Healthcare Life Science licensing
DeltaVision OMX SR super-resolution microscope. Super-resolution doesn t need to be complicated
 DeltaVision OMX SR super-resolution microscope Super-resolution doesn t need to be complicated Live-cell super-resolution microscopy DeltaVision OMX SR is a compact super-resolution microscope system optimized
UNICORN 4.12 vs 4.0 (including version 4.01 and 4.11)
") 18-1164-11 Edition AB 2003-06 UNICORN 4.12 vs 4.0 (including version 4.01 and 4.11) UNICORN version 4.01 Introduction This document describes the implemented changes and improvements in UNICORN TM 4.12
18-1164-11 Edition AB 2003-06 UNICORN 4.12 vs 4.0 (including version 4.01 and 4.11) UNICORN version 4.01 Introduction This document describes the implemented changes and improvements in UNICORN TM 4.12
GE Healthcare. Visualize Analyze. Realize. IN Cell Miner HCM Data management for high-content analysis and screening
 GE Healthcare Visualize Analyze Realize IN Cell Miner HCM Data management for high-content analysis and screening Managing the data mountain High-content analysis (HCA) provides quantitative insights in
UNICORN 3.1 vs Edition AA
 UNICORN 3.1 vs 3.0 18-1171-16 Edition AA 2002-10 Introduction This document describes the implemented changes and improvements in UNICORN TM 3.1 compared to version 3.0. Note: In some cases an updated
UNICORN Service Tool. User Manual
 UNICORN Service Tool User Manual Table of Contents Table of Contents Introduction... UNICORN Installation tab... UNICORN Connection tab... 4 Database Server Connection tab... 5 License Server Connection
UNICORN ifix Integration
 application note Protein Purification Control Software UNICORN ifix Integration Introduction Market requirements today are focused on solutions that deliver optimal performce in terms of: Time to market
UNICORN Compatibility
 Compatibility 1. 1. 7.x Compatibility Matrix 2 2 2. 6.x Compatibility Matrix 3 3. Instrument Configuration Compatibility ÄKTA avant 4 4. Instrument Configuration Compatibility ÄKTA pure 5 5. Instrument
UNICORN Compatibility
 Compatibility 1. 1. 7.x Compatibility Matrix 2 2 2. 6.x Compatibility Matrix 3 3. Instrument Configuration Compatibility ÄKTA avant 4 4. Instrument Configuration Compatibility ÄKTA pure 5 5. Instrument
Optional Column Selection Valve
 Optional Column Selection Valve User Manual 71-5029-20 Important user information All users must read this entire manual to fully understand the safe use of ÄKTAdesign instruments. WARNING! The Warning
BD Lyoplate Human Screen Analysis Instructions For analysis using FCS Express or FlowJo and heatmap representation in Excel 2007
 BD Biosciences Technical Resources Page 1 For use with the BD Lyoplate Human Cell Surface Marker Screening Panel (Cat. No. 560747). Please check that your catalog numbers for the FCS Express Excel templates
MetaXpress. High Content Image Acquisition & Analysis Software Version 6.1. Analysis Guide
 MetaXpress High Content Image Acquisition & Analysis Software Version 6.1 Analysis Guide 5039429 B September 2015 This document is provided to customers who have purchased Molecular Devices equipment,
GE Healthcare. ImageQuant TL 7.0. Image Analysis Software. Getting Started
 GE Healthcare ImageQuant TL 7.0 Image Analysis Software Getting Started Contents 1 Introduction and installation instructions 1.1 Introduction... 5 1.2 Installation... 5 1.3 E-licensing... 6 1.3.1 E-license
Version 4.0. Quick Start Guide For the Odyssey CLx Infrared Imaging System
 Version 4.0 Quick Start Guide For the Odyssey CLx Infrared Imaging System 1 Install the Image Studio Software Important: You must be logged in to the Windows Operating System using an Administrator type
Chemotaxis Data Processing: Creating an Analysis Job
 essenbioscience.com/incucyte TECH NOTE IncuCyte ZOOM Live-Cell Imaging System Chemotaxis Data Processing: Creating an Analysis Job Data processing analyzes and summarizes qualitative images into quantitative
Definiens. Tissue Studio 4.4. Tutorial 4: Manual ROI Selection and Marker Area Detection
 Definiens Tissue Studio 4.4 Tutorial 4: Manual ROI Selection and Marker Area Detection Tutorial 4: Manual ROI Selection and Marker Area Detection Imprint and Version Copyright 2017 Definiens AG. All rights
MetaXpress 6 Software Guide
 MetaXpress 6 Software Guide Quick Start Guide for Custom Module Editor Date Revised 07/08/15 Version B 1 2012-2015. Trademarks property of Molecular Devices, LLC or their respective owners. Why Use the
HCImage. Image Acquisition and Analysis Software. Light... Camera... Acquisition...
 HCImage Image Acquisition and Analysis Software Light... Camera... Acquisition... HCImage Analysis HCImage Analysis provides comprehensive control of Hamamatsu cameras, microscopes, stages and other peripheral
ImageQuant TL. User Guide. v
 ImageQuant TL User Guide v2003 63-0050-82 Amersham Biosciences Corp 800 Centennial Avenue P.O. Box 1327 Piscataway NJ 008855 USA Tel: 1-800 526 3593 Fax: 1-800 329 3593 Amersham Biosciences Amersham Place
Rare Event Detection Algorithm. User s Guide
 Rare Event Detection Algorithm User s Guide Copyright 2008 Aperio Technologies, Inc. Part Number/Revision: MAN 0123, Revision A Date: September 2, 2008 This document applies to software versions Release
Version 3.1. For the Odyssey Classic Infrared Imaging System
 Version 3.1 For the Odyssey Classic Infrared Imaging System 1 Install the Image Studio Software Important: You must be logged in to Windows Operating System using an Administrator type account. If necessary,
Version 3.1. For the C-DiGit Blot Scanner
 Version 3.1 For the C-DiGit Blot Scanner Quick Start Guide, C-DiGit Blot Scanner - Page 2 1 Install the Image Studio Software Important: You must be logged in to Windows Operating System using an Administrator
Making your first runs
 Making your first runs Begin here with ÄKTA FPLC 18-1140-80 Important user information All users must read this entire manual to fully understand the safe use of ÄKTAFPLC. WARNING! The Warning sign highlights
Agilent Seahorse XF Imaging & Cell Counting Software
 Tech Note Agilent Seahorse XF Imaging & Cell Counting Software Adjusting Analysis Parameters in BioTek Gen5 for Difficult to Count Cell Lines This document describes how to use BioTek s Gen5 software to
MetaXpress Software: Analysis Training
 MetaXpress Software: Analysis Training MetaXpress: Application Modules Canned, walk-away automation Advanced segmentation, feature detection, and measurement Site-by-site and cell-by-cell data Validated
FlowJo Software Lecture Outline:
 FlowJo Software Lecture Outline: Workspace Basics: 3 major components 1) The Ribbons (toolbar) The availability of buttons here can be customized. *One of the best assets of FlowJo is the help feature*
MetaMorph Standard Operation Protocol Basic Application
 MetaMorph Standard Operation Protocol Basic Application Contents Basic Navigation and Image Handling... 2 Opening Images... 2 Separating Multichannel Images... 2 Cropping an Image... 3 Changing an 8 bit
Introduction. Loading Images
 Introduction CellProfiler is a free Open Source software for automated image analysis. Versions for Mac, Windows and Linux are available and can be downloaded at: http://www.cellprofiler.org/. CellProfiler
Colocalization Algorithm. User s Guide
 Colocalization Algorithm User s Guide Copyright 2008 Aperio Technologies, Inc. Part Number/Revision: MAN 0082, Revision A Date: March 7, 2008 This document applies to software versions Release 9.0 and
DeCyder Differential Analysis Software, Version 5.0 User Manual
 user manual proteomics DeCyder Differential Analysis Software, Version 5.0 User Manual um 18-1173-16 AA Terms and Conditions of Sale Unless otherwise agreed, all goods and services are sold subject to
Virtual Frap User Guide
 Virtual Frap User Guide http://wiki.vcell.uchc.edu/twiki/bin/view/vcell/vfrap Center for Cell Analysis and Modeling University of Connecticut Health Center 2010-1 - 1 Introduction Flourescence Photobleaching
Tutorial: FCAP Array Software with BD FACSArray Bioanalyzer
 Tutorial: FCAP Array Software with BD FACSArray Bioanalyzer After completing this tutorial you will be able to: Create an Experiment with the Experiment Wizard in FCAP Array software. Export the Experiment
LEGENDplex Data Analysis Software Version 8 User Guide
 LEGENDplex Data Analysis Software Version 8 User Guide Introduction Welcome to the user s guide for Version 8 of the LEGENDplex data analysis software for Windows based computers 1. This tutorial will
CellaVision Proficiency Software
 CellaVision Proficiency USER S MANUAL 2.3 CellaVision Proficiency Preface CellaVision is a trademark of CellaVision AB. All other trademarks used in this document are property of their respective owners.
Breeze - Segmentation guide
 Breeze - Segmentation guide This guide will show how to use other type of segmentation than Sample model in Breeze. Note. It s recommended to first go through Powder Quantification Tutorial Table of content
Supporting Information. Super Resolution Imaging of Nanoparticles Cellular Uptake and Trafficking
 Supporting Information Super Resolution Imaging of Nanoparticles Cellular Uptake and Trafficking Daan van der Zwaag 1,2, Nane Vanparijs 3, Sjors Wijnands 1,4, Riet De Rycke 5, Bruno G. De Geest 2* and
Supplementary Figures
 Supplementary Figures re co rd ed ch annels darkf ield MPM2 PI cell cycle phases G1/S/G2 prophase metaphase anaphase telophase bri ghtfield 55 pixel Supplementary Figure 1 Images of Jurkat cells captured
Guide to running KASP TM genotyping reactions on the Roche LC480-Series instruments
 extraction sequencing genotyping extraction sequencing genotyping extraction sequencing genotyping extraction sequencing Guide to running KASP TM genotyping reactions on the Roche LC480-Series instruments
The Arena View. Tutorial. November The Arena is an easy-to-use image management system for analysis of high volume data.
 The Arena View Tutorial November 2014 The Arena is an easy-to-use image management system for analysis of high volume data. The Arena is your working centre in Imaris and an interface for visualizing,
cief Data Analysis Chapter Overview Chapter 12:
 page 285 Chapter 12: cief Data Analysis Chapter Overview Analysis Screen Overview Opening Run Files How Run Data is Displayed Viewing Run Data Data Notifications and Warnings Checking Your Results Group
Cellular Imaging Solutions Imaging with a vision
 Cellular Imaging Solutions Imaging with a vision www.moleculardevices.com High content screening (HCS) utilizes automated, high-resolution microscopy systems to assay and visualize phenotypic responses
The Pathology Company. Cytoplasm Algorithm. User s Guide
 The Pathology Company Cytoplasm Algorithm User s Guide MAN-0220, Revision C 1 December 2014 Cytoplasm Algorithm User s Guide This document applies to eslide Manager Release 12.2 and later. Copyright Notice
ACCEPT MANUAL. Version beta
 ACCEPT MANUAL Version 1.0.0 beta 1 ACCEPT Software 1.1.0 beta Manual The ACCEPT Software developed within the EU Cancer-ID project is an open source image analysis package for the Automated CTC Classification,
The walkthrough is available at /
 The walkthrough is available at https://downloads.openmicroscopy.org/presentations/2018/gbi-sydney / Description We will demonstrate a number of features of the OMERO platform using an OMERO server based
Setting up Micro-Magellan for Device control
 Setting up Micro-Magellan for Device control From the plug-in menu, select Micro-Magellan and the unpopulated window opens Select Configure device control The window below will open, select devices to
Quick Start Guide. ARIS Architect. Version 9.8 Service Release 2
 ARIS Architect Version 9.8 Service Release 2 October 2015 This document applies to ARIS Version 9.8 and to all subsequent releases. Specifications contained herein are subject to change and these changes
The MetaMorph 7.10 Custom Module Editor Quick Start Guide
 The MetaMorph 7.10 Custom Module Editor Quick Start Guide The MetaMorph 7.10 Custom Module Editor Not all images can be analyzed using just an application module and writing a journal might be complex.
Olink Wizard for GenEx
 Olink Wizard for GenEx USER GUIDE Version 1.1 (Feb 2014) TECHNICAL SUPPORT For support and technical information, please contact support@multid.se, or join the GenEx online forum: www.multid.se/forum.php.
BD Multiwell AutoSampler Additional Features Tutorial
 BD Multiwell AutoSampler Additional Features Tutorial Introduction This tutorial provides step-by-step instructions on how to use the additional features available in BD Multiwell Plate Manager (MPM) software
ClonePix TM FL Quick Set-Up Instructions
 ClonePix TM FL Quick Set-Up Instructions Software Release: 1.2.13.971 07MAN1055.A2 Effective Date: 01-Jun-10 QUICK INSTRUCTIONS > CONTENTS Contents What are Quick Set Up Instructions?...3 Starting up ClonePix
A guide to XiT. Main user interface of XiT
 A guide to XiT XiT stands for Xdimensional image analysis Toolbox. It is a tool written in Matlab (R2015b, The MathWorks, Inc., Natick, Massachusetts, United States), which enables performing multidimensional
Getting Started in FCS Express for Previous FlowJo Users
 Getting Started in FCS Express for Previous FlowJo Users The instructions below emphasize similarities and differences between FCS Express 5 and FlowJo v10 and are meant to serve as a translation guide
Experiment Guide - Trypan Blue Image Analysis. Technical Note. Content
 Experiment Guide - Trypan Blue Image Analysis The purpose of this document is to guide the user through the Trypan Blue Image analysis. It does not contain any procedures of setting up a Trypan Blue assay
LSM510 Confocal Microscope Standard Operation Protocol Basic Operation
 LSM510 Confocal Microscope Standard Operation Protocol Basic Operation Please make sure that the COMPRESSED AIR has been TURNED ON prior to the use of the equipment. Kindly inform the administrator if
Leica Microsystems Intelligent Structured Illumination Microscopy
 Widefield Mouse kidney section. Maximum projection of a stack containing 65 planes. Green: glomeruli and convoluted tubules (wheat germ agglutinin Alexa Fluor 488) Blue: Nuclei (DAPI). Structured Illumination
Workflow 1. Description
 Workflow 1 Description Determine protein staining intensities and distances in mitotic apparatus in z-stack intensity images, which were stained for the inner-centromere protein INCENP, and compare the
Definiens. Tissue Studio 4.2. Tutorial 3: Metadata Import, Manual ROI Selection and Vessel Detection
 Definiens Tissue Studio 4.2 Tutorial 3: Metadata Import, Manual ROI Selection and Vessel Detection Tutorial 3: Metadata Import, Manual ROI Selection and Vessel Detection Imprint and Version Copyright 2015
English. Delta2D ANALYZING 2D GELS AS EASY AS POINT AND CLICK EXPLORING LIFE
 Getting started English 2D Western Blots Delta2D ANALYZING 2D GELS AS EASY AS POINT AND CLICK EXPLORING LIFE 2 Copyright DECODON GmbH. DECODON makes no representations, express or implied, with respect
Background information:
 Image- based screening using subcellular localization of FOXO1A in osteosarcoma cells: A computer exercise using CellProfiler & CellProfiler Analyst software Carolina Wählby, Martin Simonsson, Megan Rokop
ND Processing Tools in NIS-Elements
 ND Processing Tools in NIS-Elements Overview This technical note describes basic uses of the ND processing tools available in NIS-Elements. These tools are specifically designed for arithmetic functions
ClonePix TM 2 QUICK SET-UP INTRUCTIONS MANUAL SOFTWARE RELEASE
 ClonePix TM 2 QUICK SET-UP INTRUCTIONS MANUAL SOFTWARE RELEASE 1.2.80.1071 07MAN1181.A1 Effective Date: 30-Jan-11 ECO #: 3093 Contents What are Quick Set-Up Instructions?... 3 Starting up ClonePix 2...
For the Odyssey Fc Near-Infrared Imaging System
 Version 5.2 Quick Start Guide For the Odyssey Fc Near-Infrared Imaging System Page 2 - Odyssey Fc Near-Infrared Imaging System Quick Start Guide 1 Install Image Studio Software Note: Ensure you have the
Visualizing Dynamics with the Multi Frame FLIM Script
 Tutorial Visualizing Dynamics with the Multi Frame FLIM Script Summary This tutorial shows step-by-step, how to separate the different frames of a multi frame image typically acquired with systems containing
SI8000 Cell Motion Imaging System
 SI8000 Cell Motion Imaging System New Product Award Sony Biotechnology Inc. SI8000 Cell Motion Imaging System The Sony SI8000 Cell Motion System uses high speed video microscopy to detect and record cell
Data Collection Software Release Notes. Real-Time PCR Analysis Software Release Notes. SNP Genotyping Analysis Software Release Notes
 PN 101-6531 D1 RELEASE NOTES Biomark/EP1 Software To download the latest version of the software for Biomark HD, Biomark, and EP1, go to fluidigm.com/software. For more information about updating the software,
SAS Visual Analytics 8.2: Getting Started with Reports
 SAS Visual Analytics 8.2: Getting Started with Reports Introduction Reporting The SAS Visual Analytics tools give you everything you need to produce and distribute clear and compelling reports. SAS Visual
Algorithm User Guide:
 Algorithm User Guide: Membrane Quantification Use the Aperio algorithms to adjust (tune) the parameters until the quantitative results are sufficiently accurate for the purpose for which you intend to
ChromQuest 5.0 Quick Reference Guide
 ChromQuest 5.0 Quick Reference Guide This guide contains an overview of the ChromQuest chromatography data system, with topics organized by workflow. For more information, refer to the ChromQuest User
SENSITIVITY DIFFERENTLY TO SEE THINGS THE SPEED AND. Opera Phenix High Content Screening System
 THE SPEED AND SENSITIVITY TO SEE THINGS DIFFERENTLY Opera Phenix High Content Screening System For research use only. Not for use in diagnostic procedures. HIGH CONTENT SCREENING WITHOUT THE COMPROMISE
MassARRAY Typer v
 MassARRAY Typer v4.0.163 MassARRAY Typer v4.0.163 is a maintenance update to Agena Bioscience s MassARRAY Typer v4.0.20 or higher application software. This version provides improved reporting capabilities
a measurable difference
 Thermo Scientific Cell Analysis Software and Informatics Products a measurable difference for everyone Thermo Scientific HCS Studio Cell Analysis Software Thermo Scientific Store Image and Database Management
Instructions for I40XT GameSpy Digital Camera
 Instructions for I40XT GameSpy Digital Camera THANK YOU for your purchase of the Model. Please read this booklet before using the unit. If you should have any questions about this product or any other
CELLQuest Acquisition Tutorial
 CELLQuest Acquisition Tutorial Introduction This tutorial guides you through a CELLQuest Acquisition run like the one demonstrated in the CELLQuest Acquisition Movie on the FACStation Overview CD-ROM.
Definiens. Tissue Studio Release Notes
 Definiens Tissue Studio 3.0.1 Release Notes Definiens Documentation: Definiens Tissue Studio 3.0.1 Release Notes Imprint 2012 Definiens AG. All rights reserved. This document may be copied and printed
Classification: Public ANZ TRANSACTIVE GLOBAL ADMINISTRATION USER GUIDE
 Classification: Public ANZ TRANSACTIVE GLOBAL ADMINISTRATION USER GUIDE 11 2015 CONTENTS INTRODUCTION... 3 USERS... 4 FUNCTION ROLES AND DATA ROLES... 5 FUNCTION ROLES... 5 Create a Function Role... 8
IMARIS 3D and 4D interactive analysis and visualization solutions for the life sciences
 IMARIS 3D and 4D interactive analysis and visualization solutions for the life sciences IMARIS A Brief History For over 20 years Bitplane has offered enabling scientific software tools for the life science
APS (Automatic Population Separator)
") Infinicyt provides a list of very powerful tools for research and diagnosis of haematological diseases through flow cytometry data analysis. The features that most distinguish Infinicyt software from other
Infinicyt provides a list of very powerful tools for research and diagnosis of haematological diseases through flow cytometry data analysis. The features that most distinguish Infinicyt software from other
Volocity Acquisition. Volocity Acquisition part of the Volocity family
 Volocity Acquisition Volocity Acquisition part of the Volocity family Volocity consists of four unique, totally integrated products that provide a suite of tools for 3D and 4D imaging. Choose the Volocity
MATERIALS PLUS Segmentation Measurement
 Example: Segmentation MATERIALS PLUS Segmentation is a method of image partitioning based on the intensity / gray scale range of its components. Since a phase is detected and its area is estimated on the
VCell Tutorial. FRAP with binding
 VCell Tutorial FRAP with binding Create a simple biomodel and spatial (PDE) application to simulate a photobleaching experiment with both diffusion and binding. In this tutorial Gain a basic introduction
Algorithm User Guide:
 Algorithm User Guide: Microvessel Analysis Use the Aperio algorithms to adjust (tune) the parameters until the quantitative results are sufficiently accurate for the purpose for which you intend to use
BD CellQuest Pro Analysis Tutorial
 BD CellQuest Pro Analysis Tutorial Introduction This tutorial guides you through a CellQuest Pro Analysis run like the one demonstrated in the CellQuest Pro Analysis Movie on the BD FACStation Software
INCAGSR. Gun Shot Residue
 INCAGSR GSR Gun Shot Residue INCAGSR G A dedicated solution for automated detection and analysis of Gun Shot Residue using the scanning electron microscope This product has been designed in conjunction
FACCalibur Users Guide
 FACCalibur Users Guide FACSCalibur Start Up Procedure If the Instrument is OFF: 1. Check the sheath and waste tanks. Open the fluidics drawer (front of instrument) and check the levels of sheath fluid
IMAGING SOFTWARE. Image-Pro Insight Image Analysis Made Easy. Capture, Process, Measure, and Share
 IMAGING SOFTWARE Image-Pro Insight Image Analysis Made Easy Capture, Process, Measure, and Share Image-Pro Insight Image Analysis Made Easy Capture, Process, Measure, and Share Image-Pro Insight, the latest
BD FACSDiVa Option. BD Biosciences Clontech Discovery Labware Immunocytometry Systems Pharmingen
 BD FACSDiVa Option The Digital Advantage for the BD FACSVantage SE Flow Cytometry System BD Biosciences Clontech Discovery Labware Immunocytometry Systems Pharmingen Proven Performance in Flow Cytometry
BIG-IQ Centralized Management and Microsoft Hyper-V: Setup. Version 5.0
 BIG-IQ Centralized Management and Microsoft Hyper-V: Setup Version 5.0 Table of Contents Table of Contents Getting Started with BIG-IQ Virtual Edition...5 What is BIG-IQ Virtual Edition?...5 About BIG-IQ
Science is hard. Flow cytometry should be easy.
 Science is hard. Flow cytometry should be easy. CFlow User Guide TABLE OF CONTENTS 1 INTRODUCTION TO CFLOW... 1 1.1 Installing CFlow... 1 1.2 Starting CFlow... 1 1.3 CFlow Workspace... 2 1.4 Opening a
OBCOL. (Organelle Based CO-Localisation) Users Guide
 Users Guide") OBCOL (Organelle Based CO-Localisation) Users Guide INTRODUCTION OBCOL is an ImageJ plugin designed to autonomously detect objects within an image (or image stack) and analyse them separately as individual
OBCOL (Organelle Based CO-Localisation) Users Guide INTRODUCTION OBCOL is an ImageJ plugin designed to autonomously detect objects within an image (or image stack) and analyse them separately as individual
IMAGING SOFTWARE. Image-Pro Insight Image Analysis Made Easy. Capture, Process, Measure, and Share
 IMAGING SOFTWARE Image-Pro Insight Image Analysis Made Easy Capture, Process, Measure, and Share Image-Pro Insight Image Analysis Made Easy Capture, Process, Measure, and Share Image-Pro Insight, the latest
STN AnaVist TM See How It Works
 STN AnaVist TM See How It Works 2015 Table of Contents Save for STN AnaVist... 3 Searching for STN Databases... 3 Use the Save for STN AnaVist Wizard... 4 Additional Information... 5 Importing an Answer
Introductory Guide to Light Microscopy - Biomedical Confocal Microscopy
 Introductory Guide to Light Microscopy - Biomedical Confocal Microscopy 7 May 2007 Michael Hooker Microscopy Facility Michael Chua microscopy@unc.edu 843-3268 6007 Thurston Bowles Wendy Salmon wendy_salmon@med.unc.edu
1. Getting Started: Brief Step-By-Step Guide (PDF File)
") Page 1 of 5 1. Getting Started: Brief Step-By-Step Guide (PDF File) Leica SP2 confocal microscope is controlled via software LCS (Leica Confocal Software). The latest version is V2.5. Bellowing is a brief
Page 1 of 5 1. Getting Started: Brief Step-By-Step Guide (PDF File) Leica SP2 confocal microscope is controlled via software LCS (Leica Confocal Software). The latest version is V2.5. Bellowing is a brief
WCIF COLOCALIS ATION PLUGINS
 WCIF COLOCALIS ATION PLUGINS Colocalisation Test Background When a coefficient is calculated for two images, it is often unclear quite what this means, in particular for intermediate values. This raises
ImageTrakTM Packard BioScience Epi-Fluorescence System
 ImageTrakTM Packard BioScience Epi-Fluorescence System > Membrane Potential > Ion Channel > Intracellular Calcium > FRET Assays > Prompt Fluorescence Expanding Your Options for High Throughput Drug Discovery
GlucoManager TM Software. User s Guide
 GlucoManager TM Software User s Guide 1 Table of Contents Preface... 6 Software Overview... 6 Intended Use... 7 Purpose and Scope... 7 Computer Requirements... 8 Technical Support... 9 1. Introduction...
Server Edition USER MANUAL. For Mac OS X
 Server Edition USER MANUAL For Mac OS X Copyright Notice & Proprietary Information Redstor Limited, 2016. All rights reserved. Trademarks - Mac, Leopard, Snow Leopard, Lion and Mountain Lion are registered
Quick Start Guide. ARIS Architect. Version 9.7
 ARIS Architect Version 9.7 October 2014 This document applies to ARIS Version 9.7 and to all subsequent releases. Specifications contained herein are subject to change and these changes will be reported
FACSLSRFortessa SORP QUICK REFERENCE GUIDE
 FACSLSRFortessa SORP QUICK REFERENCE GUIDE INSTRUMENT: 1. The computer is left on at all times. Note: If not Username: Administrator Password: BDIS 2. Unlock the screen with your PPMS account (UTSW username
Gallios TM Quick Reference
 Gallios TM Quick Reference Purpose: The purpose of this Quick Reference is to provide a simple step by step outline of the information needed to perform various tasks on the system. We begin with basic