Introduction to digital image classification
|
|
|
- Shavonne Simpson
- 5 years ago
- Views:
Transcription


1 Introduction to digital image classification Dr. Norman Kerle, Wan Bakx MSc a.o. INTERNATIONAL INSTITUTE FOR GEO-INFORMATION SCIENCE AND EARTH OBSERVATION
2 Purpose of lecture Main lecture topics Review of basic concepts of pixel-based classification Review of principal terms (Image space vs. feature space) Decision boundaries in feature space Unsupervised vs. supervised classification Training of classifier Classification algorithms available Validation of results Problems and limitations
3 The Remote Sensing Process Energy Source Sensor SatCom Application Target Processing Station Analysis
4 Multispectral Classification What is it? grouping of similar features separation of dissimilar ones assigning class label to pixels resulting in manageable size of classes
5 Generalised workflow Primary Data Acquisition Pre-processing Image restoration, Radiometric corrections, Geometric corrections Image Enhancement Contrast, Noise, Sharpness Image Fusion Multi-temporal, Multi-resolution, Mosaicking Feature Extraction, quantitative Spectral (NDVI), Spatial (lines, edges), Statistical (PCA) Information extraction, qualitative Classification Supervised Unsupervised Segmentation, spatial objects Visual Interpretation
6 Multispectral Classification What are the advantages of using image classification? We are not interested in brightness values, but in thematic characteristics To translate continuous variability of image data into map patterns that provide meaning to the user To obtain insight in the data with respect to ground cover and surface characteristics To find anomalous patterns in the image data set
7 Multispectral Classification Why use it? - cont Cost efficient in the analyses of large data sets Results can be reproduced More objective then visual interpretation Effective analysis of complex multi-band (spectral) interrelationships Classification achieves data size reduction Together with manual digitising and photogrammetric processing (for map making), classification is the most commonly used image processing technique
8 Classification Methods MANUAL (Chapter 11) visual interpretation combination of spectral and spatial information (all interpretation elements) COMPUTER ASSISTED mainly spectral information STRATIFIED using GIS functionality to incorporate knowledge from other sources of information

9 Supervised Classification Objective: Converting image data into thematic data
10 Image Space Multi-band Image

11 One-dimensional feature space Histogram Input layer (single)? No distinction between slices/classes Segmented image Histogram Distinction between slices/classes unsupervised classification
12 Multi-dimensional Feature Space feature vectors e.g. (34, 25, 117) (34, 24, 119) statistical pattern recognition
 High")
13 Feature space (scatterplot) Low frequency Feature space Two/three dimensional graph or scattered diagram Formation of clusters of points representing DN values in two/three spectral bands Each cluster of points corresponds to a certain cover type on ground (theoretically) High frequency 1D
14 Distances and clusters in feature space band y (units of 5 DN).. (0,0) band x (units of 5 DN) Max y Min y Euclidian distance (0,0) Min x Max x Cluster
15 Supervised vs. unsupervised classification UNSUPERVISED APPROACH Based on spectral groupings Considers only spectral distance measures Minimum user interaction Requires interpretation after classification SUPERVISED APPROACH Based on spectral groupings Incorporates prior knowledge/samples More extensive user interaction
16 Unsupervised Slicing Input layer (single) Segmented image Histogram Distinction between slices unsupervised classification
 Re-compute class mean vectors Iterations continue until convergence threshold has been reached Final class allocation Cluster statistics")
17 Unsupervised classification (clustering) Clustering algorithm User defined cluster parameters Class mean vectors are arbitrarily set by algorithm (iteration 0) Class allocation of feature vectors Compute new class mean vectors Class allocation (iteration 2) Re-compute class mean vectors Iterations continue until convergence threshold has been reached Final class allocation Cluster statistics reporting Feature spaces!
18 Supervised Classification Principle Collect samples for training the classifier Define clusters (decision boundaries) in the feature space Assign a class label to a pixel based on its feature vector and the predefined clusters in the feature space (160,170) = Grass (60,40)= House
19 Supervised classification procedure 1. Define/describe the different classes 2. Collect ground truth Define classes Text 3. Create a sample set N Collect Ground Truth Analogue/ Digital data 4. Choose a classifier / decision rule / algorithm Satisfied Y /N Accuracy matrix Quality Assessment Create Sample set Digital samples Statistics Choose decision rule 5. Classify 6. Assess the (quality of the) classifcation 1. Return to 1, 2, 3 or 4 Classify Image data Classification

20 Training sample statistics E.g. Minimum, Maximum, Mean, Standard deviation, Variance, Co-Variance
21 Training samples in potential feature spaces The points a,b and c are cluster centres of clusters A, B and C. Line ab is the distance between the cluster centres A and B. There is overlap between the clusters A and B. Clusters A and B are too close to each other which may give the problem of overlap between the classes.
22 Sample set - 1 Band Ground-truth Freq Histogram of training/sample set Samples set of classes Class-Slices
23 1 band/dimension - Slicing Histogram of training set Class-Intervals Decision rule: Priority to the smallest slice length/spreading

24 Two bands Box Classification Means and Standard Deviations Partitioned Feature Space Band 2 Band Band Band Feature Space Partitioning - Box classifier [Min,Max] or [Mean - xsd,mean + xsd]
25 Box classification Characteristics considers only the lower and the upper limits of cluster computation is simple and fast Disadvantage overlapping boxes poorly adapted to cluster shape
26 1 Dimension - Minimum Distance Histogram of training set Class-Intervals Decision rule: Priority to the shortest distance to the class mean


27 N dimensions Min. Distance to Mean 255 "Unknown" 255 Mean vectors Band 2 Band Band Band Band 2 Feature Space Partitioning - Minimum Distance to Mean Classifier 0 0 Band Threshold Distance
28 Minimum distance to mean classifier Characteristics emphasis on the location of cluster centre class labelling by considering minimum distance to the cluster centres Disadvantage disregards the presence of variability within a class shape and size of the clusters are not considered
29 1 band Maximum Likelihood Histogram of training set & Probability density functions The probability that a pixel value x belongs to a class is calculated assuming a normal/gaussian distribution f(x) = σ 1 2π e (x μ) 2σ Class-Intervals Decision rule: Priority to the highest probability (based upon σ and μ)

30 Maximum likelihood classifier 255 "Unknown" Mean vectors and variancecovariance matrices Band Band 2 0 Band Band Band 2 Feature Space Partitioning - Maximum Likelihood Classifier 0 0 Band 1 255
31 Maximum Likelihood classifcation Characteristics considers variability within a cluster considers the shape, the size and the orientation of clusters Equiprobability contours Disadvantage takes more computing time based on assumption that Probability Density Function is normally distributed Probability density functions (Lillesand and Kiefer, 1987)
32 Validation samples sampling design Number of samples is related to: The number of samples that must be taken in order to reject a data set as being inaccurate The number of samples required to determine the true accuracy, within some error bounds Sampling design: A B A B A B C C C Systematic Sampling (n=9) Simple Random Sampling (n=9) Stratified Random Sampling (n=9)
33 Accuracy assessment Basic data for 4 land cover classes 163 ground truth samples Classification Result Reference Class Total A B C D A B C D Total Reference or Ground Truth Sample/training set
34 Measures of thematic accuracy Error of commission and user accuracy Error of omission and producer accuracy Reference Class A B C D Total Error of Commision User Accuracy Classification result A % 57% B % 61% C % 60% D % 10% Total Error of Omission Producer Accuracy 34% 72% 41% 71% Overall Accuracy = SumDiag/SumTotal (4+12+2)/ % 66% 28% 59% 29% 35/ Error or confusion matrix
35 Validation Reference Class A B C D Total Error of Commision User Accuracy Classification result A % B % C % D % Total Error of Omission Producer Accuracy Overall Accuracy = SumDiag/SumTotal (4+12+2)/ % 66% 28% 59% 29% 35/ Row : Classification Error of Commission = Reliability = Row_offdiagonal/ Row Column : Reference Error of Omission = Accuracy/class = Col_offdiagonal/ Col
36 Validation terminology User accuracy: Probability that a certain reference class has also been labelled as that class. In other words, it tells us the likelihood that a pixel classified as a certain class actually represents that class (57% of what has been classified as A is A). Producer accuracy: Probability that a reference pixel on a map is that particular class. It indicates how well the reference pixels for that class have been classified (66% of the reference pixels A were classified as A) Kappa statistic: Takes into account that even assigning labels at random has a certain degree of accuracy. Kappa allows to detect if 2 datasets have a statistically different accuracy.
37 Error matrix The error matrix provides information on the overall accuracy = proportion correctly classified (PCC) PCC tells about the amount of error, not where the errors are located PCC = Sum of the diagonal elements/total number of sampled pixels for accuracy assessment
38 Improvements Create more than 1 feature class for one land cover/use class Filter salt/pepper (majority on result) Use masks to identify areas where other rules apply (hybrid) Use multi temporal expertise to identify classes (expert knowledge) Use other additional data (expert knowledge)


39 Classification preparation Application dependent aspects: Class definition Spatio-temporal characteristics Sensor characteristics: Bands Spatial resolution Acquisition date(s) Band selection constraints: Non correlated set Software limitations Sensor(s)


40 Class definition problems No use of other characteristics location, orientation, pattern, texture... Spectral overlap Heterogeneous classes Mixed pixels Class definition Land Use Land Cover
41 Problems Land Cover/Land Use Constraints of pixel based image classification it results in spectral classes each pixel is assigned to one class only Land use Land cover Sport Grass Training samples Spectral classes Meadow Spectral bands - Spectral classes - Land cover - Land use
42 Problems Land Cover/Land Use Spectral Class Land Cover Class Land Use Class water water shrimp cultivation grass1 grass2 grass3 bare soil grass grass grass bare soil nature reserve nature reserve nature reserve nature reserve trees1 trees2 trees3 forest forest forest nature reserve production forest city park 1-n and n-1 relationships can exist between land cover and land use classes DEM or other additional data can help improve a classification


43 Problems mixed pixels Objects smaller than a pixel Mixtures Boundaries between objects Transitions

44 Problems spatial resolution Resolution dependency Each pixel contains approximately the same mixture Distinct reflection measurement Regular, repetition of spatial pattern Large cluster in the feature space Spectral overlap with other classes
45 Alternative procedures Hybrid (stratified) Classification Unsupervised/Clustering (Hyper)Spectral Classifications Subpixel Classification Object Based Classification Expert/Knowledge Based Classification Neural Network
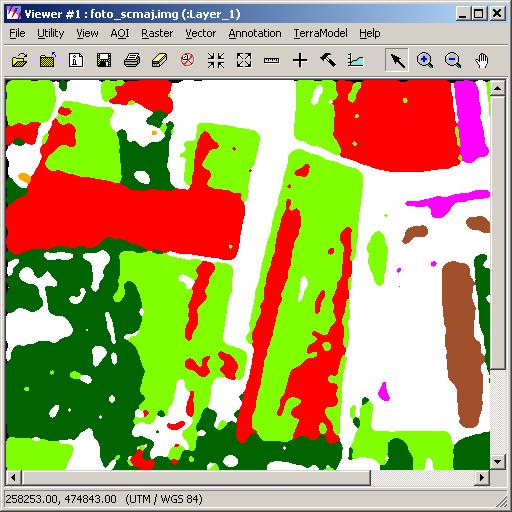
46 Example - Feature space
47 Box classification factor 1.7
48 Box classification factor 4
49 Box classification factor 10
50 Minimum distance threshold 50

51 Minimum distance threshold 100

52 Maximum likelihood threshold 100
53 Object Based Classification (adv.) Segmentation Classified segments Assessment Image Majority based Object classification Pixel Based classification Assessment


54 Objects Obtain objects by: Edge detection Post-classification Segmentation Vector reference
55 Classes Obtain class label from: Frequency/majority Object mean...

 Classify segments Classify")

56 OBC by object means Image Segmentation pixels segment ii value = μ (segment i ) i ) Classify segments Classify segments Assessment Training samples Retrieve class signatures
DIGITAL IMAGE ANALYSIS. Image Classification: Object-based Classification
 DIGITAL IMAGE ANALYSIS Image Classification: Object-based Classification Image classification Quantitative analysis used to automate the identification of features Spectral pattern recognition Unsupervised
Data: a collection of numbers or facts that require further processing before they are meaningful
 Digital Image Classification Data vs. Information Data: a collection of numbers or facts that require further processing before they are meaningful Information: Derived knowledge from raw data. Something
(Refer Slide Time: 0:51)
") Introduction to Remote Sensing Dr. Arun K Saraf Department of Earth Sciences Indian Institute of Technology Roorkee Lecture 16 Image Classification Techniques Hello everyone welcome to 16th lecture in
Introduction to Remote Sensing Dr. Arun K Saraf Department of Earth Sciences Indian Institute of Technology Roorkee Lecture 16 Image Classification Techniques Hello everyone welcome to 16th lecture in
Lab 9. Julia Janicki. Introduction
 Lab 9 Julia Janicki Introduction My goal for this project is to map a general land cover in the area of Alexandria in Egypt using supervised classification, specifically the Maximum Likelihood and Support
Aardobservatie en Data-analyse Image processing
 Aardobservatie en Data-analyse Image processing 1 Image processing: Processing of digital images aiming at: - image correction (geometry, dropped lines, etc) - image calibration: DN into radiance or into
Image Classification. RS Image Classification. Present by: Dr.Weerakaset Suanpaga
 Image Classification Present by: Dr.Weerakaset Suanpaga D.Eng(RS&GIS) 6.1 Concept of Classification Objectives of Classification Advantages of Multi-Spectral data for Classification Variation of Multi-Spectra
Classification. Vladimir Curic. Centre for Image Analysis Swedish University of Agricultural Sciences Uppsala University
 Classification Vladimir Curic Centre for Image Analysis Swedish University of Agricultural Sciences Uppsala University Outline An overview on classification Basics of classification How to choose appropriate
Classification (or thematic) accuracy assessment. Lecture 8 March 11, 2005
 accuracy assessment. Lecture 8 March 11, 2005") Classification (or thematic) accuracy assessment Lecture 8 March 11, 2005 Why and how Remote sensing-derived thematic information are becoming increasingly important. Unfortunately, they contain errors.
Classification (or thematic) accuracy assessment Lecture 8 March 11, 2005 Why and how Remote sensing-derived thematic information are becoming increasingly important. Unfortunately, they contain errors.
Spectral Classification
 Spectral Classification Spectral Classification Supervised versus Unsupervised Classification n Unsupervised Classes are determined by the computer. Also referred to as clustering n Supervised Classes
Remote Sensing Introduction to the course
 Remote Sensing Introduction to the course Remote Sensing (Prof. L. Biagi) Exploitation of remotely assessed data for information retrieval Data: Digital images of the Earth, obtained by sensors recording
APPLICATION OF SOFTMAX REGRESSION AND ITS VALIDATION FOR SPECTRAL-BASED LAND COVER MAPPING
 APPLICATION OF SOFTMAX REGRESSION AND ITS VALIDATION FOR SPECTRAL-BASED LAND COVER MAPPING J. Wolfe a, X. Jin a, T. Bahr b, N. Holzer b, * a Harris Corporation, Broomfield, Colorado, U.S.A. (jwolfe05,
Image Classification. Introduction to Photogrammetry and Remote Sensing (SGHG 1473) Dr. Muhammad Zulkarnain Abdul Rahman
 Dr. Muhammad Zulkarnain Abdul Rahman") Image Classification Introduction to Photogrammetry and Remote Sensing (SGHG 1473) Dr. Muhammad Zulkarnain Abdul Rahman Classification Multispectral classification may be performed using a variety of methods,
Image Classification Introduction to Photogrammetry and Remote Sensing (SGHG 1473) Dr. Muhammad Zulkarnain Abdul Rahman Classification Multispectral classification may be performed using a variety of methods,
Remote Sensing & Photogrammetry W4. Beata Hejmanowska Building C4, room 212, phone:
 Remote Sensing & Photogrammetry W4 Beata Hejmanowska Building C4, room 212, phone: +4812 617 22 72 605 061 510 galia@agh.edu.pl 1 General procedures in image classification Conventional multispectral classification
Raster Classification with ArcGIS Desktop. Rebecca Richman Andy Shoemaker
 Raster Classification with ArcGIS Desktop Rebecca Richman Andy Shoemaker Raster Classification What is it? - Classifying imagery into different land use/ land cover classes based on the pixel values of
Aerial photography: Principles. Visual interpretation of aerial imagery
 Aerial photography: Principles Visual interpretation of aerial imagery Overview Introduction Benefits of aerial imagery Image interpretation Elements Tasks Strategies Keys Accuracy assessment Benefits
Object-Based Classification & ecognition. Zutao Ouyang 11/17/2015
 Object-Based Classification & ecognition Zutao Ouyang 11/17/2015 What is Object-Based Classification The object based image analysis approach delineates segments of homogeneous image areas (i.e., objects)
Lecture 11: Classification
 Lecture 11: Classification 1 2009-04-28 Patrik Malm Centre for Image Analysis Swedish University of Agricultural Sciences Uppsala University 2 Reading instructions Chapters for this lecture 12.1 12.2 in
Classification. Vladimir Curic. Centre for Image Analysis Swedish University of Agricultural Sciences Uppsala University
 Classification Vladimir Curic Centre for Image Analysis Swedish University of Agricultural Sciences Uppsala University Outline An overview on classification Basics of classification How to choose appropriate
Attribute Accuracy. Quantitative accuracy refers to the level of bias in estimating the values assigned such as estimated values of ph in a soil map.
 Attribute Accuracy Objectives (Entry) This basic concept of attribute accuracy has been introduced in the unit of quality and coverage. This unit will teach a basic technique to quantify the attribute
INF 4300 Classification III Anne Solberg The agenda today:
 INF 4300 Classification III Anne Solberg 28.10.15 The agenda today: More on estimating classifier accuracy Curse of dimensionality and simple feature selection knn-classification K-means clustering 28.10.15
Figure 1: Workflow of object-based classification
 Technical Specifications Object Analyst Object Analyst is an add-on package for Geomatica that provides tools for segmentation, classification, and feature extraction. Object Analyst includes an all-in-one
Lab #4 Introduction to Image Processing II and Map Accuracy Assessment
 FOR 324 Natural Resources Information Systems Lab #4 Introduction to Image Processing II and Map Accuracy Assessment (Adapted from the Idrisi Tutorial, Introduction Image Processing Exercises, Exercise
AN INTEGRATED APPROACH TO AGRICULTURAL CROP CLASSIFICATION USING SPOT5 HRV IMAGES
 AN INTEGRATED APPROACH TO AGRICULTURAL CROP CLASSIFICATION USING SPOT5 HRV IMAGES Chang Yi 1 1,2,*, Yaozhong Pan 1, 2, Jinshui Zhang 1, 2 College of Resources Science and Technology, Beijing Normal University,
GEOBIA for ArcGIS (presentation) Jacek Urbanski
 Jacek Urbanski") GEOBIA for ArcGIS (presentation) Jacek Urbanski INTEGRATION OF GEOBIA WITH GIS FOR SEMI-AUTOMATIC LAND COVER MAPPING FROM LANDSAT 8 IMAGERY Presented at 5th GEOBIA conference 21 24 May in Thessaloniki.
GEOBIA for ArcGIS (presentation) Jacek Urbanski INTEGRATION OF GEOBIA WITH GIS FOR SEMI-AUTOMATIC LAND COVER MAPPING FROM LANDSAT 8 IMAGERY Presented at 5th GEOBIA conference 21 24 May in Thessaloniki.
Lab 5: Image Analysis with ArcGIS 10 Unsupervised Classification
 Lab 5: Image Analysis with ArcGIS 10 Unsupervised Classification Peter E. Price TerraView 2010 Peter E. Price All rights reserved Revised 03/2011 Revised for Geob 373 by BK Feb 28, 2017. V3 The information
Classifying. Stuart Green Earthobservation.wordpress.com MERMS 12 - L4
 Classifying Stuart Green Earthobservation.wordpress.com Stuart.Green@Teagasc.ie MERMS 12 - L4 Classifying Replacing the digital numbers in each pixel (that tell us the average spectral properties of everything
The Gain setting for Landsat 7 (High or Low Gain) depends on: Sensor Calibration - Application. the surface cover types of the earth and the sun angle
 depends on: Sensor Calibration - Application. the surface cover types of the earth and the sun angle") Sensor Calibration - Application Station Identifier ASN Scene Center atitude 34.840 (34 3'0.64"N) Day Night DAY Scene Center ongitude 33.03270 (33 0'7.72"E) WRS Path WRS Row 76 036 Corner Upper eft atitude
Sensor Calibration - Application Station Identifier ASN Scene Center atitude 34.840 (34 3'0.64"N) Day Night DAY Scene Center ongitude 33.03270 (33 0'7.72"E) WRS Path WRS Row 76 036 Corner Upper eft atitude
Land Cover Classification Techniques
 Land Cover Classification Techniques supervised classification and random forests Developed by remote sensing specialists at the USFS Geospatial Technology and Applications Center (GTAC), located in Salt
High Resolution Remote Sensing Image Classification based on SVM and FCM Qin LI a, Wenxing BAO b, Xing LI c, Bin LI d
 2nd International Conference on Electrical, Computer Engineering and Electronics (ICECEE 2015) High Resolution Remote Sensing Image Classification based on SVM and FCM Qin LI a, Wenxing BAO b, Xing LI
Clustering and Dissimilarity Measures. Clustering. Dissimilarity Measures. Cluster Analysis. Perceptually-Inspired Measures
 Clustering and Dissimilarity Measures Clustering APR Course, Delft, The Netherlands Marco Loog May 19, 2008 1 What salient structures exist in the data? How many clusters? May 19, 2008 2 Cluster Analysis
Fuzzy Segmentation. Chapter Introduction. 4.2 Unsupervised Clustering.
 Chapter 4 Fuzzy Segmentation 4. Introduction. The segmentation of objects whose color-composition is not common represents a difficult task, due to the illumination and the appropriate threshold selection
ENVI. Get the Information You Need from Imagery.
 Visual Information Solutions ENVI. Get the Information You Need from Imagery. ENVI is the premier software solution to quickly, easily, and accurately extract information from geospatial imagery. Easy
Nearest Clustering Algorithm for Satellite Image Classification in Remote Sensing Applications
 Nearest Clustering Algorithm for Satellite Image Classification in Remote Sensing Applications Anil K Goswami 1, Swati Sharma 2, Praveen Kumar 3 1 DRDO, New Delhi, India 2 PDM College of Engineering for
Network Traffic Measurements and Analysis
 DEIB - Politecnico di Milano Fall, 2017 Introduction Often, we have only a set of features x = x 1, x 2,, x n, but no associated response y. Therefore we are not interested in prediction nor classification,
Digital Image Classification Geography 4354 Remote Sensing
 Digital Image Classification Geography 4354 Remote Sensing Lab 11 Dr. James Campbell December 10, 2001 Group #4 Mark Dougherty Paul Bartholomew Akisha Williams Dave Trible Seth McCoy Table of Contents:
Image Analysis, Classification and Change Detection in Remote Sensing
 Image Analysis, Classification and Change Detection in Remote Sensing WITH ALGORITHMS FOR ENVI/IDL Morton J. Canty Taylor &. Francis Taylor & Francis Group Boca Raton London New York CRC is an imprint
Gene Clustering & Classification
 BINF, Introduction to Computational Biology Gene Clustering & Classification Young-Rae Cho Associate Professor Department of Computer Science Baylor University Overview Introduction to Gene Clustering
Change Detection in Remotely Sensed Images Based on Image Fusion and Fuzzy Clustering
 International Journal of Electronics Engineering Research. ISSN 0975-6450 Volume 9, Number 1 (2017) pp. 141-150 Research India Publications http://www.ripublication.com Change Detection in Remotely Sensed
Quality assessment of RS data. Remote Sensing (GRS-20306)
") Quality assessment of RS data Remote Sensing (GRS-20306) Quality assessment General definition for quality assessment (Wikipedia) includes evaluation, grading and measurement process to assess design,
Quality assessment of RS data Remote Sensing (GRS-20306) Quality assessment General definition for quality assessment (Wikipedia) includes evaluation, grading and measurement process to assess design,
COMBINING HIGH SPATIAL RESOLUTION OPTICAL AND LIDAR DATA FOR OBJECT-BASED IMAGE CLASSIFICATION
 COMBINING HIGH SPATIAL RESOLUTION OPTICAL AND LIDAR DATA FOR OBJECT-BASED IMAGE CLASSIFICATION Ruonan Li 1, Tianyi Zhang 1, Ruozheng Geng 1, Leiguang Wang 2, * 1 School of Forestry, Southwest Forestry
Pattern Recognition & Classification
 CEE 6150: Digital Image Processing 1 Classification Supervised parallelpiped minimum distance maximum likelihood (Bayes Rule) > non-parametric > parametric Unsupervised (clustering) K-Means ISODATA support
Classify Multi-Spectral Data Classify Geologic Terrains on Venus Apply Multi-Variate Statistics
 Classify Multi-Spectral Data Classify Geologic Terrains on Venus Apply Multi-Variate Statistics Operations What Do I Need? Classify Merge Combine Cross Scan Score Warp Respace Cover Subscene Rotate Translators
ArcGIS Pro: Image Segmentation, Classification, and Machine Learning. Jeff Liedtke and Han Hu
 ArcGIS Pro: Image Segmentation, Classification, and Machine Learning Jeff Liedtke and Han Hu Overview of Image Classification in ArcGIS Pro Overview of the classification workflow Classification tools
A Vector Agent-Based Unsupervised Image Classification for High Spatial Resolution Satellite Imagery
 A Vector Agent-Based Unsupervised Image Classification for High Spatial Resolution Satellite Imagery K. Borna 1, A. B. Moore 2, P. Sirguey 3 School of Surveying University of Otago PO Box 56, Dunedin,
SYDE Winter 2011 Introduction to Pattern Recognition. Clustering
 SYDE 372 - Winter 2011 Introduction to Pattern Recognition Clustering Alexander Wong Department of Systems Design Engineering University of Waterloo Outline 1 2 3 4 5 All the approaches we have learned
A Comparative Study of Conventional and Neural Network Classification of Multispectral Data
 A Comparative Study of Conventional and Neural Network Classification of Multispectral Data B.Solaiman & M.C.Mouchot Ecole Nationale Supérieure des Télécommunications de Bretagne B.P. 832, 29285 BREST
CLASSIFICATION AND CHANGE DETECTION
 IMAGE ANALYSIS, CLASSIFICATION AND CHANGE DETECTION IN REMOTE SENSING With Algorithms for ENVI/IDL and Python THIRD EDITION Morton J. Canty CRC Press Taylor & Francis Group Boca Raton London NewYork CRC
Image Segmentation. Srikumar Ramalingam School of Computing University of Utah. Slides borrowed from Ross Whitaker
 Image Segmentation Srikumar Ramalingam School of Computing University of Utah Slides borrowed from Ross Whitaker Segmentation Semantic Segmentation Indoor layout estimation What is Segmentation? Partitioning
EVALUATION OF THE THEMATIC INFORMATION CONTENT OF THE ASTER-VNIR IMAGERY IN URBAN AREAS BY CLASSIFICATION TECHNIQUES
 EVALUATION OF THE THEMATIC INFORMATION CONTENT OF THE ASTER-VNIR IMAGERY IN URBAN AREAS BY CLASSIFICATION TECHNIQUES T. G. Panagou a *, G. Ch. Miliaresis a a TEI, Dpt. of Topography, 3 P.Drakou Str., Thiva,
IMAGE ANALYSIS, CLASSIFICATION, and CHANGE DETECTION in REMOTE SENSING
 SECOND EDITION IMAGE ANALYSIS, CLASSIFICATION, and CHANGE DETECTION in REMOTE SENSING ith Algorithms for ENVI/IDL Morton J. Canty с*' Q\ CRC Press Taylor &. Francis Group Boca Raton London New York CRC
Clustering Lecture 5: Mixture Model
 Clustering Lecture 5: Mixture Model Jing Gao SUNY Buffalo 1 Outline Basics Motivation, definition, evaluation Methods Partitional Hierarchical Density-based Mixture model Spectral methods Advanced topics
Supervised vs. Unsupervised Learning
 Clustering Supervised vs. Unsupervised Learning So far we have assumed that the training samples used to design the classifier were labeled by their class membership (supervised learning) We assume now
Clustering and Visualisation of Data
 Clustering and Visualisation of Data Hiroshi Shimodaira January-March 28 Cluster analysis aims to partition a data set into meaningful or useful groups, based on distances between data points. In some
Geomatica II Course guide
 Course guide Geomatica Version 2017 SP4 2017 PCI Geomatics Enterprises, Inc. All rights reserved. COPYRIGHT NOTICE Software copyrighted by PCI Geomatics Enterprises, Inc., 90 Allstate Parkway, Suite 501
Fast Sample Generation with Variational Bayesian for Limited Data Hyperspectral Image Classification
 Fast Sample Generation with Variational Bayesian for Limited Data Hyperspectral Image Classification July 26, 2018 AmirAbbas Davari, Hasan Can Özkan, Andreas Maier, Christian Riess Pattern Recognition
Uttam Kumar and Ramachandra T.V. Energy & Wetlands Research Group, Centre for Ecological Sciences, Indian Institute of Science, Bangalore
 Remote Sensing and GIS for Monitoring Urban Dynamics Uttam Kumar and Ramachandra T.V. Energy & Wetlands Research Group, Centre for Ecological Sciences, Indian Institute of Science, Bangalore 560 012. Remote
University of Florida CISE department Gator Engineering. Clustering Part 5
 Clustering Part 5 Dr. Sanjay Ranka Professor Computer and Information Science and Engineering University of Florida, Gainesville SNN Approach to Clustering Ordinary distance measures have problems Euclidean
NAME :... Signature :... Desk no. :... Question Answer
 Written test Tuesday 19th of December 2000. Aids allowed : All usual aids Weighting : All questions are equally weighted. NAME :................................................... Signature :...................................................
Clustering. Supervised vs. Unsupervised Learning
 Clustering Supervised vs. Unsupervised Learning So far we have assumed that the training samples used to design the classifier were labeled by their class membership (supervised learning) We assume now
Using Machine Learning to Optimize Storage Systems
 Using Machine Learning to Optimize Storage Systems Dr. Kiran Gunnam 1 Outline 1. Overview 2. Building Flash Models using Logistic Regression. 3. Storage Object classification 4. Storage Allocation recommendation
Application of nonparametric Bayesian classifier to remote sensing data. Institute of Parallel Processing, Bulgarian Academy of Sciences
 Application of nonparametric Bayesian classifier to remote sensing data Nina Jeliazkova, nina@acad.bg, +359 2 979 6606 Stela Ruseva, stela@acad.bg, +359 2 979 6606 Kiril Boyanov, boyanov@acad.bg Institute
Fourier Transform and Texture Filtering
 Fourier Transform and Texture Filtering Lucas J. van Vliet www.ph.tn.tudelft.nl/~lucas Image Analysis Paradigm scene Image formation sensor pre-processing Image enhancement Image restoration Texture filtering
ECG782: Multidimensional Digital Signal Processing
 Professor Brendan Morris, SEB 3216, brendan.morris@unlv.edu ECG782: Multidimensional Digital Signal Processing Spring 2014 TTh 14:30-15:45 CBC C313 Lecture 10 Segmentation 14/02/27 http://www.ee.unlv.edu/~b1morris/ecg782/
3D Visualization and Spatial Data Mining for Analysis of LULC Images
 3D Visualization and Spatial Data Mining for Analysis of LULC Images Kodge B. G. Department of Computer Science, Swami Vivekanand Mahavidyalaya, Udgir, Latur, India kodgebg@hotmail.com Abstract: The present
Statistical Analysis of Metabolomics Data. Xiuxia Du Department of Bioinformatics & Genomics University of North Carolina at Charlotte
 Statistical Analysis of Metabolomics Data Xiuxia Du Department of Bioinformatics & Genomics University of North Carolina at Charlotte Outline Introduction Data pre-treatment 1. Normalization 2. Centering,
Analysis of Functional MRI Timeseries Data Using Signal Processing Techniques
 Analysis of Functional MRI Timeseries Data Using Signal Processing Techniques Sea Chen Department of Biomedical Engineering Advisors: Dr. Charles A. Bouman and Dr. Mark J. Lowe S. Chen Final Exam October
Estimating the Natural Number of Classes on Hierarchically Clustered Multi-spectral Images
 Estimating the Natural Number of Classes on Hierarchically Clustered Multi-spectral Images André R.S. Marçal and Janete S. Borges Faculdade de Ciências, Universidade do Porto, DMA, Rua do Campo Alegre,
ECE 176 Digital Image Processing Handout #14 Pamela Cosman 4/29/05 TEXTURE ANALYSIS
 ECE 176 Digital Image Processing Handout #14 Pamela Cosman 4/29/ TEXTURE ANALYSIS Texture analysis is covered very briefly in Gonzalez and Woods, pages 66 671. This handout is intended to supplement that
Region-based Segmentation
 Region-based Segmentation Image Segmentation Group similar components (such as, pixels in an image, image frames in a video) to obtain a compact representation. Applications: Finding tumors, veins, etc.
Learning and Inferring Depth from Monocular Images. Jiyan Pan April 1, 2009
 Learning and Inferring Depth from Monocular Images Jiyan Pan April 1, 2009 Traditional ways of inferring depth Binocular disparity Structure from motion Defocus Given a single monocular image, how to infer
COSC160: Detection and Classification. Jeremy Bolton, PhD Assistant Teaching Professor
 COSC160: Detection and Classification Jeremy Bolton, PhD Assistant Teaching Professor Outline I. Problem I. Strategies II. Features for training III. Using spatial information? IV. Reducing dimensionality
Histograms. h(r k ) = n k. p(r k )= n k /NM. Histogram: number of times intensity level rk appears in the image
 = n k. p(r k )= n k /NM. Histogram: number of times intensity level rk appears in the image") Histograms h(r k ) = n k Histogram: number of times intensity level rk appears in the image p(r k )= n k /NM normalized histogram also a probability of occurence 1 Histogram of Image Intensities Create
Histograms h(r k ) = n k Histogram: number of times intensity level rk appears in the image p(r k )= n k /NM normalized histogram also a probability of occurence 1 Histogram of Image Intensities Create
CHAPTER 5 OBJECT ORIENTED IMAGE ANALYSIS
 85 CHAPTER 5 OBJECT ORIENTED IMAGE ANALYSIS 5.1 GENERAL Urban feature mapping is one of the important component for the planning, managing and monitoring the rapid urbanized growth. The present conventional
Adaptive Learning of an Accurate Skin-Color Model
 Adaptive Learning of an Accurate Skin-Color Model Q. Zhu K.T. Cheng C. T. Wu Y. L. Wu Electrical & Computer Engineering University of California, Santa Barbara Presented by: H.T Wang Outline Generic Skin
The Feature Analyst Extension for ERDAS IMAGINE
 The Feature Analyst Extension for ERDAS IMAGINE Automated Feature Extraction Software for GIS Database Maintenance We put the information in GIS SM A Visual Learning Systems, Inc. White Paper September
CS 2750 Machine Learning. Lecture 19. Clustering. CS 2750 Machine Learning. Clustering. Groups together similar instances in the data sample
 Lecture 9 Clustering Milos Hauskrecht milos@cs.pitt.edu 539 Sennott Square Clustering Groups together similar instances in the data sample Basic clustering problem: distribute data into k different groups
Introduction to Pattern Recognition Part II. Selim Aksoy Bilkent University Department of Computer Engineering
 Introduction to Pattern Recognition Part II Selim Aksoy Bilkent University Department of Computer Engineering saksoy@cs.bilkent.edu.tr RETINA Pattern Recognition Tutorial, Summer 2005 Overview Statistical
Reconstruction of Images Distorted by Water Waves
 Reconstruction of Images Distorted by Water Waves Arturo Donate and Eraldo Ribeiro Computer Vision Group Outline of the talk Introduction Analysis Background Method Experiments Conclusions Future Work
Fusion of pixel based and object based features for classification of urban hyperspectral remote sensing data
 Fusion of pixel based and object based features for classification of urban hyperspectral remote sensing data Wenzhi liao a, *, Frieke Van Coillie b, Flore Devriendt b, Sidharta Gautama a, Aleksandra Pizurica
Nonlinear data separation and fusion for multispectral image classification
 Nonlinear data separation and fusion for multispectral image classification Hela Elmannai #*1, Mohamed Anis Loghmari #2, Mohamed Saber Naceur #3 # Laboratoire de Teledetection et Systeme d informations
THE USE OF ANISOTROPIC HEIGHT TEXTURE MEASURES FOR THE SEGMENTATION OF AIRBORNE LASER SCANNER DATA
 THE USE OF ANISOTROPIC HEIGHT TEXTURE MEASURES FOR THE SEGMENTATION OF AIRBORNE LASER SCANNER DATA Sander Oude Elberink* and Hans-Gerd Maas** *Faculty of Civil Engineering and Geosciences Department of
Feature Selection. CE-725: Statistical Pattern Recognition Sharif University of Technology Spring Soleymani
 Feature Selection CE-725: Statistical Pattern Recognition Sharif University of Technology Spring 2013 Soleymani Outline Dimensionality reduction Feature selection vs. feature extraction Filter univariate
This is the general guide for landuse mapping using mid-resolution remote sensing data
 This is the general guide for landuse mapping using mid-resolution remote sensing data February 11 2015 This document has been prepared for Training workshop on REDD+ Research Project in Peninsular Malaysia
Remote Sensed Image Classification based on Spatial and Spectral Features using SVM
 RESEARCH ARTICLE OPEN ACCESS Remote Sensed Image Classification based on Spatial and Spectral Features using SVM Mary Jasmine. E PG Scholar Department of Computer Science and Engineering, University College
CHAPTER 4: CLUSTER ANALYSIS
 CHAPTER 4: CLUSTER ANALYSIS WHAT IS CLUSTER ANALYSIS? A cluster is a collection of data-objects similar to one another within the same group & dissimilar to the objects in other groups. Cluster analysis
Image Segmentation and Registration
 Image Segmentation and Registration Dr. Christine Tanner (tanner@vision.ee.ethz.ch) Computer Vision Laboratory, ETH Zürich Dr. Verena Kaynig, Machine Learning Laboratory, ETH Zürich Outline Segmentation
Unsupervised Learning : Clustering
 Unsupervised Learning : Clustering Things to be Addressed Traditional Learning Models. Cluster Analysis K-means Clustering Algorithm Drawbacks of traditional clustering algorithms. Clustering as a complex
HYPERSPECTRAL REMOTE SENSING
 HYPERSPECTRAL REMOTE SENSING By Samuel Rosario Overview The Electromagnetic Spectrum Radiation Types MSI vs HIS Sensors Applications Image Analysis Software Feature Extraction Information Extraction 1
Unsupervised Learning
 Unsupervised Learning Unsupervised learning Until now, we have assumed our training samples are labeled by their category membership. Methods that use labeled samples are said to be supervised. However,
Spatial Information Based Image Classification Using Support Vector Machine
 Spatial Information Based Image Classification Using Support Vector Machine P.Jeevitha, Dr. P. Ganesh Kumar PG Scholar, Dept of IT, Regional Centre of Anna University, Coimbatore, India. Assistant Professor,
Structural Analysis of Aerial Photographs (HB47 Computer Vision: Assignment)
") Structural Analysis of Aerial Photographs (HB47 Computer Vision: Assignment) Xiaodong Lu, Jin Yu, Yajie Li Master in Artificial Intelligence May 2004 Table of Contents 1 Introduction... 1 2 Edge-Preserving
Structural Analysis of Aerial Photographs (HB47 Computer Vision: Assignment) Xiaodong Lu, Jin Yu, Yajie Li Master in Artificial Intelligence May 2004 Table of Contents 1 Introduction... 1 2 Edge-Preserving
Saliency Detection in Aerial Imagery
 Saliency Detection in Aerial Imagery using Multi-scale SLIC Segmentation Samir Sahli 1, Daniel A. Lavigne 2 and Yunlong Sheng 1 1- COPL, Image Science group, Laval University, Quebec, Canada 2- Defence
Normalized Texture Motifs and Their Application to Statistical Object Modeling
 Normalized Texture Motifs and Their Application to Statistical Obect Modeling S. D. Newsam B. S. Manunath Center for Applied Scientific Computing Electrical and Computer Engineering Lawrence Livermore
Geomatics 89 (National Conference & Exhibition) May 2010
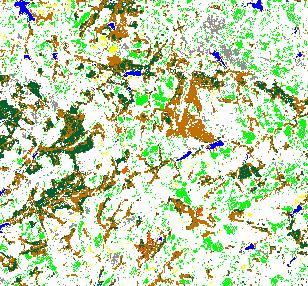
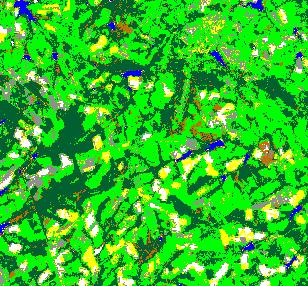
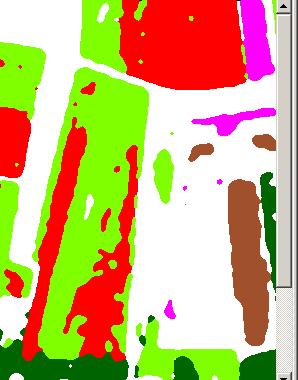
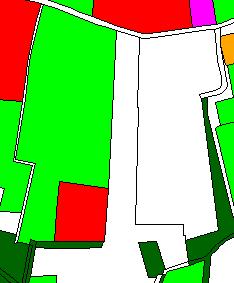
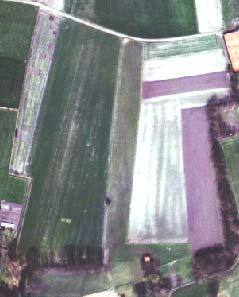
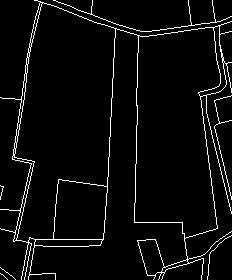
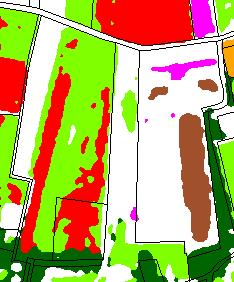
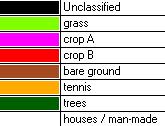
 May 2010") Evaluation of the Pixel Based and Object Based Classification Methods For Monitoring Of Agricultural Land Cover Case study: Biddinghuizen - The Netherlands Hossein Vahidi MSc Student of Geoinformatics
Evaluation of the Pixel Based and Object Based Classification Methods For Monitoring Of Agricultural Land Cover Case study: Biddinghuizen - The Netherlands Hossein Vahidi MSc Student of Geoinformatics
IMPROVED TARGET DETECTION IN URBAN AREA USING COMBINED LIDAR AND APEX DATA
 IMPROVED TARGET DETECTION IN URBAN AREA USING COMBINED LIDAR AND APEX DATA Michal Shimoni 1 and Koen Meuleman 2 1 Signal and Image Centre, Dept. of Electrical Engineering (SIC-RMA), Belgium; 2 Flemish
SGN (4 cr) Chapter 11
 Chapter 11") SGN-41006 (4 cr) Chapter 11 Clustering Jussi Tohka & Jari Niemi Department of Signal Processing Tampere University of Technology February 25, 2014 J. Tohka & J. Niemi (TUT-SGN) SGN-41006 (4 cr) Chapter
SGN-41006 (4 cr) Chapter 11 Clustering Jussi Tohka & Jari Niemi Department of Signal Processing Tampere University of Technology February 25, 2014 J. Tohka & J. Niemi (TUT-SGN) SGN-41006 (4 cr) Chapter
CLASSIFICATION WITH RADIAL BASIS AND PROBABILISTIC NEURAL NETWORKS
 CLASSIFICATION WITH RADIAL BASIS AND PROBABILISTIC NEURAL NETWORKS CHAPTER 4 CLASSIFICATION WITH RADIAL BASIS AND PROBABILISTIC NEURAL NETWORKS 4.1 Introduction Optical character recognition is one of
Clustering: Classic Methods and Modern Views
 Clustering: Classic Methods and Modern Views Marina Meilă University of Washington mmp@stat.washington.edu June 22, 2015 Lorentz Center Workshop on Clusters, Games and Axioms Outline Paradigms for clustering
MSA220 - Statistical Learning for Big Data
 MSA220 - Statistical Learning for Big Data Lecture 13 Rebecka Jörnsten Mathematical Sciences University of Gothenburg and Chalmers University of Technology Clustering Explorative analysis - finding groups
Automated Extraction of Buildings from Aerial LiDAR Point Cloud and Digital Imaging Datasets for 3D Cadastre - Preliminary Results
 Automated Extraction of Buildings from Aerial LiDAR Point Cloud and Digital Imaging Datasets for 3D Pankaj Kumar 1*, Alias Abdul Rahman 1 and Gurcan Buyuksalih 2 ¹Department of Geoinformation Universiti