Getting Started with LabVIEW Virtual Instruments
|
|
|
- Kathryn Norman
- 6 years ago
- Views:
Transcription
1 Getting Started with LabVIEW Virtual Instruments Approximate Time You can complete this exercise in approximately 30 minutes. Background LabVIEW programs are called virtual instruments, or VIs, because their appearance and operation imitate physical instruments, such as oscilloscopes and multimeters. LabVIEW contains a comprehensive set of tools for acquiring, analyzing, displaying, and storing data, as well as tools to help you troubleshoot code you write. In LabVIEW, you build a user interface, or front panel, with controls and indicators. Controls are knobs, push buttons, dials, and other input mechanisms. Indicators are graphs, LEDs, and other output displays. After you build the user interface, you add code using VIs and structures to control the front panel objects. The block diagram contains this code. You can use LabVIEW to communicate with hardware such as data acquisition, vision, and motion control devices, as well as GPIB, PXI, VXI, RS232, and RS485 instruments. Overview In the following exercise, you will build a VI that generates a signal and displays that signal in a graph. You will build and customize a user interface that allows you to control the amplitude of the signal and easily display your data. 1

2 Completed Exercise 2


3 Step-by-Step Instructions 1. Launching LabVIEW The Getting Started window appears when you launch LabVIEW. You can open the LabVIEW Getting Started window by doing either of the following: a. Double-click the LabVIEW icon on your desktop, or b. In the Windows Start menu, navigate to Programs» National Instruments» LabVIEW 8.5» LabVIEW The Getting Started window is used to create new VIs, view the most recently opened LabVIEW files, find examples, and launch the LabVIEW Help. You also can access information and resources to help you learn about LabVIEW, such as specific manuals, help topics, and resources on the National Instruments Web site, ni.com. The Getting Started window disappears when you open a VI and reappears when you close all open files. You can also display the window from an open VI by selecting View» Getting Started Window. 3

4 2. Opening a New VI from a Template LabVIEW provides built-in template VIs that include the functions, structures, and front panel objects you need to get started building common measurement applications. Complete the following steps to create a VI that generates a signal and displays it on the front panel: a. In the Getting Started window, click the More link to display the New dialog box. b. From the Create New list, select VI» From Template» Tutorial (Getting Started)» Generate and Display. This template VI generates and displays a signal. 4
5 c. A preview and a brief description of the template VI appear in the Description section. The following figure shows the New dialog box and the preview of the Generate and Display template VI. d. Click the OK button to create a VI from the template. e. LabVIEW displays two windows: the Front panel window (gray background) and the block diagram window (white background). Examine the Front panel window. The user interface, or Front panel, includes controls and indicators. The title bar indicates that this window is the Front panel for the Generate and Display VI. You can switch between the front panel window and block diagram window at any time by pressing the <Ctrl-E> keys. You can also select Window» Show Front Panel or Window» Show Block Diagram to switch between the two. f. Select Window» Show Block Diagram and examine the block diagram of the VI. The block diagram appears with a white background and includes VIs and structures that control the front panel objects. The title bar indicates that this window is the block diagram for the Generate and Display VI. g. On the front panel toolbar, click the Run button. You also can press the <Ctrl-R> keys to run a VI. A sine wave appears on the front panel graph. h. Stop the VI by clicking the STOP button, on the front panel. 5


6 3. Adding a Control to the Front Panel Controls on the front panel simulate the input mechanisms on a physical instrument and supply data to the block diagram of the VI. Many physical instruments have knobs you can turn to change an input value. Complete the following steps to add a knob control to the front panel: Throughout the exercise, you can undo recent edits by selecting Edit» Undo from the toolbar or pressing the <Ctrl-Z> keys. a. If the Controls palette is not visible on the front panel select View» Controls Palette from the toolbar. b. You can right-click any blank space on the front panel to display a temporary version of the Controls palette. The Controls palette appears with a thumbtack icon in the upper left corner. Click the thumbtack to pin the palette so it is not temporary. 6


7 c. The Controls palette opens with the Express subpalette visible by default. Click the double arrows at the bottom of the Controls palette if this subpalette is not visible. d. Move your cursor over the icons on the Express subpalette. Notice that the name of each subpalette, control, or indicator appears in a tip strip below the icon. e. Click the Numeric Controls icon to display the Numeric Controls palette. f. Left-click the knob control on the Numeric Controls palette to attach the control to the cursor g. Place the knob on your front panel to the left of the waveform graph. You will use this knob in a later exercise to control the amplitude of a signal. h. Select File» Save As and save the VI to the desktop as Acquiring a Signal.vi 7


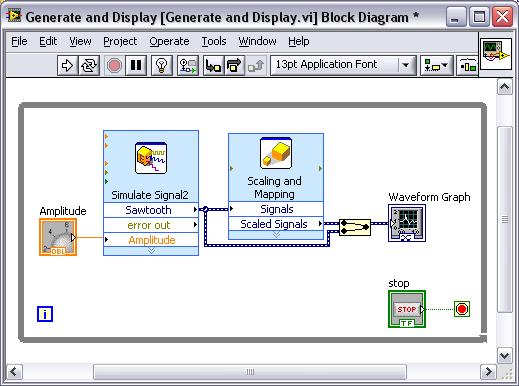
8 4. Changing a Signal Type The block diagram has a blue icon labeled Simulate Signal. This icon is the Simulate Signal Express VI. The Simulate Signal Express VI simulates a sine wave by default. Complete the following steps to change this simulated signal to a sawtooth wave: a. Display the block diagram by pressing the <Ctrl-E> keys or clicking the block diagram. b. Locate the Simulate Signal Express VI. An Express VI is a component of the block diagram that you can configure to perform common measurement tasks. The Simulate Signal Express VI simulates a signal based on the configuration specified. c. Double-click the Simulate Signal Express VI to display the Configure Simulate Signal dialog box. This can also be done by right-clicking the VI and selecting Properties. d. Select Sawtooth from the Signal type pull-down menu. Notice that the waveform graph in the Result Preview changes to a sawtooth wave. e. Click the OK button to save the current configuration and close the dialog box. f. Move the cursor over the down arrows at the bottom of the Simulate Signal Express VI. When the cursor changes to a doubleheaded arrow and handles appear on the VI, click and drag the bottom handle down to display hidden inputs and outputs. g. When you release the mouse, the Amplitude input appears. You can configure the amplitude of the sawtooth wave programmatically now that it appears on the block diagram. Amplitude is also an option in the Configure Simulate Signal dialog box. You can configure several inputs for Express VIs in either location. 8


9 5. Wiring Objects on the Block Diagram To use the knob to change the amplitude of the signal, you must connect two objects on the block diagram. Complete the following steps to wire the knob to the Amplitude input of the Simulate Signal Express VI: a. On the block diagram, move the cursor over the Knob terminal. b. The cursor becomes an arrow, or the Positioning tool. Use the Positioning tool to select, position, and resize objects. c. Use the Positioning tool to select the Knob terminal and make sure it is to the left of the Simulate Signal Express VI and inside the gray loop. d. Deselect the Knob terminal by clicking a blank space on the block diagram. e. Move the cursor over the arrow on the right-hand side of the Knob terminal. f. The cursor becomes a wire spool, or the Wiring tool. The Wiring tool is used to connect objects together on the block diagram. g. When the Wiring tool appears, click the arrow on the Knob terminal and then click the arrow on the Amplitude input of the Simulate Signal Express VI, this wires the objects together. h. A wire appears and connects the two objects. Data flows along this wire from the Knob Terminal to the Express VI. i. Select File» Save to save the VI. 9
10 6. Running a VI What you have done so far is add a knob control that allows you to programmatically change the amplitude of a Sawtooth wave. Running a VI executes the LabVIEW graphical code you just created. Complete the following steps to run the Acquiring a Signal VI: a. Display the front panel by pressing the <Ctrl-E> keys or by clicking the front panel. b. Click the Run button or press the <Ctrl-R> keys to run the VI. c. Move the cursor over the knob control. d. The cursor becomes a hand, or the Operating tool. Use the Operating tool to change the value of a control. e. Using the Operating tool, turn the knob to adjust the amplitude of the sawtooth wave. The amplitude of the sawtooth wave changes as you turn the knob. The y-axis on the graph scales automatically to account for the change in amplitude when autoscale is selected. f. To indicate that the VI is running, the Run button changes to a darkened arrow. You can change the value of the controls while a VI runs, but you cannot edit the VI. g. Click the STOP button to stop the VI. The STOP button stops the VI after the VI completes the current iteration. The Abort Execution button in the toolbar stops the VI instantly, before the VI finishes the current iteration. Aborting a VI that uses external resources, such as external hardware, might leave the resources in an unknown state. Design VIs with a Stop button to avoid this problem. 10


11 7. Modifying a Signal Complete the following steps to add scaling to the simulated signal and display the results in the graph on the front panel: a. On the block diagram, left-click the wire that connects the Simulate Signal Express VI to the Waveform Graph to highlight the wire. b. Press the <Delete> key to remove this wire. c. If the Functions Palette is not visible, select View» Functions Palette to display it or simply right-click on the block diagram. The Functions Palette opens with the Express subpalette visible by default. If you have selected another subpalette, you can return to the Express subpalette by clicking Express on the Functions palette. d. On the Arithmetic & Comparison subpalette, select the Scaling and Mapping Express VI. Place it on the block diagram inside the loop between the Simulate Signal Express VI and the Waveform Graph terminal. Move the Waveform Graph terminal if necessary. 11
 text box. f. Click the OK button to save the current configuration and close the Configure Scaling and Mapping dialog box. g.")

12 e. The Configure Scaling and Mapping dialog box opens when you place the Express VI on the block diagram. Define the scaling factor by entering 10 in the Slope (m) text box. f. Click the OK button to save the current configuration and close the Configure Scaling and Mapping dialog box. g. Move the cursor over the arrow on the Sawtooth output of the Simulate Signal Express VI. When the Wiring tool appears, click the arrow on the Sawtooth output and then click the arrow on the Signals input of the Scaling and Mapping Express VI to wire the two objects together h. Use the Wiring tool to wire the Scaled Signals output of the Scaling and Mapping Express VI to the Waveform Graph terminal. i. Examine the wires connecting the Express VIs and terminals. The arrows on the Express VIs and terminals indicate the direction of data flow along these wires. 12


13 8. Displaying Two Signals on Your Graph To compare the signal generated by the Simulate Signal Express VI and the signal modified by the Formula Express VI on the same graph, use the Merge Signals function. Complete the following steps to display two signals on the same graph: a. Wire the Sawtooth output to the Waveform Graph terminal. b. The Merge Signals function automatically appears where the two wires connect. A function is a built-in execution element, comparable to an operator or statement in a text-based programming language. The Merge Signals function takes two signals and combines them so that both can display on the same graph. Be sure to start the wiring at the Sawtooth output to avoid creating a feedback node. c. Press the <Ctrl-S> keys or select File» Save to save the VI. d. From the front panel, run the VI, and turn the knob control. e. Click the STOP button to stop the VI. The graph plots the wave and the scaled wave. The maximum value on the y-axis automatically changes to be 10 times the knob value. This scaling occurs because you configured the Scaling and Mapping Express VI to generate a slope of


14 9. Customizing a Knob Control The knob control changes the amplitude of the sawtooth wave, so labeling it Amplitude accurately describes the behavior of the knob. Complete the following steps to customize the appearance of the knob: a. Right-click the knob and select Properties from the shortcut menu to display the Knob Properties dialog box. b. In the Label section on the Appearance page, delete the label Knob, and enter Amplitude in the text box. c. Click the Scale tab and in the Scale Style section, place a checkmark in the Show color ramp checkbox. d. Click the OK button to save the current configuration and close the Knob Properties dialog box. The knob on the front panel updates to reflect these changes. e. Save the VI. f. Reopen the Knob Properties dialog box and experiment with other properties of the knob. For example, on the Scale page, try changing the colors for the Marker text color by clicking the color box. Click the Cancel button to avoid applying any changes you made while experimenting. If you want to keep the changes you made, click the OK button. 14

15 10. Customizing a Waveform Graph The waveform graph indicator displays the two signals. To indicate which plot is the scaled signal and which is the simulated signal, you can customize the plots. Complete the following steps to customize the appearance of the waveform graph indicator: a. Though the graph has two plots, the legend displays only one plot. On the front panel, move the cursor over the top of the plot legend on the waveform graph. b. When the cursor changes to a double-headed arrow and handles appear, click and drag the top handle of the legend to add one item. When you release the mouse button, the second plot name appears. c. Right-click the waveform graph and select Properties from the shortcut menu to display the Waveform Graph Properties dialog box. d. On the Plots page, select Sawtooth from the pull-down menu. e. In the Colors section, click the Line color box to display the color picker. Select a new line color. 15

16 f. Select Sawtooth (Scaled) from the pull-down menu. g. Place a checkmark in the Ignore Waveform or Dynamic Attributes, Including Plot names checkbox at the bottom of the dialog. h. In the Name text box, delete the current label and change the name of this plot to Scaled Sawtooth. The reason for placing a checkmark in the Ignore Waveform or Dynamic Attributes, Including Plot names checkbox is because this will display Scaled Sawtooth in the legend of the Waveform Graph instead of Sawtooth (Scaled) which would be scaled without placing that checkmark. i. Click the OK button to save the current configuration and close the Waveform Graph Properties dialog box. j. Reopen the Waveform Graph Properties dialog box and experiment with other properties of the graph. For example, on the Scales page, try disabling automatic scaling and changing the minimum and maximum value of the y-axis. Click the Cancel button to avoid applying any changes you made while experimenting. If you want to keep the changes you made, click the OK button. k. Run the VI. Notice the changes made. l. Save and close your VI. 16
Linear Control Systems LABORATORY
 Islamic University Of Gaza Faculty of Engineering Electrical Engineering Department Linear Control Systems LABORATORY Prepared By: Eng. Adham Maher Abu Shamla Under Supervision: Dr. Basil Hamed Experiments
LabVIEW. Getting Started with LabVIEW. Getting Started with LabVIEW
 Support Worldwide Technical Support and Product Information ni.com National Instruments Corporate Headquarters 11500 North Mopac Expressway Austin, Texas 78759-3504 USA Tel: 512 683 0100 Worldwide Offices
Step-by-Step Data Acquisition Part II Exercise 2: Generating an Analog Output Waveform
 Step-by-Step Data Acquisition Part II Exercise 2: Generating an Analog Output Waveform In this exercise, you will use the DAQ Assistant to build a LabVIEW VI that generates and outputs an analog waveform.
Homework Assignment 9 LabVIEW tutorial
 Homework Assignment 9 LabVIEW tutorial Due date: Wednesday, December 8 (midnight) For this homework assignment, you will complete a tutorial on the LabVIEW data acquistion software. This can be done on
LabVIEW Express VI Development Toolkit User Guide
 LabVIEW Express VI Development Toolkit User Guide Version 1.0 Contents The LabVIEW Express VI Development Toolkit allows you to create and edit Express VIs, which you can distribute to users for building
2 Lab 2: LabVIEW and Control System Building Blocks
 2 Lab 2: LabVIEW and Control System Building Blocks 2.1 Introduction Controllers are built from mechanical or electrical building blocks. Most controllers are implemented in a program using sensors to
NI LabView READ THIS DOCUMENT CAREFULLY AND FOLLOW THE INSTRIUCTIONS IN THE EXERCISES
 NI LabView READ THIS DOCUMENT CAREFULLY AND FOLLOW THE Introduction INSTRIUCTIONS IN THE EXERCISES According to National Instruments description: LabVIEW is a graphical programming platform that helps
Learn the three palettes. Learn how data is passed in LabVIEW. Create a subvi using two different methods.
 UNM The LabVIEW Programming Environment and Basic Operations Introduction In this hands-on, you will learn about the LabVIEW programming environment. You will also write a simple Virtual Instrument (VI)
Introduction to LabVIEW
 Introduction to LabVIEW 1 Introduction 1.1 Aims The following material is a short introduction to LabVIEW and it aims for you to: familiarise with the LabVIEW programming environment including front panel
Experiment 1: Introduction to Labview 8.0 (tbc 1/7/2007, 1/13/2009,1/13/2011)
") Experiment 1: Introduction to Labview 8.0 (tbc 1/7/2007, 1/13/2009,1/13/2011) Objective: To learn how to build virtual instrument panels in Labview 8.0 Tasks: 1. Build the Labview VI shown in the tutorial
Experiment 1: Introduction to Labview 8.0 (tbc 1/7/2007, 1/13/2009,1/13/2011) Objective: To learn how to build virtual instrument panels in Labview 8.0 Tasks: 1. Build the Labview VI shown in the tutorial
ME 365 EXPERIMENT 3 INTRODUCTION TO LABVIEW
 ME 365 EXPERIMENT 3 INTRODUCTION TO LABVIEW Objectives: The goal of this exercise is to introduce the Laboratory Virtual Instrument Engineering Workbench, or LabVIEW software. LabVIEW is the primary software
The LabVIEW Programming Environment and Basic Operations
 Page 1 of 14 UNM The LabVIEW Programming Environment and Basic Operations Introduction In this hands-on, you will learn about the LabVIEW programming environment. You will also write a simple Virtual Instrument
Lesson 1 Introduction to LabVIEW. TOPICS LabVIEW Environment Front Panel Block Diagram Dataflow Programming LabVIEW Help and Manuals Debugging a VI
 Lesson 1 Introduction to LabVIEW TOPICS LabVIEW Environment Front Panel Block Diagram Dataflow Programming LabVIEW Help and Manuals Debugging a VI 1 Virtual Instruments (VIs) Front Panel Controls = Inputs
Lab Exercise 2: Data Acquisition with NI LabVIEW
 Objective When you have completed this exercise, you will be able: To use the DAQ Assistant to acquire analog data measurements with NI LabVIEW To use Write to Measurement express VI to log real time data
Table 1. Inputs and Outputs
 Goal Description Use a While Loop and an iteration terminal and pass data through a tunnel. Create a VI that continuously generates random numbers between 0 and 1000 until it generates a number that matches
LabVIEW programming I
 FYS3240 PC-based instrumentation and microcontrollers LabVIEW programming I LabVIEW basics Spring 2011 Lecture #2 Bekkeng 13.1.2011 Virtual Instruments LabVIEW programs are called virtual instruments,
CISE 318: Computer Control Systems Laboratory Exercises
 King Fahd University of Petroleum and Minerals Systems Engineering Department CISE 318: Computer Control Systems Laboratory Exercises Prepared by Dr. Lahouari Cheded Mr. Mohammad Shahab Mr Ameenuddin Hussain
LabVIEW. Table of Contents. Lesson 1. Pre-reqs/Technical Skills Basic computer use
 LabVIEW Lesson 1 Pre-reqs/Technical Skills Basic computer use Expectations Read lesson material Implement steps in software while reading through lesson material Complete quiz on Blackboard Submit completed
OpenStax-CNX module: m Thermometer VI * National Instruments
 OpenStax-CNX module: m12209 1 Thermometer VI * National Instruments This work is produced by OpenStax-CNX and licensed under the Creative Commons Attribution License 1.0 Exercise 1 Complete the following
Exercise 0 - Open and Run a Virtual Instrument (Slide 12)
") Exercise 0 - Open and Run a Virtual Instrument (Slide 12) Examine the Signal Generation and Processing VI and run it. Change the frequencies and types of the input signals and notice how the display on
Exercise 0 - Open and Run a Virtual Instrument (Slide 12) Examine the Signal Generation and Processing VI and run it. Change the frequencies and types of the input signals and notice how the display on
Lab 4 - Data Acquisition
 Lab 4 - Data Acquisition 1/13 Lab 4 - Data Acquisition Report A short report is due at 8:00 AM on the Thursday of the next week of classes after you complete this lab. This short report does NOT need to
Lesson 4 Implementing a VI
 Lesson 4 Implementing a VI A. Front Panel Design B. LabVIEW Data Types C. Documenting Code D. While Loops E. For Loops F. Timing a VI G. Iterative Data Transfer H. Plotting Data I. Case Structures A. Front
Hardware: Acquiring Data and Communicating with Instruments
 Hardware: Acquiring Data and Communicating with Instruments 4 Acquiring a Signal This chapter introduces you to the Express VIs you use to acquire data and communicate with instruments on Windows. These
Experiment 1: Introduction to Labview 2010 (tbc 1/7/2007, 1/13/2009,1/9/2012, 1/10/2012)
") Experiment 1: Introduction to Labview 2010 (tbc 1/7/2007, 1/13/2009,1/9/2012, 1/10/2012) Objective: To learn how to build virtual instrument panels in Labview 2010 Tasks: 1. Follow the tutorial given in
Experiment 1: Introduction to Labview 2010 (tbc 1/7/2007, 1/13/2009,1/9/2012, 1/10/2012) Objective: To learn how to build virtual instrument panels in Labview 2010 Tasks: 1. Follow the tutorial given in
Tutorial: Getting Started with the LabVIEW Simulation Module
 Tutorial: Getting Started with the LabVIEW Simulation Module - LabVIEW 8.5 Simulati... Page 1 of 10 Cart Help Search You are here: NI Home > Support > Product Reference > Manuals > LabVIEW 8.5 Simulation
Virtual Instrumentation With LabVIEW
 Virtual Instrumentation With LabVIEW Course Goals Understand the components of a Virtual Instrument Introduce LabVIEW and common LabVIEW functions Build a simple data acquisition application Create a subroutine
Virtual Instrumentation With LabVIEW
 Virtual Instrumentation With LabVIEW Section I LabVIEW terms Components of a LabVIEW application LabVIEW programming tools Creating an application in LabVIEW LabVIEW Programs Are Called Virtual Instruments
LabVIEW TM Basics I Introduction Course Manual
 LabVIEW TM Basics I Introduction Course Manual Course Software Version 7.0 June 2003 Edition Part Number 320628L-01 LabVIEW Introduction Course Manual Copyright 1993 2003 National Instruments Corporation.
Figure 1: Control & Simulation Loop
 Pre-Lab 4 LabVIEW Tutorial Overview In this tutorial, you will be using the Control & Simulation library in LabVIEW to simulate the step response for the transfer function of a system. ATTENTION : After
Basic Data Acquisition with LabVIEW
 Basic Data Acquisition with LabVIEW INTRODUCTION This tutorial introduces the creation of LabView Virtual Instruments (VI s), in several individual lessons. These lessons create a simple sine wave signal,
Small rectangles (and sometimes squares like this
 Lab exercise 1: Introduction to LabView LabView is software for the real time acquisition, processing and visualization of measured data. A LabView program is called a Virtual Instrument (VI) because it,
National Instruments Corporation 1 Introduction to LabVIEW Hands-On
 National Instruments Corporation 1 Introduction to LabVIEW Hands-On This is a list of the objectives of the course. This course prepares you to do the following: Use LabVIEW to create applications. Understand
National Instruments Corporation 1 Introduction to LabVIEW Hands-On
 National Instruments Corporation 1 Introduction to LabVIEW Hands-On This is a list of the objectives of the course. This course prepares you to do the following: Use LabVIEW to create applications. Understand
Read Temperature Data
 Read Temperature Data Exercise 5 Completed front panel and block diagram In this exercise, you will create a program using SensorDAQ s Analog Express VI to collect temperature data and display it on a
SystemVue 2011 Fundamentals (version ) LAB EXERCISE 1. SystemVue Basics
 LAB EXERCISE 1. SystemVue Basics") SystemVue 2011 Fundamentals (version 1-2012) LAB EXERCISE 1 SystemVue Basics This lab exercise introduces the basic use model of SystemVue, including using the built-in templates, running analyses and
SystemVue 2011 Fundamentals (version 1-2012) LAB EXERCISE 1 SystemVue Basics This lab exercise introduces the basic use model of SystemVue, including using the built-in templates, running analyses and
Beginner s Guide to Microsoft Excel 2002
 Beginner s Guide to Microsoft Excel 2002 Microsoft Excel lets you create spreadsheets, which allow you to make budgets, track inventories, calculate profits, and design charts and graphs. 1. Open Start
Introduction to LabVIEW 6-Hour Hands-On
 Introduction to LabVIEW 6-Hour Hands-On National Instruments Corporation 1 Introduction to LabVIEW Hands-On Course Goals Become comfortable with the LabVIEW environment and data flow execution Ability
Introduction to LabVIEW
 Introduction to LabVIEW How to Succeed in EE 20 Lab Work as a group of 2 Read the lab guide thoroughly Use help function and help pages in LabVIEW Do the Pre-Lab before you come to the lab Don t do the
Hands-on Lab 2: LabVIEW NI-DAQ Basics 2
 Hands-on Lab 2: LabVIEW NI-DAQ Basics 2 Recall that the final objective is position regulation using computer-controlled state feedback. Computer control requires both software, like LabVIEW and hardware,
REV 1. Quick Start Guide. MBE Control Solutions
 Quick Start Guide MBE Control Solutions AMBER Setup AMBER is usually sold preinstalled on a Windows 7-64 Workstation. A Self installation guide and installation software is available from MBE Control Solutions:
University of Pennsylvania. Department of Electrical and Systems Engineering. ESE Undergraduate Laboratory. Introduction to LabView
 University of Pennsylvania Department of Electrical and Systems Engineering ESE Undergraduate Laboratory Introduction to LabView PURPOSE The purpose of this lab is to get you familiarized with LabView.
Lab 1: Getting familiar with LabVIEW: Part I
 Lab 1: Getting familiar with LabVIEW: Part I The objective of this first lab is to provide an initial hands-on experience in building a VI. For detailed explanations of the LabVIEW features mentioned here,
Introduction to LabVIEW
 University College of Southeast Norway Introduction to LabVIEW Hans-Petter Halvorsen, 2016-09-07 http://home.hit.no/~hansha Preface This document explains the basic concepts of LabVIEW. You find additional
GET TO KNOW FLEXPRO IN ONLY 15 MINUTES
 GET TO KNOW FLEXPRO IN ONLY 15 MINUTES Data Analysis and Presentation Software GET TO KNOW FLEXPRO IN ONLY 15 MINUTES This tutorial provides you with a brief overview of the structure of FlexPro and the
Virtual Instruments with LabVIEW
 Telemark University College Department of Electrical Engineering, Information Technology and Cybernetics Virtual Instruments with LabVIEW HANS-PETTER HALVORSEN, 2011.01.04 Faculty of Technology, Postboks
Getting Started with the LabVIEW Real-Time Module
 Getting Started with the LabVIEW Real-Time Module Contents This document provides exercises to teach you how to develop a real-time project and VIs, from setting up RT targets to building, debugging, and
PowerPoint X. 1. The Project Gallery window with the PowerPoint presentation icon already selected. 2. Click on OK.
 PowerPoint X Launching PowerPointX 1. Start PowerPointX by clicking on the PowerPoint icon in the dock or finding it in the hard drive in the Applications folder under Microsoft PowerPoint. PowerPoint
Dive Into Visual C# 2008 Express
 1 2 2 Dive Into Visual C# 2008 Express OBJECTIVES In this chapter you will learn: The basics of the Visual Studio Integrated Development Environment (IDE) that assists you in writing, running and debugging
Pen Tool, Fill Layers, Color Range, Levels Adjustments, Magic Wand tool, and shadowing techniques
 Creating a superhero using the pen tool Topics covered: Pen Tool, Fill Layers, Color Range, Levels Adjustments, Magic Wand tool, and shadowing techniques Getting Started 1. Reset your work environment
LabVIEW TM Core 1 Course Manual
 LabVIEW TM Core 1 Course Manual Course Software Version 2012 August 2012 Edition Part Number 325290D-01 LabVIEW Core 1 Course Manual Copyright 1993 2012 National Instruments. All rights reserved. Under
LabVIEW VI Analyzer Toolkit
 USER GUIDE LabVIEW VI Analyzer Toolkit Version 1.1 Contents The LabVIEW VI Analyzer Toolkit allows you to interactively and programmatically test VIs to find areas of improvement. The toolkit contains
AEMLog Users Guide. Version 1.01
 AEMLog Users Guide Version 1.01 INTRODUCTION...2 DOCUMENTATION...2 INSTALLING AEMLOG...4 AEMLOG QUICK REFERENCE...5 THE MAIN GRAPH SCREEN...5 MENU COMMANDS...6 File Menu...6 Graph Menu...7 Analysis Menu...8
Exercise 5: Basic LabVIEW Programming
 Exercise 5: Basic LabVIEW Programming In this exercise we will learn the basic principles in LabVIEW. LabVIEW will be used in later exercises and in the project part, as well in other courses later, so
PowerPoint Launching PowerPointX
 PowerPoint 2004 Launching PowerPointX 1. Start PowerPoint by clicking on the PowerPoint icon in the dock or finding it in the hard drive in the Applications folder under Microsoft Office 2004. PowerPoint
Page 1 of 6. ME 3200 Mechatronics I Laboratory Lab 2: LabView Computer Systems. Introduction
 ME 3200 Mechatronics I Laboratory Lab 2: LabView Computer Systems Introduction The purpose of this lab is to introduce the basics of creating programs in LabView for data collection and analysis. LabView
Slides & Presentations
 Section 2 Slides & Presentations ECDL Section 2 Slides & Presentations By the end of this section you should be able to: Understand and Use Different Views Understand Slide Show Basics Save, Close and
Using Microsoft Word. Paragraph Formatting. Displaying Hidden Characters
 Using Microsoft Word Paragraph Formatting Every time you press the full-stop key in a document, you are telling Word that you are finishing one sentence and starting a new one. Similarly, if you press
Microsoft Word 2011: Basic Tutorial
 Microsoft Word 2011: Basic Tutorial 1. Create a new blank document In Word, you create and save content in a document. You can start with a blank document, an existing saved document, or a template. When
Microsoft PowerPoint 2013 Beginning
 Microsoft PowerPoint 2013 Beginning PowerPoint Presentations on the Web... 2 Starting PowerPoint... 2 Opening a Presentation... 2 File Tab... 3 Quick Access Toolbar... 3 The Ribbon... 4 Keyboard Shortcuts...
Computer Interfacing Using LabView
 Computer Interfacing Using LabView Physics 258 Last revised September 25, 2005 by Ed Eyler Purpose: Note: To write a simple LabView program that digitizes data using an ADC on a data acquisition card,
Work Smart: Microsoft Office 2010 User Interface
 About the Office 2010 User Interface You can use this guide to learn how to use the new features of the Microsoft Office Ribbon. Topics in this guide include: What s New in the Office 2010 User Interface
One possible window configuration preferences for debug cycles
 NEW USER S TUTORIAL Welcome to ICAP/4, Intusoft s suite of analog and mixed-signal simulation products. There is also a New User s Tutorial 2 as follow-on to this tutorial for non-icap/4rx products. Let
Creating a PowerPoint Presentation
 powerpoint 1 Creating a PowerPoint Presentation Getting Started 1. Open PowerPoint from the "Start" "Programs" Microsoft Office directory. 2. When starting PowerPoint, it usually starts with a new blank
Getting Started with the LabVIEW Datalogging and Supervisory Control Module
 Getting Started with the LabVIEW Datalogging and Supervisory Control Module Contents This document provides an introduction to the LabVIEW Datalogging and Supervisory Control (DSC) Module and contains
Introduction to LabVIEW. By Finn Haugen, TechTeach
 1 of 100 03/07/2012 02:31 PM Introduction to LabVIEW 8.5 by Finn Haugen 31. August 2008 Contents: 1 Preface 2 Introduction 3 Launching LabVIEW 3.1 License Activation 3.2 Starting using LabVIEW 4 Looking
Snap Shot. User Guide
 Snap Shot User Guide 1 Table of Contents Snap Shot...3 Capturing the Image... 3 Editing The Pen/Marker Settings... 5 Changing the Pen/Marker Line Thickness...5 Erasing...6 Changing the Line Color...6 Undo
Microsoft PowerPoint 2010 Beginning
 Microsoft PowerPoint 2010 Beginning PowerPoint Presentations on the Web... 2 Starting PowerPoint... 2 Opening a Presentation... 2 File Tab... 3 Quick Access Toolbar... 3 The Ribbon... 4 Keyboard Shortcuts...
Lab 2: Introduction to LabVIEW 8.5
 Lab 2: Introduction to LabVIEW 8.5 INTRODUCTION: This lab is designed as an introduction to using LabVIEW. In this lab you will run through some tutorials to get a basic understanding of some of the LabVIEW
Microsoft PowerPoint 2007 Beginning
 Microsoft PowerPoint 2007 Beginning Educational Technology Center PowerPoint Presentations on the Web... 2 Starting PowerPoint... 2 Opening a Presentation... 2 Microsoft Office Button... 3 Quick Access
Introduction to LabVIEW Exercise-1
 Introduction to LabVIEW Exercise-1 Objective In this Laboratory, you will write simple VIs to incorporate basic programming structures in LabVIEW. This section will teach you fundamentals of LabVIEW front
Microsoft. Computer Training Center 1515 SW 10 th Avenue Topeka KS
 Microsoft Computer Training Center 1515 SW 10 th Avenue Topeka KS 66604-1374 785.580.4606 class@tscpl.org www.tscpl.org Microsoft Word 2007 Introduction to Word Processing 1 How to Start Word is a full-featured
Biopac Student Lab 4.1 BSL PRO TUTORIAL. BIOPAC Systems, Inc. Windows 10, 8, 7 Mac OS X
 Biopac Student Lab 4.1 BSL PRO TUTORIAL Windows 10, 8, 7 Mac OS X 10.7-10.10 BIOPAC Systems, Inc. 42 Aero Camino, Goleta, CA 93117 (805) 685-0066, Fax (805) 685-0067 info@biopac.com www.biopac.com 10.07.15
BD CellQuest Pro Analysis Tutorial
 BD CellQuest Pro Analysis Tutorial Introduction This tutorial guides you through a CellQuest Pro Analysis run like the one demonstrated in the CellQuest Pro Analysis Movie on the BD FACStation Software
PHYC 500: Introduction to LabView. Exercise 1 (v 1.3) M.P. Hasselbeck, University of New Mexico
 M.P. Hasselbeck, University of New Mexico") PHYC 500: Introduction to LabView M.P. Hasselbeck, University of New Mexico Exercise 1 (v 1.3) Setup The user interface of LabView is highly customizable. How this is done is a personal preference. For
PHYC 500: Introduction to LabView M.P. Hasselbeck, University of New Mexico Exercise 1 (v 1.3) Setup The user interface of LabView is highly customizable. How this is done is a personal preference. For
LabView programming 練習
 Virtual Instrumentation With LabVIEW LabView programming 練習 工綜六樓計算機室電腦 LabView 8.0 ( 目前最新版 Labview 2010) Interactive guide to LabView 請自行前往使用 1 LabVIEW 試用 http://www.ni.com/trylabview/zht/ 下載試用版 : OR 網路導覽與試用
Application of Skills: Microsoft Excel 2013 Tutorial
 Application of Skills: Microsoft Excel 2013 Tutorial Throughout this module, you will progress through a series of steps to create a spreadsheet for sales of a club or organization. You will continue to
AutoCAD 2009 User InterfaceChapter1:
 AutoCAD 2009 User InterfaceChapter1: Chapter 1 The AutoCAD 2009 interface has been enhanced to make AutoCAD even easier to use, while making as much screen space available as possible. In this chapter,
MICROSOFT WORD 2010 BASICS
 MICROSOFT WORD 2010 BASICS Word 2010 is a word processing program that allows you to create various types of documents such as letters, papers, flyers, and faxes. The Ribbon contains all of the commands
LogicStudio Training Guide
 LogicStudio Training Guide Summary This guide provides step by step instructions explaining how to use the LogicStudio software. LogicStudio can operate in demo mode providing full access to all controls
1. Move your mouse to the location you wish text to appear in the document. 2. Click the mouse. The insertion point appears.
 Word 2010 Text Basics Introduction Page 1 It is important to know how to perform basic tasks with text when working in a word processing application. In this lesson you will learn the basics of working
TABLE OF CONTENTS TABLE OF CONTENTS... 1 INTRODUCTION... 2 USING WORD S MENUS... 3 USING WORD S TOOLBARS... 5 TASK PANE... 9
 TABLE OF CONTENTS TABLE OF CONTENTS... 1 INTRODUCTION... 2 USING WORD S MENUS... 3 DEFINITIONS... 3 WHY WOULD YOU USE THIS?... 3 STEP BY STEP... 3 USING WORD S TOOLBARS... 5 DEFINITIONS... 5 WHY WOULD
A. Front Panel Design Lesson 4 Implementing a VI
 A. Front Panel Design Lesson 4 Implementing a VI Inputs and outputs lead to front panel design Retrieve the inputs by the following methods: TOPICS A. B. C. D. E. F. Front Panel Design LabVIEW Data Types
LabVIEW FPGA Module Release Notes
 LabVIEW FPGA Module Release Notes Version 1.1 Contents These release notes introduce new features and contain instructions for installing the LabVIEW FPGA Module, configuring FPGA devices, and selecting
Word Tips & Tricks. Status Bar. Add item to Status Bar To add an itme to the status bar, click on the item and a checkmark will display.
 Status Bar The status bar is located on the bottom of the Microsoft Word window. The status bar displays information about the document such as the current page number, the word count in the document,
Learn LabVIEW 2010 / 2011 Fast
 Learn LabVIEW 2010 / 2011 Fast A Primer for Automatic Data Acquisition Douglas Stamps, Ph.D. SDC PUBLICATIONS Schroff Development Corporation Better Textbooks. Lower Prices. www.sdcpublications.com Visit
Contents. Group 2 Excel Handouts 2010
 Contents Styles... 2 Conditional Formatting... 2 Create a New Rule... 4 Format as Table... 5 Create your own New Table Style... 8 Cell Styles... 9 New Cell Style... 10 Merge Styles... 10 Sparklines...
Microsoft Word: Steps To Success (The Bare Essentials)
") Microsoft Word: Steps To Success (The Bare Essentials) Workbook by Joyce Kirst 2005 Microsoft Word: Step to Success (The Bare Essentials) Page Contents 1 Starting Word 2 Save 3 Exit 5 Toolbars, Alignment,
Microsoft Word: Steps To Success (The Bare Essentials) Workbook by Joyce Kirst 2005 Microsoft Word: Step to Success (The Bare Essentials) Page Contents 1 Starting Word 2 Save 3 Exit 5 Toolbars, Alignment,
Chemistry Excel. Microsoft 2007
 Chemistry Excel Microsoft 2007 This workshop is designed to show you several functionalities of Microsoft Excel 2007 and particularly how it applies to your chemistry course. In this workshop, you will
Getting to Know FlexPro in just 15 Minutes
 Getting to Know FlexPro in just 15 Minutes This tutorial provides you with a brief overview of the structure of FlexPro and the basic command methods. 3 Managing Data with FlexPro FlexPro stores all objects
Microsoft Excel Lab: Data Analysis
 1 Microsoft Excel Lab: The purpose of this lab is to prepare the student to use Excel as a tool for analyzing data taken in other courses. The example used here comes from a Freshman physics lab with measurements
Introduction to Microsoft Office 2016: Word
 Introduction to Microsoft Office 2016: Word Last Updated: September 2018 Cost: $2.00 Microsoft Word is a word processing software. You can use it to type letters, reports, and other documents. This class
Lab 4: Pass the Data Streams to a Match Processor and Define a Match Rule
 Lab 4: Pass the Data Streams to a Match Processor and Define a Match Rule In this lab you will feed both the data records and the error records to a match processor and define a match rule. At the end
TOP Server Client Connectivity Guide for National Instruments' LabVIEW
 TOP Server Client Connectivity Guide for National Instruments' LabVIEW 1 Table of Contents 1. Overview and Requirements... 3 2. Setting TOP Server to Interactive Mode... 3 3. Creating a LabVIEW Project...
1 Place the iworx/214 unit on the bench, close to the computer. 3 When the dialog box appears, select ahk214.iws and then click Load.
 Experiment 1: LabScribe a Tutorial LabScribe allows data to be accumulated, displayed and analyzed on a computer screen in a format similar to a laboratory strip chart recorder. Equipment Setup 1 Place
Experiment 1: The LabScribe Tutorial
 Experiment 1: The LabScribe Tutorial LabScribe allows data to be accumulated, displayed and analyzed on a computer screen in a format similar to a laboratory strip chart recorder. Equipment Setup 1 Place
Tutorial 01 Quick Start Tutorial
 Tutorial 01 Quick Start Tutorial Homogeneous single material slope No water pressure (dry) Circular slip surface search (Grid Search) Intro to multi scenario modeling Introduction Model This quick start
Introduction to National Instruments LabVIEW and Data Acquisition (DAQ)
") Introduction to National Instruments LabVIEW and Data Acquisition (DAQ) Danial J. Neebel, Joseph R. Blandino, and David J. Lawrence, College of Integrated Science and Technology James Madison University
Introduction to National Instruments LabVIEW and Data Acquisition (DAQ) Danial J. Neebel, Joseph R. Blandino, and David J. Lawrence, College of Integrated Science and Technology James Madison University
Basic Microsoft Excel 2007
 Basic Microsoft Excel 2007 Contents Starting Excel... 2 Excel Window Properties... 2 The Ribbon... 3 Tabs... 3 Contextual Tabs... 3 Dialog Box Launchers... 4 Galleries... 5 Minimizing the Ribbon... 5 The
Reference Services Division Presents WORD Introductory Class
 Reference Services Division Presents WORD 2010 Introductory Class CLASS OBJECTIVES: Navigate comfortably on a Word page Learn how to use the Ribbon tabs and issue commands Format a simple document Edit,
Introduction to MS Word XP 2002: An Overview
 Introduction to MS Word XP 2002: An Overview Sources Used: http://www.fgcu.edu/support/office2000/word/files.html Florida Gulf Coast University Technology Skills Orientation Word 2000 Tutorial The Computer