Surviving SPSS.
|
|
|
- Christopher Bennett
- 6 years ago
- Views:
Transcription
1 Surviving SPSS Debby Kermer George Mason University Libraries Data Services Research Consultant
2 Mason Data Services Geospatial Analysis and Mapping Wendy Mann Joy Suh Debby Kermer Finding & Archiving Data, Data Management Plans Qualitative & Quantiative Methods, Analysis, & Software
3 Why SPSS? Easy to get started Optimized for the behavioral and social sciences Easy to maintain weighting for sampled surveys Best for working with missing values


4 Statistical Software SPSS Easy to start, limited capability Best for those with infrequent and/or minimal needs Stata Easy syntax, highly extensible Best for academics doing cutting-edge research R Hard to learn, highly capable Best for managing huge and/or complex datasets Hard to learn, highly extensible Best for those who program and know what they are doing


5
6
7 Download the Dataset Go to: Find SPSS I then click Datafile Complete the form and read the user agreement Click Submit and Download Data Save the file where you can find it Open the file (by default PST 11-05c.sav ) Double-Click or File Open (if SPSS is open)
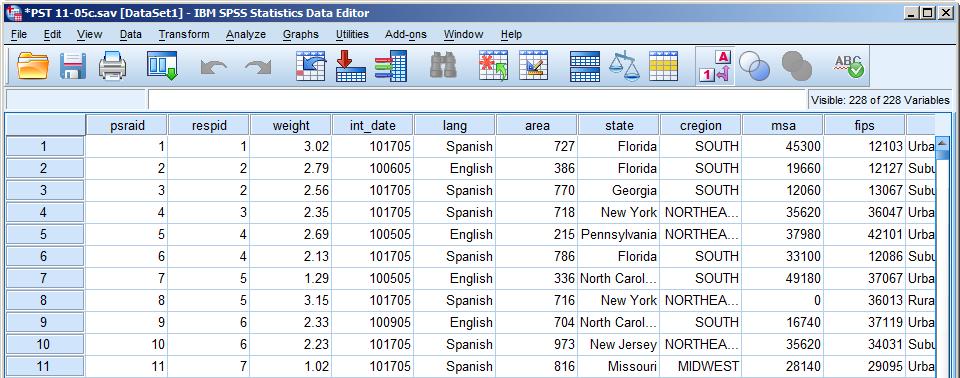
8 Data View
9 Data View Look at the Data Window Confirm you are in Data View Where are Variables? Where are Cases?
10 Navigating Data View Variables are in columns Find variable q2 Make q2 wider Cases are in rows Determine the # of cases (scroll down)

11 Values & Labels Press or use View Value Labels Value = What is stored and analyzed; the "actual" value Label = What is displayed; the characteristic or group Value Label 1 English 2 Spanish


12 Switching Views #1: Click on the Tabs or #2: Double-Click on the Blue Header area Variable View Data View From Data View, double-click q2 to switch views

13 Variable View
14 Variables Name "Nickname" Label Display Label Role Theoretrical Role (only for new / fancy analyses) Change sex (15) to gender Change the Label for sex
15 Variable Types Type Storage & Analysis Type Numeric = For numeric or categorical (label the values) String = For essay text; only keeps text up to the Width Measure Level of Measurement Scale = Interval or Ratio Prevents incorrect analysis String type must be Nominal


16 Values For state (7): Change District of Columbia to DC Label 3 Not used Remove Label for 3 NOTE: Use this method ONLY when entering your own data. It is not replicable.
17 Q.2 Name: Type: Label: q2 Numeric Generally, how would you say things are these days in your life -- would you say that you are very happy, pretty happy, or not too happy? Width: 1 Measure: Ordinal Values: 1 = Very happy 2 = Pretty happy 3 = Not too happy 9 = Don t know/refused
18 Missing Values System Missing. (a period) User Missing 7 = N/A 8 = Don t Know 9 = Refused


19 User Missing Values Add 9 as a User Missing value for q2 Copy User Missing values from q3a to all q3-series Add 7 & 9 as User Missing values for q3a Right Click and choose Copy Select All the q3a cells Right Click and choose Paste

20 Data View Display Decimals # of decimals shown (in output, too) Column Width of the column Align Justification of values in column only affects the look in Data View

21 Analyze Menu


22 Descriptive Statistics Analyze Descriptive Statistics Frequencies How happy are people with their life?


23 Finding Variables Find q2 q2 or Type name VERY FAST Right Click to re-sort

24 Choosing Variables Move q2 to the box then click OK or Click the arrow Double-Click the name

25 Output Window / Viewer Syntax Outline Click and press the Delete Key
26 Output Tables Variable Name Variable Label Value Value Label

27 SPSS Options

28 Options: General

29 Options: Output
30 Goal Is there a relationship between happiness and having pets? Happiness q2 Have pets q75 1 Happy = 1 & 2 0 Not Happy = 3 1 Has Pets = 1 0 No Pets = 2+ Use Edit Go to Variable

31 Transform Menu Working with Variables

32 Compute Goal: Make an indicator (0/1) for people with pets Transform Compute Variable New Variable Name: has_pet What to indicate: q75 = 1


33 Recode Goal: Recode q2 into is_happy: Happy vs Unhappy Transform Recode into Different Variables Add Type Press q2 is_happy 1Change Old Add for to and the Value to New box and replace under "Happy?" Values Old New the? Values in box


34 Labeling with Syntax Data Define Variable Properties
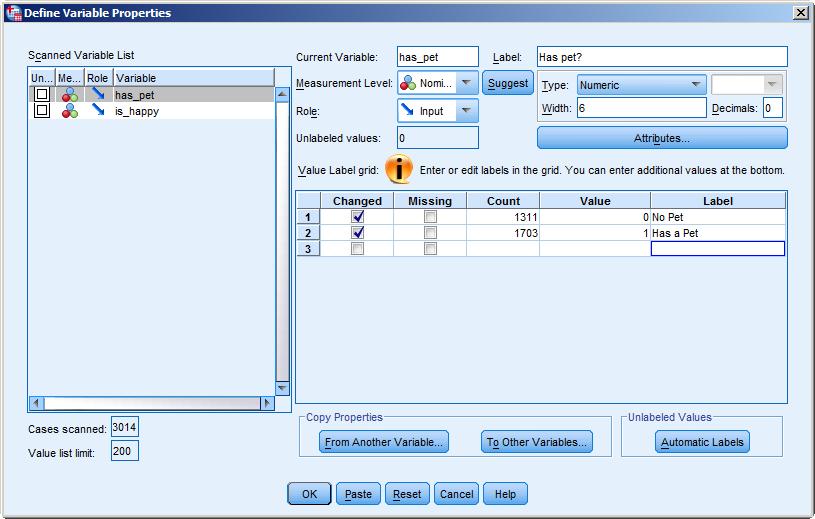
35 Variable Properties


36 Add Labels Variable Name: has_pet is_happy Variable Label: Has a Pet? Happy? Value Labels: 0 = No Pet 1 = Has a Pet 0 = Not Happy 1 = Happy


37 Run Syntax Variable Name: has_pet is_happy Variable Label: Has a Pet? Happy? Value Labels: 0 = No Pet 1 = Has a Pet 0 = Not Happy 1 = Happy

38 Crosstabulation Analysis


39 Crosstabs Analyze Descriptive Statistics Crosstabs
40 Tables Among those with no pet, 84.6% report being generally happy Among those who have a pet, 85.7% report being generally happy


41 Chi-Square Analyze Descriptive Statistics Crosstabs

42 Data Menu Working with Cases

43 Weighting # of people a case represents, accounts for the over- or under-representation of a group In Readme PST txt The WEIGHT variable is the weighting variable Data Weight Cases Look for or Select: Weight cases by: weight
![Selecting [a Subset of] Cases Goal: Do](/docs-images/74/70800174/images/44-1.jpg "analysis on only those who have a pet.")

44 Selecting [a Subset of] Cases Goal: Do analysis on only those who have a pet. Data Select Cases Filtering ignored cases 0 or missing value included cases every other value

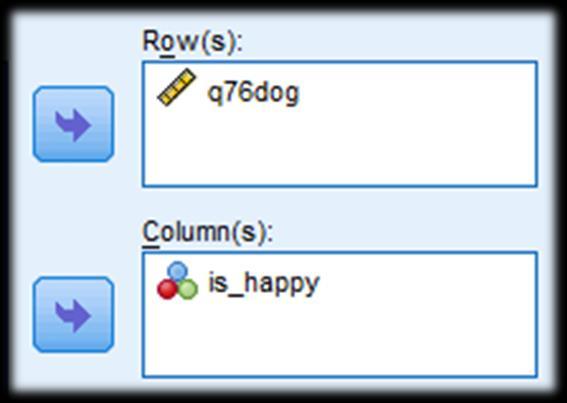
45 Tables Crosstabs: q76dog & is_happy

46 Splitting a File for Comparison Goal: Compare males and females with pets Data Split File Turn off Grouping Add group as a factor for each analysis Do analysis for one group, then for the other Choose Compare groups Move gender to box
47 Examining Output Redo Crosstabs: q76dog & is_happy Among those with a pet: Guys with dogs are more likely to be happy Girls with dogs are less likely to be happy

48 Status Bar Shows status of: Filter Split and Weighting


49 Return to Normal Turn off Grouping Data Split File Turn off Filtering Data Select Cases
50 Finishing Up

51 Save Files File Save As Data File & Output File & Syntax File To Exit, click Yes
52 Questions by Debby Kermer, Mason Library Data Services c b n a This work is licensed under the c Attribution- NonCommercial-ShareAlike International License:
Surviving SPSS.
 Surviving SPSS http://dataservices.gmu.edu/workshops/spss http://dataservices.gmu.edu/software/spss Debby Kermer George Mason University Libraries Data Services Research Consultant Mason Data Services
IENG484 Quality Engineering Lab 1 RESEARCH ASSISTANT SHADI BOLOUKIFAR
 IENG484 Quality Engineering Lab 1 RESEARCH ASSISTANT SHADI BOLOUKIFAR SPSS (Statistical package for social science) Originally is acronym of Statistical Package for the Social Science but, now it stands
A Simple Guide to Using SPSS (Statistical Package for the. Introduction. Steps for Analyzing Data. Social Sciences) for Windows
 for Windows") A Simple Guide to Using SPSS (Statistical Package for the Social Sciences) for Windows Introduction ٢ Steps for Analyzing Data Enter the data Select the procedure and options Select the variables Run the
A Simple Guide to Using SPSS (Statistical Package for the Social Sciences) for Windows Introduction ٢ Steps for Analyzing Data Enter the data Select the procedure and options Select the variables Run the
Introduction (SPSS) Opening SPSS Start All Programs SPSS Inc SPSS 21. SPSS Menus
 Opening SPSS Start All Programs SPSS Inc SPSS 21. SPSS Menus") Introduction (SPSS) SPSS is the acronym of Statistical Package for the Social Sciences. SPSS is one of the most popular statistical packages which can perform highly complex data manipulation and analysis
Introduction (SPSS) SPSS is the acronym of Statistical Package for the Social Sciences. SPSS is one of the most popular statistical packages which can perform highly complex data manipulation and analysis
SPSS for Survey Analysis
 STC: SPSS for Survey Analysis 1 SPSS for Survey Analysis STC: SPSS for Survey Analysis 2 SPSS for Surveys: Contents Background Information... 4 Opening and creating new documents... 5 Starting SPSS...
1. Basic Steps for Data Analysis Data Editor. 2.4.To create a new SPSS file
 1 SPSS Guide 2009 Content 1. Basic Steps for Data Analysis. 3 2. Data Editor. 2.4.To create a new SPSS file 3 4 3. Data Analysis/ Frequencies. 5 4. Recoding the variable into classes.. 5 5. Data Analysis/
Dr Wan Nor Arifin Unit of Biostatistics and Research Methodology, Universiti Sains Malaysia.
 Introduction to SPSS Dr Wan Nor Arifin Unit of Biostatistics and Research Methodology, Universiti Sains Malaysia. wnarifin@usm.my Outlines Introduction Data Editor Data View Variable View Menus Shortcut
Opening a Data File in SPSS. Defining Variables in SPSS
 Opening a Data File in SPSS To open an existing SPSS file: 1. Click File Open Data. Go to the appropriate directory and find the name of the appropriate file. SPSS defaults to opening SPSS data files with
SPSS TRAINING SPSS VIEWS
 SPSS TRAINING SPSS VIEWS Dataset Data file Data View o Full data set, structured same as excel (variable = column name, row = record) Variable View o Provides details for each variable (column in Data
4. Descriptive Statistics: Measures of Variability and Central Tendency
 4. Descriptive Statistics: Measures of Variability and Central Tendency Objectives Calculate descriptive for continuous and categorical data Edit output tables Although measures of central tendency and
User Services Spring 2008 OBJECTIVES Introduction Getting Help Instructors
 User Services Spring 2008 OBJECTIVES Use the Data Editor of SPSS 15.0 to to import data. Recode existing variables and compute new variables Use SPSS utilities and options Conduct basic statistical tests.
Mr. Kongmany Chaleunvong. GFMER - WHO - UNFPA - LAO PDR Training Course in Reproductive Health Research Vientiane, 22 October 2009
 Mr. Kongmany Chaleunvong GFMER - WHO - UNFPA - LAO PDR Training Course in Reproductive Health Research Vientiane, 22 October 2009 1 Object of the Course Introduction to SPSS The basics of managing data
How to Use a Statistical Package
 APPENDIX D How to Use a Statistical Package Candace M. Evans, Lisa M. Gilman, Jeffrey Xavier, Joan Saxton Weber Computers and statistical software such as the Statistical Package for the Social Sciences
Frequency Tables. Chapter 500. Introduction. Frequency Tables. Types of Categorical Variables. Data Structure. Missing Values
 Chapter 500 Introduction This procedure produces tables of frequency counts and percentages for categorical and continuous variables. This procedure serves as a summary reporting tool and is often used
22/10/16. Data Coding in SPSS. Data Coding in SPSS. Data Coding in SPSS. Data Coding in SPSS
 DATA CODING IN SPSS STAFF TRAINING WORKSHOP March 28, 2017 Delivered by Dr. Director of Applied Economics Unit African Heritage Institution Enugu Nigeria To code data in SPSS, Lunch the SPSS The Data Editor
INTRODUCTION TO SPSS. Anne Schad Bergsaker 13. September 2018
 INTRODUCTION TO SPSS Anne Schad Bergsaker 13. September 2018 BEFORE WE BEGIN... LEARNING GOALS 1. Be familiar with and know how to navigate between the different windows in SPSS 2. Know how to write a
INTRODUCTORY SPSS. Dr Feroz Mahomed Swalaha x2689
 INTRODUCTORY SPSS Dr Feroz Mahomed Swalaha fswalaha@dut.ac.za x2689 1 Statistics (the systematic collection and display of numerical data) is the most abused area of numeracy. 97% of statistics are made
Data to Story Project: SPSS Cheat Sheet for Analyzing General Social Survey Data
 Data to Story Project: SPSS Cheat Sheet for Analyzing General Social Survey Data This guide is intended to help you explore and analyze the variables you have selected for your group project. Conducting
Creating a data file and entering data
 4 Creating a data file and entering data There are a number of stages in the process of setting up a data file and analysing the data. The flow chart shown on the next page outlines the main steps that
Introduction to SPSS
 Introduction to SPSS Purpose The purpose of this assignment is to introduce you to SPSS, the most commonly used statistical package in the social sciences. You will create a new data file and calculate
Course Code: SPSS19 Introduction to IBM SPSS Statistics
 Centre for Learning and Academic Development (CLAD) Technology Skills Development Team Course Code: SPSS19 Introduction to IBM SPSS Statistics www.intranet.birmingham.ac.uk/itskills An Introduction to
Data Analysis using SPSS
 Data Analysis using SPSS 2073/03/05 03/07 Bijay Lal Pradhan, Ph.D. Ground Rule Mobile Penalty Participation Involvement Introduction to SPSS Day 1 2073/03/05 Session I Bijay Lal Pradhan, Ph.D. Object of
IBM SPSS Statistics 22 Brief Guide
 IBM SPSS Statistics 22 Brief Guide Note Before using this information and the product it supports, read the information in Notices on page 77. Product Information This edition applies to version 22, release
Basic concepts and terms
 CHAPTER ONE Basic concepts and terms I. Key concepts Test usefulness Reliability Construct validity Authenticity Interactiveness Impact Practicality Assessment Measurement Test Evaluation Grading/marking
A Demonstration of Qualtrics.com
 A Demonstration of Qualtrics.com Online Survey Hosting and Reporting Brian Pickerill, Office of Institutional Effectiveness System Features Fully Web-based, no software to install Numerous Online Training
Computers and statistical software such as the Statistical Package for the Social Sciences (SPSS) make complex statistical
 make complex statistical") Appendix C How to Use a Statistical Package With The Assistance of Lisa M. Gilman and with Contributions By Joan Saxton Weber Computers and statistical software such as the Statistical Package for the
Appendix C How to Use a Statistical Package With The Assistance of Lisa M. Gilman and with Contributions By Joan Saxton Weber Computers and statistical software such as the Statistical Package for the
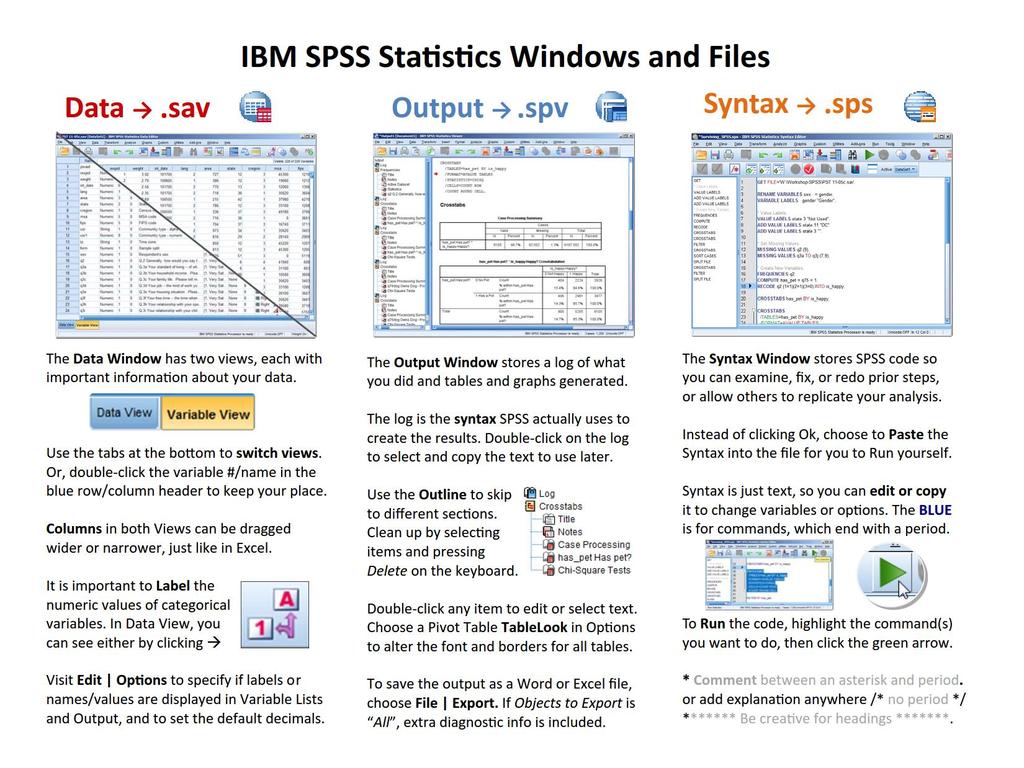
There are 3 main windows, and 3 main types of files, in SPSS: Data, Syntax, and Output.
 U6310 Quantitative Techniques Lab - September 2001 Intro to SPSS SPSS works like this: You have a data set (either you create one or use an existing file such as the GSS). You choose analysis techniques
How to Use a Statistical Package
 APPENDIX F How to Use a Statistical Package With the assistance of Lisa M. Gilman and Jeffrey Xavier and with contributions by Joan Saxton Weber Computers and statistical software such as the Statistical
MAXQDA Stats Reference Manual. Statistical Analysis with MAXQDA
 MAXQDA Stats Reference Manual Statistical Analysis with MAXQDA Support, Distribution: VERBI Software. Consult. Sozialforschung. GmbH Berlin/Germany http://www.maxqda.com MAXQDA is a registered trademark
How to Use a Statistical Package
 E App-Bachman-45191.qxd 1/31/2007 3:32 PM Page E-1 A P P E N D I X E How to Use a Statistical Package WITH THE ASSISTANCE OF LISA M. GILMAN AND WITH CONTRIBUTIONS BY JOAN SAXTON WEBER Computers and statistical
Introduction. About this Document. What is SPSS. ohow to get SPSS. oopening Data
 Introduction About this Document This manual was written by members of the Statistical Consulting Program as an introduction to SPSS 12.0. It is designed to assist new users in familiarizing themselves
Basic Medical Statistics Course
 Basic Medical Statistics Course S0 SPSS Intro December 2014 Wilma Heemsbergen w.heemsbergen@nki.nl This Afternoon 13.00 ~ 15.00 SPSS lecture Short break Exercise 2 Database Example 3 Types of data Type
Select Cases. Select Cases GRAPHS. The Select Cases command excludes from further. selection criteria. Select Use filter variables
 Select Cases GRAPHS The Select Cases command excludes from further analysis all those cases that do not meet specified selection criteria. Select Cases For a subset of the datafile, use Select Cases. In
LSP 121. LSP 121 Math and Tech Literacy II. Topics. Quartiles. Intro to Statistics. More Descriptive Statistics
 Greg Brewster, DePaul University Page 1 LSP 121 Math and Tech Literacy II More Descriptive Statistics Greg Brewster DePaul University Topics More Descriptive Statistics Quartiles Percentiles Categorical
Research Methods for Business and Management. Session 8a- Analyzing Quantitative Data- using SPSS 16 Andre Samuel
 Research Methods for Business and Management Session 8a- Analyzing Quantitative Data- using SPSS 16 Andre Samuel A Simple Example- Gym Purpose of Questionnaire- to determine the participants involvement
Brief Guide on Using SPSS 10.0
 Brief Guide on Using SPSS 10.0 (Use student data, 22 cases, studentp.dat in Dr. Chang s Data Directory Page) (Page address: http://www.cis.ysu.edu/~chang/stat/) I. Processing File and Data To open a new
Introduction to SPSS Faiez Mossa 2 nd Class
 Introduction to SPSS 16.0 Faiez Mossa 2 nd Class 1 Outline Review of Concepts (stats and scales) Data entry (the workspace and labels) By hand Import Excel Running an analysis- frequency, central tendency,
SPSS Statistics 19.0 Fix Pack 2 Fix List Release notes Abstract Content Number Description
 SPSS Statistics 19.0 Fix Pack 2 Fix List Release notes Abstract A comprehensive list of defect corrections for the SPSS Statistics 19.0 Fix Pack 2. Details of the fixes are listed below. If you have questions
Basic Medical Statistics Course
 Basic Medical Statistics Course S0 SPSS Intro November 2013 Wilma Heemsbergen w.heemsbergen@nki.nl 1 13.00 ~ 15.30 Database (20 min) SPSS (40 min) Short break Exercise (60 min) This Afternoon During the
SPSS. Faiez Mussa. 2 nd class
 SPSS Faiez Mussa 2 nd class Objectives To describe opening and closing SPSS To introduce the look and structure of SPSS To introduce the data entry windows: Data View and Variable View To outline the components
Quick Start Guide Jacob Stolk PhD Simone Stolk MPH November 2018
 Quick Start Guide Jacob Stolk PhD Simone Stolk MPH November 2018 Contents Introduction... 1 Start DIONE... 2 Load Data... 3 Missing Values... 5 Explore Data... 6 One Variable... 6 Two Variables... 7 All
Maximizing Statistical Interactions Part II: Database Issues Provided by: The Biostatistics Collaboration Center (BCC) at Northwestern University
 at Northwestern University") Maximizing Statistical Interactions Part II: Database Issues Provided by: The Biostatistics Collaboration Center (BCC) at Northwestern University While your data tables or spreadsheets may look good to
Maximizing Statistical Interactions Part II: Database Issues Provided by: The Biostatistics Collaboration Center (BCC) at Northwestern University While your data tables or spreadsheets may look good to
- 1 - Fig. A5.1 Missing value analysis dialog box
 WEB APPENDIX Sarstedt, M. & Mooi, E. (2019). A concise guide to market research. The process, data, and methods using SPSS (3 rd ed.). Heidelberg: Springer. Missing Value Analysis and Multiple Imputation
Surviving Stata Workshop
 Surviving Stata Workshop dataservices.gmu.edu/workshops/stata 2 1 Those participating in the workshop will be provided the data file. The following instructions enable others to get and open the file.
WORKSHOP: Using the Health Survey for England, 2014
 WORKSHOP: Using the Health Survey for England, 2014 There are three sections to this workshop, each with a separate worksheet. The worksheets are designed to be accessible to those who have no prior experience
Navigating in SPSS. C h a p t e r 2 OBJECTIVES
 C h a p t e r 2 Navigating in SPSS 2.1 Introduction and Objectives As with any new software program you may use, it is important that you are able to move around the screen with the mouse and that you
Crosstabs Notes Output Created 17-Mai :40:54 Comments Input
 Crosstabs Notes Output Created 17-Mai-2011 01:40:54 Comments Input Data /Users/corinnahornei/Desktop/spss table.sav Active Dataset DatenSet3 Filter Weight Split File N of Rows in Working 189 Data File
Right-click on whatever it is you are trying to change Get help about the screen you are on Help Help Get help interpreting a table
 Q Cheat Sheets What to do when you cannot figure out how to use Q What to do when the data looks wrong Right-click on whatever it is you are trying to change Get help about the screen you are on Help Help
An introduction to SPSS
 An introduction to SPSS To open the SPSS software using U of Iowa Virtual Desktop... Go to https://virtualdesktop.uiowa.edu and choose SPSS 24. Contents NOTE: Save data files in a drive that is accessible
2016 SPSS Workshop UBC Research Commons
 " 2016 SPSS Workshop #2 @ UBC Research Commons Part 1: Data Management The Select Cases Command Menu: Data Select Cases 1. Option 1- randomly selecting cases Select Random sample of cases, click on Sample,
Handling Your Data in SPSS. Columns, and Labels, and Values... Oh My! The Structure of SPSS. You should think about SPSS as having three major parts.
 Handling Your Data in SPSS Columns, and Labels, and Values... Oh My! You might think that simple intuition will guide you to a useful organization of your data. If you follow that path, you might find
DEPARTMENT OF HEALTH AND HUMAN SCIENCES HS900 RESEARCH METHODS
 DEPARTMENT OF HEALTH AND HUMAN SCIENCES HS900 RESEARCH METHODS Using SPSS Topics addressed today: 1. Accessing data from CMR 2. Starting SPSS 3. Getting familiar with SPSS 4. Entering data 5. Saving data
Introduction to StatKey Getting Data Into StatKey
 Introduction to StatKey 2016-17 03. Getting Data Into StatKey Introduction This handout assumes that you do not want to type in the data by hand. This handout shows you how to use Excel and cut and paste
SPSS. (Statistical Packages for the Social Sciences)
") Inger Persson SPSS (Statistical Packages for the Social Sciences) SHORT INSTRUCTIONS This presentation contains only relatively short instructions on how to perform basic statistical calculations in SPSS.
Inger Persson SPSS (Statistical Packages for the Social Sciences) SHORT INSTRUCTIONS This presentation contains only relatively short instructions on how to perform basic statistical calculations in SPSS.
THE VARIABLE LIST Sort the Variable List Create New Variables Copy Variables Define Value Labels... 4
 The Variable List Contents THE VARIABLE LIST... 1 Sort the Variable List... 2 Create New Variables... 3 Copy Variables... 3 Define Value Labels... 4 Define Missing Values... 4 Search and Filter Variables...
Let s use Technology Use Data from Cycle 14 of the General Social Survey with Fathom for a data analysis project
 Let s use Technology Use Data from Cycle 14 of the General Social Survey with Fathom for a data analysis project Data Content: Example: Who chats on-line most frequently? This Technology Use dataset in
First steps in SPSS. Figure 1
 First steps in SPSS Statistical Package for Social Science (SPSS) is a computer program, working with the Windows operating system, and is specialized in the classification, processing and analysis of
STAT10010 Introductory Statistics Lab 2
 STAT10010 Introductory Statistics Lab 2 1. Aims of Lab 2 By the end of this lab you will be able to: i. Recognize the type of recorded data. ii. iii. iv. Construct summaries of recorded variables. Calculate
Create Custom Tables in No Time
 PASW Custom Tables 18 Create Custom Tables in No Time Easily analyze data and communicate your results with PASW Custom Tables Show the results of analyses clearly and quickly You often report the results
SPSS syntax for data set definition
 SPSS syntax for data set definition Johan A. Elkink January 31, 2013 1 Introduction For replication purposes, it is crucial to keep proper documentation of all the steps taken in a particular analysis.
Chapter 2. Basic Operations. you through the routine procedures that you will use nearly every time you work with SPSS.
 1 Chapter 2 Basic Operations Chapter 1 presented a very conceptual overview of SPSS. The present chapter will walk you through the routine procedures that you will use nearly every time you work with SPSS.
SPSS - Beginnings Data, Descriptive Statistics, Select cases, recode Structure SPSS has 3 different fields (windows) 1. Data window (double window). O
 1. Data window (double window). O") SPSS - Beginnings Data, Descriptive Statistics, Select cases, recode Structure SPSS has 3 different fields (windows) 1. Data window (double window). One can see a) data; b) Variable information. 2. Output
SPSS - Beginnings Data, Descriptive Statistics, Select cases, recode Structure SPSS has 3 different fields (windows) 1. Data window (double window). One can see a) data; b) Variable information. 2. Output
Introduction to SPSS on the Macintosh. Scott Patterson,Ph.D. Broadcast and Electronic Communication Arts San Francisco State University.
 Introduction to SPSS on the Macintosh. Scott Patterson,Ph.D. Broadcast and Electronic Communication Arts San Francisco State University Spring 2000 This is a brief guide to using SPSS in the Macintosh
AcaStat User Manual. Version 8.3 for Mac and Windows. Copyright 2014, AcaStat Software. All rights Reserved.
 AcaStat User Manual Version 8.3 for Mac and Windows Copyright 2014, AcaStat Software. All rights Reserved. http://www.acastat.com Table of Contents INTRODUCTION... 5 GETTING HELP... 5 INSTALLATION... 5
Creating an Excel resource
 Excel Mobile Excel Mobile is a Microsoft application similar to Excel, but designed to run on handhelds. This mobile version of Excel is a spreadsheet application that allows you to manipulate numbers,
Statistical Package for the Social Sciences INTRODUCTION TO SPSS SPSS for Windows Version 16.0: Its first version in 1968 In 1975.
 Statistical Package for the Social Sciences INTRODUCTION TO SPSS SPSS for Windows Version 16.0: Its first version in 1968 In 1975. SPSS Statistics were designed INTRODUCTION TO SPSS Objective About the
AcaStat User Manual. Version 10 for Mac and Windows. Copyright 2018, AcaStat Software. All rights Reserved.
 AcaStat User Manual Version 10 for Mac and Windows Copyright 2018, AcaStat Software. All rights Reserved. http://www.acastat.com Table of Contents NEW IN VERSION 10... 6 INTRODUCTION... 7 GETTING HELP...
Introduction to Excel
 Introduction to Excel Written by Jon Agnone Center for Social Science Computation & Research 145 Savery Hall University of Washington Seattle WA 98195 U.S.A. (206)543-8110 November 2004 http://julius.csscr.washington.edu/pdf/excel.pdf
GETTING STARTED. A Step-by-Step Guide to Using MarketSight
 GETTING STARTED A Step-by-Step Guide to Using MarketSight Analyze any dataset Run crosstabs Test statistical significance Create charts and dashboards Share results online Introduction MarketSight is a
Entering and Outputting Data 2 nd best TA ever: Steele H. Valenzuela February 2-6, 2015
 Entering and Outputting Data 2 nd best TA ever: Steele H. Valenzuela February 2-6, 2015 Contents Things to Know Before You Begin.................................... 1 Entering and Outputting Data......................................
Research Data Analysis using SPSS. By Dr.Anura Karunarathne Senior Lecturer, Department of Accountancy University of Kelaniya
 Research Data Analysis using SPSS By Dr.Anura Karunarathne Senior Lecturer, Department of Accountancy University of Kelaniya MBA 61013- Business Statistics and Research Methodology Learning outcomes At
Using SPSS with The Fundamentals of Political Science Research
 Using SPSS with The Fundamentals of Political Science Research Paul M. Kellstedt and Guy D. Whitten Department of Political Science Texas A&M University c Paul M. Kellstedt and Guy D. Whitten 2009 Contents
DATA DEFINITION PHASE
 Twoway Analysis of Variance Unlike previous problems in the manual, the present problem involves two independent variables (gender of juror and type of crime committed by defendant). There are two levels
SPSS Statistics Patch Description
 SPSS Statistics 18.0.1 Patch Description Product: SPSS Statistics 18.0.1 Date: December 8, 2009 Description: This patch resolves the following issues: 1. A problem with reading large SAS data files was
INTRODUCTION TO SPSS OUTLINE 6/17/2013. Assoc. Prof. Dr. Md. Mujibur Rahman Room No. BN Phone:
 INTRODUCTION TO SPSS Assoc. Prof. Dr. Md. Mujibur Rahman Room No. BN-0-024 Phone: 89287269 E-mail: mujibur@uniten.edu.my OUTLINE About the four-windows in SPSS The basics of managing data files The basic
Data analysis using Microsoft Excel
 Introduction to Statistics Statistics may be defined as the science of collection, organization presentation analysis and interpretation of numerical data from the logical analysis. 1.Collection of Data
Chapter 2 Entering Data. Chapter Table of Contents
 Chapter 2 Entering Data Chapter Table of Contents INVOKING SAS/INSIGHT SOFTWARE... 28 ENTERING VALUES... 31 NAVIGATING THE DATA WINDOW... 33 ADDING VARIABLES AND OBSERVATIONS... 34 DEFINING VARIABLES...
Lastly, in case you don t already know this, and don t have Excel on your computers, you can get it for free through IT s website under software.
 Welcome to the EASE workshop series, part of the STEM Gateway program. Before we begin, I want to make sure we are clear that this is by no means meant to be an all inclusive class in Excel. At each step,
Introduction to SPSS Edward A. Greenberg, PhD
 Introduction to SPSS Edward A. Greenberg, PhD ASU HEALTH SOLUTIONS DATA LAB JANUARY 7, 2013 Files for this workshop Files can be downloaded from: http://www.public.asu.edu/~eagle/spss or (with less typing):
GCRO 2011 QoL Survey Viewer
 GCRO 2011 QoL Survey Viewer User Manual 1 P a g e Disclaimers The information contained in this document is the proprietary and exclusive property of the Gauteng City-Region Observatory except as otherwise
You will learn: The structure of the Stata interface How to open files in Stata How to modify variable and value labels How to manipulate variables
 Jennie Murack You will learn: The structure of the Stata interface How to open files in Stata How to modify variable and value labels How to manipulate variables How to conduct basic descriptive statistics
Digital literacy training
 Digital literacy training SPSS Introduction 2018 ANU Library anulib.anu.edu.au/training digital.literacy@anu.edu.au Table of Contents To start SPSS... 1 Import Excel files... 1 The Data View window...
Barchard Introduction to SPSS Marks
 Barchard Introduction to SPSS 21.0 3 Marks Purpose The purpose of this assignment is to introduce you to SPSS, the most commonly used statistical package in the social sciences. You will create a new data
SPSS stands for Statistical Package for the Social Sciences. SPSS was made to be easier to use then other statistical software like S-Plus, R, or SAS.
 SPSS DR.MARANE 1 SPSS at a glance SPSS stands for Statistical Package for the Social Sciences SPSS was made to be easier to use then other statistical software like S-Plus, R, or SAS. The newest version
Converting census data into GIS data
 Converting census data into GIS data For those interested in analyzing Canadian demographics data, census data can be downloaded directly from ODESI or the Canadian Census Analyser. In order to use the
UNESCO, Division for Planning and Development of Education Systems, Section for Sector Policy Advice and ICT in Education (ED/PDE/PAD)
") Guidelines for On- line Data E ntry and Downloading Impact of the Global Financial and Economic Crisis on Education in Selected Developing Countries (DFID RIVAF) UNESCO, Division for Planning and Development
Guidelines for On- line Data E ntry and Downloading Impact of the Global Financial and Economic Crisis on Education in Selected Developing Countries (DFID RIVAF) UNESCO, Division for Planning and Development
WHO STEPS Surveillance Support Materials. STEPS Epi Info Training Guide
 STEPS Epi Info Training Guide Department of Chronic Diseases and Health Promotion World Health Organization 20 Avenue Appia, 1211 Geneva 27, Switzerland For further information: www.who.int/chp/steps WHO
Barchard Introduction to SPSS Marks
 Barchard Introduction to SPSS 22.0 3 Marks Purpose The purpose of this assignment is to introduce you to SPSS, the most commonly used statistical package in the social sciences. You will create a new data
Microsoft Office Excel
 Microsoft Office 2007 - Excel Help Click on the Microsoft Office Excel Help button in the top right corner. Type the desired word in the search box and then press the Enter key. Choose the desired topic
Insert Subtotals in Excel and Link Data to a Word Document
 CHAPTER 1 Integrated Projects More Skills 11 Insert Subtotals in Excel and Link Data to a Word Document In Excel, summary statistics such as totals and averages can be calculated for groups of data by
Identifying Updated Metadata and Images from a Content Provider
 University of Iowa Libraries Staff Publications 4-8-2010 Identifying Updated Metadata and Images from a Content Provider Wendy Robertson University of Iowa 2010 Wendy C Robertson Comments Includes presenter's
Chapter One: Getting Started With IBM SPSS for Windows
 Chapter One: Getting Started With IBM SPSS for Windows Using Windows The Windows start-up screen should look something like Figure 1-1. Several standard desktop icons will always appear on start up. Note
Introduction to R. Andy Grogan-Kaylor October 22, Contents
 Introduction to R Andy Grogan-Kaylor October 22, 2018 Contents 1 Background 2 2 Introduction 2 3 Base R and Libraries 3 4 Working Directory 3 5 Writing R Code or Script 4 6 Graphical User Interface 4 7
Appendix A. SPSS 11.x in 30 Minutes
 Appendix A SPSS 11.x in 30 Minutes For use with Exploring Research (5/e) Neil J. Salkind 1 Lesson 1 Starting SPSS After This Lesson, You Will Know How to start SPSS What the opening SPSS screen looks like
Discoverer Viewer. User Manual. for SDS
 Discoverer Viewer User Manual for SDS saskatchewan.ca 2017 Table of Contents Introduction... 3 How to Get Started... 3 Logging In... 3 First Time Logging In Preferences Changes... 4 Worksheet List... 5
Nuts and Bolts Research Methods Symposium
 Organizing Your Data Jenny Holcombe, PhD UT College of Medicine Nuts & Bolts Conference August 16, 3013 Topics to Discuss: Types of Variables Constructing a Variable Code Book Developing Excel Spreadsheets
Chapter 1. Manage the data
 1.1. Coding of survey questions Appendix A shows a questionnaire with the corresponding coding sheet. Some observations of the selected variables are shown in the following table. AGE SEX JOB INCOME EDUCATE
Microsoft Office 2010: Introductory Q&As Access Chapter 2
 Microsoft Office 2010: Introductory Q&As Access Chapter 2 Is it necessary to close the Navigation Pane? (AC 78) No. It gives you more room for the query, however, so it is usually a good practice to hide
Applied Regression Modeling: A Business Approach
 i Applied Regression Modeling: A Business Approach Computer software help: SPSS SPSS (originally Statistical Package for the Social Sciences ) is a commercial statistical software package with an easy-to-use
How to Make APA Format Tables Using Microsoft Word
 How to Make APA Format Tables Using Microsoft Word 1 I. Tables vs. Figures - See APA Publication Manual p. 147-175 for additional details - Tables consist of words and numbers where spatial relationships