Using vrealize Network Insight. VMware vrealize Network Insight 3.7
|
|
|
- Maria Anthony
- 5 years ago
- Views:
Transcription


1 Using vrealize Network Insight VMware vrealize Network Insight 3.7
2 You can find the most up-to-date technical documentation on the VMware website at: If you have comments about this documentation, submit your feedback to VMware, Inc Hillview Ave. Palo Alto, CA Copyright 2018 VMware, Inc. All rights reserved. Copyright and trademark information. VMware, Inc. 2
3 Contents 1 About vrealize Network Insight User Guide 6 2 Introduction 7 Homepage 9 Navigation 10 3 Search 12 Simple Search 12 Advanced Search 13 Time Control 14 Search Results 15 Filters 15 4 Entity Pages 17 5 Pins 18 Types of Pins 18 6 Working with Topologies 21 Virtual Machine Topology 21 Path to Internet 22 VM-VM Path 22 VXLAN 25 VLAN 25 L3 Networks 25 NSX Manager 26 Hosts 26 7 Network Address Translation (NAT) 28 NAT Support 28 8 Security Groups 31 Palo Alto Networks 32 Check Point Firewall 34 9 Micro-Segmentation Planning 38 Application-Centric Micro-Segmentation 40 Exporting Rules 42 VMware, Inc. 3
4 View Blocked and Protected Flows 42 Flow Support for Physical Servers vcenter Tags NSX-T Cross vcenter NSX Collaboration Tools 56 Pinboards Settings 58 Install and Support 59 Accounts and Data Sources 65 Data Management 74 IP Properties and Subnets 74 Working with Events 76 Search-based Notifications 80 Event Notification 80 Event Notifications 81 Syslog Configuration 83 User Management 83 LDAP 84 Configuring Mail Server 86 Support for Simple Network Management Protocol (SNMP) 87 My Profile 88 About Page 88 Automatic Storage Expansion for Platform VM VPC Flow Logs Viewing the vrealize Network Insight Dashboards 92 NI System Dashboard 92 NI Platform Dashboard 94 NI Collector Dashboard 95 Data Source Dashboard Viewing the Flow Analytics Dashboard Viewing the PCI-Compliance Dashboard 100 VMware, Inc. 4
5 19 Help Common Data Source Errors 104 VMware, Inc. 5
6 About vrealize Network Insight 1 User Guide The vrealize Network Insight User Guide provides information about using vrealize Network Insight. Intended Audience This information is intended for administrators or specialists responsible for using vrealize Network Insight. The information is written for experienced virtual machine administrators who are familiar with enterprise management applications and datacenter operations. VMware Technical Publications Glossary VMware Technical Publications provides a glossary of terms that might be unfamiliar to you. For definitions of terms as they are used in VMware technical documentation, go to VMware, Inc. 6
7 Introduction 2 VMware vrealize Network Insight delivers intelligent operations for software-defined networking and security. It helps customers build an optimized, highly-available, and secure network infrastructure across multi-cloud environments. It accelerates micro-segmentation planning and deployment, enables visibility across virtual and physical networks, and provides operational views to manage and scale the VMware NSX deployments. Think of your entire data center as being composed of entities and their relationships. As an example, a virtual machine is an entity, and the virtual machine is part of a Host which is another entity. vrealize Network Insight provides visibility and information on numerous entities that are part of your data center. Table 2 1. Entities Description Host Problem NSX Firewall Virtual Machine vsphere Distributed Switch Physical Switch Virtual Port Group VMware, Inc. 7
8 Table 2 1. (Continued) Entities Description Cisco Fabric Extender Logical Switch Datastore Physical Network Interface Card Security Group Blade Router VLAN Group of VMs Configuration Changes Router Interface Troubleshoot Network Access Translation (NAT) Mail Server This chapter includes the following topics: Homepage Navigation VMware, Inc. 8

9 Homepage The VMware vrealize Network Insight homepage provides you a quick summary of what is happening in your entire data center. It provides you a quick access to the important components of vrealize Network Insight of your data center. The homepage is divided into the following sections: Search Bar The Search bar provides you the ability to search across your data center network (and its corresponding entities). You can use the search bar to search for the entities that are available in your data center. The search bar is available at the top of the homepage. Based on your requirement, you can perform search as per the following time line options: Presets: Using this option, you can narrow down your search results for presets such as last week, last 3 days, last 24 hours, yesterday, today, last 2 hours, last hour, and now (current time). At: Using this option, you can narrow down your search results for a particular date and time. Between: Using this option, you can search for data between a particular time interval. Plan Section Micro Segments: You can plan the micro-segmentation of the network based on the flows between all the VMs. Application: You can define your applications and analyse their flows, and plan their security. VMware, Inc. 9
10 Operate and Troubleshoot Section The Operate and Troubleshoot section provides visibility, metrics, and analytics for the following components: Virtual Machine (VM) VLAN Network Data Center NSX Security Group VMware NSX Open Problems The Open Problems section provides a quick glance of the critical events that the platform finds in your data center. All such similar events are grouped. Use Show All to view all the events. To view more details of an event, click (View Details). What's Happening The What s Happening section provides a quick view of very high-value properties from your data center. To view the property details, click the count of a particular property. This section also contains filters on the left side to filter the events, and expand all and collapse all buttons to view the details of the events. Navigation vrealize Network Insight contains a navigation panel on the left that helps users to navigate quickly to the key product features such as Security, Topologies, Entities, Events, and Saved Searches of interest without having to type any search queries. The Navigation Panel contains the following options: Security: Provides you the following options: Plan Security: Allows you to analyze the flows in the environment and helps to plan the microsegments within the environment. You can select all the entities or select a particular entity and then select the duration to analyze the selected entity. Applications: Allows you to create applications in vrealize Network Insight by using custom search. Once you create an application, you can plan it accordingly. PCI Compliance: The PCI-Compliance dashboard helps in assessing compliance against the PCI requirements only in the NSX environment. Path and Topology: Allows you to view any VM to VM path or topology of several entities of the data center. VMware, Inc. 10

11 Events: Allows you to view the events (changes and problems) in your environment. There is also a list of event types so that you can quickly view a specific type of event. Entities: Displays the list of all the different types of entities present in your environment. Click any entity type from the given list to view a list of all the entities of that type. The text box above the entities list can be used to narrow down the list based on text entered. Saved Searches: Displays the searches that have been saved previously. VMware, Inc. 11
12 Search 3 vrealize Network Insight provides a robust search for all the entities in your environment. When you search for entities, the software displays the entities that match your search query on the Results page. The search-bar uses natural language to search through various aspects of your SDDC. For each search query, the search bar suggests you the next term that you can use to narrow down your search results. For example, when you enter the term vm, the search bar displays a possible list of terms that you can add to your existing term to narrow down your search results. The search bar also validates each search query. A check mark denotes a valid search query and a cross mark denotes an invalid search query. The Help page provides examples of currently supported queries. This chapter includes the following topics: Simple Search Advanced Search Time Control Search Results Filters Simple Search The features of simple search are as follows: Entity Types Example: VM, Host, VLAN, VXLAN, and so on Some pre-defined types can be used to search for multiple related entity types. Example: L2 Network represents VLAN, VXLAN, and Native L2 networks. Auto-complete can be used to explore entity types and other prop Event Types Example: MTU Mismatch Event, Membership Change Event, and so on VMware, Inc. 12
13 Problems or Changes can be used as keywords to search for all problems or change events VMs VM 'vm1' L2 Networks Problems MTU Mismatch Events Show all the VMs Show VM with name 'vm1' Show all L2 networks (VLAN, VXLAN, Native) Show all problem events Show all MTU Mismatch Events Configuration properties To find entities matching a configuration property value Example: <Name>, <IP Address>, <IP Address 1 - IP Address 2>, and so on Different types of properties: String, Numeric, IP, Range, Reference, and so on Reference is used to represent data center as a graph. So VM has a reference to Host, Cluster and so on Metric properties To find all entities with an applicable metric Example: CPU Usage Rate, Network Usage Rate, and so on Planning This can be used to plan the security of the data center by analyzing the flows Example: Plan Security Group 'SG_All', Plan Host 'Host-1', and so on "Plan Security" can be used to plan security of the entire data center. Path This can be used to show the path between two VMs or the path from VM to Internet VM dev1 to VM db1 VM dev2 to Internet Note Auto-complete can be used to explore more entity types and properties. Advanced Search The features of advanced search are: Filtering Search results can be filtered using the properties that they have. Example: VMs where IP Address = VMware, Inc. 13
14 VMs where CPU Usage Rate > 90% VMs where host = host1 Filters can be combined using the following logical operators: and or not Example: VMs where IP Address = /16 and Network Rate > 1 Mbps VMs where IP Address = CPU Usage Rate > 90% or Network Rate > 1 Mbps Projection Get properties or metrics. IP Address of VMs CPU Usage Rate, CPU Count of VMs 1 Aggregation (SUM, AVG, MAX, MIN) can be used for numeric properties and metrics. AVG(CPU Usage Rate) of VMs Sorting Results can be sorted using the order by clause. Order: asc or desc (optional) Example: VMs order by CPU Usage Rate Limit the # of results Example: top 10 VMs order by CPU Usage Rate Group By Search results can be grouped by a given property into buckets. By default, groups by results are ordered by count of entities in each bucket. Example: VMs group by Host This property returns list of hosts with # of VMs on each host Group by results can be sorted by applying aggregation on numeric properties and metrics SUM(Bytes) of Flows group by Port order by SUM(Bytes) SUM(CPU Count) of VMs group by Host order by SUM(CPU Count) Returns list of ports ordered by sum of total bytes for all the flows on that port Returns list of hosts ordered by sum of vcpus of all VMs on every host Time Control VMware, Inc. 14

15 Time-control allows you to run a search query within the context of a selected time or time range. You can select from a list of presets such as last 24 hours, last 3 days, and so on. You can also specify a particular date and time using the At option or even a range using the Between option. Search Results The search results page provides a detailed list of concerned entities that match a particular search. The page itself provides numerous information that ranges from the list of entities, their corresponding properties, and facets to filter the search results to refine your search. You can also expand or collapse each entry in the search results to view more information about a particular entry. You can also create a notification for each search. Note You can point to a particular property in the search results and also in the entity pages to view a tool tip containing more information about that property. The following graphic shows the search results for the VXLANs where num vms > 0 search query for a time from the past. Filters VMware, Inc. 15

16 Once you get the search results, click Add more filters on the left pane as per your requirements. You can view a series of filter categories that you can use to narrow down the search results. The number of available filters for each category is mentioned in a small box beside the category. View the available filters for that category (along with a short explanation for each filter) and click to apply that filter. You can also use the filter search box to search for a particular filter and vrealize Network Insight automatically shows the filters that match your search query and you can click to apply that filter. Each filter has several properties to refine the search results. When you select a filter property from one of the filters, then the selected property is highlighted in the search results. VMware, Inc. 16
17 Entity Pages 4 The entity pages provide a comprehensive outlook of the entities that are present in your data center. This information can range from detailed topologies to show relationships with other entities of your data center to detailed metrics about a particular entity. Each entity page is a collection of pins and each pin shows specific information related to the entity. The information provided is both real time and historical, and an exhaustive list of metrics and properties for the entity. If you want to visit the Help content, then click Help on the top-right corner of the entity page. Timeline The timeline provides you the following information: The state of the data center at a particular time in the past A bird s eye view of events that were detected across a selected time range Select the time range of the timeline that you want to view. To view a particular timeline, select the time range by using the Time Range option. Property Pins The property pins display important attributes in a two-column layout. Some property pins might also display only a singular attribute value. An example of the property pin is the VM Properties pin. The VM Property pin displays the properties of a VM, such as operating system, IP address, default gateway, logical switches, CPU, memory, power state, and so on. VMware, Inc. 17
18 Pins 5 The information on each entity page is segregated into pins. All the entity pages are made up of pins and each pin contains a specific bit of information related to the entity. The pins have the following features: You can maximize the view of any pin using the More options ( ) button and also view more information about the pin using the Help option. Pins can also contain filters so that you can drill down on the data that is displayed on the pin. Many pins also contain the Export as CSV option so that you can export the data present in the pin in CSV format. You can select the specific properties and the number of CSV rows you want to export in the dialog that is displayed. Types of Pins Most of the pins that are available in the software can be categorized into the following: Metrics Pins The metrics pins show important metrics pertaining to the selected entity. The metrics pin uses the cubism graph to display data by dividing each graph into two bands and transposing the higher value one over another. The higher values hence are shown in darker color and are easier to discern. You can select the particular metric to display from the drop-down present in the pin header and change the selection of entities to display. The time range can be modified by either using the range presets or entering in a custom date/time. An example of the Metrics pin is the VM Metrics pin. This pin displays the network traffic rate, network Tx rate, network Rx rate, and packet drops of the virtual machine. VMware, Inc. 18

19 Entity List View Pins The Entity List View pins display a list of entities that are grouped by a common theme. The list shows important attributes per entity. You can see more attributes of a particular entity by clicking the magnify icon on the far right. Clicking the entity name takes you to the entity page. Like other pins, the filter icon houses various facets with which the list can be filtered. An example of the Entry List View pin is the VM Neighbors pin. By default, this pin shows the VMs that are present on the same host. You can also filter VMs by Security Groups, VXLAN, and datastore. Event View List Pins The Events List view pins provide a list of events in chronological order for a particular entity or group of entities (that can be selected from the dropdown in the pin header). You can change how far back in time (from now) should the pin show the events by using the available presets or entering in a custom date/time. Other filter options such as Event Status and Event Type can be selected by clicking on the filter icon. In the below image, the events related to VM Prod-db-vm21 and its related entities are displayed. You can click the entity name to view events from other related entities. Using the filter you can filter the events based on their status and their types. An event can be a change or a problem related to an entity. VMware, Inc. 19
20 You can search for the events by using the events search query. You can search for open or closed events with queries such as open events or closed events. You can also search for problems with the same modifiers. VMware, Inc. 20
21 Working with Topologies 6 Topologies are one of the many innovative features that vrealize Network Insight provides. Topologies allow you to view your data center's architecture. You can point your mouse pointer to the entity icons to get their addressable names and click an icon to display a summarized account of their primary attributes. The following topologies can be viewed in respective entity pages: This chapter includes the following topics: Virtual Machine Topology Path to Internet VM-VM Path VXLAN VLAN L3 Networks NSX Manager Hosts Virtual Machine Topology The virtual machine topology provides a comprehensive view of a singular virtual machine in relation to the rest of your data center. VMware, Inc. 21
 that exist between the virtual machine and the Internet.")
22 Path to Internet For each virtual machine that is present in your environment, vrealize Network Insight shows you how the VM is connected to the Internet by using an animated path in the Path to Internet pin. The path populates all the components (both virtual and physical) that exist between the virtual machine and the Internet. It draws an animated path that connects each component in a sequence. The path direction can also be reversed by using the arrows situated above the visualization. Point your mouse pointer to the entity icons to get their addressable names. Click an icon on the path to display a summarized account of its primary attributes. You can also maximize the pin to see the path details. VM-VM Path The VM-VM path topology draws a detailed connection that exists between any two virtual machines in your environment. VMware, Inc. 22

23 The topology involves both Layer 3 and Layer 2 components. This topology can be viewed using the search query vm_name_1 to vm_name_2. If a path exists, the VM-VM path visualization proceeds to populate all the components that exist between vm_name_1 to vm_name_2 and also draws an animated path. If the routers are physical, then they are shown outside the boundary. In the VM Path topology, if you hover your mouse on any of the routers, edges, or LDRs that are involved in the path, the complete routing or NAT information is shown. The VM Underlay section that is on the right side of the VM Path topology shows the underlay information of the VMs involved and their connectivity to the top of the rack switches and the ports involved. In the VM underlay section, the components are labeled if you select Show labels under Path Details. In this section, the drop-down list at the top shows the endpoint VMs and the active VMs at the edges. For each edge VM, the neighboring drop-down list shows the ingress and the egress interface IP addresses. Based on the selection, the underlay path for that particular interface is shown.. You can also reverse the path direction using the arrows on top of the topology map. The topology map gives more visibility regarding the ports involved in the VM-VM path. In the Path Details section, the name of the actual port channel is shown. Note There is no complete visibility for layer 2 on the physical front. If a packet is traversing from one switch to another, there maybe multiple switches involved. But the topology does not show the switches in the underlay network. Support for Equal-Cost Multi-Path (ECMP) Route vrealize Network Insight provides ECMP support in the VM-VM path. The VM-VM path shows the following information on ECMP: The multiple ECMP paths from source to destination The routers on which ECMP occurs The possible outgoing paths for a given router (VRF) The route for the possible path VMware, Inc. 23

24 In the preceding figure, you can see the ECMP-enabled routers. If you point over them, the additional paths are shown. Also, you can create a path by selecting and locking the routers as per your requirement. If you want to view all the ECMP paths between the two VMs, select the Show all ECMP paths option in the topology diagram. If you want to view the path for a particular router, point on the router and click Keep Focus. The paths specific to the router is shown. VMware, Inc. 24

25 VXLAN Virtual extensible Local Area Network (VXLAN) overlay networking technology is an industry standard that is developed by VMware jointly with the major networking vendors. The VXLAN topology is an innovative visualization that gives you an overview of the selected VXLAN. The following diagram elucidates the various components that make up the visualization: Note Both virtual and physical components can be visualized in this manner. VLAN Virtual LANs (VLANs) enable a single physical LAN segment to be further segmented so that groups of ports are isolated from one another as if they were on physically different segments. The VLAN topology is constructed in a similar manner as the VXLAN topology. L3 Networks The L3 Networks topology provides an overview of your entire network. An Edge in the topology which has NAT rules configured is shown with the word NAT. VMware, Inc. 25

26 NSX Manager The NSX Manager topology shows the components that are associated with the NSX Manager. Hosts The host topology shows how VMs of a particular host are connected to the virtual and physical components of your data center and also how the host itself is connected with your data center. VMware, Inc. 26

27 VMware, Inc. 27
28 Network Address Translation (NAT) 7 vrealize Network Insight lists both SNAT and DNAT rules that are configured on the VMware NSX Edge. The NAT Rules query lists all the SNAT and DNAT rules. The VM to VM path also includes and shows the Edge NAT gateways configured in the path. Only the NAT rules configured on the Uplink interface of the VMware NSX Edge are processed by the VM to VM path. The nested NAT hierarchy is also supported. NAT Support The NAT flow support in vrealize Network Insight is as follows: Only NSX-based edges are supported. Only edges with defined uplinks are supported. Only edges with NAT-defined uplinks are supported. The flow of the following NAT domains are reported: Default domain The single child domain of the default NAT domain NAT Flow Support - Examples This section consists of few examples for the supported NAT flow in vrealize Network Insight. VMware, Inc. 28


29 Example 1 In the above topology, E2, E3, LDRs, VMs ( VM1, VM2, VM3, VM4) are part of NAT domain E1. Anything above E1 such as uplink of E1 is part of default NAT domain. The above topology consists of the following: The flow from VM1 to VM2 and vice versa is reported in vrealize Network Insight. Similarly the flow from VM3 to VM4 and vice versa is reported. Example 2 The above topology consists of the following: VM1 and VM2 are part of E2 domain. VM3 and VM4 are part of E2 domain. E2 and E3 NAT domains are child domains of E1 NAT domain. E1 is the single child of default NAT domain. VMware, Inc. 29
30 VM5 and VM6 are part of E1 NAT domain. In the above topology, the following flows are reported in vrealize Network Insight: Flow from VM5 to VM6 Flow from (VM1, VM2) to (VM3, VM4) VMware, Inc. 30

31 Security Groups 8 Security Groups are a set of groups that are managed through a common set of permissions. The Security Group topology has the following two views: Firewall View The Security Group firewall topology displays the relation between the selected Security Group and other Security Groups by showcasing the firewall rules that are applicable between the Security Groups. Container View The Security Group container topology displays how the Security Group is structured with respect to its parent Security Groups or children (Security Groups or other entities). VMware, Inc. 31

32 This chapter includes the following topics: Palo Alto Networks Check Point Firewall Palo Alto Networks vrealize Network Insight supports Palo Alto Panorama 8.0. The Palo Alto Network features that are supported by vrealize Network Insight are as follows: Interrelation of Palo Alto and NSX entities: The VM membership of the address and the address group of Palo Alto Networks is computed based on the IP Address to VM mapping. This membership info can be queried as follows: VM where Address = <> Palo Alto address where vm = <> VM where Address Group = <> Palo Alto address group where vm = <> Query: You can perform a query for all the Palo Alto entities that are supported by vrealize Network Insight. All the entities are prefixed by Palo Alto. Some of the queries are as follows: Table 8 1. Entities Queries Palo Alto Address Palo Alto address where vm = <> VM where Address = <> Palo Alto Address Group Palo Alto address group where Translated VMs = <> VM where address group = <> Palo Alto Device Palo Alto Device where Version = <> Palo Alto Device where connected = true Palo Alto Device where family = 'PA-5060' VMware, Inc. 32
 Entities Palo Alto Physical Device Palo Alto VM Device Queries Palo Alto Physical Device where model = 'PA-5060' Palo Alto VM Device where model = 'PA-VM' Palo Alto Device Group Palo Alto")
33 Table 8 1. (Continued) Entities Palo Alto Physical Device Palo Alto VM Device Queries Palo Alto Physical Device where model = 'PA-5060' Palo Alto VM Device where model = 'PA-VM' Palo Alto Device Group Palo Alto Device Group where device = <> Palo Alto Device Group where address = <> Palo Alto Device Group where address group = <> Palo Alto Service Palo Alto service where Port = <> Palo Alto service where Protocol = <> Palo Alto Service Group Palo Alto service group where Member = <> Palo Alto Policy Palo Alto Policy where Source vm = <> and Destination vm = <> Palo Alto Policy where Source IP = <> and Destination IP = <> Palo Alto firewall Palo Alto firewall where Rule = <> Palo Alto Zone Palo Alto Zone where device = <> Palo Alto Virtual System Palo Alto Virtual System where Device = <> Palo Alto Virtual System where Device Group = <> Note Other than the queries, you can also use facets to analyze the search results. VM to VM Path: As a part of the VM-VM topology, vrealize Network Insight displays the Palo Alto VM Series firewall on the host. The applicable rules are displayed when one clicks the firewall icon. If a firewall device (routing device) of Palo Alto Network is also present in the path, then that device is also displayed. When you click the device icon, you can see the basic information such as a Routing table, Interfaces, and a table containing the applied firewall rules. VMware, Inc. 33
34 You can view some system events related to the following scenarios for Palo Alto Networks: Palo Alto device not connected to Panorama (manager) NSX Manager not in registered with Panorama NSX fabric agent not found on the ESX for palo alto device Palo alto device not found on Panorama for NSX fabric agent Out of sync security group membership data A sample Palo Alto Manager dashboard is shown as follows: Check Point Firewall vrealize Network Insight currently supports post R80 version of the Check Point firewall. You can perform a query for all the Checkpoint entities that are supported by vrealize Network Insight. All the entities are prefixed by Check Point. Some of the queries for Checkpoint are as follows: VMware, Inc. 34
35 Table 8 2. Entities in Check Point Keywords Queries IPset Check Point Address Range Check Point Network vm where Address Range = <> vm where Address Range = <> Check Point Address Range where Translated VM = <> Grouping Check Point Network Group Check Point Network Group where Translated VM = <> vm where Network Group = <> Service/ Service Group Check Point Service Check Point Service Group Check point service where Port = <> Check point service where protocol = <> Access Layer Check Point Access Layer Check Point Policy where Access Layer = <> Policy Package Check Point Policy package Check Point Policy where Policy Package = <> Check Point Policy Package where Rule = <> Policy Check Point Policy Check point policy where source ip = <> and Destination IP = <> Rule where source ip = <> and Destination IP = <> (will display other rules- nsx, redirect along with check point policies in the system) Gateways and Gateway Cluster Check Point Gateway Check Point Gateway Cluster Check Point Gateway Cluster where Policy Package = <> A sample Check Point Manager dashboard is shown as follows: VMware, Inc. 35

36 Also, in a VM-VM topology, you can see the Check Point Service VMs on a host to signify the Check Point rules applied on particular traffic. You can view some system events related to the following scenarios for Check Point: NSX fabric agent not found on the ESX for check point gateway. Check point service vm not found. Check point gateway sic status not communicating. VMware, Inc. 36
37 Discovery and update events for check point entities like address range, networks, policies, groups, policy package, service, service group, and so on. VMware, Inc. 37

38 Micro-Segmentation Planning 9 The micro-segmentation planning topology shows all the flows that are present in your environment by dividing the flows into segments. In vrealize Network Insight, a flow is a 4-tuple. It includes: Source IP Destination IP Destination port Protocol You can analyze the flows by selecting scope and segment them accordingly based on entities such as VLAN/VXLAN, Security Groups, Application, Tier, Folder, Subnet, Cluster, virtual machine (VM), Port, Security Tag, Security Group, and IPSet. The blue lines denote the outgoing flows, the green lines denote the incoming flows, and the yellow lines denote the flows that are bidirectional. You can click any of the segments to view its details. The VMs that are outside the selected scope are grouped as Other Entities in the micro-segmentation planning topology. VMware, Inc. 38

39 You can also analyze the flows by creating subgroups as per Physical, Other Virtual, and Internet categories. Each group is expanded into a wedge. In the following topology, the wedge for Physical group is seen. There is also a Traffic Distribution pin that shows the amount of traffic that is flowing in different parts of your data center. The Flows pin shows that the flows for different time intervals segregated by ports. You can either view all the flows or view the flows between two entities. You can filter the flows by Allowed and Blocked flows. You can view flows by either Total Bytes or by Allowed Session Count. For the flows that are protected by a firewall, a Protected by Firewall sign is used to denote that the flows in that port that are protected by a firewall. The planning for a scope such as an entire data center or a cluster selects flows that have VMs or Physical Servers (identified by the Physical IPs) as the source or the destination. A topology has two distinct zones: Internal: This zone includes the VMs or the IP addresses in the scope. VMware, Inc. 39
40 External: This zone includes the VMs or the IP addresses that are out of scope but talk to the VM or IP addresses in the internal zone. The external zone consists of the following wedges: DC Virtual: It includes the source or the destination data center internal VMs that are talking to VMs or IP addresses in the internal zone and are not hosting any well-known shared services such as LDAP, NTP, and so on. Shared Virtual: It includes the destination data center internal VMs hosting well-known shared services such as LDAP, NTP, and so on to which the VMs or IP addresses in the internal zone are talking. DC Physical: It includes the source or the destination data center internal physical IP addresses that are talking to VMs or IP addresses in the internal zone and are not hosting any well-known shared services like LDAP, NTP, and so on. Shared Physical: It includes the destination data center internal Physical IP addresses hosting well-known shared services such as LDAP, NTP, and so on to which the VMs or IP addresses in the internal zone are talking. Internet: It includes the source or the destination data center external VMs or the physical IP addresses that are talking to the VMs or IP addresses in the internal zone. Note Data center Internal implies RFC 1918 designated IPs by default + any overrides defined in E-W settings. Data center External implies non-rfc 1918 designated IPs by default + any overrides defined in N-S settings. This chapter includes the following topics: Application-Centric Micro-Segmentation Exporting Rules View Blocked and Protected Flows Flow Support for Physical Servers Application-Centric Micro-Segmentation An application is a collection of tiers. Each tier in an application is a collection of VMs based on the userdefined filter criteria. The applications allow you to create a hierarchical group of VMs and visualize traffic/flows between the tiers of the same application. The traffic/flows can be visualized between applications. To add an application: Procedure 1 In the Search box, type application, and press Enter. VMware, Inc. 40
41 2 Click Add Application. 3 On the Add Application page, in the Application Name box, type a name for the application, which you want to create. 4 In the Tier section, type a name of the tier, which you want to create under Application (parent level). You can create a tier for VMs or physical machines as per requirements. 5 In the Virtual Machines/IP Addresses box, select the appropriate VMs by any of the following conditions: VM PROPERTIES a b c d VM Names - Name of the VMs, which you want to group in the tier you are creating IP Addresses - IP Addresses of the VMs or physical machines, which you want to group in the tier you are creating. The count of the IP addresses is shown at the right side of the text box. VMs with Service Ports - Service ports of the VMs, which you want to group in the tier you are creating Custom Search - It is an open search VMs IN a b c d e Application - Select this option if the VMs are located in any previously created application Cluster - Select this option if the VMs are located in any cluster Folders - Select this option if the VMs are located in any folder VXLAN - Select this option if the VMs are located in any VXLAN VLAN - Select this option if the VMs are located in any VLAN Note For entering multiple values, set apart the individual values by comma. Optional: In case, you want to create multiple tiers under one application, click Add Tier. 6 Select Analyze Flows to view the flows before you finally add the application. You are able to see the tiers based on VMs or physical addresses accordingly. 7 Click Save to create the application. Plan Applications While creating an application, you can select Custom IP Search from the drop-down list to create tiers for the physical IPs based on the enriched fields. For more information on the enriched fields, refer Enriching Flows and IP Endpoints. The enriched DNS, Subnet, VLAN information can be used in specifying tiers as follows : Web Query: IP Endpoint where Subnet Network = ' /24' VMware, Inc. 41

42 App Query: IP Endpoint where Dns Domain = app.arkin.net DB Query: IP Endpoint where L2 Network = 'vlan-102' Common Services Query: IP Endpoint where Dns Domain = svc.arkin.net Exporting Rules You can export rules as XML for the entire topology. You can find this option in the Micro-Segmentation Planning page as follows: You can also export rules related to the underlying security groups belonging to multiple NSX managers. To import these rules in NSX, you can use scripts. Contact vrealize Network Insight support to get a copy of the sample script. View Blocked and Protected Flows The NSX-IPFIX integration enables the visibility of the blocked and protected flows in the system. The basic filters in the Micro-Segmentation Planning page are as follows: All Allowed Flows: This option is selected by default. To see all the flows for which the action in the firewall rules is set to Alllowed, select this option. Dropped Flows: This option helps to detect the dropped flows and planning the security in a better way. All Protected Flows: This option helps to detect all the flows which have a rule other than of the type any(source) any(dest) any(port) allow associated with it. Such flows are known as protected flows. All Unprotected Flows: This option helps to detect all the flows that have the default rules of the type any(source) any(dest) any(port) allow. Such flows are known as unprotected flows. VMware, Inc. 42

43 The firewall rules are visible only for the allowed and unprotected flows. For example, if you are in the planning phase and you want to see the allowed flows in the system, perform the following steps: 1 On the Micro-Segmentation Planning page, for a particular group, select All Allowed Flows from the drop-down menu. 2 Click the dropped flows in the topology diagram to see the corresponding recommended firewall rules. 3 Implement those firewall rules by exporting them into NSX manager. Flow Support for Physical Servers vrealize Network Insight supports the device that sends the NetFlow data of versions v5, v7, and v9. If the DNS Mapping and Subnet-VLAN mapping information is provided, vrealize Network Insight can enrich the NetFlow data with DNS Domains, DNS Host Names, Subnets, and Layer 2 networks. This feature is available for the Enterprise License users only. To configure NetFlow in vrealize Network Insight, perform the following steps: 1 Adding a NetFlow Collector 2 Configuring a NetFlow Collector in a Physical Device 3 Physical IP and DNS Mapping 4 Physical Subnets and VLANs Configuring a NetFlow Collector in a Physical Device To send the NetFlow information to the vrealize Network Insight NetFlow collector, configure the physical device manually. Here are the steps for the configuration in most of the physical devices: 1 Create a flow record. VMware, Inc. 43
44 The required fields for a flow record are as follows: Mark the following fields as Match. ipv4 protocol ipv4 source address ipv4 destination address transport source-port transport destination-port interface input Mark the following fields as Collect. direction counter bytes counter packets timestamp sys-uptime first timestamp sys-uptime last Mark the following field as Match or Collect. If not, skip it. transport tcp flags 2 Create a flow exporter. Provide vrealize Network Insight NetFlow Proxy IP and Port Configure the flow cache as follows: Active timeout: 30 seconds Inactive timeout: 60 seconds 4 Create the flow monitor using the created flow record and flow exporter. 5 Configure the monitor on each interface. Prerequisites The sample steps to configure the physical devices are provided in the following sections: Cisco 4500 Cisco Nexus 1000v Cisco Nexus 9000 Note The steps may vary from version to version and device to device. VMware, Inc. 44
45 Cisco To create the flow record configure terminal flow record netflow-original match ipv4 protocol match ipv4 source address match ipv4 destination address match transport source-port match transport destination-port match interface input collect transport tcp flags collect counter bytes collect counter packets collect timestamp sys-uptime first collect timestamp sys-uptime last End 2 To create the flow exporter configure terminal flow exporter e1 destination <PROXY_IP> transport udp 2055 end 3 To create the flow monitor configure terminal flow monitor m1 record netflow-original exporter e1 end 4 To configure the timeouts configure terminal cache timeout inactive 30 VMware, Inc. 45
46 cache timeout active 60 end 5 To configure the flow monitor for each interface on the ingress mode and the egress mode or at least the ingress mode configure terminal interface <INTERFACE_NAME> ip flow monitor m1 unicast input end Cisco Nexus 1000v 1 To configure timeouts configure terminal Active timeout 60 Inactive timeout 15 end 2 To configure the exporter configure terminal flow exporter <EXPORTER_NAME> destination <PROXY_IP> transport udp 2055 source <VSM_IP_OR_SUBNET> end 3 To configure the flow monitor for each interface: configure terminal flow monitor <MONITOR_NAME> record netflow-original exporter <EXPORTER_NAME> end 4 To configure the flow monitor for each interface on the ingress mode and the egress mode or at least the ingress mode configure terminal port-profile type vethernet <IF_NAME> VMware, Inc. 46
47 ip flow monitor <MONITOR_NAME> input ip flow monitor <MONITOR_NAME> output.. end Cisco Nexus 9000 Here are some of the sample device commands for Cisco Nexus 9000: 1 To enable the NetFlow feature configure terminal feature netflow end 2 To create flow record configure terminal flow record vrni-record match ipv4 protocol match ipv4 source address match ipv4 destination address match transport source-port match transport destination-port match interface input collect transport tcp flags collect counter bytes collect counter packets collect timestamp sys-uptime first collect timestamp sys-uptime last End 3 To create flow exporter configure terminal flow exporter vrni-exporter destination <PROXY_IP> transport udp 2055 VMware, Inc. 47
48 version 9 source <INTERFACE_NAME> end 4 To create the flow monitor for each interface configure terminal flow monitor vrni-monitor record vrni-record exporter vrni-exporter end 5 To configure timeouts configure terminal cache timeout inactive 30 cache timeout active 60 end 6 To configure the flow monitor for each interface on the ingress mode and the egress mode or at least the ingress mode configure terminal interface <INTERFACE_NAME> ip flow monitor vrni-monitor input end Enriching Flows and IP Endpoints You can import the DNS mapping and the subnet-vlan mapping information through the UI. The flow information is enriched with the following types of information based on the import of the DNS data and the specification of subnet-vlan mappings. Source DNS Domain Source DNS Host Name Destination DNS Domain Destination DNS Host Name Source L2 Network Source Subnet network Destination L2 Network VMware, Inc. 48
49 Destination Subnet network The IP Endpoint information is enriched with the following types of information based on the import of the DNS data and the specification of subnet-vlan mappings. DNS Domain DNS Host Name FQDN L2 Network Subnet network For more information on enriching flows through the DNS information, refer Physical IP and DNS Mapping. For more information on enriching flows through the Subnet-VLAN mapping, refer Physical Subnets and VLANs. Note The DNS mapping and subnet information are enhanced only for the physical IPs. No subnet or DNS mapping information is associated with any virtual NIC. The information is enriched only for flows that have been seen by vrni after this information has been imported. Search for Physical to Physical Flows You can search for the physical to physical flows based on the following attributes: Source DNS Host Destination DNS Host Source DNS Domain Destination DNS Domain Source Subnet Network Destination Subnet Network You can search for Physical-Physical flows based on the following attributes. A few examples of flow search query using the enriched DNS and Subnet-VLAN mapping information are as follows: bytes,dns Domain,Dns Host,l2 network of flows where flow type = 'Physical-Physical' bytes,dns Domain,Dns Host,l2 network of flows where flow type = 'Source is VM' and flow type = 'Destination is Physical' bytes,dns Domain,Dns Host,l2 network of flows where flow type = 'Source is Internet' and flow type = 'Destination is Physical' VMware, Inc. 49
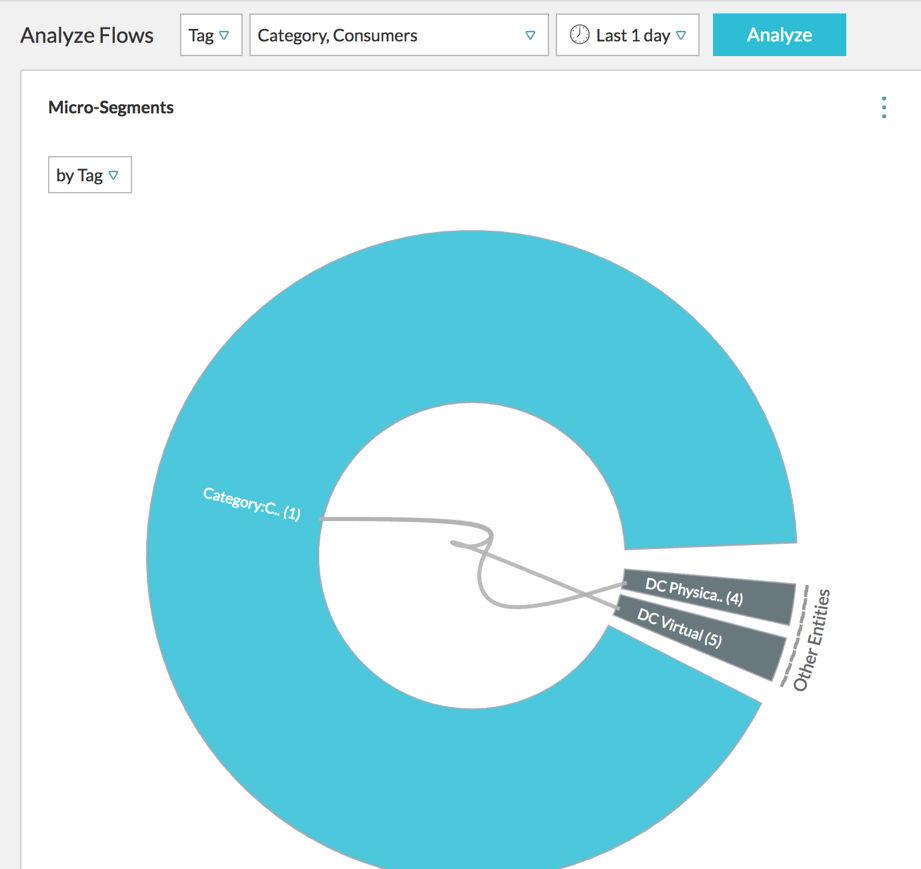
50 vcenter Tags 10 vrealize Network Insight provides vcenter tags for search and planning. You can perform a search of VMs based on the vcenter tags and custom attributes. For example, you can use the following query for search by using tags: vm where tag = {keyname}:{value} Every tag belongs to a category. In the above example, the keyname is the category to which the tag belongs and value is the name of the tag. You can also provide an alternate name to a VM by using vcenter tags or custom attributes by using the name key. This alternate name is shown as the other names property. It is also possible to search and make path queries using the alternate name. For example, the following queries are supported: vm other-name-1 vm other-name-1" to vm other-name-2 In this example, other-name-1 and other-name-2 are custom attributes with the name key or tags belonging to the name category. You can also analyze the flows in the network by using the vcenter tags as shown in the figure. VMware, Inc. 50


51 To use the vcenter tags, select the Tag option from the Analyze Flows drop-down list. You can also select up to three tags at this level. After you select the tag, click Analyze. In Group by Criteria, Tag is selected. VMware, Inc. 51

52 VMware, Inc. 52
53 NSX-T 11 VMware NSX-T is designed to address the emerging application frameworks and architectures that have heterogeneous endpoints and technology stacks. In addition to vsphere, these environments may also include other hypervisors, containers, bare metal, and public clouds. vrealize Network Insight supports NSX-T deployments where the VMs are managed by vcenter. Considerations vrealize Network Insight supports NSGroups, NSX-T Firewall Rules, IPSets, NSX-T Logical Ports, and NSX-T Logical Switches. vrealize Network Insight does not support displaying information about routers, edge nodes, underlay and overlay paths of VMs.. Only NSX-T 2.0 is supported. vrealize Network Insight does not support the KVM hosts as well as the individual ESXi servers added to NSX-T. vrealize Network Insight supports both NSX-V and NSX-T deployments. When you use NSX in your queries, the results include both NSX-V and NSX-T entities. NSX Manager lists both NSX-V and NSX-T Managers. NSX Security Groups list both NSX-T and NSX-V security groups. If NSX-V or NSX-T is used instead of NSX, then only those entities are displayed. The same logic applies to the entities such as firewall rules, IPSets, and logical switches. To Add an NSX-T Manager as a Data Source Here are the prerequisites for adding an NSX-T Manager as a data source: Before adding NSX - T, add at least one vcenter which is associated with NSX - T to vrealize Network Insight. It is recommended that you add all the vcenters associated with NSX-T as data sources in vrealize Network Insight. To add an NSX-T Manager: 1 On the Accounts and Data Source page under Settings, click Add Source. 2 Under VMware Manger in the Select an Account or Data Type page, select VMware NSX-T Manager. VMware, Inc. 53
54 3 Provide the user credentials. The user should be a local user with the audit level permissions. Examples for Queries Here are some examples for queries related to NSX-T: Table Queries NSX-T Manager where VC Manager= NSX-T Logical Switch NSX-T Logical Ports where NSX-T Logical Switch = 'DB-Switch' VMs where NSX-T Security Group = 'Application-Group' Or VMs where NSGroup = Application-Group NSX-T Firewall Rule where Action='ALLOW' NSX-T Firewall Rule where Destination Security Group = CRM- Group NSX-T Firewall Rule where Direct Destination Security Group = CRM-Group VMs where NSX-T Logical Port = App_Port-Id-1 Search Results NSX-T Manager where this particular VC Manager has been added as the compute manager Lists all the NSX-T Logical switches present in the particular instance of vrealize Network Insight Lists the NSX-T logical ports belonging to that particular NSX-T logical switch, DB-Switch. Lists all the VMs in that particular security group, Application- Group. Lists all the NSX-T Firewall Rules which have their action set as ALLOW. Lists the firewall rules where the CRM-Group is the Destination Security Group. The results include both Direct Destination Security Groups and Indirect Destination Security Groups. Lists the firewall rules where the CRM-Group is the Destination Security Group. The results include only the Direct Destination Security Groups. Lists all the VMs which have that particular NSX-T Logical Port. VMware, Inc. 54
55 Cross vcenter NSX 12 In a cross-vcenter NSX environment, you can have multiple vcenter Servers, each of which must be paired with its own NSX Manager. One NSX Manager is assigned the role of primary NSX Manager, and the others are assigned the role of secondary NSX Manager. The primary NSX Manager is used to deploy a universal controller cluster that provides the control plane for the cross-vcenter NSX environment. The secondary NSX Managers do not have their own controller clusters. The primary NSX Manager can create universal objects, such as universal logical switches. These objects are synchronized to the secondary NSX Managers by the NSX Universal Synchronization Service. You can view these objects from the secondary NSX Managers, but you cannot edit them there. You must use the primary NSX Manager to manage universal objects. The primary NSX Manager can be used to configure any of the secondary NSX Managers in the environment. The following Universal objects are supported: Universal LDR Universal Transport Zone Universal Logical Switch Universal Firewall Rule Universal Security Group Universal IPSets Universal Service Universal Service Groups Universal Segment Range VMware, Inc. 55

56 Collaboration Tools 13 All parts of the application are denoted as pins; fundamental units that can be saved and grouped to club data that you think can be useful together and to share them with other members of your team. You can pin a search query and also the pins that are available for an entity. To add a pin, click the Pin icon. All your saved pins are displayed in Pinboards section which can be invoked by clicking the Pinboard icon in the header. Pinboards Pinboards are how you group pins together. You can pin any widget from any page to make it easier to access various data. To create a pinboard: 1 Click Pinboards and select the pins that you want to add to the pinboard from the Saved Pins section. VMware, Inc. 56
57 2 Click Create New Pinboard. 3 Enter the name of the pinboard, add a note related to any information that you want to share with others, and enter the IDs or name of the users with whom you want to share the pinboard and click Create. 4 To add a pin to an existing pinboard, after selecting the pin, click Add beside an existing pinboard where you want to add the pin. To share the pinboard link: 1 Click Share on the rightmost side of the pinboard. 2 Click Copy to copy the link. You can share this link only with the users whom you have added in the "Share Pinboard with" list during the creation of the pinboard. To view the pinboard by using the time selector: You can also jump to a pinboard view on a particular date and time by using the time selector. 1 In the time selector just next to Jump, select Custom time or Current Time to view the flow of data for a particular pin. 2 Click Update. The flow of data for that particular pin can be seen for the given time. VMware, Inc. 57

58 Settings 14 The Settings page provides controls to manage data providers, users, and notifications. To go to the Settings page: 1 On the top-right hand corner in the Home page, click the Profile icon. 2 Click Settings. The Settings page appears as shown. You can configure the following on the Settings page: This chapter includes the following topics: Install and Support Accounts and Data Sources VMware, Inc. 58
 My Profile About Page Automatic Storage Expansion for Platform VM Install and Support The Install and Support page provides an overview of the")
59 Data Management IP Properties and Subnets Working with Events Search-based Notifications Event Notification Event Notifications Syslog Configuration User Management LDAP Configuring Mail Server Support for Simple Network Management Protocol (SNMP) My Profile About Page Automatic Storage Expansion for Platform VM Install and Support The Install and Support page provides an overview of the system as well as helps you to create cluster and add proxy VM to the existing vrealize Network Insight setup. Note The terms Proxy and Collector are used interchangeably in the documentation. To go to the Install and Support page: 1 On the top-right corner of Home page, click the Profile icon, and then click Settings. 2 In the Settings section, click Install and Support. To view the vrealize Network Insight system dashboard, click View Details next to Overview. VMware, Inc. 59
60 Health The Health indicator is available in the Overview section on the Install and Support page. The Health indicator turns red if any of the following malfunctioning events occur: If proxy stops collecting flow data If platform stops processing data due to some reason; for example, insufficient disk space If search indexer lags behind, resulting in outdated search result The overall health indicator displays the number of irregularities, with a Red light on. The individual irregularities are listed with their details, when the number of problems against overall health, is clicked on. In case of normal functioning, the health indicator shines a Green light. Support Tunnel The Support Tunnel option is available in the Overview section on the Install and Support page. The support tunnel allows the vrealize Network Insight engineering team to remotely connect to customer's platform and collector VMs on the SSL secured connection. You have to request the access to support tunnel when the vrni engineering team needs to access the setup for advanced troubleshooting or debugging. Note Ensure that the traffic to support2.ni.vmware.com on port 443 is allowed. Online Upgrade of Product The Update option is available in the Overview section on the Install and Support page. The Update option lets you know if the latest version of the product is available for an upgrade. A notification message appears in the product, and you can opt to upgrade to the latest version from the UI itself. To upgrade to the latest version: 1 In case a latest version is available, a message appears on the upper-right corner of the browser window. 2 Click View details in the notification. 3 You can view the new features, which are available in the new version. 4 Click Install now to start the upgrade. Alternatively, 1 If a newer version is available, the information is displayed in the Overview section at the Update option. 2 Click View Details, to view the new features, which are available in the new version. 3 Click Install now to start the upgrade. VMware, Inc. 60
61 Single-Click Offline Upgrade vrealize Network Insight supports the single-click offline upgrade of the product from Release 3.7 to the future releases such as 3.7->3.8, 3.7->3.9, and so on. Procedure 1 On the Install and Support page, under Software version, click Click here. 2 Ensure that you have saved the update package to your local disk so that you can upload it on this page. Click Browse to select the file and click Upload. 3 After the upload is complete, a dialog box with the basic upgrade instructions appears before the upgrade begins. To proceed further, click Install Now. 4 Once the upgrade process begins, a pop-up window appears. This pop-up window provides the status of each node. Note Ensure that all the nodes are online before beginning the upgrade. If any node is inactive before the upgrade begins, you will not be allowed to upload the upgrade bundle. Once the upgrade begins, if a node becomes inactive, the upgrade process hangs. The upgrade will not resume until the node becomes active again. Until the upload of the package happens, the user should take care that the session is not closed. If the session ends, the user has to restart the upload process. The Platform 1 becomes the upgrade server here. If Platform1 is offline, then no other node is upgraded. 5 Upon the completion of upgrade process, all platforms and the collectors nodes are upgraded. View Node Details VMware, Inc. 61
62 You can view the details of each node in a platform or a collector. Procedure 1 To view the details of a particular platform node, click its name that is listed under Platform VMs on the Install and Support Page. The NI Platform dashboard appears. 2 To view the details of a particular collector node, click its name that is listed under Collector (Proxy) VMs on the Install and Support page. The NI Collector dashboard appears. View the Capacity of Platform and Proxy Nodes vrealize Network Insight provides the approximate capacity and load information of a proxy node and a platform. This limits-based information helps you to prevent the performance and experience issues later. Understanding Capacity The capacity is defined as follows: Single platform with one or more proxy nodes: The capacity of a proxy node or the platform is the number of discovered VMs that it can handle without the degradation of performance. Cluster setup: The capacity of the platform in a cluster setup is the aggregation of all the capacities of all the platform nodes while the capacity of proxy nodes is considered at the level of an individual node. Accessing the Capacity Information The Utilization option on the Install and Support page provides the used capacity for a platform. The Utilization option under the Collector (Proxy) VMs on the Install and Support page provides the used capacity for each proxy node. Note When the number of discovered VMs from the data sources across the deployment exceed the capacity of either the platform or the proxy or both, the validation fails and you will not be allowed to add a vcenter/aws data source. To view the discovered VMs for a data source: 1 In the Accounts and Data Sources page, you can see the number of VMs that have been discovered for a particular data source which is already added and currently active. This column will have a value only if the data source is vcenter or AWS source. Note The discovered VM count includes Placeholder and Template VMs. So it can be different from the count of VMs in the product. VMware, Inc. 62
63 Creating Clusters You can create clusters from the Install and Support page. Prerequisites At least two additional platforms are required. The additional platform VMs should be deployed and powered on. To create cluster 1 Click Create Cluster for Platform VMs. 2 On the Create Cluster page, enter the following information: IP Address: Enter the IP address of the new platform that you want to add. Password: Enter the support user password of the platform VM. If you have not changed the password yet, then refer the Default Login Credentials section in vrealize Network Insight Installation Guide for the password. 3 To keep adding more platforms, click Add more and enter the IP address and the support user password. 4 Click Submit. Click Yes. 5 After creating a cluster, the user needs to log in to the product again. Note The create cluster option is enabled only when the platform is of large brick size. All platforms should be of large brick to create cluster. Note To expand clusters, refer the Expanding a Cluster section in the vrealize Network Insight Installation Guide. Expanding Clusters Once the cluster is created, you can expand the cluster by adding more platform nodes to it. To expand clusters: Procedure 1 On the Install and Support page, click Expand Cluster for Platform VMs. VMware, Inc. 63
64 2 The IP addresses of the VMs that are part of the cluster already are listed on the Expand Cluster page. To add one or more nodes to the existing cluster, provide the IP address of the node and the support user password. Note Currently, vrealize Network Insight supports 10 nodes in an existing cluster. Once the limit is reached, the Add more button is disabled. Ensure that all the new nodes are non-provisioned and are reachable through SSH. Ensure that you have taken a backup of the existing platform VMs before you go ahead with the cluster expansion. 3 Click Submit. The step-by-step progress is displayed. 4 Once the cluster expansion link is completed, a message indicating success is displayed. While the cluster expansion is in progress, the application cannot be used for any other operation. Creating Support Bundle In order to look into the logs for inspecting the details and identifying anomalies, bundles of support logs are created. To create support bundle: 1 In the Platform VMs or Proxy VMs table, in the Support Bundle column, click the Create Support Bundle icon. Note Only two support bundles can be present at one given time, so while creating a new one, if there are already two support bundles present, the older one is deleted. 2 Click Yes to confirm creation of a new support bundle. A new support bundle is created displaying data and time as download link. To initiate the download of support bundle, click the link. Migrating Data Sources If a proxy VM is down or deleted, you can add a new proxy VM and migrate data source from the old proxy VM to the new proxy VM. To migrate a data source: Procedure 1 In the Install and Support page, under the Collector (Proxy) VMs section, click the edit icon. If a proxy VM is down, you can see the error message that proxy VM is not available under the same section. VMware, Inc. 64
65 2 In the Edit Collector (Proxy) VM page, you can assign a nickname to the proxy VM. 3 The Edit Collector (Proxy) page lists all the data sources added to the proxy. To migrate a data source, click Migrate for a particular data source. 4 The Edit account or source page appears. Ensure that you fill the following information: Table Fields Collector (Proxy) VM IP Address Username Password Description Name of the new proxy VM to which the data source has to be migrated Pre-filled IP/FQDN address of data source Username for the data source Password for the data source 5 Click Validate. Click Submit. The data source is then deleted in the old proxy VM and is added to the new proxy VM. 6 Once the migration is successful, you will see the new proxy VM against the data source in the Enabled column in the Accounts and Data Sources page. Note If you are migrating vcenter to another proxy VM, then sure that you migrate the corresponding NSX Manager also to the same proxy VM. When you migrate NSX Manager to another proxy VM, the child data providers such as NSX Controller and NSX Edge are migrated as well to the new proxy VM. Accounts and Data Sources Data sources provide the application the ability to gather data from certain aspects of your data center. These range from your NSX installation to physical devices such as Cisco[TM] Chassis 4500 and Cisco[TM] N5K. For each added Data source, the following information can be viewed at a glance: All: Displays all the available data sources. With Problems: Displays the data sources where vrealize Network Insight has found a problem. With Recommendations: Displays auto generated recommendations from vrealize Network Insight for the data sources that require additional information. Disabled: Displays the data sources that have been disabled. For each data source, you can view the following details: VMware, Inc. 65
66 Table Properties Device Type (nickname) IP Address/FQDN Last Collection Discovered VMs Enabled Actions Description Displays name of the Data source. Displays IP address or FQDN details for the Data Source. Displays the last collection time on which the data is collected. Displays the number of VMs that have been discovered for that data source. Indicates if the data source is enabled or not. Displays options to edit and delete data source. Note The Discovered VMs column is populated only if the data source is vcenter or AWS source. Adding a Data Source To add a Data Source 1 In the Settings page and click Accounts and Data Sources. 2 Click Add new source. 3 Select an account or a source type. 4 Provide the following information: Table Properties Collector(Proxy) VM IP Address/FQDN Username Password Description Select the proxy VM from the drop-down menu. Enter the IP Address/FQDN details Enter the user name you want to use for a particular data source Enter the password 5 After entering the information in the text boxes, click Validate. When you are adding a VMware vcenter or an AWS data source, if the number of VMs discovered for a specified data source exceeds the capacity of the platform or a proxy node or both, the validation fails. You will not be allowed to add a data source until you increase the brick size of the platform or create a cluster. The specified capacity for each brick size with and without flows is as follows: Table Brick Size VMs State of Flows Large 6k Enabled Large 10k Disabled VMware, Inc. 66
67 Table (Continued) Brick Size VMs State of Flows Medium 3k Enabled Medium 6k Disabled If the validation is successful, you can add advanced data collection sources for the data source (not all data sources contain this feature). Following advanced data collection sources are available: For VMware vcenter, you can enable NetFlow (IPFIX). For more information on IPFIX, read the Enabling IPFIX configuration on VDS and DVPG section. For VMware NSX Manager, you can enable automatic NSX Edge Population using SSH to allow vrealize Network Insight to collect advanced data. However, for NSX Manager 6.2 and above, use NSX central CLI instead of ssh. You can select this option to allow vrealize Network Insight to collect data for NSX Edge directly from NSX Manager using the NSX Central CLI. This feature also requires NSX Manager credentials with System Admin privileges. Many data sources also use SNMP (Simple Network Management Protocol) for richer data collection. For such data sources, select the SNMP version and enter the community string to allow vrealize Network Insight to collect richer data from the data source. 6 Enter the required details in the text boxes for advanced data collection sources. 7 Enter Nickname and Notes (if any) for the data source and click Submit to add the data source to the environment. Adding an AWS Data Source To add an AWS data source: Prerequisites The custom policy of the AWS account user to add AWS data source is as follows: { "Version": " ", "Statement": [ { "Effect": "Allow", "Action": [ "iam:listaccountaliases" ], "Resource": [ "*" ] }, { "Effect": "Allow", VMware, Inc. 67
68 } ] }, { } "Action": [ "ec2:describe*" ], "Resource": "*" "Action": [ "logs:describe*", "logs:get*", "logs:testmetricfilter", "logs:filterlogevents" ], "Effect": "Allow", "Resource": "*" There are a list of URLs which should be accessible from the Collector VM to access AWS. The AWS can be deployed in multiple regions. There are separate URLs associated with different regions. If you are unaware of the region or the service, have a wildcard entry for the URL such as *.amazonaws.com. Note The wildcard entry does not work for the China region. But if you want to give fine-grained access to separate URLs, there are 4 services based on the region: Regions except GovCloud and China ec2.<region>.amazonaws.com logs.<region>.amazonaws.com sts.<region>.amazonaws.com iam.amazonaws.com GovCloud Region ec2.us-gov-west-1.amazonaws.com logs.us-gov-west-1.amazonaws.com sts.us-gov-west-1.amazonaws.com iam.us-gov.amazonaws.com China (Beijing) Region ec2.cn-north-1.amazonaws.con.cn logs.cn-north-1.amazonaws.com.cn sts.cn-north-1.amazonaws.com.cn iam.cn-north-1.amazonaws.com.cn VMware, Inc. 68
69 You can use any of the following values for REGION based on the AWS region: Region Name US East (Ohio) US East (N. Virginia) US West (N. California) US West (Oregon) Asia Pacific (Mumbai) Asia Pacific (Seoul) Asia Pacific (Singapore) Asia Pacific (Sydney) Asia Pacific (Tokyo) Canada (Central) EU (Frankfurt) EU (Ireland) EU (London) South America (São Paulo) Gov Cloud China (Beijing) Region us-east-2 us-east-1 us-west-1 us-west-2 ap-south-1 ap-northeast-2 ap-southeast-1 ap-southeast-2 ap-northeast-1 ca-central-1 eu-central-1 eu-west-1 eu-west-2 sa-east-1 us-gov-west-1 cn-north-1 Procedure 1 Select Account/Data Sources. Click Add Source. 2 Under Public Clouds, click Amazon Web Services. 3 Add your AWS account by using Amazon Access Key ID and corresponding Secret Access Key. Note Your Amazon Access Key ID is a 20-digit string with a corresponding Secret Access Key. For more details, see Note To add AWS Gov Cloud Region as a data source, create an AWS IAM user by using the recommended policy in the AWS account with access to the Gov Cloud region. Use the Access key and the Secret key for the newly created account to add the data source to vrealize Network Insight. This process might take minutes for adding and displaying your account data. 4 After you have validated your AWS account, you can select Enable Flows data collection to get deeper insights. Adding an Infoblox DNS Data Source VMware, Inc. 69
70 Infoblox DNS offers an advanced solution to manage and control DNS. It uses Infoblox Grid to ensure that the DNS is highly available throughout the network. vrealize Network Insight allows the users to add Infoblox Grid as a DNS data provider. The DNS data from Infoblox is used only for enriching the flows where either the source or the destination IP addresses are associated with the physical devices. This feature is available only for the enterprise license. The Infoblox DNS data co-exists with the DNS data that is imported by using CSV. If you configure an Infoblox DNS data source on a proxy server, you can configure other data sources also on the same proxy server. You do not need a dedicated proxy server for Infoblox. Considerations vrealize Network Insight supports only single-grid mode for Infoblox in the current release. Only A Records are supported in the current release. Shared A Records are not supported currently. The DNS enrichment is supported only for the IP addresses that are marked as physical in the current release. If there are multiple FQDNs for a single physical IP address, all FQDNs are returned. Procedure 1 On the Settings page, click Accounts and Data Sources. 2 Click Add new source. 3 Click Infoblox under DNS. 4 Provide the following information: Table Properties Collector(Proxy) VM IP Address/FQDN Username Password Description Select the proxy VM from the drop-down menu. Enter the IP Address/FQDN of Infoblox Grid Master. Enter the user name you want to use for a particular data source. Enter the password. 5 Click Validate. Note Ensure that you have the API Privilege to access the Infloblox APIs. 6 Enter Nickname and Notes (if any) for the data source and click Submit to add the Infoblox DNS data source to the environment. Enriching Flows with the Infoblox DNS Data vrealize Network Insight supports two sources of DNS information: Imported CSV file VMware, Inc. 70
71 Infoblox DNS Note If there is a conflict between Infoblox DNS and the CSV file, the information from Infoblox DNS takes precedence. You can use various search queries to find out more about the source of DNS entries in a flow. Table Keyword Sample Search Query Description DNS Provider DNS Provider Source DNS Provider Destination DNS Provider Flows where DNS Provider='Infoblox' Flows where DNS Provider='CSV' Flows where Source DNS Provider='Infoblox' Flows where Destination DNS provider='infoblox' Provides the list of flows in which the DNS data is obtained from Infoblox Provides the list of flows in which the DNS data is obtained from CSV Provides the list of flows in which the DNS provider for the source IP address is Infoblox Provides the list of flows in which the DNS provider for the destination IP address is Infoblox Enabling IPFIX Configuration IPFIX is an IETF protocol for exporting flow information. A flow is defined as a set of packets transmitted in a specific timeslot, and sharing the same 5-tuple values - source IP address, source port, destination IP address, destination port, and protocol. The flow information may include properties such as timestamps, packets/bytes count, Input/Output interfaces, TCP Flags, VXLAN ID, Encapsulated flow information, and so on. IPFIX Configuration on VDS and DVPG A VDS in vsphere environment can be configured to export flow information using IPFIX. Flow monitoring has to be enabled on all the port groups attached to the VDS. If packets arrive on port X of a VDS and exit from port Y, a corresponding flow record is emitted if flow monitoring is enabled on port Y. To analyze the complete information of any session, the IPFIX data about packets in both the directions is required. Refer the following diagram where VM-A is connected to DVPG-A and is talking to VM-C. Here DVPG-A will only provide data about the C A packets, and DVPG-Uplink will provide data about A C packets. To get the complete information of A's traffic, IPFIX should be enabled on DVPG-A, DVPGuplink. VMware, Inc. 71

72 vrealize Network Insight Proxy VM has built-in collector/receiver for IPFIX flow information. You can enable the IPFIX information collection in the vcenter Data Source settings at various levels of granularity. Enabling IPFIX Configuration on VDS and DVPG To enable IPFIX information at vcenter level: Procedure 1 Select Enable Netflow (IPFIX) when you are adding vcenter. 2 Select the VDS for which you want tot enable IPFIX from the list of available VDS in vcenter. 3 A notification icon is displayed for the VDS where one of the hosts has unsupported version of ESXi. If vrealize Network Insight has detected that IPFIX is already configured for a VDS with some other IP address apart from vrealize Network Insight Proxy VM, then it displays the Override button. Click Override to view the list of DVPGs under that VDS. VMware, Inc. 72
73 4 The list of available DVPGs for the selected VDS is displayed. All the DVPGs are selected by default. Turn Manual Selection on to select specific DVPGs for which you want to enable IPFIX. Select the desired DVPGs and click Submit. Note The DVPG with a notification icon denotes that it is the uplink DVPG and it has to be selected. VMware NSX IPFIX Configuration VMware NSX IPFIX provides network monitoring data similar to that provided by physical devices and gives administrators a clear view of virtual network conditions. VMware NSX virtualizes the network by allowing the network administrator the ability to decouple the network from physical hardware. This functionality makes it easy to grow and shrink the network as needed and making the network transparent to the applications traversing it. By using NSX IPFIX in a virtualized network, the network administrators gain visibility into the virtual overlay network. The VXLAN IPFIX reporting using Netflow is enabled on the host uplink. It provides visibility on the VTEP that is encapsulating the packet, and the details of the VM that generated the interhost traffic on an NSX Logical Switch (VXLAN). The distributed firewall implements stateful tracking of flows. As these tracked flows go through a set of state changes, IPFIX can be used to export data about the status of that flow. The tracked events include flow creation, flow denial, flow update, and flow teardown. The denied events are exported as syslogs. Enabling VMware NSX IPFIX To enable VMware NSX IPFIX in vrealize Network Insight: Prerequisites Ensure that you have the security administrator or enterprise administrator credentials. It is recommended that you enable VDS IPFIX on all the DVS and DVPGs from which NSX IP FIX data has to be collected. You can enable VDS IPFIXfrom the details page of the associated vcenter. Procedure u Select Enable IPFIX when adding or editing a NSX Manager data source. Adding a NetFlow Collector Procedure 1 In the Settings page, click Accounts and Data Sources. 2 Click Add Source. VMware, Inc. 73
74 3 In the Flows section, click NetFlow Collector. The Collector VM that is used for NetFlow is a dedicated collector. It cannot be used for any other data source. If any other data source is also added on the proxy server, it is not available as a NetFlow collector. Data Management In vrealize Network Insight, you can specify for how long do you want to retain your data. Note vrealize Network Insight supports data retention on an enterprise edition only. The data is divided into the following categories: Table Category Minimum Value Maximum Value Events 1 month 13 months Entities and Configuration Data 1 month 3 months Metrics 1 month 13 months Flows NA 1 month Miscellaneous Data NA 100 GB of additional disk space Note For all the categories, the minimum value is the default value. Different policies can be configured and controlled for each category. You can configure the policy as per your requirement. To configure data management: 1 On the top-right corner of the Home page, click and then click Settings. 2 In the Settings section, click Data Management. 3 When you log in for the first time, this page shows the default data. 4 Click the information icon on more information on how data occupies the disk. 5 Click Change Policy to change the data retention period for the various categories of data. Once you make the changes, the information is recorded in the database. 6 Click Submit. Note The retention period for low-resolution metrics is longer than the high-resolution metrics. IP Properties and Subnets VMware, Inc. 74
75 Physical IP and DNS Mapping To provide the information for the flows between physical devices, you can import the DNS mapping file. The supported formats for the DNS mapping file are the Bind and CSV file format. Ensure that you have placed these files in a single ZIP file. Note vrealize Network Insight does not support the password-protected ZIP files. Procedure 1 In the Settings page, click IP Properties and Subnets.. 2 Click Physical IP and DNS Mapping. 3 Click Upload and Replace to upload your DNS mapping file. After you select and upload the file, click Validate. The number of DNS records is displayed after the validation. The Upload and Replace operation removes any existing DNS mappings and replaces them with the the mappings that are being imported. The DNS Mapping file consists of the following three fields: Host Name IP Address Domain Name Physical Subnets and VLANs You can define a mapping between subnet and a VLAN. You can use this mapping for the following: Enriching the information about the IP entities that are learned from physical to physical flows by adding the source and destination subnets and the Layer2 networks associated with the flow. Planning the network topology based on the subnet and VLAN for physical addresses. Procedure 1 In the Settings page, click IP Properties and Subnets.. 2 Click Physical IP and DNS Mapping. 3 In the Settings page, under IP Properties and Subnets, click Physical Subnets and VLANs. This page lists all the subnets and the associated VLAN IDs. 4 Click Add to add the subnet and VLAN information. VMware, Inc. 75
76 5 After defining the mapping information, you can only edit the VLAN ID that is associated with the subnet. It is not possible to change to the subnet CIDR associated with the VLAN Id. To edit a subnet associated with the VLAN ID, delete the subnet to be edited and create a subnet VLAN mapping with the required values. When the subnet-vlan mapping information is updated, a new VLAN is created for the specified VLAN ID and the subnet information is associated with this VLAN. 6 To delete the subnet-vlan ID mapping, click the delete icon. Note All VLAN creation, updation, and deletion operations do not happen immediately after the subnet and VLAN mappings are created. It takes some time for the changes to be propagated and the corresponding VLAN being to be created or modified. East-West IPs The IPs that are within the range of RFC1918 standard are considered private IPs. The IPs that are outside the RFC1918 are treated as Internet IPs. However, users can specify their East-West IPs (datacenter public IPs) that they want to be treated as non-internet IPs while tagging flows and microsegmentation, even if these are outside the private IP address range as defined by RFC1918. To specify public IPs to be treated as non-internet IPs 1 On the top-right corner of Home page, click the Profile icon, and then click Settings. 2 In the Settings section, click East-West IPs. 3 In the IP Addresses box, enter specific IPs, or IP ranges, or subnets, which are to be treated as noninternet IPs. 4 Click Save. The IP Addresses Saved confirmation message is displayed upon successful saving. North-South IPs The IPs that are in the RFC1918 space are categorized as North-South IPs. The users can specify their North-South IPs while tagging flows and micro-segmentation. To specify North-South IPs: 1 On the top-right corner of Home page, click the Profile icon, and then click Settings. 2 In the Settings section, click North-South IPs. 3 In the IP Addresses box, enter specific IPs, or IP ranges, or subnets. 4 Click Save. The IP Addresses Saved confirmation message is displayed upon successful saving. Working with Events On the Settings page, click Events to view the various types of events: System Events VMware, Inc. 76
77 User Defined Events System Health Events Working with System Events The event is defined either by the system or the user. The system events are predefined events. The system events are listed in the System Events page under Settings. The following fields are specified for each event. You can filter the events based on these fields. Table Field Event Severity Description This field specifies the name of the event. This field specifies the severity of the event. You can set it to the following values: Critical Moderate Warning Info Type Entities Notifications Enabled This field specifies if the event denotes a problem or a change. This field specifies that the event is configured to either include or exclude entities for event generation. By default, the value is All. This field specifies the types of notifications that are sent. The notifications can be sent by or SNMP trap or both. This option is selected if the event is enabled. When you hover the mouse on each event, you can see More Information. By clicking this option, you can see the description, event tags, and entity type for that event. You can perform the following tasks on the system events: Edit an event Perform bulk edit Disable an event for a particular entity Edit System Event To edit an event: 1 Click the edit icon after the Enabled column for a particular event. 2 You can add or remove event tags if required. 3 You can change the severity. 4 Check Include/Exclude entities if you want the event to be enabled or disabled for selected entities. VMware, Inc. 77
78 5 To create inclusion rules: a b Select Inclusion List. Specify the entities which you want to include for the event under Conditions. 6 To create exclusion rules: a b Select Exclusion List. Specify the entities which you want to exclude for the event under Conditions. Note You can create multiple rules in both inclusion and exclusion lists. When you select NSX Manager, you can add exceptions in both the lists. You can define exception if you want the inclusion or the exclusion rule to hold exception for a particular entity. You can also specify Custom Search by writing your own query to include or exclude entities. 7 Select Enable Notifications if you want to configure when the notifications have to be sent. Specify the address and the frequency at which you would like to receive the s. Prerequisites Perform a Bulk Edit on an Event 1 In the System Events page, when you select multiple events, the options Enable, Disable, and Edit appear above the list. 2 Click Edit. 3 In the Edit page, you have the following options: Override existing values: In this option, only the fields that you edit will get overwritten. Add to existing: In this option, you can add to the existing values such as addresses and event tags. 4 Click Submit. Disable an Event 1 You can select an event in the Open Problems widget in the Homepage. You can also enter Problems in the search bar and select an event from the list. 2 Select a particular event and click Archive. 3 Select Disable all events of this type in future for and select an entity or all entities. 4 Click Save. Note The changes made in severity, tags, or inclusion/exclusion rules will reflect for the future events. The existing events continue to show the old configuration. VMware, Inc. 78
79 Working with User-Defined Events The user-defined events are based on search. All the user-defined events are listed on the User-defined Events page under Settings. The following fields are specified for each event. Table Field Name (Search Criteria) Severity Description This field specifies the name of the event and the search criteria for the event. This field specifies the severity of the alert. You can set it to the following values: Critical Moderate Warning Info Type Notify when Created By Enabled This field specifies if the event denotes a problem or a change. This field specifies when the notification has to be sent. This field specifies who created the event. This option is selected if the event is enabled. You can edit or delete the event. While editing it, you can specify the address and the frequency of the notification. Working with Platform Health Events The Platform Health Events page is your one-stop page to view all the events that provide details on the overall health of the system. These events might have occurred on a datasource or a node in the infrastructure. You can also view these events through search. Table Field Event Severity Type Notifications Description This field specifies the name of the event. This field specifies the severity of the event. You cannot change the severity of the event. This field specifies if the event denotes a problem or a change. This field specifies the types of notifications that are sent. The notifications can be sent by or SNMP trap or both. VMware, Inc. 79
80 Search-based Notifications The search-based notifications can be categorized as follows: System-based notification User-defined notification System-based notification parameters are predefined and upon activating notification alert, notification in the form of mails are sent. User-defined notifications are set by users, based on their requirements. You can create notifications based on your search query. After you run a search, on the Results page, the Create notification option is displayed. For each search, you can: Select the condition when you want to receive the notifications. Define how frequently you want to receive the notifications. Enter the recipients for each notification (by default, your ID is present in the receiver's list; you can also add multiple IDs). For a user-defined search: It is mandatory for you to assign a name to the search-based notification. It is mandatory to select the severity of a search-based event that is marked as a problem. The user-defined events are uniquely identified by the search criteria. You can specify the notification frequency as Immediately or As a daily digest. You can manage your notifications from the Settings > Search-based Notifications page. On the Search-based Notifications page, you can view the existing notifications, edit them, activate or deactivate them, and also delete unwanted notifications. Event Notification The notifications are sent in the form of s. To set up notification, users have to first configure the mail server. To know how to configure mail server, see Configuring mail server. Specifying Notification Events for s to be sent Users can specify events for which mail notifications are to be sent. To specify events 1 On the Settings page, click Search-based Notifications, or simply search for any information using the Search box. 2 On the Search-based Notifications page, click the Create Notification icon. A notification dialog box is displayed. 3 In the Receive notification when box, select the event on the occurrence of which notifications are to be sent. VMware, Inc. 80
81 4 In the Notify box, select the frequency at which the notifications are to be sent. 5 If the event is undesirable, select the Mark it as a problem check box. 6 Enter the addresses to which the notifications are to be sent, and then click Save. Note To verify whether the notification mail is correctly set up, click Send test . Event Notifications vrealize Network Insight contains a list of predefined system events (system problems and system changes) for which you can receive automated notifications every four hours. You can view the list of notifications on the Settings > System Notifications page. Archiving Problems Archiving a Problem 1 Click the Show All link (if there is more than one instance of an event) to display all instances of the event. 2 Hover on the instance of the event that you want to archive to display a set of icons, and then click the Archive icon. 3 In the Event specific dialog box a b Select This event from the You are about to archive list, if you want to archive only this event. Select All events of this type from the You are about to archive list, if you want to archive all events of the same type in the system. 4 Click Save. Viewing all archived events 1 On the Home page, type events in Search box and press Enter. A list of events is displayed. 2 On the left hand pane, in the Archived facet, select True checkbox (highlighted in the screenshot below). You can view all archived events here. To restore an archived event 1 On the Archived event, click the Archived icon. (See the preceding section on To view an archived event to know how to go to the Archived events page). 2 In the Event specific dialog box a Select This event from the You are about to restore from archive list, if you want to restore only this event. VMware, Inc. 81
82 b c Select All events of this type from the You are about to restore from archive list, if you want to restore all similar type of events. Click Save to complete restoring. Disabling Events Users can selectively disable events and prevent notifications from being sent in future. To disable event notification Method 1 1 On the event, click the Show All link (if there is more than one instance of an event) to display all instances of the event. 2 Hover on the instance of the event, whose notification you want to disable. This displays a set of icons, click the Archive icon. 3 In the Event specific dialog box, select the Disable all events of this type in future checkbox, and then click Save. Method 2 1 On the top-right corner of Home page, click the Profile icon, and then click Settings. 2 In the Settings section, click Event Notifications to see a list of all enabled and disabled events. 3 On the enabled event that you want to disable, in the Enabled column, click the left-side space of the respective slider. 4 In the Confirm Action dialog box, click Yes. Configuring Event Notification Service Users can enable customer notifications for different events To set notification services 1 On Settings, go to Event Notification, and click the (edit) icon corresponding to the problem, for which you want to enable notifications and SNMP. 2 In the Edit System Notification dialog box, enter the address to which you want the notification to be sent. In the Frequency box, select the time frequency at which you want to receive notifications. 3 Select the Enable SNMP trap for this event checkbox to set SNMP notifications. 4 Click Save. 5 Once successfully enabled, the respective mail and SNMP icons appear, as highlighted in the screenshot below. VMware, Inc. 82
83 Syslog Configuration You can configure remote syslog servers for vrealize Network Insight by using the Syslog Configuration page. While every proxy server can potentially have a different remote syslog server, all the platform servers in a cluster use the same remote syslog server. In the current release, the vrealize Network Insight problem events and platform/proxy server syslogs are sent to the remote syslog server. Currently, vrealize Network Insight supports only UDP for communication between vrealize Network Insight servers and remote syslog servers. So ensure that your remote syslog servers are configured to accept syslog traffic over UDP. To configure syslogs: 1 In the Settings page, click Syslog Configuration. The Syslog Configuration page has the configured syslog servers and their mappings to the virtual appliances listed. If you are accessing this page the first time, then the syslog is disabled by default and the list of servers on this page does not appear. 2 To add a syslog server: a b c d e Click Add Syslog Server. Enter IP Address, nickname, and port number of the server. The standard port number for UDP is 514. To test the configuration, click Send Test Log. Click Submit. If it is the first server that you have added, then enable syslog at the top of the page. 3 To map the server to platforms and proxies: a b c d Click Edit Mapping. Select the syslog server for All Platforms and Proxy servers. If you do not want to enable syslog on any proxy server or on the platform, select the No server option. Click Submit. Note After you make the changes, it might take a few minutes for them to be effective. User Management The admin user can add new users and configure memberships and other settings of existing users. The users with membership role of administrator only can view the User Management tab. VMware, Inc. 83
84 Add New User 1 In the Settings page, click Create new user, and provide the required information in the form. The form has the following text boxes: Table Properties Name (Login ID) Role Password Re-enter new password Description Enter the name of the user. Enter your or login ID if any. Select the role from drop-down list. Enter the password. Re-enter the password for confirmation. 2 Click Add User to save the user information. Assign Administrator Role You can assign an administrator role to any LDAP user. Even if that particular user is not logged in, you can still assign the administrator role to that user. To assign the administrator role: 1 In the Settings page, click User Management. 2 Click the LDAP Users tab. 3 Click Assign Admin Role. 4 Provide the login ID of the user to whom you want to assign the administrator role. 5 Click Add User. 6 Once you add the user, you can see the login ID in the LDAP Users tab. 7 To change the role, click the edit icon next to the login ID in the LDAP Users tab. LDAP vrealize Network Insight supports the following two types of users: User created on vrealize Network Insight Platform VM LDAP users To allow the LDAP users log into vrealize Network Insight, configure the LDAP service in the vrealize Network Insight Platform as follows: VMware, Inc. 84
85 To Enable LDAP-Based User Authentication 1 On the Settings page, click LDAP. 2 Click Configure. 3 On the Configure LDAP page, type the appropriate domain, LDAP Host URL, and LDAP credentials in the respective boxes. See the following table for individual field descriptions. Table Field Domain LDAP Host URLs Username Password Description This is typically the last part of the user address after the '@' sign. Example: For a user logging in as johndoe@example.com, this field is example.com You can specify multiple LDAP Host URLs separated by commas. User with the necessary rights to log in using the settings provided. Password of the user. You can configure a group and provide a role to the members of that group. To enable this functionality, select Group based access control. a UnderBase DN, type the Base DN, the point from which the server starts searching for users. b Under Group DN, add groups. c d For each group, select the role of the user as member or administrator from the drop-down menu. If you select the administrator role for a particular group, then all the members of that group have the administrator privilege. Similarly, if you select the member role for a particular group, then all the members of that group have the member privilege. If this option is not selected, then the group setting is used to assign the privileges. But other valid LDAP users who don't belong to the groups that you have added can log in to the product. Click Add more to add groups in the inclusion list. To allow access to the users only from the LDAP groups (direct or inherited membership) that you have added, select the Restrict access to members of the above groups only check box. To 4 Click Submit to configure LDAP. After the LDAP configuration is successful, a new drop-down menu is available on the login screen where users can select whether they want to log in locally or using their LDAP credentials. The LDAP credentials are not saved anywhere. Considerations about Groups and Inheritance For the groups that you have added under Group DN, their child groups also can log in using the LDAP credentials. VMware, Inc. 85
86 Inheritance is not considered for the role assignment. For example, if a user has to be an administrator, the direct group to which the user belongs should be assigned the administrator role. The user belonging to the child group might not have the administrator role. Suppose that you have assigned the administrator role to a group and you want to exclude a particular user in that group from the administrator role, perform the following steps: a b c d e On the Settings page, click User Management. Under the LDAP Users tab, you can see the assigned role of that particular user and also that the role has been inherited from the group. Click the edit icon. Under Role, select Member from the drop-down menu for that user. In this way, you assign a role directly to the user. Click Save Changes. Enter your password to confirm. Click Authorize. Suppose that you want a user to inherit the role from the group to which the user belongs, then perform the following steps: a b c d On the Settings page, click User Management. Under the LDAP Users tab, you can see the assigned role of that particular user and also that the role has been directly assigned to the user. Click the delete icon to delete that LDAP user. When that particular user logs in, the user inherits the role from the parent group by default. While a user is logged in, if someone changes the role of the group to which the user belongs, the new role comes into effect only after the user logs out. Suppose that there are some LDAP users who are logged in before an upgrade. After an upgrade, the LDAP users have direct roles and do not inherit from the group. Suppose that a user belongs to multiple groups. For example, a user belongs to Group A, Group, B, and Group C. If Group A is assigned the administrator role, and Group B and Group C are assigned the member role, then the user inherits the administrator role. Configuring Mail Server To configure mail server 1 On the top-right corner of Home page, click the Profile icon, and then click Settings. 2 Click Mail Server. 3 Select the SMTP server checkbox. VMware, Inc. 86
87 4 Enter appropriate values in the boxes. Table Field Sender SMTP Hostname/IP Address Encryption Description This is the sender's address. This is the hostname or IP of the SMTP server. The following encryption options are available: None, TLS, and SSL. SMTP Port Number This is the Port number of SMTP server (default 25). Optionally, for additional security, select the Authentication checkbox, and enter the username and password. Note To verify whether the notification mail is correctly set up, click Send test . 5 Click Submit to complete the configuration. Support for Simple Network Management Protocol (SNMP) The product supports the following two versions of SNMP: 1 v2c 2 v3 Configuring SNMP service 1 On the top-right hand corner in the Home page, click the Profile icon, and then click Settings. 2 On the Settings page, click SNMP, and then click Configure SNMP Service. 3 On the Configure SNMP Service page, in the Version box, select SNMPv2c or SNMPv3 protocol. Note SNMPv2c protocol does not require authentication. SNMPv3 protocol supports authentication. 4 In the Destination IP Address/FQDN box, enter the IP address of the SNMP agent, or enter the Fully Qualified Domain Name (FQDN). 5 In the Destination Port box, enter If you select the SNMPv2c protocol, in the Community String box, enter Public. If you select the SNMPv3 protocol, in the Username box, enter the name of the user you created in the SNMP agent. For SNMPv3, additionally, Select the Use Authentication checkbox. VMware, Inc. 87
88 Select an authentication protocol, and then enter the password you had set for the particular user in the SNMP agent. Optionally, in the Privacy Protocol and Privacy Phrase boxes, select a privacy protocol and a privacy phrase respectively. To verify whether the configuration is correctly done, click Test SNMP trap, and then find whether the trap has been sent to the SNMP agent. 7 Click Submit. My Profile The logged-in user can change the password on this tab. Change your password here and save Changes. To change your password 1 Under Settings, click My Profile. The Change Password window opens. 2 On the My Profile page, fill in the following information and click Save. Table Properties Current password New password Re-enter password Description Enter your current password. Enter the new password. Re-enter the new password for confirmation. About Page This page displays the license details and the product version number that you are currently using. Add License vrealize Network Insight supports the addition of multiple licenses. To add a license: 1 In the About page, click Add License. 2 Provide the license key for the New License Key field 3 Click Validate. 4 Click Activate. 5 You can see the list of licenses in the page. 6 You can also delete the license by clicking the delete icon next to the Expiration column. If the license belongs to an Enterprise edition and if it is the last remaining Enterprise edition in the system, then ensure that you have deleted the AWS account before you delete the Enterprise license. VMware, Inc. 88
89 Change License In the event of expiry of evaluation license, when you log in to the product, a message appears stating that the license has expired and that you need to renew your license. Follow the steps below to change license. To change license: 1 Click the link contained in the Expiry message to go to the Change License page. Alternatively, in Settings, click About, and then click Change License. 2 In the Change License page, in New License Key, enter the new license key you received from VMware. 3 Click Validate. 4 Click Activate. Customer Experience Improvement Program This product participates in VMware's Customer Experience Improvement Program (CEIP). The details regarding the data collected through CEIP and the purposes for which it is used by VMware are set forth at the Trust & Assurance Center at To join or leave the CEIP for this product: 1 In the About page, under Customer Experience Improvement Program, click Modify. 2 The CEIP window pops up. To join CEIP, check Enable. This action activates CEIP and sends data to 3 To leave CEIP, uncheck Enable. 4 Click Submit. Automatic Storage Expansion for Platform VM To expand the storage available to the Platform VM, a new hard disk needs to be added using the VMware vcenter. Once the disk is added, the product will automatically recognize and start using the newly added storage seamlessly. VMware, Inc. 89
90 VPC Flow Logs 15 You can create a flow log for VPC. For more information on creating flow logs for VPC, refer the AWS documentation at Once the flow logs are created, you can enable the VPC flow logs in vrealize Network Insight after validating your AWS account. Recommended Policy for Flow Log Creation Review your users' IAM policies to ensure that the iam:passrole permission on the IAM role used in the CreateFlowLogs call is granted appropriately. If the user who calls CreateFlowLogs does not have the IAM PassRole permission, the system returns an access denied message. The following example demonstrates how you can verify if the correct permission is already assigned to users that have created the VPC Flow Logs in the past 90-days. If you have any additional questions or concerns, contact the AWS Support team. Here is the sequence of steps to be run using the AWS CLI to determine if users who created the VPC Flow Logs have the correct permissions assigned to them: 1 Check your CloudTrail logs for events related to creating the flow logs, by searching for attributes with a key of EventName and a value of CreateFlowLogs. In this example, only one CreateFlowLogs event is found, and this command was invoked by the user admin-temp. % aws cloudtrail lookup-events --lookup-attributes AttributeKey=EventName, \ AttributeValue=CreateFlowLogs { "Events": [ { "EventName": "CreateFlowLogs", "Resources": [ { "ResourceType": "AWS::IAM::Role", "ResourceName": "arn:aws:iam:: :role/flowlogsrole" }, { "ResourceType": "AWS::Logs::LogGroup", "ResourceName": "example-flow-logs" }, { "ResourceType": "AWS::EC2::FlowLog", VMware, Inc. 90
91 "ResourceName": "fl-1a1a1a1a" }, { "ResourceName": "vpc-2b2b2b2b" } ], "EventId": "1a1a1a1a-ffff af", "EventTime": , "Username": "admin-temp", 2 Audit the permissions assigned to the IAM user admin-temp. Specifically, look for the PolicyNames assigned to this IAM user. In this example, the policy name assigned is inline-pass-role-policy. Using the CLI, review the details of this user policy. Look for the iam:passrole permission. In this example, the user policy does include the iam:passrole permission. % aws iam list-user-policies --user-name admin-temp { "PolicyNames": [ "inline-pass-role-policy" ] } % aws iam get-user-policy --user-name admin-temp --policy-name inline-pass-role-policy { "UserName": "admin-temp", "PolicyName": "inline-pass-role-policy", "PolicyDocument": { "Version": " ", "Statement": [ { "Sid": "VisualEditor0", "Action": "iam:passrole", "Effect": "Allow", "Resource": "arn:aws:iam:: :role/flowlogsrole" } ] } } 3 Using the credentials of the admin-temp IAM user, you can create a new flow log and verify that the flow log is created successfully. % aws ec2 create-flow-logs --deliver-logs-permission-arn \ arn:aws:iam:: :role/flowlogsrole \ --log-group-name example-flow-logs --resource-ids vpc-2b2b2b2b \ --resource-type VPC --traffic-type ALL As this user has the correct permission iam:passrole on the role arn:aws:iam:: :role/flowLogsRole it uses in the CreateFlowLogs call, this call succeeds. Refer the AWS Documentation on IAM Roles for Flow Logs for more information. VMware, Inc. 91
92 Viewing the vrealize Network Insight Dashboards 16 The vrealize Network Insight dashboard provides an insight into properties and changes of the system entity over a period of time. It is a snapshot of all the information that is required to analyse your system. There are four types of vrealize Network Insight dashboards: This chapter includes the following topics: NI System Dashboard NI Platform Dashboard NI Collector Dashboard Data Source Dashboard NI System Dashboard The NI System dashboard provides a snapshot of all the information related to the system. To access the NI System dashboard: On the Install and Support page, click View Details next to Overview. The NI System dashboard appears. Provide NI-System as the search query to view the NI System dashboard. VMware, Inc. 92
93 The NI System dashboard is divided into three sections: Overview: This section consists of information on the key properties, the data sources, the problems that are open, and all the changes and the problems related to the system. View the details of each data source by clicking it. Events: This section lists all the problems and changes in the system, data sources, platforms, and the collectors. VMware, Inc. 93
94 Platforms and Collectors: This section lists all the platforms and the collectors associated with the system. To view more details about any platform or collector, click it. NI Platform Dashboard The NI Platform dashboard provides a snapshot of the properties, changes, and problems of a particular platform node. Properties: This pin provides details of the node such as name, IP address, CPU cores, memory, the last upgraded time, and the version. Open Problems: This pin indicates the problems that are associated with the platforms and are open. VMware, Inc. 94
95 Platform Changes and Problems: This pin highlights the changes and problems that occurred in the platform in the last seven days. NI Collector Dashboard The NI Collector dashboard provides a snapshot of the properties, changes, and problems of a particular collector node. Properties: This pin provides details of the node such as name, IP address, CPU cores, memory, the last upgraded time, and the version. Open Problems(Collectors): This pin lists all the open problems related to the collector. Open Problems (Data Sources): This pin lists all the open problems related to the data sources. Data Sources: This pin lists all the data sources that are associated with that particular collector node. You can view the details of each data source by clicking on it. Collector Changes and Problems: This pin highlights the changes that occurred in the collector in the last seven days. Data Source Changes and Problems: This pin highlights the changes that occurred in the data source in the last seven days. Data Source Dashboard The data source dashboard provides a snapshot of the properties, changes, and problems of a particular data source. VMware, Inc. 95
96 Properties: This pin provides details of the node such its name, the IP address, and the associated collector. Open Problems: This pin lists all the open problems associated to the data source. Changes and Problems: This pin lists all the changes and the problems encountered in a particular data source in the last seven days. VMware, Inc. 96
97 Viewing the Flow Analytics 17 Dashboard The Flow Analytics dashboard provides an insight into data centers, devices, and flows. It is a contextbased dashboard as it performs analysis based on the entities, flows, and the time range that you select. To access the Flow Analytics dashboard: Search Flows. Click Flow Analytics. The Flow Analytics dashboard appears. The various sections in the Flow Analytics Dashboard are: Top Talkers What's New Outliers Top Talkers This section helps you to recognize which entities are talking the most in your environment. You can select different kinds of entities such as Source-Destination pair, VM, Cluster, L2 Network, Subnet. This widget lists the top 10 talkers in the entity category that you select. It helps the customer to plan for network optimization. The metrics that are represented by bars in this widget are as follows: By Flow Volume: Indicates the traffic volume. By Traffic Rate: Indicates the rate of traffic. By Session Count: Indicates the number of sessions. By Flow Count: Indicates the number of flows VMware, Inc. 97

98 Note If a VM appears in one or more metrics, when you point to that VM in a bar, it will also be highlighted in other bars. When you click a VM in the metrics bar, the complete list of flows coming to this VM is shown. When you select VM as the entity in the Top Talkers list, all the flows related to this VM irrespective of it being the source or destination is shown. If you select Source VM in the list, then only the flows coming from this VM are considered. If you are considering the physical flows, you can select either Source IP or Destination IP. After you select the Source-Destination pair and point on the metric bar, if you click the link in the tool tip, the corresponding dashboard appears. For example, for a VM in Sourec-Destination pair, the VM- VM path dashboard appears. For a flow group view or a flow entity projection or a flows group query, you cannot see the Flow Analytics button. What's New This section helps you to track what services and entities are discovered in the data center in the selected time range. The sections in this widget are as follows: New Virtual Machines Accessing Internet: Lists the new VMs that access Internet. New Internet Services Accessed: Lists the new Internet services discovered in the environment. New Internal Services Accessed: Lists the new intranet services that are discovered and accessed from the Internet endpoint. New Internal/E-W Services Accessed: Lists the services that are exposed and accessed by the machines within a data center VMware, Inc. 98
Using vrealize Network Insight. VMware vrealize Network Insight 3.6
 Using vrealize Network Insight VMware vrealize Network Insight 3.6 You can find the most up-to-date technical documentation on the VMware website at: https://docs.vmware.com/ If you have comments about
Using vrealize Network Insight. VMware vrealize Network Insight 3.5
 VMware vrealize Network Insight 3.5 You can find the most up-to-date technical documentation on the VMware Web site at: https://docs.vmware.com/ The VMware Web site also provides the latest product updates.
vrealize Network Insight User Guide
 vrealize Network Insight 3.0 This document supports the version of each product listed and supports all subsequent versions until the document is replaced by a new edition. To check for more recent editions
vrealize Network Insight User Guide
 vrealize Network Insight 3.3 This document supports the version of each product listed and supports all subsequent versions until the document is replaced by a new edition. To check for more recent editions
vrealize Operations Management Pack for NSX for vsphere 2.0
 vrealize Operations Management Pack for NSX for vsphere 2.0 This document supports the version of each product listed and supports all subsequent versions until the document is replaced by a new edition.
vrealize Operations Management Pack for NSX for vsphere 3.0
 vrealize Operations Management Pack for NSX for vsphere 3.0 This document supports the version of each product listed and supports all subsequent versions until the document is replaced by a new edition.
Using VMware Network Insight. VMware Network Insight
 Using VMware Network Insight VMware Network Insight You can find the most up-to-date technical documentation on the VMware website at: https://docs.vmware.com/ If you have comments about this documentation,
Installing vrealize Network Insight. VMware vrealize Network Insight 3.3
 VMware vrealize Network Insight 3.3 You can find the most up-to-date technical documentation on the VMware Web site at: https://docs.vmware.com/ The VMware Web site also provides the latest product updates.
Installing vrealize Network Insight
 vrealize Network Insight 3.4 This document supports the version of each product listed and supports all subsequent versions until the document is replaced by a new edition. To check for more recent editions
vrealize Network Insight Installation Guide
 vrealize Network Insight Installation Guide vrealize Network Insight 3.3 This document supports the version of each product listed and supports all subsequent versions until the document is replaced by
vrealize Operations Management Pack for NSX for vsphere 3.5.0
 vrealize Operations Management Pack for NSX for vsphere 3.5.0 This document supports the version of each product listed and supports all subsequent versions until the document is replaced by a new edition.
vcenter Operations Management Pack for NSX-vSphere
 vcenter Operations Management Pack for NSX-vSphere vcenter Operations Manager 5.8 This document supports the version of each product listed and supports all subsequent versions until the document is replaced
vrealize Operations Management Pack for NSX for Multi-Hypervisor
 vrealize Operations Management Pack for This document supports the version of each product listed and supports all subsequent versions until the document is replaced by a new edition. To check for more
Installing vrealize Network Insight. VMware vrealize Network Insight 3.5
 VMware vrealize Network Insight 3.5 You can find the most up-to-date technical documentation on the VMware Web site at: https://docs.vmware.com/ The VMware Web site also provides the latest product updates.
vrealize Network Insight Installation Guide
 vrealize Network Insight Installation Guide vrealize Network Insight 3.1 This document supports the version of each product listed and supports all subsequent versions until the document is replaced by
Table of Contents HOL NET
 Table of Contents Lab Overview - - Getting Started with vrealize Network Insight... 2 Lab Guidance... 3 Module 1 - Micro-Segmentation and Security (30 minutes)... 9 Introduction... 10 Micro-Segmentation
Installing vrealize Network Insight. VMware vrealize Network Insight 3.6
 Installing vrealize Network Insight VMware vrealize Network Insight 3.6 You can find the most up-to-date technical documentation on the VMware website at: https://docs.vmware.com/ If you have comments
Quick Start Guide (SDN)
") NetBrain Integrated Edition 7.1 Quick Start Guide (SDN) Version 7.1a Last Updated 2018-09-03 Copyright 2004-2018 NetBrain Technologies, Inc. All rights reserved. Contents 1. Discovering and Visualizing
NetBrain Integrated Edition 7.1 Quick Start Guide (SDN) Version 7.1a Last Updated 2018-09-03 Copyright 2004-2018 NetBrain Technologies, Inc. All rights reserved. Contents 1. Discovering and Visualizing
IaaS Integration for Multi- Machine Services. vrealize Automation 6.2
 IaaS Integration for Multi- Machine Services vrealize Automation 6.2 You can find the most up-to-date technical documentation on the VMware website at: https://docs.vmware.com/ If you have comments about
NSX-T Data Center Migration Coordinator Guide. 5 APR 2019 VMware NSX-T Data Center 2.4
 NSX-T Data Center Migration Coordinator Guide 5 APR 2019 VMware NSX-T Data Center 2.4 You can find the most up-to-date technical documentation on the VMware website at: https://docs.vmware.com/ If you
vcloud Air - Virtual Private Cloud OnDemand Networking Guide
 vcloud Air - Virtual Private Cloud OnDemand Networking Guide vcloud Air This document supports the version of each product listed and supports all subsequent versions until the document is replaced by
Planning and Preparation. VMware Validated Design 4.0 VMware Validated Design for Remote Office Branch Office 4.0
 VMware Validated Design 4.0 VMware Validated Design for Remote Office Branch Office 4.0 You can find the most up-to-date technical documentation on the VMware website at: https://docs.vmware.com/ If you
Introducing VMware Validated Designs for Software-Defined Data Center
 Introducing VMware Validated Designs for Software-Defined Data Center VMware Validated Design for Software-Defined Data Center 3.0 This document supports the version of each product listed and supports
Getting Started Guide. VMware NSX Cloud services
 VMware NSX Cloud services You can find the most up-to-date technical documentation on the VMware website at: https://docs.vmware.com/ If you have comments about this documentation, submit your feedback
vcenter Operations Manager for Horizon View Administration
 vcenter Operations Manager for Horizon View Administration vcenter Operations Manager for Horizon View 1.5 vcenter Operations Manager for Horizon View 1.5.1 This document supports the version of each product
VMware vrealize Operations Federation Management Pack 1.0. vrealize Operations Manager
 VMware vrealize Operations Federation Management Pack 1.0 vrealize Operations Manager VMware vrealize Operations Federation Management Pack 1.0 You can find the most up-to-date technical documentation
vshield Administration Guide
 vshield Manager 5.1 vshield App 5.1 vshield Edge 5.1 vshield Endpoint 5.1 This document supports the version of each product listed and supports all subsequent versions until the document is replaced by
Using vrealize Network Insight. VMware vrealize Network Insight 3.8
 Using vrealize Network Insight VMware vrealize Network Insight 3.8 You can find the most up-to-date technical documentation on the VMware website at: https://docs.vmware.com/ If you have comments about
Installing vrealize Network Insight. VMware vrealize Network Insight 3.7
 Installing vrealize Network Insight VMware vrealize Network Insight 3.7 You can find the most up-to-date technical documentation on the VMware website at: https://docs.vmware.com/ If you have comments
VMware Integrated OpenStack Quick Start Guide
 VMware Integrated OpenStack Quick Start Guide VMware Integrated OpenStack 1.0.1 This document supports the version of each product listed and supports all subsequent versions until the document is replaced
Introducing VMware Validated Designs for Software-Defined Data Center
 Introducing VMware Validated Designs for Software-Defined Data Center VMware Validated Design for Software-Defined Data Center 4.0 This document supports the version of each product listed and supports
Introducing VMware Validated Designs for Software-Defined Data Center
 Introducing VMware Validated Designs for Software-Defined Data Center VMware Validated Design 4.0 VMware Validated Design for Software-Defined Data Center 4.0 You can find the most up-to-date technical
IaaS Integration for Multi-Machine Services
 IaaS Integration for Multi-Machine Services vcloud Automation Center 6.1 This document supports the version of each product listed and supports all subsequent versions until the document is replaced by
vrealize Operations Management Pack for NSX for vsphere 3.5 Release Notes
 vrealize Operations Management Pack for NSX for vsphere 3.5 Release Notes Build: 4602207 Last document update: 14 November, 2016 Contents: Before You Install the Management Pack Upgrading from the Management
VMware vrealize Operations for Horizon Administration. 20 SEP 2018 VMware vrealize Operations for Horizon 6.6
 VMware vrealize Operations for Horizon Administration 20 SEP 2018 VMware vrealize Operations for Horizon 6.6 You can find the most up-to-date technical documentation on the VMware website at: https://docs.vmware.com/
VMware vrealize Operations for Horizon Administration. Modified on 3 JUL 2018 VMware vrealize Operations for Horizon 6.4
 VMware vrealize Operations for Horizon Administration Modified on 3 JUL 2018 VMware vrealize Operations for Horizon 6.4 You can find the most up-to-date technical documentation on the VMware website at:
vcenter Server Appliance Configuration Update 1 Modified on 04 OCT 2017 VMware vsphere 6.5 VMware ESXi 6.5 vcenter Server 6.5
 Update 1 Modified on 04 OCT 2017 VMware vsphere 6.5 VMware ESXi 6.5 vcenter Server 6.5 You can find the most up-to-date technical documentation on the VMware Web site at: https://docs.vmware.com/ The VMware
VMware vrealize Operations for Horizon Administration
 VMware vrealize Operations for Horizon Administration vrealize Operations for Horizon 6.4 vrealize Operations Manager 6.4 This document supports the version of each product listed and supports all subsequent
vrealize Operations Manager Customization and Administration Guide vrealize Operations Manager 6.4
 vrealize Operations Manager Customization and Administration Guide vrealize Operations Manager 6.4 vrealize Operations Manager Customization and Administration Guide You can find the most up-to-date technical
vsphere Networking Update 1 ESXi 5.1 vcenter Server 5.1 vsphere 5.1 EN
 Update 1 ESXi 5.1 vcenter Server 5.1 vsphere 5.1 This document supports the version of each product listed and supports all subsequent versions until the document is replaced by a new edition. To check
Infrastructure Navigator User's Guide
 vcenter Infrastructure Navigator 1.0.0 This document supports the version of each product listed and supports all subsequent versions until the document is replaced by a new edition. To check for more
vrealize Suite Lifecycle Manager 1.0 Installation and Management vrealize Suite 2017
 vrealize Suite Lifecycle Manager 1.0 Installation and Management vrealize Suite 2017 vrealize Suite Lifecycle Manager 1.0 Installation and Management You can find the most up-to-date technical documentation
VMware vrealize Operations for Horizon Administration
 VMware vrealize Operations for Horizon Administration vrealize Operations for Horizon 6.3 This document supports the version of each product listed and supports all subsequent versions until the document
Network Operations Analytics
 Network Operations Analytics Solution Guide Version 2.4.4 (Build 2.4.4.0.x) June 2016 Copyright 2012-2016 NetFlow Logic Corporation. All rights reserved. Patents Pending. Contents Introduction... 2 Solution
AppDefense Getting Started. VMware AppDefense
 AppDefense Getting Started VMware AppDefense You can find the most up-to-date technical documentation on the VMware website at: https://docs.vmware.com/ If you have comments about this documentation, submit
vsphere Networking Update 2 VMware vsphere 5.5 VMware ESXi 5.5 vcenter Server 5.5 EN
 Update 2 VMware vsphere 5.5 VMware ESXi 5.5 vcenter Server 5.5 This document supports the version of each product listed and supports all subsequent versions until the document is replaced by a new edition.
vrealize Automation Management Pack 2.0 Guide
 vrealize Automation Management Pack 2.0 Guide This document supports the version of each product listed and supports all subsequent versions until the document is replaced by a new edition. To check for
VMware vrealize Operations for Horizon Administration
 VMware vrealize Operations for Horizon Administration vrealize Operations for Horizon 6.2 This document supports the version of each product listed and supports all subsequent versions until the document
VMware vrealize Operations for Horizon Installation
 VMware vrealize Operations for Horizon Installation vrealize Operations for Horizon 6.4 Installation vrealize Operations for Horizon 6.4 This document supports the version of each product listed and supports
VMware vfabric Data Director Installation Guide
 VMware vfabric Data Director Installation Guide vfabric Data Director 1.0.1 This document supports the version of each product listed and supports all subsequent versions until the document is replaced
Disclaimer This presentation may contain product features that are currently under development. This overview of new technology represents no commitme
 SAI2803BU The Road to Micro- Segmentation with VMware NSX #VMworld #SAI2803BU Disclaimer This presentation may contain product features that are currently under development. This overview of new technology
Using the vrealize Orchestrator Operations Client. vrealize Orchestrator 7.5
 Using the vrealize Orchestrator Operations Client vrealize Orchestrator 7.5 You can find the most up-to-date technical documentation on the VMware website at: https://docs.vmware.com/ If you have comments
vrealize Operations Service Discovery Management Pack 2.1
 vrealize Operations Service Discovery Management Pack 2.1 You can find the most up-to-date technical documentation on the ware website at: https://docs.vmware.com/ If you have comments about this documentation,
Quick Start Guide (SDN)
") NetBrain Integrated Edition 7.1 Quick Start Guide (SDN) Version 7.1 Last Updated 2018-07-24 Copyright 2004-2018 NetBrain Technologies, Inc. All rights reserved. Contents 1. Discovering and Visualizing
NetBrain Integrated Edition 7.1 Quick Start Guide (SDN) Version 7.1 Last Updated 2018-07-24 Copyright 2004-2018 NetBrain Technologies, Inc. All rights reserved. Contents 1. Discovering and Visualizing
vrealize Business Standard User Guide
 User Guide 7.0 This document supports the version of each product listed and supports all subsequent versions until the document is replaced by a new edition. To check for more recent editions of this
vrealize Suite Lifecycle Manager 1.1 Installation, Upgrade, and Management vrealize Suite 2017
 vrealize Suite Lifecycle Manager 1.1 Installation, Upgrade, and Management vrealize Suite 2017 You can find the most up-to-date technical documentation on the VMware website at: https://docs.vmware.com/
vrealize Business for Cloud User Guide
 vrealize Business for Cloud User Guide vrealize Business for Cloud Standard 7.3 and vrealize Business for Cloud Advanced 7.3 vrealize Business 7.3 vrealize Business for Cloud 7.3 You can find the most
NSX-T Upgrade Guide. VMware NSX-T 2.0
 VMware NSX-T 2.0 You can find the most up-to-date technical documentation on the VMware website at: https://docs.vmware.com/ If you have comments about this documentation, submit your feedback to docfeedback@vmware.com
vrealize Operations Service Discovery Management Pack 2.0
 vrealize Operations Service Discovery Management Pack 2.0 vrealize Operations Service Discovery Management Pack 2.0 You can find the most up-to-date technical documentation on the ware Web site at: https://docs.vmware.com/
VMware vrealize Operations for Horizon Installation. VMware vrealize Operations for Horizon 6.5
 VMware vrealize Operations for Horizon Installation VMware vrealize Operations for Horizon 6.5 You can find the most up-to-date technical documentation on the VMware website at: https://docs.vmware.com/
Virtual Security Gateway Overview
 This chapter contains the following sections: Information About the Cisco Virtual Security Gateway, page 1 Cisco Virtual Security Gateway Configuration for the Network, page 10 Feature History for Overview,
PostgreSQL Solution 1.1
 vrealize Operations Manager This document supports the version of each product listed and supports all subsequent versions until the document is replaced by a new edition. To check for more recent editions
vrealize Business for Cloud User Guide
 vrealize Business for Cloud Standard 7.2 and vrealize Business for Cloud Advanced 7.2 vrealize Business 7.2 vrealize Business for Cloud 7.2 You can find the most up-to-date technical documentation on the
Installing and Configuring vcloud Connector
 Installing and Configuring vcloud Connector vcloud Connector 2.6.0 This document supports the version of each product listed and supports all subsequent versions until the document is replaced by a new
Recommended Configuration Maximums
 Recommended Configuration Maximums NSX for vsphere 6.3 Update 1 Last Updated 7 Nov, 2017 This document supports the version of each product listed and supports all subsequent versions until the document
VMware vrealize Operations for Horizon Installation. VMware vrealize Operations for Horizon 6.3
 VMware vrealize Operations for Horizon Installation VMware vrealize Operations for Horizon 6.3 VMware vrealize Operations for Horizon Installation You can find the most up-to-date technical documentation
Recommended Configuration Maximums. NSX for vsphere Updated on August 08, 2018
 Recommended Configuration Maximums NSX for vsphere 6.3.6 Updated on August 08, 2018 You can find the most up-to-date technical documentation on the VMware website at: https://docs.vmware.com/ If you have
VMware vcenter AppSpeed User s Guide AppSpeed 1.0 EN
 VMware vcenter AppSpeed User s Guide AppSpeed 1.0 EN-000213-01 VMware vcenter AppSpeed User s Guide You can find the most up-to-date technical documentation on the VMware Web site at: http://www.vmware.com/support/
Cisco Virtual Networking Solution for OpenStack
 Data Sheet Cisco Virtual Networking Solution for OpenStack Product Overview Extend enterprise-class networking features to OpenStack cloud environments. A reliable virtual network infrastructure that provides
vrealize Operations Manager User Guide
 vrealize Operations Manager User Guide vrealize Operations Manager 6.2 This document supports the version of each product listed and supports all subsequent versions until the document is replaced by a
vrealize Operations Manager User Guide
 vrealize Operations Manager User Guide vrealize Operations Manager 6.5 This document supports the version of each product listed and supports all subsequent versions until the document is replaced by a
NSX-T Upgrade Guide. VMware NSX-T 2.1
 VMware NSX-T 2.1 You can find the most up-to-date technical documentation on the VMware website at: https://docs.vmware.com/ If you have comments about this documentation, submit your feedback to docfeedback@vmware.com
VMware Cloud Foundation Planning and Preparation Guide. VMware Cloud Foundation 3.0
 VMware Cloud Foundation Planning and Preparation Guide VMware Cloud Foundation 3.0 You can find the most up-to-date techni documentation on the VMware website at: https://docs.vmware.com/ If you have comments
VMware Cloud on AWS Networking and Security. 5 September 2018 VMware Cloud on AWS
 VMware Cloud on AWS Networking and Security 5 September 2018 VMware Cloud on AWS You can find the most up-to-date technical documentation on the VMware website at: https://docs.vmware.com/ If you have
VMware Identity Manager Connector Installation and Configuration (Legacy Mode)
") VMware Identity Manager Connector Installation and Configuration (Legacy Mode) VMware Identity Manager This document supports the version of each product listed and supports all subsequent versions until
VMware Identity Manager Connector Installation and Configuration (Legacy Mode) VMware Identity Manager This document supports the version of each product listed and supports all subsequent versions until
Recommended Configuration Maximums
 Recommended Configuration Maximums NSX for vsphere 6.3 Update 2 Last Updated December 21, 2017 This document supports the version of each product listed and supports all subsequent versions until the document
vrealize Operations Management Pack for vsan 1.0 Guide
 vrealize Operations Management Pack for vsan 1.0 Guide This document supports the version of each product listed and supports all subsequent versions until the document is replaced by a new edition. To
VMware Integrated OpenStack with Kubernetes Getting Started Guide. VMware Integrated OpenStack 4.0
 VMware Integrated OpenStack with Kubernetes Getting Started Guide VMware Integrated OpenStack 4.0 VMware Integrated OpenStack with Kubernetes Getting Started Guide You can find the most up-to-date technical
vrealize Operations Manager User Guide Modified on 17 AUG 2017 vrealize Operations Manager 6.6
 vrealize Operations Manager User Guide Modified on 17 AUG 2017 vrealize Operations Manager 6.6 vrealize Operations Manager User Guide You can find the most up-to-date technical documentation on the VMware
VMware Validated Design Monitoring and Alerting Guide
 VMware Validated Design Monitoring and Alerting Guide VMware Validated Design for Software- Defined Data Center 2.0 This document supports the version of each product listed and supports all subsequent
Using vrealize Operations Tenant App for vcloud Director as a Tenant Admin
 Using vrealize Operations Tenant App for vcloud Director as a Tenant Admin Using vrealize Operations Tenant App for vcloud Director as a Tenant Admin You can find the most up-to-date technical documentation
VMware Skyline Collector Installation and Configuration Guide. VMware Skyline 1.4
 VMware Skyline Collector Installation and Configuration Guide VMware Skyline 1.4 You can find the most up-to-date technical documentation on the VMware website at: https://docs.vmware.com/ If you have
vrealize Operations Management Pack for OpenStack 5.0
 vrealize Operations Management Pack for 5.0 You can find the most up-to-date technical documentation on the VMware website at: https://docs.vmware.com/ If you have comments about this documentation, submit
VMware Cloud on AWS Getting Started. 18 DEC 2017 VMware Cloud on AWS
 VMware Cloud on AWS Getting Started 18 DEC 2017 VMware Cloud on AWS You can find the most up-to-date technical documentation on the VMware website at: https://docs.vmware.com/ If you have comments about
Infrastructure Navigator User's Guide
 vcenter Infrastructure Navigator 1.1.0 This document supports the version of each product listed and supports all subsequent versions until the document is replaced by a new edition. To check for more
VMware vfabric Data Director Installation Guide
 VMware vfabric Data Director Installation Guide vfabric Data Director 2.5 This document supports the version of each product listed and supports all subsequent versions until the document is replaced by
Deploying VMware Validated Design Using OSPF Dynamic Routing. Technical Note 9 NOV 2017 VMware Validated Design 4.1 VMware Validated Design 4.
 Deploying VMware Validated Design Using PF Dynamic Routing Technical Note 9 NOV 2017 VMware Validated Design 4.1 VMware Validated Design 4.0 Deploying VMware Validated Design Using PF Dynamic Routing You
Disclaimer This presentation may contain product features that are currently under development. This overview of new technology represents no commitme
 NET1949BU Seamless Network Connectivity for Virtual and Bare-metal s with NSX Suresh Thiru Sridhar Subramanian VMworld 2017 Content: Not for publication VMworld 2017 - NET1949BU Disclaimer This presentation
VMware Identity Manager Cloud Deployment. Modified on 01 OCT 2017 VMware Identity Manager
 VMware Identity Manager Cloud Deployment Modified on 01 OCT 2017 VMware Identity Manager You can find the most up-to-date technical documentation on the VMware Web site at: https://docs.vmware.com/ The
Using vrealize Log Insight
 vrealize Log Insight 3.6 This document supports the version of each product listed and supports all subsequent versions until the document is replaced by a new edition. To check for more recent editions
vsphere Host Profiles 17 APR 2018 VMware vsphere 6.7 VMware ESXi 6.7 vcenter Server 6.7
 17 APR 2018 VMware vsphere 6.7 VMware ESXi 6.7 vcenter Server 6.7 You can find the most up-to-date technical documentation on the VMware website at: https://docs.vmware.com/ If you have comments about
vcloud Air Advanced Networking Services Guide
 vcloud Air Advanced Networking Services Guide vcloud Air This document supports the version of each product listed and supports all subsequent versions until the document is replaced by a new edition.
IBM Cloud for VMware Solutions NSX Edge Services Gateway Solution Architecture
 IBM Cloud for VMware Solutions NSX Edge Services Gateway Solution Architecture Date: 2017-03-29 Version: 1.0 Copyright IBM Corporation 2017 Page 1 of 16 Table of Contents 1 Introduction... 4 1.1 About
vcenter Server Appliance Configuration Modified on 17 APR 2018 VMware vsphere 6.7 VMware ESXi 6.7 vcenter Server 6.7
 vcenter Server Appliance Configuration Modified on 17 APR 2018 VMware vsphere 6.7 VMware ESXi 6.7 vcenter Server 6.7 You can find the most up-to-date technical documentation on the VMware website at: https://docs.vmware.com/
vcloud Director Tenant Portal Guide vcloud Director 8.20
 vcloud Director Tenant Portal Guide vcloud Director 8.20 You can find the most up-to-date technical documentation on the VMware website at: https://docs.vmware.com/ If you have comments about this documentation,
Introducing VMware Validated Design Use Cases
 Introducing VMware Validated Design Use Cases VMware Validated Designs 4.0 This document supports the version of each product listed and supports all subsequent versions until the document is replaced
Deploying VMware Identity Manager in the DMZ. JULY 2018 VMware Identity Manager 3.2
 Deploying VMware Identity Manager in the DMZ JULY 2018 VMware Identity Manager 3.2 You can find the most up-to-date technical documentation on the VMware website at: https://docs.vmware.com/ If you have
vrealize Operations Compliance Pack for PCI
 vrealize Operations Compliance Pack for PCI vrealize Operations Manager This document supports the version of each product listed and supports all subsequent versions until the document is replaced by
vshield Quick Start Guide
 vshield Manager 4.1.0 Update 1 vshield Zones 4.1.0 Update 1 vshield Edge 1.0.0 Update 1 vshield App 1.0.0 Update 1 vshield Endpoint 1.0.0 Update 1 This document supports the version of each product listed
Application Discovery Manager User s Guide vcenter Application Discovery Manager 6.2.2
 Application Discovery Manager User s Guide vcenter Application Discovery Manager 6.2.2 This document supports the version of each product listed and supports all subsequent versions until the document