Table of Contents HOL NET
|
|
|
- Simon Blankenship
- 5 years ago
- Views:
Transcription
1 Table of Contents Lab Overview - - Getting Started with vrealize Network Insight... 2 Lab Guidance... 3 Module 1 - Micro-Segmentation and Security (30 minutes)... 9 Introduction Micro-Segmentation Introduction Conclusion Module degree Visibility across Virtual and Physical Networks (45 minutes) Introduction Network Visibility and Troubleshooting Conclusion Module 3 - Advanced NSX Management & Operations (45 minutes) Introduction NSX Advanced Management Operations Hands-on Labs Interactive Simulation: Advanced NSX Management & Operations Conclusion Module 4 - Manage Security for Public Clouds (AWS) (30 Minutes) Introduction Introduction to Managing Security for Public Clouds (AWS) Conclusion Page 1
2 Lab Overview - - Getting Started with vrealize Network Insight Page 2
3 Lab Guidance Note: It will take approximately 90 minutes to complete this lab. You should expect to only finish two of the modules during your time if you are new to vrealize Network Insight. The modules are independent of each other so you can start at the beginning of any module and proceed from there. You can use the Table of Contents to access any module of your choosing. The Table of Contents can be accessed in the upper right-hand corner of the Lab Manual. In this lab students will be presented with an overview and demonstration using vrealize Network Insight. This lab will focus on four particular capabilities and two use case scenarios. The first module introduces Micro-segmentation and the security within networks, followed by module two that will provide a detailed Map walk through of a Real Time flow rendering a 360 degree view for cross platform under and overlays. Module number three will focus on NSX Manager and provide an easy in-depth look at how we manage advanced NSX operations within vrealize Network Insight. Module number four will focus on Manage Security for Public Clouds (AWS). Lab Module List: Module 1 - Micro-Segmentation and Security (30 minutes) Module degree Visibility across Virtual and Physical Networks (45 minutes) Module 3 - Advanced NSX Management & Operations (45 minutes) Module 4 - Manage Security for Public Clouds (AWS) (30 minutes) Lab Captain: Module Atif Qadeer, Senior Systems Engineer - NSX, UK This lab manual can be downloaded from the Hands-on Labs Document site found here: [ This lab may be available in other languages. To set your language preference and have a localized manual deployed with your lab, you may utilize this document to help guide you through the process: Page 3

4 Location of the Main Console 1. The area in the RED box contains the Main Console. The Lab Manual is on the tab to the Right of the Main Console. 2. A particular lab may have additional consoles found on separate tabs in the upper left. You will be directed to open another specific console if needed. 3. Your lab starts with 90 minutes on the timer. The lab can not be saved. All your work must be done during the lab session. But you can click the EXTEND to increase your time. If you are at a VMware event, you can extend your lab time twice, for up to 30 minutes. Each click gives you an additional 15 minutes. Outside of VMware events, you can extend your lab time up to 9 hours and 30 minutes. Each click gives you an additional hour. Alternate Methods of Keyboard Data Entry During this module, you will input text into the Main Console. Besides directly typing it in, there are two very helpful methods of entering data which make it easier to enter complex data. Page 4
5 Click and Drag Lab Manual Content Into Console Active Window You can also click and drag text and Command Line Interface (CLI) commands directly from the Lab Manual into the active window in the Main Console. Accessing the Online International Keyboard You can also use the Online International Keyboard found in the Main Console. 1. Click on the Keyboard Icon found on the Windows Quick Launch Task Bar. Page 5

6 Click once in active console window In this example, you will use the Online Keyboard to enter the sign used in addresses. The sign is Shift-2 on US keyboard layouts. 1. Click once in the active console window. 2. Click on the Shift key. Click on key 1. Click on the "@ key". Notice sign entered in the active console window. Page 6


7 vrealize Network Insight - Navigation 1 - "HOME" - Use this if you need to return to the original navigation and search screen 2 - Navigation Pane 3 - Search Bar including time line 4 - Detail & Information Pane 5 - Alerts / Pinboards / Settings Activation Prompt or Watermark When you first start your lab, you may notice a watermark on the desktop indicating that Windows is not activated. One of the major benefits of virtualization is that virtual machines can be moved and run on any platform. The Hands-on Labs utilizes this benefit and we are able to run the labs out of multiple datacenters. However, these datacenters may not have identical processors, which triggers a Microsoft activation check through the Internet. Rest assured, VMware and the Hands-on Labs are in full compliance with Microsoft licensing requirements. The lab that you are using is a self-contained pod and does not have full access to the Internet, which is required for Windows to verify the activation. Without full access to the Internet, this automated process fails and you see this watermark. This cosmetic issue has no effect on your lab. Page 7

8 Look at the lower right portion of the screen Please check to see that your lab is finished all the startup routines and is ready for you to start. If you see anything other than "Ready", please wait a few minutes. If after 5 minutes your lab has not changed to "Ready", please ask for assistance. Page 8
9 Module 1 - Micro- Segmentation and Security (30 minutes) Page 9
10 Introduction When mid to large-sized enterprises deploy NSX, they often struggle to define the level of micro segmentation needed between applications on networks. The most challenging part is knowing what information is required to get started, how to locate the information and traffic flow and how to capture the results. vrealize Network Insight helps solve this problem by analyzing and categorizing VMs into logical groups based on specific compute and network characteristics. This process automatically generates a recommended model for security groups and specific firewalling rules for each group. This makes life much easier for Security Architects and Engineers. vrealize Network Insight (vrni) relies on the use of an IPFIX collector at the Virtual Distributed switch layer to capture data flows. We enable IPFIX at the Virtual Distributed switch layer for the ESXi Hosts to forward IPFIX UDP packets to the vrealize Network Insight appliance. The data capture will enable real time data flow for all port traffic and provide further filtering capabilities in order to explore East-West traffic. We have two scenario's to help explain how vrealize Network Insight can be utilized to ensure we have full visibility and granular control to deploy firewall rules in order to complete micro-segmentation without guessing. Scenario 1: (Brown Field deployment) Customer ABC bought ESXi and NSX and does not have a clear understanding of how to operationally deploy existing workloads with East-West firewall protection or how to segment the workload. The client will now use vrealize Network Insight to observe the real time data flow between ports in order to build the East-West firewall rules. The vrealize Network Insight process will observe the traffic patterns based on the captured data flow, recommendations will then be made in order to secure workloads for East-West communication. Current firewall and microsegmentation can also be verified. Scenario 2: (Green Field) Customer ABC has a new deployment project for DevOps and wouldn't know what the immediate firewall rules or recommendations would be. Using vrealize Network Insight we could immediately start to monitor the real time data flow as each deployment and development unfolds. Based on the DevOps information we can now apply the Firewall rules at the Q&A stage and prep for testing to ensure when we move workloads into Production we will have day zero operational security for East- West traffic within the data center. NOTE: NSX is not required at any stage to capture, observe or implement successful East-West firewall rules. The process of planning security only relies on IPFIX at the vds layer in order to capture and observe data flow between ports. This Module contains the following lessons: Page 10
11 Identify firewall rules for Micro-segmentation Security Group Topology Tracking a firewall rule Exporting firewall rules to NSX Manager (Interactive Simulation) Conclusion Page 11

12 Micro-Segmentation Introduction This section contains the following lessons: Identify firewall rules for Micro-segmentation Security Group Topology Tracking a firewall rule Lab Status Check 1. Make sure the Lab Status displays Ready before continuing. Close browser sessions from previous modules Open Google Chrome 1. Open Chrome on the Control Centre Desktop. Note: Internet Explorer will not work and is not certified to be used with vrealize Network Insight at the time of this release. Page 12
 vrealize Network Insight - Login Screen")
13 Select vrealize Network Insight Favorite 1. Select the vrni Shortcut on the favorites Bar (if vrealize Network Insight did not load automatically) vrealize Network Insight - Login Screen Login to the portal 1. Username : admin@corp.local 2. Password: VMware1! 3. Click Login to continue Page 13

. 2. Select the Time Icon. Plan Security - Specify a Preset 1. Select Presets. 2. Select Last Week 3.")
14 Plan Security When the vrealize Network Insight portal login completes, the first screen will show a search bar at the top 1. Type plan security (the search bar uses "Auto Fill" and predictive text will appear as you type). 2. Select the Time Icon. Plan Security - Specify a Preset 1. Select Presets. 2. Select Last Week 3. Click the search icon to continue. Page 14

15 Overview - Traffic Distribution (Left Pane) Visual representation of traffic is shown to understand the logic relationship between each component, physical or virtual in order to track flows and sessions within a network: Internal Flows / External Flows Protected Flows / Unprotected Flows by VLAN or VXLAN The default for this view is "Last 1 day" Please do not change this as we have already specified the time filter. Page 15


16 Traffic Distribution - Overview (Right pane) The Traffic distribution section is explained in a number format below. Use these as a reference and do not click on the links at this stage. A - This is the sum of all traffic flows, with the percentage shown as East-West only traffic. B - This indicates the percent of traffic that was switched. C - The percentage of traffic that is routed between the East-West ports. D - This indicates Virtual machine to Virtual Machine traffic as a percentage of the sum in point number 1. E - Traffic observed between virtual machines on the same host. F - Traffic that requires internet access. East-West (EW) - Traffic In order to view specific details about data flows click on any of the 6 blocks to get detailed information on flows and sessions (use the [x] in the right corner to close the observation once completed in order to continue with the next step in this lab). It's Page 16
17 important to understand the entire distribution of flows and sessions in order to build an informed strategy to achieve micro-segmentation. A Session is 5 tuple (source port is one of the five tuples in this, which means, every time a new TCP connection is established and terminated, a new session is recorded) A Flow is 4 tuple aggregation of sessions. It combines many 5 tuple sessions into one. It ignores the source port as the source port is very dynamic, wide range and keeps on changing. As long as multiple sessions have same source IP, same destination IP, same destination port, and same protocol, they will be combined into one record called a flow. So 1000s of sessions in a day between two machines on a specific destination port (ssh, dns, etc) would be combined into one flow with an aggregate count of packets, bytes, sessions between them recorded as additional flow information. In any enterprise how many sessions happen in 1 day varies a lot. Flows are more manageable units and matter most for policy definitions and micro-segmentation. If one wants to see statistics of these flows, like bytes transferred, number of sessions (or even use these counters along with other query operations for other higher level analysis - like determining distribution of a virtual machines outgoing flow by destination ip), the following metric counters can be used: Counter names allowed sessions: count of sessions (or 5 tuples) corresponding to a flow (4 Tuple) bytes : total traffic volume exchanged on the flow (this sum of two counters described below) src bytes: total bytes sent by src_ip of the flow to dst_ip:port:protocol dst bytes: total bytes received by src_ip of the flow from dst_ip:port:protocol 1. Click on the East-West traffic block This will bring a new window into view with detailed analysis of the traffic. Page 17

 to continue.")
18 East-West (EW) - Detailed view This is only a few of the 1653 flows, but the detailed views and filters can be used to narrow down more specific information. A - Without clicking (just hover) on the time line to see the rate of flow indicated by the green line for that period 1. Click the close icon (x) to continue. Services/Ports Page 18

19 Locating the Services screen for the next step Services/Ports - Time line view Plan security makes use of Service and Ports overview on the right-hand side of the screen. The service view screen is used to observe the flow for each service and analyzes a specific flow rate at a point in time. Timelines can be adjusted to gain a better understanding of what the "plan security" query delivers. This module will follow the steps needed to observe and trace flows for port Click Show Data. Page 19

20 Services/Ports - Point in Time Service The Services section provides an overview of flows over a specific port at a point in time, either by bytes or by allowed sessions. Look at the red highlighted area to understand how the flow is viewed in a pivot format to ensure a rate flow can be delivered by hovering over a particular section. 1. Hover to gain focus over the blue block above port 5443 and notice it presents on demand the sum total of flows for the last 24 hours in Gigabytes (GB) communicating over port Click on the block at the intersection of "Last 24 hours" and "PORTS 5443" to get a detailed view of the information Page 20


21 Flows for Port 5443 Communicating over port 5443 for the Last 24 hours, we now have a detailed understanding of how 20 flows are distributed by following the list of entities. You may scroll down and examine the detailed traffic. Further filters can be used on the left-hand side of the screen to filter the view for a more specific result type. 1. Click the entry to examine the detailed flow between Prod-DB-3 and Prod-DB-2 over port 5443 ( order of flows may differ from screen above. Prod-DB-3 and Prod-DB-2 can be seventh flow entry) Flow Key Properties - Timeline view Page 21
 - Hover over any part of the Flow Key Metrics graph to see statistics of the flow at a specific point in time. 1. Click on the 1M (last 1 month).")
22 Flow Key Properties and Flow Key Metrics with the help of the timeline view gives a greater understanding of the traffic between these two specific VM's over port (A) - Hover over any part of the Flow Key Metrics graph to see statistics of the flow at a specific point in time. 1. Click on the 1M (last 1 month). Now hover the mouse over the green/blue lines to see a specific flow at a point in time. Flow Key Properties - Timeline view 1. Click the browser back button (once) to return to the plan security layout screen (once completed viewing the timelines for specific flows). Page 22

23 Micro-Segments The screen should be back and focused on the Plan Security view. Let us focus on the Left-hand side of the plan security screen marked - Micro Segments. This section will focus on the subnet view and how this could be used to track flows between two or multiple points. Note: Segmenting flows can be achieved using views that will focus on VLAN/VXLAN, Subnet, Folder, Clusters, VM's, Ports, Security Tag or Security Groups. 1. Select Last 1 Day (to clear previous data range) 2. Select the drop down box and then select by Subnet. 3. We can further analyze micro-segments by secondary groups ( This step is for information only) 4. Click Analyze to populate the data Page 23

24 Focus Network A - Hover over (do not click) the network and notice that this will immediately highlight all flows and sessions from and to this network segment. Other traffic types will loose focus at this point turning light blue. The "Keep Focus" view creates a single visual endpoint diagram showing communication to physical, shared resources, internet and other subnets. The parentheses after the network will indicate the number of virtual machines. The coloured lines will indicate a connected flow as OUTGOING / INCOMING / BIDIRECTIONAL Page 24
25 Focus - VLAN/VXLAN Changing the view to track flows between Prod-Web to Prod-Midtier we will be switching from Subnet view to VLAN/VXLAN view. This will expose the traffic flow and ultimately lead us to the recommended firewall rules. 1. From the filter drop down select the VLAN/VXLAN option (the view will automatically update). Page 25


26 Focus - Prod-Web (25) 1. Hover over Prod-Web 2. Click on Keep Focus as we will follow the traffic for this group to see which ports are in use and why. 3. Click on the line joining the Prod-Web and Prod-Midtier. Flows - Prod-Web to Prod-Midtier Page 26
27 ( A ) - We have at this point identified 14 unique endpoints or flows that are being communicated by/over or to potential security groups. These security groups are based on VLANs, folders, subnets or a construct that can be defined. 1. Click on the recommended firewall rules. Flows - Recommended Firewall Rules Based on the observed analysis of the traffic flow between Prod-Web and Prod-Midtier, a recommended firewall rule has been generated in order to secure and segment traffic from the rest of the VLAN/VXLAN. Due to the flow observation metrics, the recommendation is (ALLOWED) on Port 8080 between SG Prod-Web and SG-Prod-Midtier. 1. Click the close icon (x) to continue. Page 27


28 Multiple Ports and Firewall rules for Prod-web 1. Click on the Prod-Web group. Services and Flows for Prod-Web On focus the user is presented with all the services, flows and firewall rules for Prod-Web in a single pane. Page 28
. 3.")
29 1. Click on Services In this group - 50 Unique service endpoints or flows that are being communicated by or to potential security groups are mapped with traffic rates included. 2. Click on External Services Accessed- This is a breakdown of the 16 External service endpoints that communicate with Prod-Web and include the port information (DNS, HTTPS, etc). 3. Click on Recommended Firewall Rules - Based on the 50 unique service endpoints that have 17 External services with 425 flows we can use this observation metric to determine that 6 firewall rules are required. This would be the minimum recommended segmentation approach for the Prod-Web group. 4. Click the close icon (x) to continue. Application-Centric Micro-Segmentation Page 29

30 An application is a collection of tiers. Each tier in an application is a collection of VMs based on the user-defined filter criteria. The applications allow you to create a hierarchical group of VMs and visualize traffic/flows between the tiers of the same application. The traffic/flows can be visualized between applications. 1. Under Micro-segments click on the dropdown which says by VLAN/VXLAN 2. Click on 'by Application' 1. Hover over Prod-App (47) (do not click at this stage) 2. Click on Keep Focus You can see, as per previous micro-segmentaion planning exercise - you can view Outgoing, Incoming and Bidirectional flow bespoke to Prod-App. Clicking on Prod- App micro-segment will reveal the services. Page 30


31 We shall now explore how we can define an application. Define an Application 1. In the search bar type Application 2. Click the Search button 1. The Application search will return 4 entities i.e. application already created in the system for you. 2. This page also lets you create new application - click on Add Application Page 31
32 1. Under the Application Name type HOL-Pre-Prod 2. Under Tier type the Name as HOL-Pre-Prod 3. Our search criteria will be based on VM Names under Virtual Machines / IP Addresses. Type 'Admin-VM1', 'Admin-VM2' (The search will auto complete the names for you) 4. Do not Save Click Cancel, which will take you to previous screen 1. Here you can see the number of entities has increased by 1 i.e 5 entities. 2. You can also see Hol-Pre-Prod in the list. HOL-Pre-Prod will now appear in Application section under Plan Security (not covered in this lab) Security Group 'Prod_MidTier' Network administrators and architects face daily challenges in identifying security parameters /groups that are in-place, requiring a lot more detail around container topology before continuing to execute or plan Micro-segmentation. Lets look at how this would be possible in a single view that has granular integration with over and underlay networks. 1. Using the search bar, type Nsx Security Group 'Prod_MidTier' (the search bar uses "Auto Fill" and predictive text will appear as you type). 2. Click search to continue. Page 32
 to continue.")
33 The Help screen may pop-up (in this lab setting) to ensure the user has an instant guide, called the Security Group Pinboard. The reason for this guide is to point out the detail view and topology layout. Read through the help guide and once completed: 1. Click the close icon (x) to continue. Results - PROD_MIDTIER The search results from the query will show Prod_Web at the top of the screen. The result will also be displayed to include the Translated VM Count and any Rules associated 1. Click on Prod_MidTier to continue. Security Group Prod_MidTier - Timeline Security Group View Explanation Page 33

34 The Security Group provides a detailed view of the selected Security Group and a comprehensive listing of key properties and events. The Security Group Topology provides a visual overview of how the security group is associated with other containers. Timeline slider at the top of the current view will enable the point in time state of the Security Group and filters can be used to further focus on a particular aspect of the object. Security Group Firewall Topology (A) The Security Group Firewall Topology on the left shows the topology for Security Group 'Prod_MidTier' Page 34

35 (B) The Security Group Container Topology on the right will show any/all Child and Parent groups in relation to Prod_Web. This will identify the nesting and hierarchy of security groups. Page 35

36 1. Click and select Prod_Web to Prod_Midtier Rule (will launch a pop up screen, covered in next step) 1. In the pop up screen we can immediately see what the Source and destination service flow looks like in this example. This can be done for any and each segment attached to Prod_Web and will provide all the current security Group Firewall Topology information. Feel free to click through all the segments in order to fully understand each related security group. 2. Click the close icon (x) on any pop-up menus that you viewed during your analysis to continue with the next exercise. Page 36
37 Tracking Prod_MidTier 1. Within the same view when you scroll down (below the Security Group firewall Topology), you are able to see the following security event information for Prod_Web: A: Events - Showing any changes for Prod_MidTier (direct or indirect) and the impact that these changes bring to this security group B: Current Security Group Configuration and Firewall Rules Count will also provide further assistance to manage the endpoints. C: Visibility of the Virtual Machines in Security Groups ensure that we manage our workloads and segmentation with the correct level of efficiency. D: Making use of the Indirect Firewall Rules will ensure you understand the inherited impact and the relationship leading to Prod_Web. E: Direct Firewall Rules - NOTE: The blue links will expose further detail for each firewall segment. Page 37

38 this module explained and followed the traffic flow between Subnets and or VLAN/ VXLAN for Prod_MidTier and we understand the analysis that make up firewall rules. The information for a specific segmentation of a Virtual Machine in Prod_MidTier can be viewed using the the logical switch information for Prod_MidTier. 2. Click on Lab-Midtier (VM's in Security Group>Logical Switches>Lab-Midtier) a new TAB will open at the top of the screen. Lab-Midtier 1. Hover (do not click) over (1) Lab-Midtier-1 to gain focus in order to generate the path. Do not click on any of the bubbles, as they are used for reference only. This is the complete flow of Prod-Web-9 (Example) to see how a flow is tracked from overlay to underlay across Prod-Web Page 38
39 A - The host details for Lab-Midtier-1 - ddc1-pod2esx035.dm.democompany.net B - The machine name within Lab-Midtier - Lab-Midtier-1 C - DVS Switch D - VXLAN - Lab-Midtier E - 1st VMKNIC for DDC-1 host F - DVS Switch Port G - Finally showing the L3 Switch (Arista) 2. When you are done with the current view, close this tab in Chrome and return to the original view. Firewall Rule - Tracking Using the search bar we will demonstrate how you can track any firewall rule in your environment. This is only one example of how we can search for security related objects in one easy statement and also export the results. Port Search 1. Type into the search bar Firewall rule where action ='ALLOW' and Port=443 (the search bar uses "Auto Fill" and predictive text will appear as you type). 2. Click search to continue. As you type notice all the different permutations of queries that can be assembled. Page 39


40 Export Firewall Rules Take some time to understand and get familiar with Firewall Rule search possibilities and the insight this can offer. 1. Do not click - The result is grouped for convenience and allows the user to query each rule individually. This is a live link that will expose further information. 2. Do not click - The entire report can be exported by using the Save as CSV option at the top right hand corner of the screen, but we will not export any information at this point. 3. For the next step we will return to the top search bar. Firewall Rule Membership Change Using the vrealize Network Insight search bar at the top of the screen we will focus on a time based search to see what Firewall Membership Changes occurred during a selected period. This will point out any changes made directly or indirectly as a result of membership changes. This is extremely useful for auditing and troubleshooting. Page 40

41 1. Type Firewall Rule Membership Change 2. Select the Date/Time window. 3. Click Between. Select Date range from June,30 to Jul 31 (using static data this will ensure you see all the changes). 4. Click search. Audit Rule - Firewall Rule Membership Changes The search now displays the result of all the changes made to firewall rule membership during the preset date range. This is pivotal to the audit change tracking process to understand exactly why, when and how Firewall rules changed. The changes can now easily be tracked, audited and also exported, following any of the live links in blue. Page 41

42 User-defined Event Continuing within the same screen, users can create alerts to notify internal and external entities of any changes. The alert feature is available through any view that displays the alert icon. Although the alert can be configured for this lab, the results will not be actioned as this is static data only. This section will show how easy it is to report on any Firewall Rule memberships changes. The option for alerting will be immediately, within 1 hour or as a daily digest. 1. Click the Notifications icon to create an event. The notifications screen will popup. 2. Notification and parameters can be adjusted as required. Populate them with your own preference as we will need to have information in order to save the alert and view in later steps. 3. Once completed click save. Page 42

43 Settings You can view any of your previously configured User-defined Events in order to edit or activate the Event parameters by using the settings page. Changes can be configured to notify members of the event group based on the user preference. The previous event that you created can now be tracked by using the search bar at the top of the screen. 1. Click in the search bar and type Settings. 2. Click User-defined Events (your alert is noted in this section as it was based on the original search and alert notification "Firewall rule membership change"). 3. Info Only - Do not click - View / Edit / Activate any notifications. Note that we have 2 types of notification, User-defined and System Events. 4. Click the System Events. Page 43
44 System Notifications System Events consist of 103 default alerts that are pre-configured. Scroll down the list to see all the options and what is deemed to be a standard system event notification. Each Notification can be used to alert administrators or users of that group. By default all System Notifications are set to never notify (this can be changed to immediately, within 1 hour or as a daily digest). This concludes this module. Please continue to the next module. Page 44
45 Conclusion Congratulations on completing Module 1. In this module we introduced the minimum required steps in order to facilitate Microsegmentation. This module further demonstrated how we achieve day zero readiness, track, report and alert on each individual object or group of objects in Real Time. Using the East-West traffic in this module, vrealize Network Insight highlighted the ease of acquiring network analysis and using this to automatically generate firewall rules for both "Green" or "Brown field" deployments. Key facts to remember as demonstrated in this module: Persistence: Security must be consistent in the face of constant change Ubiquity: Security must be available everywhere Extensibility: Security must adapt to new situations For additional information about the functionality showcased in this module visit Please close the Chrome Web browser. This concludes this module, please continue to the next module. For More Information How to End Lab To end your lab click on the END button, else click on a module to from the list above to continue. Page 45
46 Module degree Visibility across Virtual and Physical Networks (45 minutes) Page 46
47 Introduction vrealize Network Insight includes advanced analytics that can collect and display configuration data from all the components involved in the overlay and underlay of the network. Data is collected in realtime. vrealize Network Insight presents this via a smart user interface, and simplifies the determination of problems, as well as the visibility of firewall and network configurations. vrealize Network Insight presents this in a smart user interface, and makes problem determination and visibility of the firewall and network configurations very easy This Module contains the following lessons: 360 Network Visibility and Troubleshooting Natural language search Page 47
48 360 Network Visibility and Troubleshooting This section contains the following lessons: 360-degree view of data flow between two VM objects Natural language search Open Google Chrome 1. Open Chrome on the Control Center Desktop. Note: Internet Explorer will not work and is not certified to be used with vrealize Network Insight at the time of this release. Select vrealize Network Insight Favorite 1. Select the vrni Shortcut on the favorites Bar (if vrealize Network Insight did not load automatically). Page 48


49 vrealize Network Insight - Login Screen Login to the portal. 1. Username : admin@corp.local. 2. Password: VMware1! 3. Click Login to continue. Path and Topology This module will utilize the "Path and Topology" feature in vrealize Network Insight to get a 360-degree visibility into our network scenario. The "Path and Topology" view can Page 49

50 also extend to host, L3 networks, security groups etc, but in this module we will only be focusing on the path. From the main console: 1. Click on "Path and Topology". 2. Click on "Path". Path - Select source and destination In the pop-up box: 1. Click on the grey field below "Source". 2. Type "dba" into the source field, and "DBAdmin-VM1" will appear. 3. Click on "DBAdmin-VM1" to select it. Page 50

51 Path - source and destination continued After selecting the source machine, the destination box will automatically appear. 1. Type "prod" in the destination field, and the list of available options will appear. 2. Select "Prod-Db-2". Note: The destination could also be an ip-address or Internet, but in this lab we are going to use a VM. Page 51


52 Path - source and destination continued 1. Click on Submit. Searching for path Based on the VMs we selected in the wizard in our previous steps, the search field is now pre-populated with a search string. As an alternative to using the wizard we can also do manual searches. Do not change any parameters in the search field, and please continue to the next step. Page 52

53 VM Path Topology and VM Underlay The topology involves both Layer 3 and Layer 2 components and consists of two detailed views. Page 53

54 1. VM Path Topology: This view details the routers, Edges, or Logical Distributed Routers (LDRs) that are involved in the VM to VM network path, and provides the complete routing and NAT information 2. VM Underlay: ( The VM Underlay section that is on the right side of the VM Path topology shows the underlay information of the VMs involved and their connectivity to the top of the rack switches and the ports involved) In the field named "VM Path Topology": 1. Click on the three dots in the top right corner of the field. 2. Click Maximize. The view will change and the route will be drawn on the map. Page 54

55 VM Path Topology - Path Details In this view we will get a 360-degree view of both the physical and the virtual network. We will see the path of the traffic between two virtual machines. The black arrow at the top of the map will indicate the flow direction of the traffic. In this use case from "DBAdmin-VM1" to "Prod-Db-2". On the right hand side path details indicates the steps we pass through in each hop of the path. The logical flow includes both physical and virtual elements, displaying both overlay and underlay components. 1. Scroll through the path details on the right hand side to verify the different hops in the path. Notice that we have items such as VMs, physical switches, virtual switches, routers and NICs in the list of details. Page 55

56 Component Overview On the VM topology map: 1. Click on the top left icon marked with a red square - the Virtual Machine "DBAdmin-VM1". Virtual Machine - Details Page 56

57 A pop-up box will appear with the Virtual Machine details in it. This information includes a lot of details made available by VMware Tools. We can for example see networkinformation and the physical host in these details. A - Please spend some time on getting an overview of the information available in this view. B - Please note that the Firewall Status indicates "Unknown". In this scenario there is no NSX firewall utilized in the VM, so vrealize Network Insight displays "Unknown" as the status. If NSX components were utilized, but they were malfunctioning, an error message will appear. 1. When done reviewing, close the pop-up windows by clicking on the (X) in the top right corner. Physical ESXi Hosts We are now going to look at the physical host running ESXi. The large green blocks indicate the ESXi hosts (A) and (B) 1. Click on the large green field on the left side of the map marked in the picture with a red square.this will select the host where "DBAdmin-VM1" is running. Page 57

58 Host - Details A pop-up box will appear that contains the physical ESXi host. A - Spend some time to review what information is available from the host. Please do not click on any of the links. B - Notice that we receive information from both the Chassis and the Blade that this ESXi host is running on. In a real life environment we could click on the links to get detailed information about the physical environment through the links. C - Note that there are no NSX components on the host. For example we can see that the "Control Plane Sync Status" is unknown, and the "Number of VTEP's" is When done reviewing, click on the (X) in the top right corner. Page 58

59 DVPG on the map We are now going to look at the DVPG (Distributed Virtual Port Group) the VM uses to connect to the network. 1. On the map, click on the little blue box marked by a red square on vlan-629. DVPG A pop-up box will appear that contains the DVPG details. A - Spend some time review what information is available from the object. Please do not click on any of the links. Page 59

60 B - Notice that IPFIX is enabled 1. When done reviewing, click on the (X) in the top right corner. VLAN-629 on the map This is a brownfield network as indicated by the physical network components currently displayed on the map. 1. On the map, click on the grey line marked by a red square on vlan-629. VLAN Network A pop-up box will appear that contains the physical VLAN details. Page 60
61 A - Spend some time to review what information is available from the object. Please do not click on any of the links. B - Notice the VLAN ID. This is the actual VLAN in use. C - VM Count states 12. This is the number of VMs located on this VLAN in the entire environment. D - Under Hosts we can see that this is 28 (27+1). This is the amount of hosts that has a connection to this vlan in the entire environment. 1. When done reviewing, click on the (X) in the top right corner. Switch ports on the map 1. From the map, click on the icon marked by a red square to select the Switch Port for the VM. Page 61

62 Switch Port A pop-up box will appear that contains the Switch Port details. In this view we are purely are looking at layer 3 and the connectivity to those layer 3 devices. Later in this module we will see some of the layer 2 devices. A - Spend some time to review what information is available from the object. Please do not click on any of the links. B - In this view we can see the physical NIC the traffic is transmitted from and received to. In this scenario it is a NIC on a UCS fabric. We can also see the VLANs, Interface speed, port and other details on the NIC. 1. When done reviewing, click on the (X) in the top right corner of the pop up box. Page 62
63 Physical VRF on the map 1. From the map, click on the icon marked by a red square to access the Physical VRF details. Page 63
64 VRF - Physical Switch A pop-up box will appear that contains the Physical VRF details. A - Spend some time to review what information is available from the object. Please do not click on any of the links. B - In this scenario, the first hop in the physical network perspective happens to be a Cisco Nexus We are gathering all of the configuration data, routing tables and routing interface information from this device. 1. When done reviewing, click on the (X) in the top right corner of the pop-up box. Page 64
65 VRF - continued 1. From the map, click on the icon marked by a red square to access the next Physical VRF in the path. Page 65
66 VRF - Physical Router A pop-up box will appear that contains the Physical VRF details. In this scenario, the second hop in the physical network perspective is a Palo Alto router. In this view we will see the routing table as well as firewall rules. The vrealize Network Insight platform is so powerful, that these firewall rules are the applicable firewall rules between the two objects we searched for. There is probably going to be thousands of firewall rules in a normal network, but these are the firewalls affecting the communication between the two selected VMs. Page 66
67 A - Spend some time to review what information is available from the object. Please do not click on any of the links. 1. When done reviewing, click on the (X) in the top right corner of the pop up box. Note: The Palo Alto integration showcased is in beta testing. VRF - continued 1. From the map, click on the icon marked by a red square to access the next Physical VRF in the path. Page 67
68 VRF - Physical Switch A pop-up box will appear that contains the Physical VRF details. A - Spend some time to review what information is available from the object. Please do not click on any of the links. B - In this scenario, the third hop in the physical network perspective is an Arista device. There is information available on routing, gateways, interfaces etc. These details showcase that we can monitor devices from a multitude of vendors in case we are changing from one vendor to another. 1. When done reviewing, click on the (X) in the top right corner. Page 68
69 Accessing the virtual infrastructure The next two steps in the path (as shown by arrows) are the same as we looked at previously in this module. We are not going to look at the details on them in this scenario as they are similar to the ones previously discussed. A - Hover/move the mouse over the icons marked with red arrow A without clicking on the icon. Notice the descriptive name. B - Hover/move the mouse over the icons marked with red arrow B without clicking on the icon. Notice the descriptive name. 1. From the map, click on the icon marked by a red square to access the next VRF in the path. Page 69
70 VRF - NSX Provider Edge 1 A pop-up box will appear that contains the Physical VRF details. A - Please spend some time to review what information is available from the object. Please do not click on any of the links. B - The components we are looking at after the Arista device (described in previous steps) is an NSX Edge cluster, or a host associated with an Edge cluster. The component we have selected is the NSX Edge VM named Provider-Edge 1. It has an uplink over VLAN 10 from the physical network (as shown in the map). C - In the details we can see the routing table and routing interface details for this particular VRF. 1. When done reviewing, click on the (X) in the top right corner of the pop-up box. Page 70

71 VXLAN on the map 1. On the map, click on the blue line marked by a red square to access the VXLAN details. VXLAN Network A pop-up box will appear that contains the VXLAN details. Page 71
72 A - Spend some time to review what information is available from the object. Please do not click on any of the links. B - We can see the VXLAN number (Segment ID), Underlay VLAN IDs, Subnet and Underlay Subnet C - We also have visibility into what Primary Controller it is utilizing, Hosts and VTEPs. D - Hover/move the mouse cursor over the text [38 more] to see the hosts associated with this VXLAN, Do not click on the blue text. E - Hover/move the mouse cursor over the text [82 more] to see the VTEPs associated with this VXLAN. Do not click on the blue text. 1. When done reviewing, click on the X in the top right corner of the pop-up box. VRF - LDR 1. From the map, click on the icon marked by a red square to access the VRF details. Page 72
73 VRF - LDR-Corporate A pop-up box will appear that contains the VRF details. From here we hit our In-kernel network. A - Spend some time to review what information is available from the object. Please do not click on any of the links. B - Notice the distributed router name. We are using this device to access our corporate network. C - This device is going to route for us to a different interface. The interface is going to route to the interface on the Prod-DB Network as the next step in the path (this will be illustrated in the next step). 1. When done reviewing, click on the (X) in the top right corner of the pop-up box. Page 73

74 Routing - NSX Firewall The traffic is routed through the VRF onto the Prod-DB network over to the next physical host (as shown with arrows). The first device it will hit on the virtual network on the physical host is the Firewall. Please notice that there are two firewalls next to the VM. One Firewall from Palo Alto and one Firewall from NSX. 1. From the map, click on the icon marked by a red square to access the NSX Firewall details (the top one of the two). Page 74
75 Firewall - NSX A pop-up box will appear that contains the Firewall details. A - Spend some time to review what information is available from the object. Please do not click on any of the links. 1. When done reviewing, click on the (X) in the top right corner of the pop-up box. Page 75


76 Redirect on the map - PAN Firewall Please notice that there are two firewalls next to the VM. One Firewall from Palo Alto and one Firewall from NSX. We are now going to look into the details of the lower Firewall. 1. From the map, click on the icon marked by a red square to access the Palo Alto Firewall details (the lower one of the two). Firewall - PAN Page 76
77 In this scenario we also have an Palo Alto VM based offloading firewall. The redirect feature allows firewall rules to be transferred between the NSX firewall and the PAN Firewall. 1. When done reviewing, click on the (X) in the top right corner of the pop up box. Reversing the analysis 1. In the section marked by a red square in the picture click on the arrow pointing left. The route on the map will change. Page 77
78 Reversing the analysis continued A - The analysis will now be done in the opposite direction. Please note that the path now changes. Instead of going through Provider-Edge 3 the traffic is now routed through Provider-Edge 2. This is exactly as the traffic will work in the real life. Please continue to the next step to conclude this module. Page 78

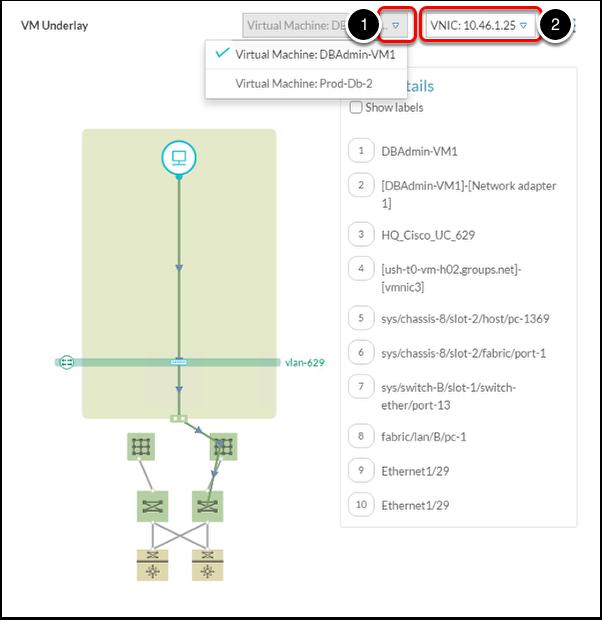
79 VM Underlay Lets now focus on VM Underlay. 1. The VMUnderlay section that is on the right side of the VM Path topology shows the underlay information of the VMs involved and their connectivity to the top of the rack switches and the ports involved. 2. The VM Underlay path topology is shown here. 3. The components are labeled under Path Details Page 79
80 Page 80

81 1. In this section, the drop-down list at the top shows the endpoint VMs and the active VMs at the edges. 2. For each edgevm, the neighbouring drop-down list shows the ingress and the egress interface IP addresses. 1. From the previous step we selected the Prod-DB-2 Virtual Machine 2. Which changes the focus to corresponding Interface IP Address (VNIC) 3. Shows the visual map (Path topology) of all the path objects 4. Path details shows the labels and list the components. This concludes this module. Please continue to the next module. Page 81
82 Conclusion Congratulations on completing Module 2. This module has shown us that vrealize Network Insight is capable of tracing the flow of data between two objects throughout the network. vrealize Network Insight is providing us with a 360 degrees view of the virtual as well as the physical components in the path. With the map function and the details on the map it is very easy to get a quick overview of the components utilized in network communication. All the components in the map is based on a snapshot of real life data. Feel free to click on other icons shown in the map in this module before continuing to the next module to have a look at other components. For More Information For additional information about the functionality showcased in this module visit network insight. This concludes this module. Please continue to the next module. If you are looking for additional information, try one of these: Click on this link Or use your smart device to scan the QRC Code. Page 82
83 Proceed to any module below which interests you most. Module 1 - Micro-Segmentation and Security (30 minutes) Module degree Visibility across Virtual and Physical Networks (45 minutes) Module 3 - Advanced NSX Management & Operations (45 minutes) (30 minutes) How to End Lab To end your lab click on the END button, else click on a module to from the list above to continue. Page 83
84 Module 3 - Advanced NSX Management & Operations (45 minutes) Page 84
85 Introduction Introduction vrealize Network Insight ensures that we have full visibility from an overlay and underlay perspective and in this module focus on advanced operations of NSX with vrealize Network Insight. Its important to note that the vrealize Network Insight provides a real time view and a historical view. The integration is not a simple SNMP query, but advanced CLI and Metadata information gathered in real time for NSX. This Module contains the following lessons: Operational guidance for NSX Manager. Advanced NSX Management & Operations Interactive Simulation. Page 85
86 NSX Advanced Management Operations Lab Status Check 1. Make sure the Lab Status displays Ready before continuing. Close browser sessions from previous modules. Open Google Chrome 1. Open Chrome on the Control Centre Desktop. Note: Internet Explorer will not work and is not certified to be used with vrealize Network Insight at the time of this release. Page 86
87 Select vrealize Network Insight Favorite 1. Select the vrni Shortcut on the favorites Bar (if vrealize Network Insight did not load automatically) vrealize Network Insight - Login Screen Login to the portal 1. Username : admin@corp.local 2. Password: VMware1! 3. Click Login to continue Search Bar - NSX Manager Using the search bar on the entry screen Page 87
 and we can immediately see that we have 50 problems associated with this endpoint. 1.")
88 1. Type NSX Manager (this will list three NSX Managers 2. Click Search. NSX Manager Information The result now shows the NSX Manager ( ) and we can immediately see that we have 50 problems associated with this endpoint. 1. Click on the NSX Manager address to expose the layout and detailed information. Page 88
 makes it easy to filter on demand.")
89 Timeline - Visual Build-up Explore information only - Do not click A - Starting with the Timeline we can manipulate the results by simply dragging the slider, but by default the current time results will be displayed on entry. The slider and drop down (next to 1 day) makes it easy to filter on demand. B - The Properties give a clear understanding of the NSX Managers current configuration (vrealize Network Insight accommodate multiple NSX managers) C - Looking at the NSX Checklist Rules - ALL, we can scroll up and down to view each point in the checklist that is used to monitor/validate against the NSX Manager. D - Because vrealize Network Insight supports multiple NSX managers and multiple NSX controllers, this is an important visual understanding of the Topology. Each object can be queried individually within the same screen. E - NSX Problems will be key to understanding the issues for NSX. Page 89

90 Topology - Focus on the NSX Controller The logical view of the NSX Topology provides live links to each component in the construct to be queried in real time. Topology layout displays all the related NSX services bound to the NSX Manager, including Clusters and hosts. The red triangle on all three NSX controllers indicates possible issues that may impact the NSX environment either as a starting point or a result thereof. We can now query each object for detailed information 1. Click on the NSX controller (Look at each controller until you find the controller starting with NSX_Controller_5b6c6c8d-4d71... as they do change order). Page 90

91 NSX Controller - Detail A - The controller query displays detailed information about controller-1 and relevant configuration. This screen will help identify the Status, Version, Upgrade Availability and many other critical identifiers of the NSX Controller at a quick glance including any issues. B - The immediate issue on this NSX controller is also pointed out with a red triangle indicating that we have a control plane sync issue. Tracking the issue can be further investigated by expanding (clicking on the red triangle) to view detailed information. We will not be investigating this problem further in this exercise. 1. Click the close sign (x) to continue. Page 91

92 Topology - Explained Note: The Topology for the NSX environment will not show any load balancing device status information in this release. 1. Click the edge VM's icon to see detailed information about the edge services. Page 92
93 Provider Edge Rendering a complete view of the provider edge services and the associations we can investigate all the edge related activities. 1. Click the blue link Provider Edge 4. The problem Icon can be used to further obtain information about the Provider-Edge 4. This will highlight a critical condition due to a possible network disruption of this edge device as it is no longer in a serving state. Page 93
94 Routers Provider Edge 4 This section lays out detailed root cause analysis for Routers Provider Edge 4 Return to Search View - NSX Manager 1. Now use the Chrome Back button, click once to return the the NSX Manager information screen step. Page 94

95 Infrastructure Problems - Warning /Moderate Scroll down to "Infrastructure Problems" Section. 1. Click and select the Warning/Moderate to view problem areas. Warning/Moderate Issues 1. Use the blue icon + to expand the detailed view of the 'Logical networking out of sync between host and NSX Controller'. Page 95

96 Warning/Moderate Issues (Continued) When you expand the details you can analyse full detail of warning. In this view vrealize Network Insight is also showing you recommendations on how you would resolve this issue, which makes troubleshooting and root cause analysis very easy. 1. Click the close sign (x) to continue. Page 96
97 Hands-on Labs Interactive Simulation: Advanced NSX Management & Operations This part of the lab is presented as a Hands-on Labs Interactive Simulation. This will allow you to experience steps which are too time-consuming or resource intensive to do live in the lab environment. In this simulation, you can use the software interface as if you are interacting with a live environment. 1. Click here to open the interactive simulation. It will open in a new browser window or tab. 2. When finished, click the Return to the lab link to continue with this lab. Page 97
98 Conclusion Congratulations on completing Module 3. This module demonstrated the vrealize Network Insight capability of advanced management operations. vrealize Network Insight provides an in-depth analysis of the virtual as well as the physical components associated with NSX (underlay and overlay). For More Information If you are looking for additional information, try one of these: Click on this link Or use your smart device to scan the QRC Code. Proceed to any module below which interests you most. Module 1 - Micro-Segmentation and Security (30 minutes) Module degree Visibility across Virtual and Physical Networks (45 minutes) Module 3 - Advanced NSX Management & Operations (45 minutes) Module 4 - Manage Security for Public Clouds (AWS) (30 minutes) Page 98
99 How to End Lab To end your lab click on the END button, else click on a module to from the list above to continue. Page 99
100 Module 4 - Manage Security for Public Clouds (AWS) (30 Minutes) Page 100
101 Introduction Enterprise IT needs visibility into the network and security status of their workloads, whether hosted on premises, or within AWS. While many AWS workloads are sandboxes for application development teams (DevOps), it is important to analyze these workloads. Increasingly, public cloud workloads are also fulfilling mission critical production needs for many organizations. Enterprise IT must be ready to determine the best location, security posture, and bandwidth allocation when deploying workloads. Having traffic pattern details as well as security analysis and recommendations readily available, helps organizations make the ideal hosting decisions to meet their business needs. vrealize Network Insight (vrni) Supports Amazon Web Services (AWS) Public Cloud. The vrni traffic monitoring features provide visibility into native AWS constructs such as Virtual Private Clouds, VMs, Security Groups, firewall rules, and tags. vrni also analyzes AWS traffic flows to provide security and micro-segmentation views of cloud workloads. This means youll be able to plan micro-segmentation and understand traffic patterns using data collected from your AWS instances. This Module contains the following lessons: Introduction to Managing Security for Public Clouds (AWS) Page 101

102 Introduction to Managing Security for Public Clouds (AWS) Lab Status Check 1. Make sure the Lab Status displays Ready before continuing. Close browser sessions from previous modules. Open Google Chrome 1. Open Chrome on the Control Centre Desktop. Note: Internet Explorer will not work and is not certified to be used with vrealize Network Insight at the time of this release. Select vrealize Network Insight Favorite 1. Select the vrni Shortcut on the favorites Bar (if vrealize Network Insight did not load automatically) Page 102
103 vrealize Network Insight - Login Screen Login to the portal 1. Username : admin@corp.local 2. Password: VMware1! 3. Click Login to continue AWS Configuration Lets review the AWS VPC setup for the purpose of this lab. 1. We have an on premise instance of vrealize Network Insight managing AWS. 2. There are two VPCs i.e. CRM and Common Services. Page 103

104 3. VPC CRM consists of CRM Application which comprises of 3 tiers i.e. Web, APP and DB. 4. Internal users of Company can access Web Tier of the CRM on 80 internally via Jump-box. 5. Web tier talks to App tier on port App tier talks to DB tier on port Web tier is open for internal datacenters VM on 80 port. 8. From Jump-box in VPC: CRM all virtual machines have ssh access on port All tiers of VPC:CRM talks to DNS server on 53 and LogServer on 514 on VPC: Common Services. 10. This means connection to DB to Log Server (used for backup services) must exist as configured by the Administrator but this in fact is the problem area where our focus will be. Plan Security - AWS Cloud vrealize Network Insight extends micro-segmentation planning to AWS constructs. The 'CRM' Application in AWS VPC has already been created for you. Application creation steps have been discussed in Module 3. Page 104

105 1. On the vrealize Network Insight, Click on Plan Security From Plan Security dialogue box under Entity select Page 105

106 1. Application 2. CRM 3. Click Analyze We can now visualize the three tier CRM Application in AWS in one VPC. We Shall explore the three Tier System Logic in proceeding steps. 1. Please note that Micro-Segments are already filtered by Tier 2. Web (Web tier talks to App tier on port Internal users of organisation can access Web Tier of the CRM Application on port 80 internally) 3. App (App tier talks to DB tier on port 3306) 4. DB ( DB tier talks to Log Servers ) - This is the problem area we are going to explore. All tiers of first VPC talks to DNS server on port 53 and LogServer on port 514 of Second VPC Page 106
107 Exploring the Three Tier Application - Step by Step We shall now explore the three their application setup to understand the security and communication posture. Page 107
108 1. Hover over to App Micro-segment. 2. Click on Keep Focus. 3. Click on the Yellow line to explore the flows. This will reveal flows from Web to App. Page 108
109 1. The App tier talks to DB tier on Port Click X to continue. Page 109

110 1. Hover over to App Micro-segment. 2. Click on Keep Focus. 3. Click on the Blue line to explore the flows. This will reveal flows from App to DB. Page 110
111 1. The App tier talks to DB tier on Port Click X to continue. Page 111

112 1. Hover over to App Micro-segment. 2. Click on Keep Focus. 3. Click on the Yellow Line to explore the flows. This will reveal flows from DC Virtual to App. Page 112

113 1. DC Virtual (jump box) talks to App tier on Port Click X to continue. Page 113

114 1. Hover over to App Micro-segment. 2. Click on Keep Focus. 3. Click on the Blue line to explore the flows. This will reveal flows from App to Shared Virtual. Page 114
115 1. The App tier talks to Shared Virtual on Port 53 and 514 respectively. 2. Click X to continue. Page 115
 but the flow reveals that there is only one service i.e. port 53 aws-dns- Server.")
116 1. Hover over to DB Micro-segment. 2. Click on Keep Focus. 3. Click on the Blue line to explore the flows. This will reveal flows from DB to Shared Virtual. 1. By design the DB should be pushing logs to 'aws-log-server' i.e. on port 514 (Syslog) but the flow reveals that there is only one service i.e. port 53 aws-dns- Server. Effectively, no communication to syslog server (which is the back up service). 2. Click X to continue. Firewall Queries for CRM Application To further troubleshoot the issue the administrator executes three firewall queries to establish why DB to Shared Virtual does not have flow(s) for port 514 (syslog) Page 116


117 1. On Chrome web browser, right click 2. Select duplicate from the the menu 1. Remove the current search string which has been copied when duplicating previous tab and type new search query: firewall action of flows where dst vm = 'aws-log-server' This will return 5 results i.e. 4 Allow (for web and midtier) and 1 Deny (for DB) 2. Click Search 3. click on the DENY checkbox so we can focus on the deny rule We can see a DENY rule which is preventing crm-databse to communicate with awslog-server on port 514. Which indicates that AWS Admin forgot to add rule to allow traffic from (Database) crm-database to (syslog server) aws-log-server. Page 117

118 1. On Chrome web browser, right click. 2. Select Duplicate from the the menu. Page 118

119 1. Remove the current search string which has been copied when duplicating previous tab and replace it by typing new search string: aws firewall rule where src vm = 'crm-web1' and dst vm = 'aws-log-server'. 2. Click Search 3. This will return 3 results i.e. 1 Inbound and 2 Outbound rules. The result of this query validates the communication from crm-web1' to 'aws-log-server' 1. On Chrome web browser, right click. 2. Select duplicate from the the menu. 1. Remove the current search string which has been copied when duplicating previous tab and replace it by typing new search string: aws firewall rule where src vm = 'crm-database' and dst vm = 'aws-log-server'. 2. Click Search. 3. This will return 2 results for Outbound rules, further explaining the firewall rule behaviour from crm-database to aws-log-server. Page 119
VMware AirWatch: Directory and Certificate Authority
 Table of Contents Lab Overview - HOL-1857-06-UEM - VMware AirWatch: Directory and Certificate Authority Integration... 2 Lab Guidance... 3 Module 1 - Advanced AirWatch Configuration, AD Integration/Certificates
Table of Contents. VMware AirWatch: Technology Partner Integration
 Table of Contents Lab Overview - HOL-1857-08-UEM - Workspace ONE UEM - Technology Partner Integration... 2 Lab Guidance... 3 Module 1 - F5 Integration with Workspace ONE UEM (30 min)... 9 Introduction...
Table of Contents HOL-1701-CHG-5
 Table of Contents Lab Overview: vrealize Operations Application Monitoring: Challenge Lab... 2 Lab Overview... 3 Lab Guidance... 5 Module 1 - Configuring a Custom Application (15 minutes)... 10 Introduction...
Using vrealize Network Insight. VMware vrealize Network Insight 3.7
 Using vrealize Network Insight VMware vrealize Network Insight 3.7 You can find the most up-to-date technical documentation on the VMware website at: https://docs.vmware.com/ If you have comments about
Table of Contents HOL NET
 Table of Contents Lab Overview - - VMware NSX Multi-Site and SRM in an Active- Standby Setup... 2 Lab Guidance... 3 Lab Introduction... 9 Module 1 - Review Pre-Configured Multi-Site NSX and Configure Site-Local
Using vrealize Network Insight. VMware vrealize Network Insight 3.6
 Using vrealize Network Insight VMware vrealize Network Insight 3.6 You can find the most up-to-date technical documentation on the VMware website at: https://docs.vmware.com/ If you have comments about
Using vrealize Network Insight. VMware vrealize Network Insight 3.5
 VMware vrealize Network Insight 3.5 You can find the most up-to-date technical documentation on the VMware Web site at: https://docs.vmware.com/ The VMware Web site also provides the latest product updates.
Table of Contents HOL-1757-MBL-6
 Table of Contents Lab Overview - - VMware AirWatch: Technology Partner Integration... 2 Lab Guidance... 3 Module 1 - F5 Integration with AirWatch (30 min)... 8 Getting Started... 9 F5 BigIP Configuration...
VMware AirWatch - Workspace ONE, Single Sign-on and VMware Identity Manager
 VMware AirWatch - Workspace ONE, Single Sign-on and VMware Identity Table of Contents Lab Overview - HOL-1857-03-UEM - Workspace ONE UEM with App & Access Management... 2 Lab Guidance... 3 Module 1 - Workspace
vrealize Network Insight User Guide
 vrealize Network Insight 3.0 This document supports the version of each product listed and supports all subsequent versions until the document is replaced by a new edition. To check for more recent editions
Table of Contents HOL-1703-SDC-4
 Table of Contents Lab Overview - - VMware NSX: Installation and Configuration...2 Lab Guidance... 3 Module 1 - NSX Manager Installation and Configuration (15 Minutes)... 6 Introduction... 7 Hands-on Labs
vrealize Network Insight User Guide
 vrealize Network Insight 3.3 This document supports the version of each product listed and supports all subsequent versions until the document is replaced by a new edition. To check for more recent editions
vrealize Network Insight Installation Guide
 vrealize Network Insight Installation Guide vrealize Network Insight 3.1 This document supports the version of each product listed and supports all subsequent versions until the document is replaced by
Installing vrealize Network Insight. VMware vrealize Network Insight 3.3
 VMware vrealize Network Insight 3.3 You can find the most up-to-date technical documentation on the VMware Web site at: https://docs.vmware.com/ The VMware Web site also provides the latest product updates.
Installing vrealize Network Insight
 vrealize Network Insight 3.4 This document supports the version of each product listed and supports all subsequent versions until the document is replaced by a new edition. To check for more recent editions
vrealize Network Insight Installation Guide
 vrealize Network Insight Installation Guide vrealize Network Insight 3.3 This document supports the version of each product listed and supports all subsequent versions until the document is replaced by
NSX-T Data Center Migration Coordinator Guide. 5 APR 2019 VMware NSX-T Data Center 2.4
 NSX-T Data Center Migration Coordinator Guide 5 APR 2019 VMware NSX-T Data Center 2.4 You can find the most up-to-date technical documentation on the VMware website at: https://docs.vmware.com/ If you
Quick Start Guide (SDN)
") NetBrain Integrated Edition 7.1 Quick Start Guide (SDN) Version 7.1a Last Updated 2018-09-03 Copyright 2004-2018 NetBrain Technologies, Inc. All rights reserved. Contents 1. Discovering and Visualizing
NetBrain Integrated Edition 7.1 Quick Start Guide (SDN) Version 7.1a Last Updated 2018-09-03 Copyright 2004-2018 NetBrain Technologies, Inc. All rights reserved. Contents 1. Discovering and Visualizing
Installing vrealize Network Insight. VMware vrealize Network Insight 3.5
 VMware vrealize Network Insight 3.5 You can find the most up-to-date technical documentation on the VMware Web site at: https://docs.vmware.com/ The VMware Web site also provides the latest product updates.
Table of Contents HOL NET
 Table of Contents Lab Overview - - VMware NSX-T Data Center Operations, Troubleshooting and API Consumption... 2 Lab Guidance... 3 Module 1 - NSX-T Datacenter Operations - Use Tools within NSX-T Datacenter
Table of Contents HOL CMP
 Table of Contents Lab Overview - - vrealize Orchestrator - Advanced... 2 Lab Guidance... 3 Module 1 - Creating Advanced vrealize Orchestrator Workflows (45 min)...9 Introduction... 10 Prompting User Input
Disclaimer This presentation may contain product features that are currently under development. This overview of new technology represents no commitme
 SAI2803BU The Road to Micro- Segmentation with VMware NSX #VMworld #SAI2803BU Disclaimer This presentation may contain product features that are currently under development. This overview of new technology
vrealize Operations Management Pack for NSX for vsphere 2.0
 vrealize Operations Management Pack for NSX for vsphere 2.0 This document supports the version of each product listed and supports all subsequent versions until the document is replaced by a new edition.
Table of Contents HOL SDC
 Table of Contents Lab Overview - - Site Recovery Manager: Data Center Migration and Disaster Recovery... 3 Overview of Site Recovery Manager... 4 Lab Overview... 5 Lab Guidance... 7 Module 1 - Lightning
Network Operations Analytics
 Network Operations Analytics Solution Guide Version 2.4.4 (Build 2.4.4.0.x) June 2016 Copyright 2012-2016 NetFlow Logic Corporation. All rights reserved. Patents Pending. Contents Introduction... 2 Solution
Table of Contents HOL CMP
 Table of Contents Lab Overview - - Monitor and Troubleshoot Your Infrastructure and Applications with vrealize Operations and vrealize Log Insight... 2 Lab Guidance... 3 Module 1 - Troubleshoot Infrastructure
Table of Contents HOL-1708-CHG-3
 Table of Contents Lab Overview - - Virtual SAN 6.2: Challenge Lab... 2 Lab Guidance... 3 Module Switcher... 8 Challenge 1 - Set Up a Virtual SAN Cluster (15 Mins)... 10 Introduction... 11 Module Switcher...
Quick Start Guide (SDN)
") NetBrain Integrated Edition 7.1 Quick Start Guide (SDN) Version 7.1 Last Updated 2018-07-24 Copyright 2004-2018 NetBrain Technologies, Inc. All rights reserved. Contents 1. Discovering and Visualizing
NetBrain Integrated Edition 7.1 Quick Start Guide (SDN) Version 7.1 Last Updated 2018-07-24 Copyright 2004-2018 NetBrain Technologies, Inc. All rights reserved. Contents 1. Discovering and Visualizing
Getting Started Guide. VMware NSX Cloud services
 VMware NSX Cloud services You can find the most up-to-date technical documentation on the VMware website at: https://docs.vmware.com/ If you have comments about this documentation, submit your feedback
Installing vrealize Network Insight. VMware vrealize Network Insight 3.6
 Installing vrealize Network Insight VMware vrealize Network Insight 3.6 You can find the most up-to-date technical documentation on the VMware website at: https://docs.vmware.com/ If you have comments
VMware vsphere 5.5: Install, Configure, Manage Lab Addendum. Lab 3: Configuring VMware ESXi
 VMware vsphere 5.5: Install, Configure, Manage Lab Addendum Lab 3: Configuring VMware ESXi Document Version: 2014-07-08 Copyright Network Development Group, Inc. www.netdevgroup.com NETLAB Academy Edition,
vcenter Operations Management Pack for NSX-vSphere
 vcenter Operations Management Pack for NSX-vSphere vcenter Operations Manager 5.8 This document supports the version of each product listed and supports all subsequent versions until the document is replaced
Lenovo ThinkAgile XClarity Integrator for Nutanix Installation and User's Guide
 Lenovo ThinkAgile XClarity Integrator for Nutanix Installation and User's Guide Version 1.0 Note Before using this information and the product it supports, read the information in Appendix A Notices on
Using vrealize Network Insight. VMware vrealize Network Insight 3.8
 Using vrealize Network Insight VMware vrealize Network Insight 3.8 You can find the most up-to-date technical documentation on the VMware website at: https://docs.vmware.com/ If you have comments about
Table of Contents HOL-PRT-1305
 Table of Contents Lab Overview... 2 - Abstract... 3 Overview of Cisco Nexus 1000V series Enhanced-VXLAN... 5 vcloud Director Networking and Cisco Nexus 1000V... 7 Solution Architecture... 9 Verify Cisco
Cisco Virtual Application Container Services 2.0 Lab v1
 Cisco Virtual Application Container Services 2.0 Lab v1 Last Updated: 02-SEP-2015 About This Solution Cisco Virtual Application Container Services (VACS) enables simplified deployment of Secure Application
Table of Contents HOL-SDC-1415
 Table of Contents Lab Overview - - IT Outcomes Security Controls Native to Infrastructure. 2 Lab Guidance... 3 Module 1 - Policy-Based Compliance... 5 Introduction... 6 Manage vcenter Server Virtual Machines...
Table of Contents HOL-SDC-1635
 Table of Contents Lab Overview - - vrealize Log Insight... 2 Lab Guidance... 3 Module 1 - Log Management with vrealize Log Insight - (45 Minutes)... 7 Overview of vrealize Log Insight... 8 Video Overview
Table of Contents HOL SLN
 Table of Contents Lab Overview - - Modernizing Your Data Center with VMware Cloud Foundation... 3 Lab Guidance... 4 Module 1 - Deploying VMware Cloud Foundation (15 Minutes)... 7 Introduction... 8 Hands-on
Cisco ACI and Cisco AVS
 This chapter includes the following sections: Cisco AVS Overview, page 1 Installing the Cisco AVS, page 5 Key Post-Installation Configuration Tasks for the Cisco AVS, page 14 Distributed Firewall, page
Installing vrealize Network Insight. VMware vrealize Network Insight 3.7
 Installing vrealize Network Insight VMware vrealize Network Insight 3.7 You can find the most up-to-date technical documentation on the VMware website at: https://docs.vmware.com/ If you have comments
Network Behavior Analysis
 N E T W O R K O P E R AT I O N S. S I M P L I F I E D. FORWARD ENTERPRISE HIGHLIGHTS Forward Networks is the leader in Intent-based Networking and network assurance to automate the analysis and verification
vrealize Operations Management Pack for NSX for Multi-Hypervisor
 vrealize Operations Management Pack for This document supports the version of each product listed and supports all subsequent versions until the document is replaced by a new edition. To check for more
Get Started with Cisco DNA Center
 About Cisco DNA Center, on page 1 Log In, on page 1 Log In for the First Time as a Network Administrator, on page 2 Default Home Page, on page 3 Use Global Search, on page 5 Where to Start, on page 6 About
VMware vrealize Network Insight Arkin Messaging Document
 Key Message Summary Launch Overview Organizations around the world are adopting an SDDC architecture based on VMware s virtualized infrastructure. Enterprise customers see the value of SDDC and SDN, but
Table of Contents HOL-1710-SDC-6
 Table of Contents Lab Overview - - What's New: vsphere with Operations Management.. 2 Lab Guidance... 3 Module 1 - What's New in vsphere (90 minutes)... 9 vcenter Server Appliance (VSCA)... 10 vcenter
Introducing VMware Validated Designs for Software-Defined Data Center
 Introducing VMware Validated Designs for Software-Defined Data Center VMware Validated Design 4.0 VMware Validated Design for Software-Defined Data Center 4.0 You can find the most up-to-date technical
VMware vcenter AppSpeed User s Guide AppSpeed 1.0 EN
 VMware vcenter AppSpeed User s Guide AppSpeed 1.0 EN-000213-01 VMware vcenter AppSpeed User s Guide You can find the most up-to-date technical documentation on the VMware Web site at: http://www.vmware.com/support/
VMware Integrated OpenStack Quick Start Guide
 VMware Integrated OpenStack Quick Start Guide VMware Integrated OpenStack 1.0.1 This document supports the version of each product listed and supports all subsequent versions until the document is replaced
Table of Contents HOL-1757-MBL-5
 Table of Contents Lab Overview - - VMware AirWatch: Mobile App Management and App Development... 2 Lab Guidance... 3 Module 1 - Introduction to AppConfig (30 minutes)... 8 Login to the AirWatch Console...
Introducing VMware Validated Designs for Software-Defined Data Center
 Introducing VMware Validated Designs for Software-Defined Data Center VMware Validated Design for Software-Defined Data Center 4.0 This document supports the version of each product listed and supports
LiveNX 7.4 QUICK START GUIDE (QSG) LiveAction, Inc WEST BAYSHORE ROAD PALO ALTO, CA LIVEACTION, INC.
 LiveAction, Inc WEST BAYSHORE ROAD PALO ALTO, CA LIVEACTION, INC.") LIVEACTION, INC. LiveNX 7.4 QUICK START GUIDE (QSG) LiveAction, Inc. 3500 WEST BAYSHORE ROAD PALO ALTO, CA 94303 1-1 LiveNX 7.4 Quick Start Guide (QSG) Introduction This LiveNX 7.4 Quick Start Guide will
LIVEACTION, INC. LiveNX 7.4 QUICK START GUIDE (QSG) LiveAction, Inc. 3500 WEST BAYSHORE ROAD PALO ALTO, CA 94303 1-1 LiveNX 7.4 Quick Start Guide (QSG) Introduction This LiveNX 7.4 Quick Start Guide will
Introducing VMware Validated Designs for Software-Defined Data Center
 Introducing VMware Validated Designs for Software-Defined Data Center VMware Validated Design for Software-Defined Data Center 3.0 This document supports the version of each product listed and supports
ForeScout CounterACT. Configuration Guide. Version 1.1
 ForeScout CounterACT Hybrid Cloud Module: VMware NSX Plugin Version 1.1 Table of Contents About VMware NSX Integration... 3 Use Cases... 3 Additional VMware Documentation... 3 About this Plugin... 3 Dependency
vrealize Operations Management Pack for NSX for vsphere 3.5.0
 vrealize Operations Management Pack for NSX for vsphere 3.5.0 This document supports the version of each product listed and supports all subsequent versions until the document is replaced by a new edition.
Table of Contents HOL-SDC-1412
 Table of Contents Lab Overview... 2 - IT Outcomes Data Center Virtualization and Standardization... 3 Module 1 - Lab Overview (15 Min)... 5 Physical Topology... 6 Application Topology... 8 Access the 3-Tier
BIG-IP Analytics: Implementations. Version 13.1
 BIG-IP Analytics: Implementations Version 13.1 Table of Contents Table of Contents Setting Up Application Statistics Collection...5 What is Analytics?...5 About HTTP Analytics profiles... 5 Overview:
LiveNX 8.0 QUICK START GUIDE (QSG) LiveAction, Inc WEST BAYSHORE ROAD PALO ALTO, CA LIVEACTION, INC.
 LiveAction, Inc WEST BAYSHORE ROAD PALO ALTO, CA LIVEACTION, INC.") LIVEACTION, INC. LiveNX 8.0 QUICK START GUIDE (QSG) LiveAction, Inc. 3500 WEST BAYSHORE ROAD PALO ALTO, CA 94303 1-1 LiveNX 8.0 Quick Start Guide (QSG) Introduction This LiveNX 8.0 Quick Start Guide will
LIVEACTION, INC. LiveNX 8.0 QUICK START GUIDE (QSG) LiveAction, Inc. 3500 WEST BAYSHORE ROAD PALO ALTO, CA 94303 1-1 LiveNX 8.0 Quick Start Guide (QSG) Introduction This LiveNX 8.0 Quick Start Guide will
Cisco ACI vcenter Plugin
 This chapter contains the following sections: About Cisco ACI with VMware vsphere Web Client, page 1 Getting Started with, page 2 Features and Limitations, page 7 GUI, page 12 Performing ACI Object Configurations,
vrealize Operations Management Pack for NSX for vsphere 3.0
 vrealize Operations Management Pack for NSX for vsphere 3.0 This document supports the version of each product listed and supports all subsequent versions until the document is replaced by a new edition.
Disclaimer This presentation may contain product features that are currently under development. This overview of new technology represents no commitme
 NET2810BE Feel the vrealize Network Insight Overcoming Operational Challenges with NSX and Underlay Networking VMworld 2017 Andreas Gautschi agautschi@vmware.com NSX and vrni Specialist Karl Fultz kfultz@vmware.com
VMware vrealize Operations for Horizon Administration. Modified on 3 JUL 2018 VMware vrealize Operations for Horizon 6.4
 VMware vrealize Operations for Horizon Administration Modified on 3 JUL 2018 VMware vrealize Operations for Horizon 6.4 You can find the most up-to-date technical documentation on the VMware website at:
ForeScout CounterACT. (AWS) Plugin. Configuration Guide. Version 1.3
 Plugin. Configuration Guide. Version 1.3") ForeScout CounterACT Hybrid Cloud Module: Amazon Web Services (AWS) Plugin Version 1.3 Table of Contents Amazon Web Services Plugin Overview... 4 Use Cases... 5 Providing Consolidated Visibility... 5 Dynamic
ForeScout CounterACT Hybrid Cloud Module: Amazon Web Services (AWS) Plugin Version 1.3 Table of Contents Amazon Web Services Plugin Overview... 4 Use Cases... 5 Providing Consolidated Visibility... 5 Dynamic
This guide details the deployment and initial configuration necessary to maximize the value of JetAdvantage Insights.
 HP JetAdvantage Insights Deployment Guide This guide details the deployment and initial configuration necessary to maximize the value of JetAdvantage Insights. 1. Overview HP JetAdvantage Insights provides
VMware vrealize Operations for Horizon Installation
 VMware vrealize Operations for Horizon Installation vrealize Operations for Horizon 6.4 Installation vrealize Operations for Horizon 6.4 This document supports the version of each product listed and supports
Planning and Preparation. VMware Validated Design 4.0 VMware Validated Design for Remote Office Branch Office 4.0
 VMware Validated Design 4.0 VMware Validated Design for Remote Office Branch Office 4.0 You can find the most up-to-date technical documentation on the VMware website at: https://docs.vmware.com/ If you
Add and Organize Devices
 This chapter contains the following topics: Add Devices to Prime Infrastructure, on page 1 Import Devices from Another Source, on page 7 Create Device Import CSV Files, on page 7 Add Devices Manually (New
HOW TO BUILD A NESTED NSX-T 2.3 LAB
 TECHNICAL WHITE PAPER -FEBRUARY 2019 HOW TO BUILD A NESTED NSX-T 2.3 LAB Explore the features and capabilities of VMware NSX-T Jim Streit, VCIX-NV NSX Senior Technical Account Specialist (TAS) VMware Professional
vrealize Hyperic Monitoring and Management Guide vrealize Hyperic 5.8.4
 vrealize Hyperic Monitoring and Management Guide vrealize Hyperic 5.8.4 You can find the most up-to-date technical documentation on the VMware website at: https://docs.vmware.com/ If you have comments
VMware vsphere 5.5: Install, Configure, Manage Lab Addendum. Lab 21: VMware vsphere Distributed Resource Scheduler
 VMware vsphere 5.5: Install, Configure, Manage Lab Addendum Lab 21: VMware vsphere Distributed Resource Scheduler Document Version: 2014-06-02 Copyright Network Development Group, Inc. www.netdevgroup.com
vrealize Suite Lifecycle Manager 1.0 Installation and Management vrealize Suite 2017
 vrealize Suite Lifecycle Manager 1.0 Installation and Management vrealize Suite 2017 vrealize Suite Lifecycle Manager 1.0 Installation and Management You can find the most up-to-date technical documentation
Agent and Agent Browser. Updated Friday, January 26, Autotask Corporation
 Agent and Agent Browser Updated Friday, January 26, 2018 2018 Autotask Corporation Table of Contents Table of Contents 2 The AEM Agent and Agent Browser 3 AEM Agent 5 Privacy Mode 9 Agent Browser 11 Agent
Administrative Training Mura CMS Version 5.6
 Administrative Training Mura CMS Version 5.6 Published: March 9, 2012 Table of Contents Mura CMS Overview! 6 Dashboard!... 6 Site Manager!... 6 Drafts!... 6 Components!... 6 Categories!... 6 Content Collections:
Table of Contents HOL-HBD-1301
 Table of Contents Lab Overview... 2 - vcloud Hybrid Service Jump Start for vsphere Admins...3 Module 1 - vcloud Hybrid Service: Architecture and Consumption Principles...5 vcloud Hybrid Service... 6 vcloud
VMware vrealize Operations for Horizon Administration. 20 SEP 2018 VMware vrealize Operations for Horizon 6.6
 VMware vrealize Operations for Horizon Administration 20 SEP 2018 VMware vrealize Operations for Horizon 6.6 You can find the most up-to-date technical documentation on the VMware website at: https://docs.vmware.com/
TECH SUMMIT START HERE
 TECH SUMMIT 2018 - START HERE Table of Contents 00 - Lab Introduction... 3 Accessing the Lab and Getting Support... 4 Kicking Things Off!... 6 vapp Architecture... 14 Labs Overview and Manuals Links...
Getting Started with ESX Server 3i Installable Update 2 and later for ESX Server 3i version 3.5 Installable and VirtualCenter 2.5
 Getting Started with ESX Server 3i Installable Update 2 and later for ESX Server 3i version 3.5 Installable and VirtualCenter 2.5 Getting Started with ESX Server 3i Installable Revision: 20090313 Item:
NetBrain POC Walk-Through
 NetBrain POC Walk-Through For OE 4.1 Dynamic Documentation Visual Troubleshooting NetBrain Technologies, Inc. 2004-2013. All rights reserved +1.800.605.7964 support@netbraintech.com www.netbraintech.com
Using VMware Network Insight. VMware Network Insight
 Using VMware Network Insight VMware Network Insight You can find the most up-to-date technical documentation on the VMware website at: https://docs.vmware.com/ If you have comments about this documentation,
Table of Contents HOL NET
 Table of Contents - VMware AppDefense - Secure Datacenter Endpoints...2 Lab Guidance... 3 Module 1- Overview of VMware AppDefense (15 Minutes)... 9 AppDefense Platform Overview... 10 Conclusion... 14 Module
Installing and Configuring vcloud Connector
 Installing and Configuring vcloud Connector vcloud Connector 2.6.0 This document supports the version of each product listed and supports all subsequent versions until the document is replaced by a new
Design Guide for Cisco ACI with Avi Vantage
 Page 1 of 23 Design Guide for Cisco ACI with Avi Vantage view online Overview Cisco ACI Cisco Application Centric Infrastructure (ACI) is a software defined networking solution offered by Cisco for data
VMware vrealize Operations for Horizon Installation. VMware vrealize Operations for Horizon 6.5
 VMware vrealize Operations for Horizon Installation VMware vrealize Operations for Horizon 6.5 You can find the most up-to-date technical documentation on the VMware website at: https://docs.vmware.com/
IBM Cloud for VMware Solutions NSX Edge Services Gateway Solution Architecture
 IBM Cloud for VMware Solutions NSX Edge Services Gateway Solution Architecture Date: 2017-03-29 Version: 1.0 Copyright IBM Corporation 2017 Page 1 of 16 Table of Contents 1 Introduction... 4 1.1 About
Pure Storage FlashArray Management Pack for VMware vrealize Operations Manager User Guide. (Version with Purity 4.9.
 Pure Storage FlashArray Management Pack for VMware vrealize Operations Manager User Guide (Version 1.0.139 with Purity 4.9.x or higher) Sunday, November 27, 2016 16:13 Pure Storage FlashArray Management
Table of Contents HOL-1757-MBL-4
 Table of Contents Lab Overview - - VMware AirWatch: Productivity Apps... 2 Lab Guidance... 3 Module 1 - VMware Boxer (30 minutes)... 8 Login to the AirWatch Console... 9 AirWatch Console Configuration...
Guide to Deploying VMware Workspace ONE. VMware Identity Manager VMware AirWatch 9.1
 Guide to Deploying VMware Workspace ONE VMware Identity Manager 2.9.1 VMware AirWatch 9.1 Guide to Deploying VMware Workspace ONE You can find the most up-to-date technical documentation on the VMware
(10393) Database Performance Tuning Hands-On Lab
 Database Performance Tuning Hands-On Lab") (10393) Database Performance Tuning Hands-On ASH Analytics Real-time ADDM SQL Performance Analyzer Objective: Database Performance Hands-on The objective of this lab to provide exercises designed to showcase
(10393) Database Performance Tuning Hands-On ASH Analytics Real-time ADDM SQL Performance Analyzer Objective: Database Performance Hands-on The objective of this lab to provide exercises designed to showcase
VMware AirWatch - Unified Endpoint Management for Windows 10
 VMware AirWatch - Unified Endpoint Management for Windows 10 Table of Contents Lab Overview - HOL-1857-02-UEM - Workspace ONE UEM - Managment for Windows 10 2 Lab Guidance... 3 Module 1 - Windows 10 Software
Design Guide: Deploying NSX for vsphere with Cisco ACI as Underlay
 Design Guide: Deploying NSX for vsphere with Cisco ACI as Underlay Table of Contents Executive Summary... 2 Benefits of NSX Architecture... 4 2.1 NSX Primary Use Cases... 4 2.2 Logical Layer Connectivity...
Disclaimer This presentation may contain product features that are currently under development. This overview of new technology represents no commitme
 NET1949BU Seamless Network Connectivity for Virtual and Bare-metal s with NSX Suresh Thiru Sridhar Subramanian VMworld 2017 Content: Not for publication VMworld 2017 - NET1949BU Disclaimer This presentation
VMware vrealize Operations for Horizon Installation. VMware vrealize Operations for Horizon 6.3
 VMware vrealize Operations for Horizon Installation VMware vrealize Operations for Horizon 6.3 VMware vrealize Operations for Horizon Installation You can find the most up-to-date technical documentation
Upgrading the Cisco APIC-EM Deployment
 Review the following sections in this chapter for information about upgrading to the latest Cisco APIC-EM version and verification. Using the GUI to Upgrade Cisco APIC-EM, page 1 Using the CLI to Upgrade
FlexPod Infrastructure Automation. September 2016 SL10295 Version 1.0.0
 September 2016 SL10295 Version 1.0.0 1 Introduction to FlexPod Automation This lab demonstrates how to use FlexPod Automation to automate the configuration of a FlexPod (UCS Mini, Nexus Switches, Clustered
Cisco Tetration Analytics
 Cisco Tetration Analytics Enhanced security and operations with real time analytics Christopher Say (CCIE RS SP) Consulting System Engineer csaychoh@cisco.com Challenges in operating a hybrid data center
Integration Service. Admin Console User Guide. On-Premises
 Kony MobileFabric TM Integration Service Admin Console User Guide On-Premises Release 7.3 Document Relevance and Accuracy This document is considered relevant to the Release stated on this title page and
Assure the Health of Your Network
 DNA Center Assurance Overview, on page 1 Monitor and Troubleshoot the Overall Health of Your Enterprise, on page 4 Monitor and Troubleshoot the Health of Your Network, on page 7 Monitor and Troubleshoot
VMware vrealize Operations for Horizon Administration
 VMware vrealize Operations for Horizon Administration vrealize Operations for Horizon 6.3 This document supports the version of each product listed and supports all subsequent versions until the document
vcenter Server Appliance Configuration Update 1 Modified on 04 OCT 2017 VMware vsphere 6.5 VMware ESXi 6.5 vcenter Server 6.5
 Update 1 Modified on 04 OCT 2017 VMware vsphere 6.5 VMware ESXi 6.5 vcenter Server 6.5 You can find the most up-to-date technical documentation on the VMware Web site at: https://docs.vmware.com/ The VMware
vrealize Suite Lifecycle Manager 1.1 Installation, Upgrade, and Management vrealize Suite 2017
 vrealize Suite Lifecycle Manager 1.1 Installation, Upgrade, and Management vrealize Suite 2017 You can find the most up-to-date technical documentation on the VMware website at: https://docs.vmware.com/