CEQ 8000 Series Fragment Analysis Training Guide
|
|
|
- Hannah Houston
- 5 years ago
- Views:
Transcription
1 TM CEQ 8000 Series Fragment Analysis Training Guide PN A16039-AB September 2005 Beckman Coulter, Inc., 4300 N. Harbor Blvd., Fullerton, CA Copyright 2005 Beckman Coulter, Inc., Printed in U.S.A.
2 Copyright Beckman Coulter, Inc., All rights reserved. No part of this publication may be reproduced, transcribed, transmitted, or translated into any language in any form by any means without the written permission of Beckman Coulter, Inc. Licenses and Trademarks Beckman Coulter is a registered trademark of Beckman Coulter, Inc. ii
3 Table of Contents STR Analysis SNP Analysis AFLP Data Analysis Troubleshooting Scenario Scenario Scenario Scenario Peak Ratio Analysis Printed Reports iii
4 iv
5 STR Analysis Customer Training Guide CEQ 8000 Genetic Analysis System Checklist Set working database Run samples Transfer Data if Required Analyze raw data (sizing only) Create Locus Tag using Binning Reanalyze raw data to call alleles Filter out low quality samples Export Genotype Overview Run Samples Analyze Raw Data to get Fragment Sizes Filter Low Quality/Unwanted Samples Perform Binning to Create STR Locus Tags Re-analyze Data Using New STR Locus Tags Genotype Summary View 1
. o To select a different working database, first ensure that no other CEQ modules are open. Right-click the desired database and select Set As Working Database.")
6 Data Management Before Samples are Run Data Manager Module To choose which database to save your results into during the run: o Open CEQ Data Manager module and check the working database, (bold text). o To select a different working database, first ensure that no other CEQ modules are open. Right-click the desired database and select Set As Working Database. 2
7 Run Samples Optimize amplification and sample loading to achieve balanced raw data signals for all loci and size standards. To begin with: o Use separation method FRAG-3 for size standard 400. o Use separation method FRAG-4 for size standard 600. Raw data may be saved to a new or an existing project in the CEQ database. The saving location is chosen based on where the active sample plate is saved. 3

8 Data Management After Samples are Run Once data is collected it may be transferred to another computer. There are two methods to transfer data: 1. Export data as a.cq* file. o Export data from the Database Manager on first computer to a known directory. Import the data files into a new or existing project database on the second computer. 4
9 2. Transfer an entire database between computers. Select Tools Backup on the first computer. Move the backup (*.bak) database to the new computer by CD or network. On the second computer, select Tools Restore and use the *.bak file created on the first computer. On the same computer, you may transfer features (such as raw data, analyzed data, size standard, and locus tags) using the copy/paste function to copy items between databases and projects. 5
10 Analysis of Sample Data Make sure the working database FAIIMINI is set then launch Fragment Analysis module. Fragment Analysis Module 6
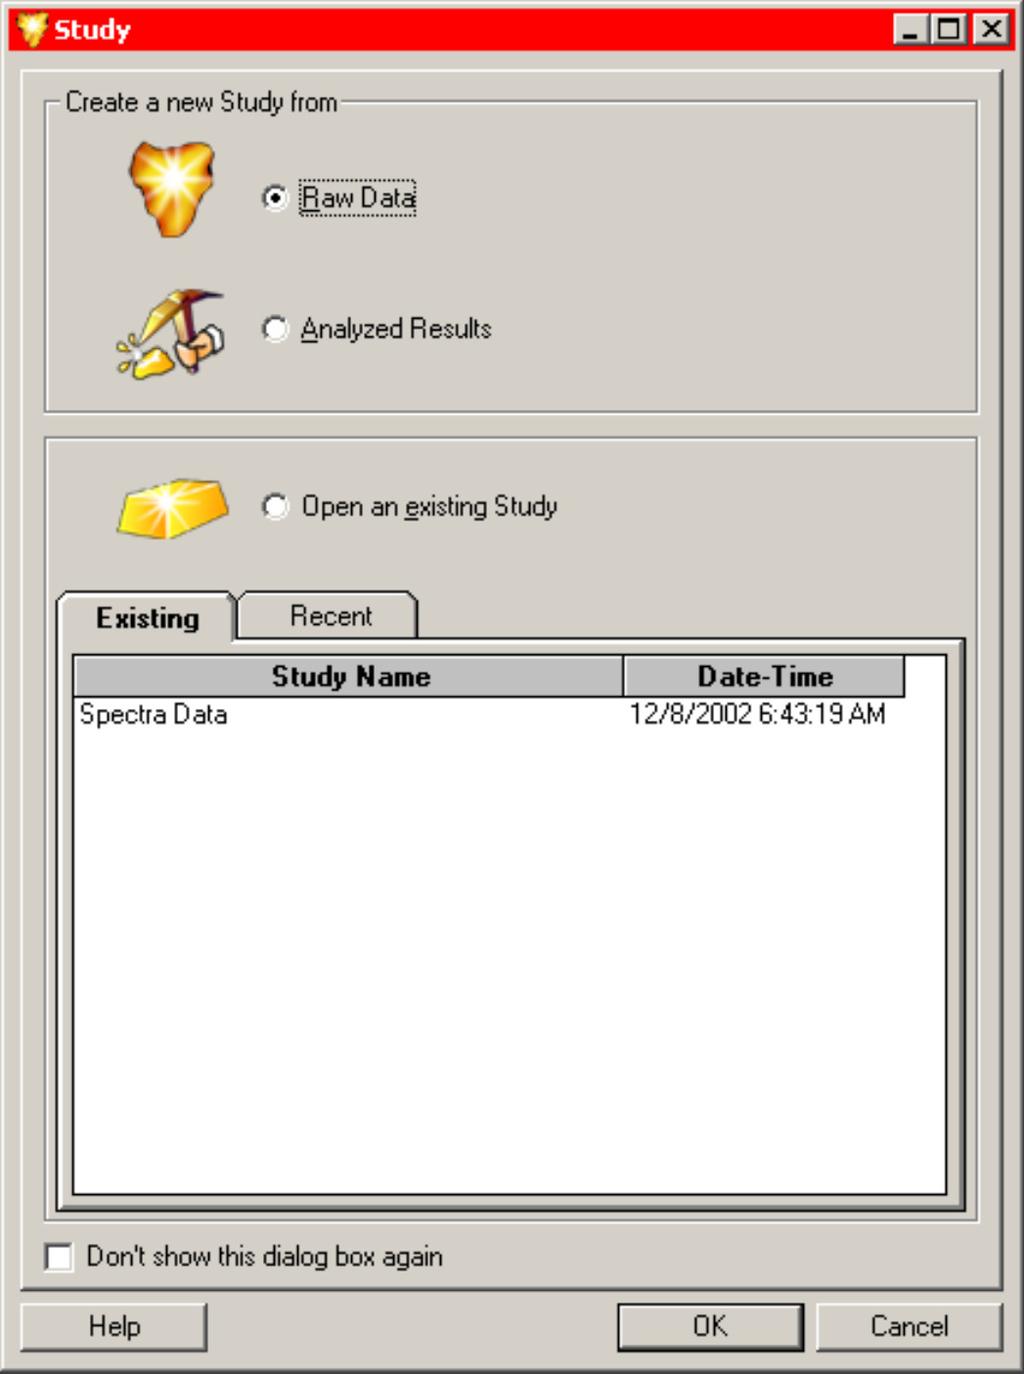
11 Follow the study wizard to analyze your data: A new study may be created or an existing study may be opened. o Create new study: Allows you to create the study from raw data. Allows you to create the study from existing analyzed data. o Open existing study: Allows you to reanalyze existing data. Allows you to add new data to existing study. This guide shows creating a new study from raw data Select at least ten D11S1984 raw data files from the D11S1984 project. Click Next>>. 7
12 Edit Analysis Parameter Set as shown below to include correct sizing information, then click Save As. From the Analysis Method tab o Select correct size standard From Advanced tab o Select Dye Mobility Calibration AE2 for AE labeled primers PA for PA labeled primers Save the parameter set under a new name, then click Next>>. Analyze data and follow wizard to click Next>>. 8

13 At this stage, you are at the same point in the workflow you would be if you created a study from previously analyzed data. You now have the option to add other previously analyzed results to your study if available. Click Finish to go to the result view. At this stage you have just SIZED the fragments. 9
14 Study Explorer The Study Explorer may be toggled on/off using the circled gold bar icon Study Explorer is a tool that links all analyses, data, and reports within a study. Results Set View To display the Result Set, select the Data tab, then double-click the Result Set icon in the Study Explorer. 10

15 Use the Column Selector to edit the columns displayed in the Result Set View. To open the Column Selector, right-click a Result header and choose Select Columns. 11
16 To view a result graph, right-click the results, then select the desired option from the pop-up menu: Show Single Result, Show Stacked Graph, or Show Overlay Graph. The Single Result view contains tabs for specific information associated with each result such as the analyzed trace, raw data trace, current, etc. 12
17 The Overlay Graph can help checking the system reproducibility: 13
18 14 The Stacked Graph view is useful for comparing different results:
19 Filtering Data The CEQ 8000 software provides quality filters to remove: o Unsuccessful results o Unwanted fragment peaks o Individual samples by name, date, etc. Several methods of (filtering) are available: o Manual exclusion of result data o Automatic exclusion (filtering) of result data o Remove result from study o Automatic exclusion filtering of fragment data removes unwanted peaks from further analysis A collection of filters may be saved as a filter set o This may then be used for subsequent analyses or studies Automatically excluded (filtered) Results or Fragments can be manually re-included. Manually included or excluded Results or Fragments can be reset to override manual processes. In the Study Explorer, select the Data tab, then double-click the fragment list. The fragment list reports details on the sizing, dye, peak height, peak area, etc. on every fragment for all results included in the study. To exclude unwanted fragments, apply filters to the fragment list. The filter tool is located on the right of the fragment list. 15
20 Useful filters in the Fragment List include: o Dye = D1 Removes size standard o Allele ID = Leave blank to remove all fragments except alleles (allele ID assignment is discussed later in this guide) To display excluded fragments, select the Show Excluded check box. To remove exclusions of results (but not fragments) completely removed from the study, right-click the results, then select Remove from Study. Press the F1 key to open a related online help topic with details for each filter. 16
21 17
22 Creating a New Locus Tag Refer to AIB A-1932A for an in depth discussion of binning and locus tags. Select the Analyses tab in Study Explorer. Right-click Binnings and select New Binning. 18


23 Initial settings: o Choose the correct dye for your locus (D1 = size standard). o Choose the allele size range. o Select the repeat unit length, if known. o Leave the other values at their default settings. View the peak data point scatter and adjust values as necessary: o Each point represents a peak (x = size, y = peak height). 19

24 Select your preferred allele naming convention: Nominal Size: Integer Size assigned by the software Alphabetic: Sequential lettering starting at designated letter Numeric: Sequential numbering starting at designated number Click Next>> and view the binning plot. If necessary, adjust the phase shift up or down to capture allele peaks in bins. o Allele peaks appear in clusters with greatest signal (y axis) 20
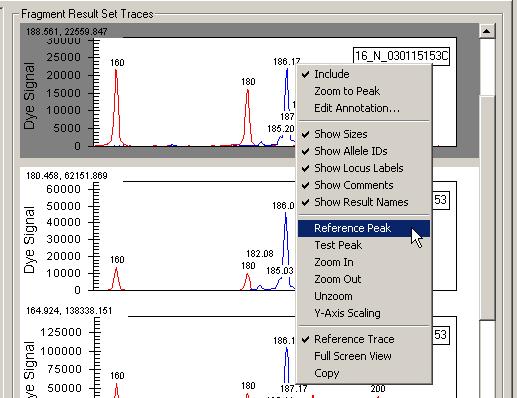
25 To check for correct binning, click on points and view traces: Hint: To make it easier to view the traces, right-click on the trace and select Show result names to clear the check mark. 21


26 To add extra alleles: o Select the Show Phantom Bins check box. o Click on a phantom bin. o Right-click and select Create Allele. Create Allele Show Phantom Bins To remove alleles: o Click on a bin. o Right-click, then select Remove Allele. To adjust the mid-point of an individual bin: o Edit apparent size in table: 22


27 To name the locus, click Next>>: Yellow boxes MUST be filled with a unique name (to replace a locus name that has already been used, delete that locus tag from the database): o Locus name can be displayed on traces after reanalysis. o Keeping the locus tag and locus name the same can save confusion. 23
.")
28 To add information about stutter, ± A and spurious peaks, click Allele ID Criteria: Click Finish to save locus tag. Save your study - VERY IMPORTANT!!! To rename binning analysis, look in Analyses in Study Explorer, right-click and select Rename: NOTE: The name of the binning analysis is independent from the Locus Tag/Locus Name). Your new allele locus tag is now ready to use Test the settings you have chosen by reanalyzing the original sized data using the locus tag that you have generated: o Go the Results Set View. o Select samples to be reanalyzed. 24


29 o Right-click and select Re-Analyze Results. Edit Analysis Parameters: o Include Identify STR Alleles on the General tab. o Remember to use the same values for Size Standard and Dye Mobility. Identify STR Alleles 25

30 o Add the STR locus tags you wish to use under STR Locus Tags tab. If desired, edit the locus tag details. Save new analysis parameter set. Click Next>>, then Analyze, then Finish the wizard. Use stacked view to check for correct allele calling. Check for problems with the edit analysis parameters and the locus tag. Most common problems caused by: o Forgetting to check Identify STR Alleles box. o Entering an incorrect % value for stutter & +A peaks. 26

31 Reanalyze the results again to optimize locus tag set-up. You may edit occasional miss-calls manually: In single or stacked view, select peak, then right-click either to: o Edit annotation if label wrong. o Clear the check mark from the Include option to remove peak from study: You may wish to set up other locus tags to use in a multiplex analysis. To do this successfully, make sure the signals of all the loci are balanced correctly. o Poor chemistry set-up will result in reanalysis misery! Once all your locus tags are ready to use, you may add more results to the study using the Study Wizard: o Select File Add Raw Data to Study. o Select File Add Result Data to Study. 27
32 Follow the wizard to reanalyze the data with your new Analysis Parameter Set: o Include your new Locus Tags in the Parameter Set. o A full study may include many hundred samples to be analyzed. o The CEQ computer will take 2-3 seconds to analyze each result. When complete, the analysis provides a lot of results to work with. 28

33 Export Results Once the sample set has been filtered and any problem samples reanalyzed or removed, the study is complete and ready for export for downstream processing by other software packages. Data may be exported in a variety of formats. Allele List Report Use the Column Selector to include or exclude columns for the allele list report. We recommend the following columns to be included in the genotype report: result name, locus name, allele ID, estimated fragment size, allele match quality, peak height, and peak area. To export allele list directly from the fragment list grid or export genotypes: o Select Export Fragments/Genotypes. 29
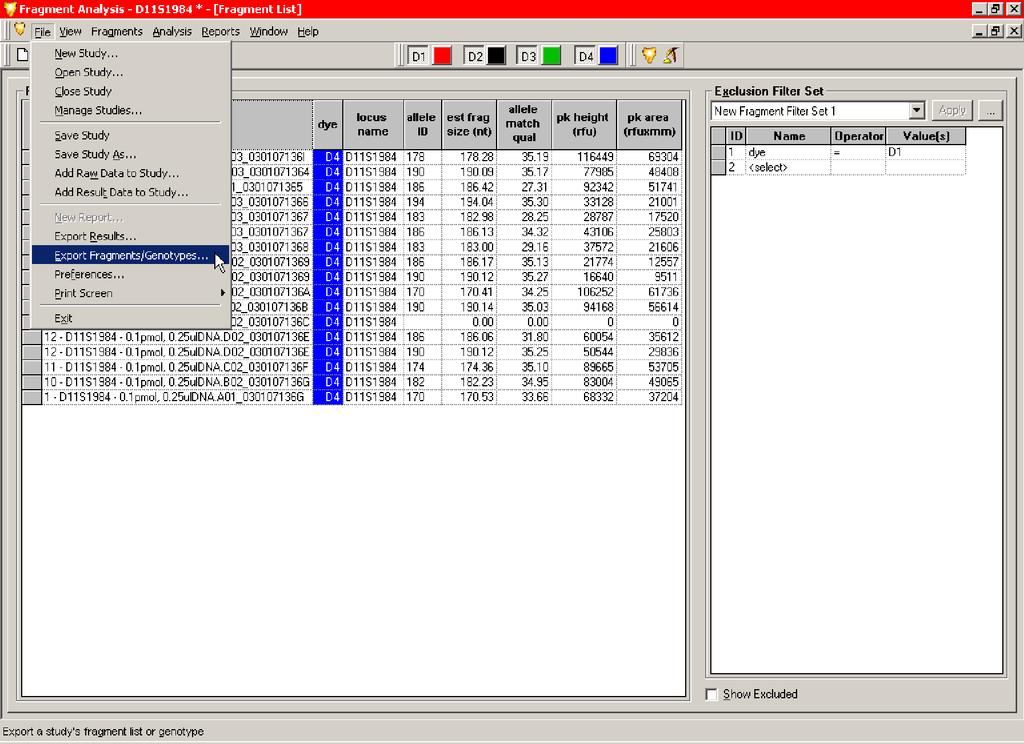
34 30

35 The simplest export is *.csv (comma separated values) file for import into spreadsheets. To find the exported csv file, look in the \CEQ8000\Export folder. You can edit this and is editable in Microsoft excel program. o An example of the exported file is shown below: RN dye locus name allele ID est frag size (nt) allele match qual pk height (rfu) 10 - D11S pmol, 0.25ulDNA.B02_ A D4 D11S D11S pmol, 0.25ulDNA.C02_ E D4 D11S D11S pmol, 0.25ulDNA.C02_ E D4 D11S D11S pmol, 0.25ulDNA.D02_ I D4 D11S D11S pmol, 0.25ulDNA.D02_ I D4 D11S D11S pmol, 0.25ulDNA.F02_ Q D4 D11S D11S pmol, 0.25ulDNA.F02_ Q D4 D11S D11S pmol, 0.25ulDNA.G02_ V D4 D11S D11S pmol, 0.25ulDNA.H02_ Z D4 D11S D11S pmol, 0.25ulDNA.H02_ Z D4 D11S D11S pmol, 0.25ulDNA.C03_ B D4 D11S D11S pmol, 0.25ulDNA.C03_ B D4 D11S D11S pmol, 0.25ulDNA.A03_ Q D4 D11S D11S pmol, 0.25ulDNA.A03_ Q D4 D11S D11S pmol, 0.25ulDNA.B03_ D4 D11S D11S pmol, 0.25ulDNA.B03_ D4 D11S pk area (rfuxmm) 31
 or an Individual ID (version 7.0, 6.0, 5.0).")
36 Creating a Genotype Summary Report A Genotype Summary Report consolidates the allele identifications of several user specified loci from the same individual onto a single line of the report table. Generating a Genotype Summary Report requires two critical bits of data. Each result must have a Subject ID (version 8 or higher) or an Individual ID (version 7.0, 6.0, 5.0). CEQ Software versions 5, 6, and 7 To create an Individual ID column in the Results Set table: 1. Launch a single sample view from any one of the results. 2. Select the Property Set tab and right-click on the header row: 3. Select Insert Property and type the exact Individual ID, then click Save. 4. Return to the Results Set View. 5. Launch the Column Selector. Add the column Individual ID to the Results Set View (it resides in the folder User Defined Properties). 6. In the Results Set View, type in an Individual ID for each result. Results without Individual IDs will not be passed on to the Genotype Summary Report. NOTE: Other pedigree information is usually required by downstream linkage analysis software programs. You can add this information when entering sample names in pre-defined or user-defined Property Sets in the Sample Setup table. If any of these property values are entered, those user-defined properties become available for viewing in the Results Set. 32
. Save as LocusList.")
37 To create a locus list: o First tell the software the locus names you want to export. Create a file with the locus names written exactly as saved (put each locus name on a new line). Save as LocusList.txt in CEQ8000\Export folder. 33


38 Export the genotype table directly from the fragment list grid by selecting File Export Fragments/Genotypes. Select Genotype Summary Report (tab delimited) *. o Save (default export location is Export folder in CEQ 8000). 34

39 The Export Status box confirms successful export: CEQ Software versions 8 and higher Subject IDs may be entered during sample plate setup or after samples have been separated. To enter Subject IDs after separating the samples, follow the guidelines below. 1. Open the Results Set View and launch the column selector. 2. Add the column Subject ID to the Results set view (located in the data identification folder). 3. In the results set view, type in a Subject ID for each result. Results without Subject IDs are not passed to the Genotype Summary Report. NOTE: Other pedigree information is usually required by downstream linkage analysis software programs. This information can be added at the time sample names are entered in pre-defined or user-defined Property Sets in the Sample Setup table. If any of these property values are entered, those user-defined properties become available for viewing in the Results Set. 35


40 To create a locus list: 1. Launch the Locus List Editor from the View menu independently, or as a part of launching the Genotype Summary View. 2. Select the loci to use by moving the available loci from the left column to the right column of the editor. 3. Click OK. The following dialog box appears: 4. Click Yes to display the Genotype Summary Table. 36
 Exporting the Genotype Summary Report can also be done by selecting the *.")
41 5. Right-click the list and select Copy Genotype Summary or Export Genotype Summary. 6. When exporting the Genotype summary, select the *.gsr file type. You can open the *.gsr genotypes file using MS Excel. Viewing an Exported Genotype Summary Report (*.gsr) Exporting the Genotype Summary Report can also be done by selecting the *.gsr file after selecting File Export Fragment/Genotypes. Open the *.gsr file with Microsoft Excel to view genotype table. Follow the text import wizard to obtain correct import into Excel: o Data is tab delimited. 37
42 38
43 SNP Analysis Customer Training Guide CEQ 8000 Genetic Analyzer Checklist Set working database Run Samples Transfer Data if Required Analyze Raw Data (sizing only) View and Check Results Create and Edit SNP Locus Tags Reanalyze raw data to call SNP alleles Filter out low quality samples Export Genotype Overview Run Samples Analyze raw data to get SNP fragment sizing Add and edit SNP Locus Tags Use these Locus Tags to reanalyze the full study (Allele calling) Filter low quality/unwanted samples Export Genotype 39

44 Recommended Tutorials and Order of Use: Read this SNP Training Guide to get an overview of the process. Analyze some data from the SNP demonstration database using this guide. Once you have worked through this guide, please use the following tutorials: o Study Creation and Management Tutorial Practice of Study creation Practice of Data analysis and viewing More details of Database management o Printed Reports Tutorial How to print reports directly in Microsoft Word Study overview Result set summary Locus Tag summary Data Management Before Running Samples 40

.")
45 To choose which database to save your results into during the run: o Open CEQ Data Manager module and check which is the working database (highlighted). o To select a different working database, right-click the desired database and select Set as Working Database. Run Samples Optimize sample set-up to achieve balanced raw data signals for all loci. o Use separation method SNP-1 with size standard 80. Raw data may be saved to a new or an existing project in the CEQ database. Data Management After Samples are run After running the samples, you may transfer the data may to another analysis computer (optional). o Data may be exported as a CEQ* file, transferable between computers. Export data from Database Manager on first computer. Import the data files into a new or existing project in your database on second computer. o Features such as raw data, analyzed data, size standard, locus tags, etc. are transferable by copy/paste function between databases. 41
46 Analysis of Sample Data After setting the working database, launch the Fragment Analysis module. Follow the study wizard to analyze your data. 42

47 Use this dialog box to create a new study or open an existing study. Create new study: o Allows you to create the study from raw data. o Allows you to create the study from existing analyzed data. Open existing study: o To reanalyze existing data. o To add new data to existing study. 43

48 This guide shows how to create a new study from raw data to generate SNP allele sizes and how to reanalyze the data to generate allele calls Set SNP DEMONSTRATION as the working database. Select raw data from the SNP Demo project. 44


49 Choose DefaultSNPAnalysisParameter to analyze data. Edit to note that: o This includes the new Sizestandard-80. o The new dye mobility correction SNP ver.1 was developed to correct the dye mobility shift for short fragments. 45


50 Click Next>>, then click Analyze. The Analysis Screen opens, as shown in the following example. Click Next>>. At this stage you can add more analyzed results to your study if available. Click Finish to go to the result view. 46

51 Study Explorer The Study Explorer is a tool that links all analyses, data, and reports, which may be turned on and off. 47

52 Result Set View To display the Result Set View, select the Data tab in the Study Explorer. 48

53 Use the Column Selector to edit the columns shown in the Result Set View. To display this, right-click on the result header. 49

54 To view Result graphs, right-click the results, then choose one of these options: Show Single Result, Show Stacked Graph, or Show Overlay Graph. Single Result View contains specific and troubleshooting information associated with each result such as the analyzed data trace, raw data trace, current, etc. Looking at the raw data is key. Signal over-ranging is not accommodated by the software and should be solved by simple dilution prior to loading. 50
55 An Overlay Graph allows you to check the performance of the size standards and identify any abnormal fragments easily. A Stacked Graph helps you compare different results, especially after calling genotypes. 51


56 Creating a New SNP Locus Tag Select the results to be reanalyzed. Right-click and select Reanalyze. Choose Default SNP Analysis Parameters: Click Edit and go to General tab. Background (non-snp) fragments may be ignored during reanalysis by increasing or decreasing the slope threshold and relative peak height threshold values. The SNP analysis box has to be checked for SNP allele calling. Slope threshold and peak threshold could be increased to prevent the calling of background peaks and wide non-specific peaks. 52

, select the approximate mid-point as the apparent size.")
57 SNP locus tag may be modified or created from the SNP Locus Tag tab: o This example already has four SNP locus tags created. Click New Locus to start a new SNP locus tag: To create a new locus tag, you will need the locus tag name, project name, locus label, apparent size and allele ID for each dye. To obtain the apparent size, refer to your initial sizing analysis of the SNPs. When alleles of the same locus run with different sizes (this is usual), select the approximate mid-point as the apparent size. 53

58 There are four loci in total. o 25.6 bp, 35.2 bp, and 45.7 bp for the three heterozygous loci in this example: Your new SNP locus tag is now ready to use You may wish to set up other SNP locus tags and use in a multiplex analysis. To do this successfully, the signals of all the loci need to be balanced correctly. o Poor chemistry set-up will result in reanalysis misery! Once all your locus tags are ready to use, you may add more results to the study: o Select File Add Raw Data to Study. o Select File Add Result Data to Study. 54


59 Select the desired data then follow the wizard to reanalyze the data with your new Analysis Parameter Set which now includes your new SNP locus tags: Click Yes to start the reanalysis. 55
60 Select the correct analysis parameters with SNP locus tags and follow the same procedures for data analysis as shown before. o Include your new SNP Locus Tags in the Parameter Set. o The example below shows a typical multiplex analysis of 4 loci selected from 16 possible locus tags: o A full study may include many hundred samples to be analyzed. o The CEQ controller takes 2-3 seconds to analyze each result. Completing the analysis gives you a lot of results to work with. The CEQ software provides quality filters to remove: o Unsuccessful results o Unwanted fragment peaks o Individual samples by name, date, etc. Three levels of filtering are available: o Manual inclusion of raw data o Automatic filtering of result data, which removes entire result from further analysis. Automatic filtering of fragment data, which removes just unwanted peaks from further analysis. A collection of filters may be saved as a filter set. o This may then be used for subsequent analysis or studies. o You will typically find 4-8 filters that make a useful general set. Go to the Fragment List found in the Study Explorer Data tab. Note that you can produce a Fragment list report that details information on the sizing, dye, peak height, peak area, etc. of every fragment detected for all results in the same study. To do this, right-click on result in the report tab of study explorer, then select New. 56


61 o Filters may be applied to the fragment list to exclude unwanted fragments: Useful filters in the Fragment List include: o Allele ID = Leave blank to remove all fragments except alleles. o No Allele Found = Yes Removes locus tags that did not find any allele in this result. Confirm all fragments have the correct genotypes: To display excluded fragments, select the Show Excluded check box. 57

62 Press the F1 key to open a related online help topic with details for each filter. Export Results After filtering the sample set and reanalyzing or removing any problem samples, you are ready to export the study for downstream processing by other software packages. Data may be exported in a variety of formats, based on Microsoft Excel. 58


63 Allele List Report Use the column selector to include or exclude columns for the allele list report. We recommend including the following columns in the genotype report: result name, locus name, estimated fragment size, and allele ID. You can copy and paste the fragment or export it into a Microsoft Excel spreadsheet using the right-click menu. Export the allele list directly from the fragment list grid or export genotypes. o Select File Export Fragments/Genotypes. 59

64 The simplest export is *.CSV (comma separated values) file for spreadsheets. The exported CSV file is editable in Microsoft Excel program. o An example of the exported file is shown below: 60


65 Genotype Table Export into Microsoft Excel To create a genotype table: o Specify the locus names you wish to export. Create a notepad file containing the locus names. Save as LocusList.txt in the CEQ8000\Export folder. Next: o In the Result Set, right-click to view a single result. Scroll across the tabs along the top to find Property Set. o Right-click in the Property header to Insert a Property. Type Individual ID, then click Save. o o Go back to the result set view. Add User defined properties Individual ID to the table using the column selector. Enter an identity (ID) for each result into the column in the table: 61


66 o Create a LocusList.txt file in the export folder with the locus tag names. To export the genotype, select File Export Fragments/Genotypes. Select Genotype Summary Report (tab delimited) *.gsr. o Save (default export location is Export folder in CEQ 8000.) Export Status box confirms successful export: Open *.gsr file with Microsoft Excel to view genotype table. Follow the text import wizard to obtain correct import into Excel: 62


67 o Data is tab delimited. Click Next>. Genotype Table in Microsoft Excel: o A1 = allele one of locus SNP 26, SNP 35, or SNP 45 o A2 = allele two of locus SNP 26, SNP 35, or SNP 45 63
68 Apply what you have learned to the larger set of SNP data in the SNP database. SNP Chemistry Template Quantity: PCR products and plasmids may be used as templates for a SNP. Quantitation of the template prior to primer extension is highly recommended. A range of 10~100 fmol clean template is suggested for each primer extension reaction. PCR Template cleanup: Because PCR product normally contains residual dntp and primers, it is necessary to clean up PCR products prior to primer extension. Add 2U Shrimp Alkaline Phosphatase (SAP) and 1U Exonuclease I (ExoI) to each 6 µl of the PCR template. Incubate at 37 C for 1 hour then inactivate the enzymes at 75 C for 15 minutes. Premix preparation: Mix the following from the CEQ SNP-Primer Extension Kit (part ): 210 µl of each of 10 x buffer, ddutp, ddgtp, ddctp, ddatp and 105 µl of polymerase enzyme. This will be sufficient for 100 reactions. Primer extension reaction: Add the following reagents to each SNP reaction. If there are multiple primers for the same template, the ready mix, template, and water should be added from a master mix to optimize the pipetting accuracy. Premix 11 µl Template 1.0 µl of 100 nm DNA Primer Mix Water 7.0 µl Total volume 20.0 µl 1.0 µl of 1 µm primer Spin the mixture to the bottom of the wells/tubes and place on thermal cycler. Perform 25 cycles of the following thermal steps (approximately1 hour): 96 C 10 seconds 50 C 5 seconds 72 C 30 seconds To achieve high specificity of primer extension, the annealing temperature could be adjusted to 5 degree below the lowest Tm of all primers. Post-primer extension cleanup: Add 1 unit of SAP to each 20 µl reaction, mix and spin down. Incubate at 37 C for 1 hour, and then inactivate SAP at 75 C for 15 minutes. Sample set-up on CEQ: Add 0.5 µl of SNP product, 0.5 µl of the size standard-80 (part ), and 39 µ1l of SLS (part ) to each well of the CEQ sample plate (part ). The size standard 80 and SLS may be made up as a master mix and 39.5 µl aliquots dispensed into the CEQ plate, before adding the SNP products to the wells. (If signal over-ranging is observed during data analysis, it is necessary to dilute the samples 1:40 with SLS prior to adding to the above mixture.) Add a drop of mineral oil to each well. Use run method SNP-1. 64
69 Multiplexed SNP reactions: o o o o o o Multiplexed SNP primer design: Use commercial software such as Oligo 6. Design primers starting at 20 nt long. For the multiplex reaction, a space of 5 nt between the adjacent primers is highly recommended. The Tm range is 60 C to 75 C. Signal balances among different primers could be achieved by adjusting the amount of primers added to each reaction. Design the primer with the highest GC content as the shortest primer, and the primer with the lowest GC content as the longest primers. If the Tm exceeds 75 C, add a poly A or poly T tail to the 5' end of the primer. Make the specific sequence of each primer as long as the highest Tm would allow. Keep the poly tail as short as possible. Do not use poly C or poly G tail. Avoid hairpin/dimer formation or 3 interaction between different primers. Three factors contribute to the migration of the SNP product during capillary electrophoresis: the primer length, GC-content, and allele identity. We recommend optimizing the single-plex SNP reaction using each SNP primer prior to multiplexing. Two negative controls are recommended: Template only control Primer only control One positive control is recommended: The 47 primer and puc18 control (a fragment of 21 nt should be generated by this reaction). Make sure that good system dye spectra are defined prior to sample separation. 65
70 66
71 AFLP Data Analysis Customer Training Guide CEQ 8000 Genetic Analysis System Checklist Run samples Analyze raw data (sizing only) Filter out low quality samples Perform AFLP Binning Export Data Overview Run Samples Analyze raw data to get fragment sizing Filter low quality results AFLP binning to obtain binary code table Check binning correct filter and re-bin if necessary Export of AFLP binary code table 67
72 Recommended Tutorials and order of use: Read this AFLP Training Guide to get an overview of the process. Once you have read through this guide, please use the tutorial: o Study Creation and Management Tutorial Practice of Study creation Practice of Data analysis and viewing Understanding of Database management To find out more about printing Microsoft Word reports: o Printed Reports Tutorial Practice of printing reports directly in Microsoft Word Study overview Result set summary Binning summary Locus Tag summary 68


73 Data Management Before Running Samples Data Manager Module To choose which database to save your results into during the run: o Open CEQ Data Manager module and check which is the working database (highlighted). o To select a different working database, right-click the desired database and select Set as Working Database. 69

74 Run Samples Optimize sample set-up to achieve balanced raw data signals for all loci. o Use separation method FRAG-3 for size standard 400. o Use separation method FRAG-4 for size standard 600. Raw data is saved to a new or existing project in the CEQ database. Data Management After Samples are Run Once you have run the samples, data may be transferred to another computer o There are two methods to transfer data: 1. Data may be exported as a CEQ* file, transferable between computers. o o Export data from Database Manager on the first computer. Import the data files into a new or existing project in your database on the second computer. Features such as raw data, analyzed data, size standard, locus tags, etc. are transferable using the copy/paste function between databases. 70
 database to new computer by CD or network. o Select Tools Restore on the second computer to restore the database saved as a *.")
75 2. To transfer an entire database between computers: o Select Tools Backup to backup database from first computer. o Move backup (*.BAK) database to new computer by CD or network. o Select Tools Restore on the second computer to restore the database saved as a *.BAK file. 71


76 This guide shows how to create a new study from raw data Set Demonstration as the working database. Select all raw data from the project AFLP. Click Next>>. 72
 and click Save As.")

77 Edit Analysis Parameter Set to include correct sizing information (in this case 400 bp size std. and AE2 mobility correction) and click Save As. From Analysis Method tab o Select correct size standard From Advanced tab o Select Dye Mobility Calibration o AE2 for AE labeled primers o PA for PA labeled primers Analyze data and follow the wizard to click Next>>. At this stage you may add more analyzed results to your study if available. Click Finish to go to the result view. 73

78 Study Explorer Study Explorer is a tool that links all analyses, data, and reports, which may be turned on and off. Study Explorer may be toggled on/off by this button: 74


79 Result Set View To display the Result Set View, select the Data tab in the Study Explorer. The Column Selector window can be invoked by the right-clicking on the column header row To edit the columns shown in the Result Set View, right-click the heading, select Select Columns, then edit the columns shows using the Column Selector: 75

80 To view Result graphs, right-click the results, then choose one of these options: Show Single Result, Show Stacked Graph, or Show Overlay Graph. Single result view contains specific and troubleshooting information associated with each result such as the analyzed trace, raw data trace, current, etc. 76


81 An Overlay Graph lets you check the system reproducibility: A Stacked Graph helps you compare different results: 77
82 Quality Filtering to remove unwanted samples and peaks Completing the analysis gives you a lot of results to work with. The CEQ 8000 software provides Quality filters to remove: o Unsuccessful results o Unwanted fragment peaks o Individual samples by name, date, etc Three levels of filtering are available: o Manual filtering of raw data Only select the samples you wish to work with o Automatic filtering of result data Removes entire result from further analysis o Automatic filtering of fragment data Removes just unwanted peaks from further analysis Available filters are listed in a separate booklet A collection of filters may be saved as a filter set o This may then be used for subsequent analyses or studies o You will typically find 4-8 filters that make a useful general set Fragment List ID found in the Study Explorer.Data tab Fragment list reports detail information on the sizing, dye, peak height, peak area, etc. on every fragment detected for all results in the same study 78


83 Filtering Results Results Set view: Results set filtering removes entire result. For a list of filters, see the separate list supplied with this guide. 79


84 Filtering Fragments Fragment Set List: Fragment set filtering removes unwanted peaks: For List of filters, see separate list supplied with this guide. Exclusions are displayed by selecting the Show Excluded check box. Exclusions may be completely removed from the study by right-clicking. 80


85 Creating a New AFLP Binning Move to Analyses in Study Explorer. Right-click on AFLPs, to create a New AFLP binning. Initial settings: o Choose the bin width you wish to work with. Start with 1bp and edit later to see affect on binning. o Choose the Y threshold (minimum peak height to include). Start at 0 as this too may be adjusted later. o Choose exclude fully represented bins (recommended). o Choose exclude samples without qualifying peaks (recommended). Click OK to get preliminary binning: 81

86 Samples in columns Bins in rows o 0 indicates no peak in this bin for this sample o 1 indicates a peak in this bin for this sample o 2 indicates two peaks in this bin for this sample Factors that will affect the binning may now be adjusted Adjusting these values will result in automatic re-binning o Decreasing bin width will split multiple peaks in one bin o Increasing Y threshold will exclude small peaks Bins with multiple peaks for one sample may also be treated as a single peak o Check Sample Bin Binary Presence: Peak heights may be displayed in place of binary presence o Check Sample Bin: Fragment(s) Max Y: You may also view the results with samples in rows easier to see sample names: o Change sample axis to rows: 82


87 If you have multiplexed samples using different dyes in the same sample well, data from the different dyes may be toggled on/off with these buttons: Bins or samples may be manually excluded. Right-click on the bin or sample header: Bin Exclusion Sample Exclusion 83
 to be viewed and right-click to get options: Trace overlay is useful in AFLP analysis for peak comparisons.")
 of interest.")
88 To help you analyze AFLP binning, view the sample traces. o Highlight the sample(s) to be viewed and right-click to get options: Trace overlay is useful in AFLP analysis for peak comparisons. Peak(s) may be highlighted and the stacked sample views launched. o Only the samples that contain this peak will be launched. To do this from the overlay: o Zoom to the peak(s) of interest. o Toggle on the subset selection tool in the menu taskbar: Zoom Tool Subset Selection Tool Left-click, hold, and drag the mouse to draw a box around the peak(s) of interest: 84


89 Wait for sample trace(s) to automatically launch: To rename AFLP binning, go to Analyses in Study Explorer and right-click: When you have finished binning analysis save your study - VERY IMPORTANT!!! 85


90 Export AFLP Data Once the sample set has been filtered and the AFLP binning completed and saved, the study is complete. o It is now ready for export and processing by other software packages. 1. Export Results. o Select File Export Results: o Both the Header and Results Data option boxes have to be checked in the Export Results dialog window for exporting AFLP results to Genographer (a third-party software). 86

91 o In the Export Results As dialog box, select Text (Tab delimited)(*.txt) in the Save as type field for exporting AFLP results to Genographer. Leave the File name: {Results Name} as it is. 2. Export AFLP. AFLP data may be exported as directly into Microsoft Excel as a binary table o Select File Export AFLP: 87
(*.")
92 Choose the export location and filename. If you select the NTSYSpc (*.nts) file type for exporting AFLP, you can import the exported file directly to the NTSYSpc software (a third-party software). If you select the Text Files (Comma Delimited)(*.csv) file type, the exported file needs to be edited (see below) and transformed (see NTSYSpc instruction) to match the NTS format prior to importing to the NTSYSpc applications. It is recommended to always double-check the exported files and edit the files if necessary prior to proceeding the downstream NTSYSpc analysis. To edit the CEQ AFLP exported *.csv file, perform the following steps: 1. Launch Excel and select File Open. 2. Locate to the folder where the *.csv file is saved, then select All Files (*.*) from the Files of type drop-down menu. 3. Locate to the *.csv file, then open the file using the Delimited Comma options. 88

(*.csv) from the Save as type drop-down list. 7.")
93 4. To edit the *.csv file: o Delete columns B through I (column Dye through column Ymean) and all the associated information. o Delete all rows and associated information after the last bin. o Insert a row before row 1. o Type in 1 in new cell A1. o Type in the number of bins in new cell B1. o Type in the number of samples (results) in new cell C1. 5. Select File Save As, then specify the targeted folder. 6. Select CVS (Comma delimited)(*.csv) from the Save as type drop-down list. 7. Type in the desired file name, then click Save. 8. Exit Excel. 89
 concentration of the selective amplification product on CEQ. 2. Use higher (5-10x) concentration of the pre-selective amplification product in the reaction. 3.")
94 Troubleshooting 1. Scenario 1 No signal (size standard only), signal is too low, or background noise level is too high. Possible Reason 1: Insufficient starting material/amplified product. Suggestions: 1. Load higher (5-10x) concentration of the selective amplification product on CEQ. 2. Use higher (5-10x) concentration of the pre-selective amplification product in the reaction. 3. Use higher (5-10x) concentration of the R/L product in the reaction. 90

95 4. Use a higher (5-10x) concentration of the genomic DNA in the reaction. 5. Combine any two to four of the above suggested items. Scenario 1 Possible Reason 2: Insufficient dye-primer concentration in the selective amplification reaction. Possible Reason 3. Dye-primer is not in good shape. Suggestions: 6. Use higher (5-10x) concentration of the dye-primer in the reaction. 7. Re-synthesize the dye-primer and re-assure the quality/quantity. 8. Change the dye for the dye-primer 91
96 2. Scenario 2 Signal is too high or over ranged. Possible Reason: Too much amplified product. Suggestion: Load lower (1/5-1/10) concentration of the selective amplification product on CEQ. 92
. 2. Increase the concentration of the R/L enzymes in the reaction. (If not working) 3.")
97 Scenario 3 3. Scenario 3 Too many peaks. Possible Reason: Incomplete restriction/ligation of DNA. Suggestions: 1. Increase the R/L reaction time (up to overnight). 2. Increase the concentration of the R/L enzymes in the reaction. (If not working) 3. Change the enzyme/adaptor/primer set. 93
98 4. Scenario 4 Only a few peaks. Possible Reason 1: The enzyme/adaptor/primer set used is not optimized. Possible Reason 2. That s what it is. Suggestions: 1. Change primer or primer sequence. 2. Try other enzyme/adaptor/primer sets and re-optimize the reactions. 94
99 Peak Ratio Analysis Customer Training Guide CEQ Genetic Analysis System The Peak Ratio tool allows you to readily compare the heights or areas of pairs of peaks that you might expect to find on every electropherogram in a study, regardless of their quantities. Use the Peak Ratio Analysis as follows: Select a single reference trace containing the peaks of interest as a model for all other traces. Within the reference trace, select a single reference peak by clicking on a peak. Select any number of test peaks on the same trace for comparison to the reference peak. Compare peaks of different colors with one another. Test: reference peak height or peak area ratios can be recognized if they differ significantly from the population of ratios calculated in the analysis. Checklist Overview Set working database Run samples Transfer Data if Required Analyze raw data (sizing only) Filter out low quality samples Select Reference Trace Select Reference and Test Peaks Review Peak Ratio Table Run Samples Analyze raw data to get fragment sizing Filter low quality/unwanted samples Select Reference Trace Select Reference and Test Peaks Review Peak Ratio Table 95
100 Recommended Tutorials and order of use: Read this Peak Ratio Training Guide to get an overview of the process. Analyze some data from the demonstration database using this guide. Once you have worked through this guide, please use the tutorials: Study Creation and Management Tutorial o Practice of Study creation o Practice of Data analysis and viewing o More detail of Database management Quantitation Tutorial Printed Reports Tutorial o Practice of printing reports directly in Microsoft Word Study overview Result set summary Binning summary Locus Tag summary Data Management Before Samples are Run Data Manager Module To choose which database to save your results into during the run: o Open CEQ Data Manager module and check which is the working database (highlighted). 96
101 o To select a different working database, first ensure that no other CEQ modules are open. Right-click the desired database, then select Set As Working Database. Run Samples Optimize samples to achieve adequate raw data signals for both reference and unknown (test) samples: o Use separation method FRAG-3 for size standard 400. o Use separation method FRAG-4 for size standard 600. Raw data may be saved to a new or an existing project in the CEQ database. Data Management After Samples are Run Once you have run the samples, data may be transferred to another computer. There are two methods to transfer data: o Data may be exported as a CEQ* file, transferable between computers. Export data from Database Manager on first computer. 97

102 98 Import the data files into a new or existing project in your database on second computer.


103 Features such as raw data, analyzed data, size standard, locus tags, etc. are transferable by copy/paste function between databases. To transfer an entire database between computers: 1. Select Tools Backup to backup the database from first computer. 2. Move the backup (*.bak) database to the new computer by CD or network. 3. On the second computer, select Tools Restore and use the *.bak file created on the first computer. 99
104 Analysis of Sample Data Make sure the working database FAII-B is set then launch Fragment Analysis module. Fragment Analysis Module 100
105 101
106 Follow the study wizard to analyze your data. To create a new study or open an existing study: o Create new study. Allows you to create the study from raw data. Allows you to create the study from existing analyzed data. o Open existing study: Allows you to reanalyze existing data. Allows you to add new data to existing study. This guide shows how to create a new study from raw data Select at least 10 D11S1984 raw data files from the D11S1984 project. Click Next>>. 102
107 Edit Analysis Parameter Set as shown below to include correct sizing information and click Save As. From Analysis Method tab o Select correct size standard From Advanced tab o Select Dye Mobility Calibration AE2 for AE labeled primers PA for PA labeled primers Save the parameter set under a new name, then click Next>>. Analyze data and follow wizard to click Next>>. 103
108 104 At this stage, you are at the same point in the workflow as you would be if you created a study from previously analyzed data. You may add other previously analyzed results to your study before proceeding. Click Finish to go to the result view. At this stage you have just SIZED the fragments.
109 Study Explorer The Study Explorer may be toggled on/off using the circled Gold Bar button Study Explorer is a tool that links all analyses, data, and reports within a study. 105
110 Results Set View To display the Result Set, select the Data tab, then double-click the Result Set icon in the Study Explorer. 106
111 Use the Column Selector to edit the columns displayed in the Result Set View. To open the Column Selector, right-click a Result header and choose Select Columns. 107

112 108 To view a result graph, right-click the results, then select the desired option from the pop-up menu: Show Single Result, Show Stacked Graph, or Show Overlay Graph.
113 The Single Result view contains tabs for specific and troubleshooting information associated with each result such as the analyzed trace, raw data trace, current, etc. 109

114 110 The Overlay Graph can help checking the system reproducibility:

115 The Stacked Graph view can help you compare different results: Filtering Data For an in-depth discussion of sorting and filtering data refer to AIB A1929A. The CEQ 8000 software provides Quality filters to remove: o Unsuccessful results o Unwanted fragment peaks o Individual samples by name, date, etc. Three levels of filtering are available: o Manual inclusion of raw data o Automatic filtering of result data Removes entire result from further analysis o Automatic filtering of fragment data Removes just unwanted peaks from further analysis A collection of filters may be saved as a filter set o This may then be used for subsequent analyses or studies Double-click Fragment List found in the Study Explorer.Data tab. 111

116 Fragment list reports details on the sizing, dye, peak height, peak area, etc. on every fragment detected for all results in the same study. To exclude unwanted fragments, apply filters to the fragment list. The filter tool is located on the right of the fragment list. Useful filters in the Fragment List include: o Dye = D1 Removes size standard o Allele ID = Leave blank to remove all fragments except alleles (see STR and Allele list section of the training guide for allele identification) To display excluded fragments, select the Show Excluded check box. To remove exclusions of results (but not fragments) completely from the study, right-click the results, then select Remove from Study. 112

117 Press the F1 key to open a related online help topic with details for each filter. 113


118 Creating a New Peak Ratio Analysis Select the Analyses tab in Study Explorer. Right-click Binnings and select New Peak Ratio. 114

119 Zoom the traces to a legible size. 115


120 116 Select a Reference Trace.

121 Select a Reference Peak. 117

122 118 Note the appearance of the Reference Peak description in the Reference Result Peaks section.

123 Select one or more Test peaks: 119


124 120 Note that as soon as you select the reference peak and at least one test peak, a generated table appears, comparing their heights and areas. If one of the two peaks is missing, some of the table cells contain the text N/A. To select and organize the table columns, right-click on the header row, then select Select Columns.

125 Selecting the Highlight Variant Ratios check box highlights the ratios outside the user-defined Standard Deviation or % Error of the collected data in yellow. 121
126 122 If you know an amount of the reference peak, enter it into the Reference Peak Known Quantity field. NOTE: Because there is no differential injection of molecules of different size or different fluorescent tag, the quantitation can be safely made by comparing peak heights or areas. While it might be simple to estimate the amount of a reference sample added to the injection well, the system software makes no attempt to convert a specific peak height or area into absolute amounts. The amounts reported rely on the assumption stated above. Among other variables, differences in contaminating ions between samples prohibits the comparison of peak heights across capillaries.

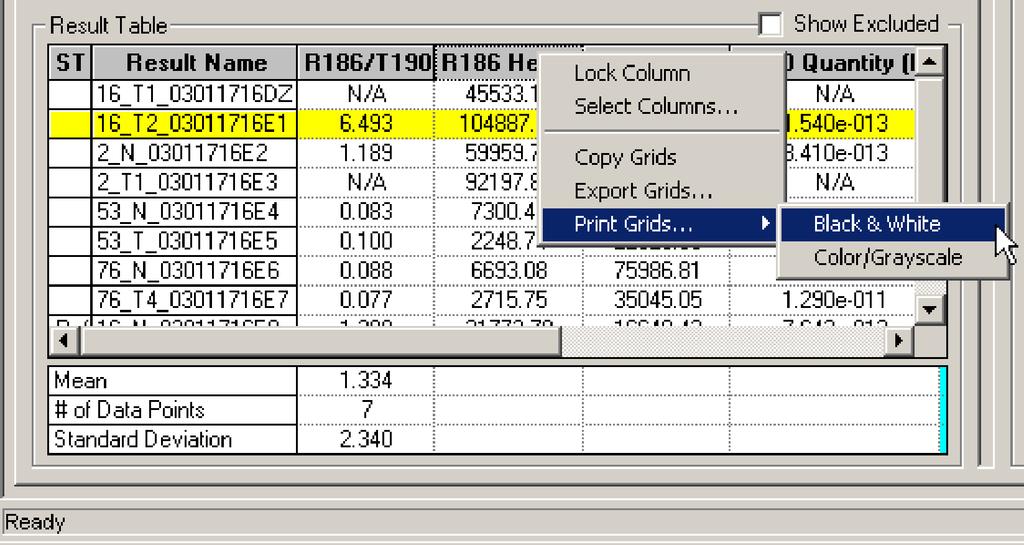
127 Export Results The Peak Ratio grid can be copied and pasted as a complete unit (without selecting specific cells) using the Copy Grids. option. It can also be exported as a.csv file by right-clicking on the grid header row: 123
128 The exported csv file can be found in D:\CEQ8000\Export and is editable in Microsoft Excel program. o An example of the exported file is shown below: ST Result Name R186/T190 R186 Height T190 Height T190 Quantity (M) Comments 16_T1_ DZ N/A N/A N/A Var 16_T2_ E E-13 2_N_ E E-13 2_T1_ E3 N/A N/A N/A 53_N_ E E-11 53_T_ E E-11 76_N_ E E-11 76_T4_ E E-11 Ref 16_N_ E E-13 Mean # of Data Points 7 Standard Deviation 2.34 Name: New Analysis 1 Study: New Study Using: Peak Height Ref Peak Known Quantity: 1E-12 M Max Bin Width: 1.00 Y Threshold: 0 Variant Ratios: Highlighted - 2 Standard Deviations Peak Dye Size (nt) Height Area R186 D T190 D Note the additional information describing the user s settings for the Peak Ratio Analysis. The Exported grid can be regarded as a simple Peak Ratio Analysis report. Similar grids can be printed directly, with or without color/shading, by selecting the Print Grids. option. 124
129 125
130 126
131 Printed Reports Customer Training Guide Checklist Using Grids as Reports Introduction to Report Templates Creating Reports Saving Reports Editing Report Templates Organizing Data Editing Graph Displays Every major grid in the application responds to the following three right-click menu options: Copy Grid(s) Export Grid(s) Print Grid(s) Because of the way the grids can be customized, the grids themselves can be used as reports. This is the only way that the very large Fragment list from the complete study can be displayed. However, for most other analyses, Microsoft Word report templates are available for generating customized reports that include header text, data objects and traces. They can be displayed independently or in iterative loops. Six report templates are included with the CEQ system. Four Reports are independent of secondary analyses: Result o Fragment List Only o Single Sample Result Study o Study Overview o Study traces only, 4 stacks of all results, one for each dye color 127
132 Two Reports depend on secondary analyses: Locus o Locus Tag Information (Auto-binning independent) Binning o Binning Summary Includes Locus Tag information There is a custom property code in the File Properties menu selection that links each report template to the reporting software (File Properties.Custom Tab) The Custom properties are as follows: Name Value Type Study ReportContextTypeID 1008 Number Result ReportContextTypeID 1009 Number Locus ReportContextTypeID 1010 Number Binning ReportContextTypeID 1011 Number It is the code in this field that links a specific reporting template to the Reporting tree member in Study Explorer. If a Report template is modified, it will fall into the same report category unless the context value is also changed. Thus, it is wise to edit Report templates in a way that they will be accessed correctly from the Study Explorer. In other words, to edit a Locus template, start with a Locus template, not a Binning template. 128


133 Using Report Templates to Generate Printed Reports To create a report switch to the Reports Tab of the Study Explorer: Select the template type from the Template drop down list: Select the Context, which in this case, happens to be the specific result file from which to derive the fragment list: 129


134 NOTE: Some options will not be available where choices are not available. Upon completing the selection of options, the CEQ software launches a Microsoft Word document containing the Report. The top portion of the Fragment List Report for a single Result is shown below: 130
135 The figure above shows 14 individual fragment properties distributed over two tables. The Individual Result Fragment List Report Template actually contains 35 different fragment properties arranged in 5 different tables. Individual columns (properties) can be removed or rearranged in a copy of the template and saved under a new name. In this way, flexible reports containing only the data pertinent to the user and his audience can be created and used repeatedly. Saving Reports The original report is automatically saved in the following folder: C:\CEQ System\Reports Edits to the Report can be saved over the original file or under a new name in any desired file location. The CEQ software prompts you to save information when saving the file before closing the Word document. Report templates There are several types of elements in each report template: 1. Header text for data, tables, or graphs Eg. Bin Scatter plot 2. Regular Data Objects Eg. Context.Locus.Name (Locus) 3. Loop Delimiters: BeginLoop: Allele = Context.Locus.Alleles ID: EndLoop: Allele = Context.Locus.Alleles 4. Table Delimiters: Allele.ID Nominal Size: FormatNumber(Allele.TrueSize, 0) Apparent Size: FormatNumber(Allele.ApparentSize, 2) Standard Deviation: FormatNumber(Sqr(Allele.FragmentSizeVariance)) Number of Data Points: Allele.FragmentCount Comment: Allele.Comment TableLoop: Allele = Context.Locus.Alleles 131
 Standard Deviation (nt) FormatNumber(Sqr(Al lele.fragmentsizevaria nce)) Num. Points Allele.FragmentCo unt Comments Allele.Comment Header text can be edited or removed at will.")
136 ID Allele.ID Nominal Size (nt) FormatNumber(Al lele.truesize, 0) 5. Graph Objects Eg. Graph: Service.BinGraph (Context, Site, DisplayOptions) 6. Graph Placeholder pictures: a. Eg. Apparent Size (nt) FormatNumber(Al lele.apparentsize, 2) Standard Deviation (nt) FormatNumber(Sqr(Al lele.fragmentsizevaria nce)) Num. Points Allele.FragmentCo unt Comments Allele.Comment Header text can be edited or removed at will. The header text in the Report Templates provided can be used as references to identify the data objects that follow. Data object descriptions, shaded in gray, can be removed, but should not be edited, because they are very specifically coded to extract data from the database. Do not overwrite the original report template.doc files. They contain a compilation of all available data objects for reporting. 132
Procedure for GeneMapper ID. 1.0 Purpose To specify the steps for performing analysis on DNA samples using GeneMapper ID (GMID) software.
 software.") Procedure for GeneMapper ID 1.0 Purpose To specify the steps for performing analysis on DNA samples using GeneMapper ID (GMID) software. 2.0 Scope This procedure applies to DNA Database Forensic Scientists
Procedure for GeneMapper ID 1.0 Purpose To specify the steps for performing analysis on DNA samples using GeneMapper ID (GMID) software. 2.0 Scope This procedure applies to DNA Database Forensic Scientists
Workflow Guide Slide(s) Topic 2-6 Importing Data and Labeling Samples 7-11 Processing Data Without an Allelic Ladder Processing Data With an
 Topic 2-6 Importing Data and Labeling Samples 7-11 Processing Data Without an Allelic Ladder Processing Data With an") Workflow Guide Slide(s) Topic 2-6 Importing Data and Labeling Samples 7-11 Processing Data Without an Allelic Ladder 12-23 Processing Data With an Allelic Ladder 24-30 Reviewing Size and Allele Calls 31-37
Workflow Guide Slide(s) Topic 2-6 Importing Data and Labeling Samples 7-11 Processing Data Without an Allelic Ladder 12-23 Processing Data With an Allelic Ladder 24-30 Reviewing Size and Allele Calls 31-37
GeneMarker HID Quick Start
 GeneMarker HID Quick Start Guide Upload Data Run Wizard Size Call Quality Review Edit Panel Compare & Analyze Save & Print Reports SoftGenetics Relationship Testing Start Your Project Open Data Open Data
ABI PRISM GeneMapper Software Version 3.0 SNP Genotyping
 ABI PRISM GeneMapper Software Version 3.0 SNP Genotyping Tutorial ABI PRISM GeneMapper Software Version 3.0 SNP Genotyping Tutorial September 25, 2002 1:20 pm, 7x9_Title.fm Copyright 2002, Applied Biosystems.
Applied Biosystems TrueScience Aneuploidy STR Kits
 Applied Biosystems TrueScience Aneuploidy STR Kits Software Setup and Data Analysis User Guide The results obtained from these or any other diagnostic kits should be used and interpreted only in the context
APPLICATION INFORMATION
 GeXP-A-0002 APPLICATION INFORMATION G e n e t i c A n a l y s i s : G e X p Multiple Gene Normalisation and Alternative Export of Gexp Data Expression analysis on the GeXP platform. James Studd MSc Manfred
LEGENDplex Data Analysis Software Version 8 User Guide
 LEGENDplex Data Analysis Software Version 8 User Guide Introduction Welcome to the user s guide for Version 8 of the LEGENDplex data analysis software for Windows based computers 1. This tutorial will
Geneious Microsatellite Plugin. Biomatters Ltd
 Geneious Microsatellite Plugin Biomatters Ltd November 24, 2018 2 Introduction This plugin imports ABI fragment analysis files and allows you to visualize traces, fit ladders, call peaks, predict bins,
TraceFinder Analysis Quick Reference Guide
 TraceFinder Analysis Quick Reference Guide This quick reference guide describes the Analysis mode tasks assigned to the Technician role in the Thermo TraceFinder 3.0 analytical software. For detailed descriptions
You will see the difference!
 NDIS Approved Expert System Fast, Accurate, and User-friendly ~ Documented time savings of up to 40%1 ~ Up to 70% less analyst intervention2 User Management with Audit Trail Mixture Analysis Relationship
Devyser QF-PCR. Guide to Sample Runs, Data Analysis & Results Interpretation
 Devyser QF-PCR Guide to Sample Runs, Data Analysis & Results Interpretation Version 4-2013 Contents 1. Setting up a sample run on an ABI Genetic Analyzer... 3 1.1 Introduction... 3 1.2 Workflow... 3 1.3
Generating a Custom Bill of Materials
 Generating a Custom Bill of Materials Old Content - visit altium.com/documentation Modified by on 6-Nov-2013 This tutorial describes how to use the Report Manager to set up a Bill of Materials (BOM) report.
GeneMapper Software v3.5
 GeneMapper Software v3.5 Installation Instructions This document includes: Before You Install v3.5................................... 2 Installing the Instrument Configuration...................... 6 Installing
SequencePro Data Analysis Application. User Guide
 SequencePro Data Analysis Application User Guide SequencePro Data Analysis Application User Guide DRAFT October 31, 2001 12:52 pm, Title_page.fm Copyright 2001, Applied Biosystems. All rights reserved.
TraceFinder Analysis Quick Reference Guide
 TraceFinder Analysis Quick Reference Guide This quick reference guide describes the Analysis mode tasks assigned to the Technician role in Thermo TraceFinder analytical software. For detailed descriptions
Tour Guide for Windows and Macintosh
 Tour Guide for Windows and Macintosh 2011 Gene Codes Corporation Gene Codes Corporation 775 Technology Drive, Suite 100A, Ann Arbor, MI 48108 USA phone 1.800.497.4939 or 1.734.769.7249 (fax) 1.734.769.7074
Genetic Analysis. Page 1
 Genetic Analysis Page 1 Genetic Analysis Objectives: 1) Set up Case-Control Association analysis and the Basic Genetics Workflow 2) Use JMP tools to interact with and explore results 3) Learn advanced
Use the AccuSEQ Software v2.0 Custom Experiment mode
 QUICK REFERENCE Use the AccuSEQ Software v2.0 Custom Experiment mode Publication Part Number 4425585 Revision Date 25 January 2013 (Rev. B) Custom Experiments Note: For safety and biohazard guidelines,
Olink NPX Manager. User Guide
 Olink NPX Manager User Guide Table of contents INTRODUCTION 3 Process 3 Limitations 3 Requirements for analysis 3 List of abbreviations 3 TO CREATE A HEAT MAP CT CSV FILE 4 OLINK NPX MANAGER STEP BY STEP
Data Collection Software Release Notes. Real-Time PCR Analysis Software Release Notes. SNP Genotyping Analysis Software Release Notes
 PN 101-6531 D1 RELEASE NOTES Biomark/EP1 Software To download the latest version of the software for Biomark HD, Biomark, and EP1, go to fluidigm.com/software. For more information about updating the software,
All About PlexSet Technology Data Analysis in nsolver Software
 All About PlexSet Technology Data Analysis in nsolver Software PlexSet is a multiplexed gene expression technology which allows pooling of up to 8 samples per ncounter cartridge lane, enabling users to
GeneMapper ID-X Software
 Quick Reference Guide GeneMapper ID-X Software Version 1.0 Overview GeneMapper ID-X Software Version 1.0 is an automated genotyping software solution for all human identification (HID) data analysis needs,
Guide to running KASP TM genotyping reactions on the Roche LC480-Series instruments
 extraction sequencing genotyping extraction sequencing genotyping extraction sequencing genotyping extraction sequencing Guide to running KASP TM genotyping reactions on the Roche LC480-Series instruments
Solo 4.6 Release Notes
 June9, 2017 (Updated to include Solo 4.6.4 changes) Solo 4.6 Release Notes This release contains a number of new features, as well as enhancements to the user interface and overall performance. Together
HID Real-Time PCR Analysis Software
 USER GUIDE HID Real-Time PCR Analysis Software Version 1.3 for use with: 7500 Real-Time PCR Instruments QuantStudio 5 Real-Time PCR Instruments (with 0.2-mL 96-Well Block) Quantifiler DNA Quantification
ChromQuest 5.0 Quick Reference Guide
 ChromQuest 5.0 Quick Reference Guide This guide contains an overview of the ChromQuest chromatography data system, with topics organized by workflow. For more information, refer to the ChromQuest User
Created by Damian Goodridge Page 1 of 38 Created on 12/10/2004 2:08 PM. User Guide. Assign-SBT TM 3.2.7
 Created by Damian Goodridge Page 1 of 38 User Guide Assign-SBT TM 3.2.7 Created by Damian Goodridge Page 2 of 38 1 Introduction... 5 1.1 Overview... 5 1.2 Unique Features... 5 1.3 Summary of Functions...
Working with Mailbox Manager
 Working with Mailbox Manager A user guide for Mailbox Manager supporting the Message Storage Server component of the Avaya S3400 Message Server Mailbox Manager Version 5.0 February 2003 Copyright 2003
EcoStudy Software User Guide
 EcoStudy Software User Guide FOR RESEARCH USE ONLY What is EcoStudy? 3 Setting Up a Study 4 Specifying Analysis Settings for your Study 6 Reviewing the Data in your Study 8 Exporting Study Data to a Report
Importing data in a database with levels
 BioNumerics Tutorial: Importing data in a database with levels 1 Aim In this tutorial you will learn how to import data in a BioNumerics database with levels and how to replicate and summarize level-specific
cief Data Analysis Chapter Overview Chapter 12:
 page 285 Chapter 12: cief Data Analysis Chapter Overview Analysis Screen Overview Opening Run Files How Run Data is Displayed Viewing Run Data Data Notifications and Warnings Checking Your Results Group
User Bulletin. ABI PRISM GeneScan Analysis Software for the Windows NT Operating System. Introduction DRAFT
 User Bulletin ABI PRISM GeneScan Analysis Software for the Windows NT Operating System SUBJECT: June 2002 Overview of the Analysis Parameters and Size Caller Introduction In This User Bulletin Purpose
COPYRIGHTED MATERIAL. Making Excel More Efficient
 Making Excel More Efficient If you find yourself spending a major part of your day working with Excel, you can make those chores go faster and so make your overall work life more productive by making Excel
Gene. The Biologist Friendly Software. Quickstart Guide
 Gene The Biologist Friendly Software Quickstart Guide Gene Workflow: Load Raw Data Choose Template(s) Process Samples GeneMarker allows the user to extensively customize the data processing options, and
ABI PRISM GeneMapper Software Version 3.0. User s Manual
 ABI PRISM GeneMapper Software Version 3.0 User s Manual Copyright 2002, Applied Biosystems. All rights reserved. For Research Use Only. Not for use in diagnostic procedures. Information in this document
CFX Maestro Software for Mac
 Real-Time PCR CFX Maestro Software for Mac User Guide Version 1.0 CFX Maestro Software for Mac User Guide Version 1.0 Bio-Rad Technical Support Department The Bio-Rad Technical Support department in the
Setup and analysis Mic qpcr Cycler. (magnetic induction cycler; Bio Molecular Systems)
") Setup and analysis Mic qpcr Cycler (magnetic induction cycler; Bio Molecular Systems) General remark Runs on Mic (Bio Molecular Systems) can be set up and analysed either manually (described in part 1
Setup and analysis Mic qpcr Cycler (magnetic induction cycler; Bio Molecular Systems) General remark Runs on Mic (Bio Molecular Systems) can be set up and analysed either manually (described in part 1
QDA Miner. Addendum v2.0
 QDA Miner Addendum v2.0 QDA Miner is an easy-to-use qualitative analysis software for coding, annotating, retrieving and reviewing coded data and documents such as open-ended responses, customer comments,
MasterPlex ReaderFit TUTORIAL
 TUTORIAL MasterPlex ReaderFit A H I T A C H I S O F T W A R E C O M P A N Y For Research Use Only 601 Gateway Blvd. Suite 100 South San Francisco, CA 94080 TELEPHONE 1.888.615.9600 (toll free) 1.650.615.7600
Applied Biosystems RapidFinder Software Version 1.0 and SDS Software Version Beta Release 10/05 Release Notes (PN Rev A)
") Applied Biosystems RapidFinder Software Version 1.0 and SDS Software Version 1.3.2 Beta Release 10/05 Release Notes (PN 4370225 Rev A) Software Release notes for: Applied Biosystems RapidFinder Software
Applied Biosystems RapidFinder Software Version 1.0 and SDS Software Version 1.3.2 Beta Release 10/05 Release Notes (PN 4370225 Rev A) Software Release notes for: Applied Biosystems RapidFinder Software
Improving Productivity with Parameters
 Improving Productivity with Parameters Michael Trull Rocky Brown Thursday, January 25, 2007 Improving Productivity with Parameters Part I The Fundamentals Parameters are variables which define the size
MASSEY GENOME SERVICE
 MASSEY GENOME SERVICE Sanger Sequencing and Genotyping using ABI3730 capillary instrumentation Operational since 2003 SUBMISSION OF ONLINE REQUEST & RESULTS DOWNLOAD BULLETIN January 2017 BULLETIN INCLUDES
Chromatography Software Training Materials. Contents
 Chromatography Software Training Materials This document contains information on how to build a method, start the instrument to acquire data, and then process the data using the Galaxie Program. You will
Navigator Software User s Manual. User Manual. Navigator Software. Monarch Instrument Rev 0.98 May Page 1 of 17
 User Manual Navigator Software Monarch Instrument Rev 0.98 May 2006 Page 1 of 17 Contents 1. NAVIGATOR SOFTWARE 2. INSTALLATION 3. USING NAVIGATOR SOFTWARE 3.1 STARTING THE PROGRAM 3.2 SYSTEM SET UP 3.3
Data acquisition and analysis of MACSPlex Cytokine Kits using the MACSQuant Analyzer Express Modes in MACSQuantify Software version 2.
 Data acquisition and analysis of MACSPlex Cytokine Kits using the MACSQuant Analyzer Express Modes in MACSQuantify Software version 2.6 Contents 1. Description 1.1 Background information 1.2 Reagent and
wgmlst typing in the Brucella demonstration database
 BioNumerics Tutorial: wgmlst typing in the Brucella demonstration database 1 Introduction This guide is designed for users to explore the wgmlst functionality present in BioNumerics without having to create
Analyzing a Project without a Reference
 Applied Biosystems Variant Reporter Software v1.0 Analyzing a Project without a Reference Quick Reference Card This quick reference card summarizes the procedures for setting up a project in Applied Biosystems
Performer to DP2 Hot Folder Reference Manual Rev There is only one file involved with installing the Performer to DP2 Hot Folder.
 Performer to DP2 Hot Folder Reference Manual Rev. 07.11.05 Install Files: There is only one file involved with installing the Performer to DP2 Hot Folder. The installer file is named PP2DP2_1.x.x.EXE.
SIVIC GUI Overview. SIVIC GUI Layout Overview
 SIVIC GUI Overview SIVIC GUI Layout Overview At the top of the SIVIC GUI is a row of buttons called the Toolbar. It is a quick interface for loading datasets, controlling how the mouse manipulates the
(Updated 29 Oct 2016)
") (Updated 29 Oct 2016) 1 Class Maker 2016 Program Description Creating classes for the new school year is a time consuming task that teachers are asked to complete each year. Many schools offer their students
(Updated 29 Oct 2016) 1 Class Maker 2016 Program Description Creating classes for the new school year is a time consuming task that teachers are asked to complete each year. Many schools offer their students
1. AUTO CORRECT. To auto correct a text in MS Word the text manipulation includes following step.
 1. AUTO CORRECT - To auto correct a text in MS Word the text manipulation includes following step. - STEP 1: Click on office button STEP 2:- Select the word option button in the list. STEP 3:- In the word
GeneMapper ID-X Software Version 1.2
 GeneMapper ID-X Software Version 1.2 USER BULLETIN DECEMBER 2010 SUBJECT: Verification Experiments and Installation Procedures Purpose of this user bulletin In this user bulletin This user bulletin: Describes
Importing and processing AFLP sequencer curve files
 BioNumerics Tutorial: Importing and processing AFLP sequencer curve files 1 Aim Comprehensive tools for processing electrophoresis fingerprints, both from slab gels and capillary sequencers are incorporated
Excel Select a template category in the Office.com Templates section. 5. Click the Download button.
 Microsoft QUICK Excel 2010 Source Getting Started The Excel Window u v w z Creating a New Blank Workbook 2. Select New in the left pane. 3. Select the Blank workbook template in the Available Templates
Configuring GeneMapper ID Software
 Configuring GeneMapper ID Software using Advanced algorithm analysis Importing the Panels and Bins In order to successfully genotype AmpFlSTR kit samples, the panels and bins must be imported. The panels
Operating instructions for MixtureCalc v1.2 (Freeware Version)
") 1 Objective To provide instructions for importing data into and for performing mixture calculations using MixtureCalc-v1.2. MixtureCalc-v1.2 is validated for SPSA casework only and no warranty is provided
1 Objective To provide instructions for importing data into and for performing mixture calculations using MixtureCalc-v1.2. MixtureCalc-v1.2 is validated for SPSA casework only and no warranty is provided
Tutorial: FCAP Array Software with BD FACSArray Bioanalyzer
 Tutorial: FCAP Array Software with BD FACSArray Bioanalyzer After completing this tutorial you will be able to: Create an Experiment with the Experiment Wizard in FCAP Array software. Export the Experiment
FRAGMENT ANALYSIS USING ABI 3730/3730XL HANDBOOK. Fragment Analysis using ABI 3730/3730xL, 7-B406, version Devyser AB, 2018 Page 1 of 11
 FRAGMENT ANALYSIS USING ABI 3730/3730XL HANDBOOK Devyser AB, 2018 Page 1 of 11 Contents 1. DEV-5 SPECTRAL CALIBRATION... 3 1.1. Preparing DEV-5 Spectral Calibration standards... 3 1.2. Creating a Spectral
Piping & Instrumentation Diagrams
 Page 1 Piping & Instrumentation Diagrams Preface Using This Guide What's New? Getting Started Entering the Workbench Setting up Working Units and Grid Placing Components Routing a Piping Line or I & C
EXCEL 2003 DISCLAIMER:
 EXCEL 2003 DISCLAIMER: This reference guide is meant for experienced Microsoft Excel users. It provides a list of quick tips and shortcuts for familiar features. This guide does NOT replace training or
Agilent 2100 Bioanalyzer. User s Guide for Molecular Assays
 Agilent 2100 Bioanalyzer User s Guide for Molecular Assays ! WARNING For details of safety, see the Site Preparation and Safety Manual for the Agilent 2100 Bioanalyzer. The Agilent 2100 Bioanalyzer is
Function. Description
 Function Check In Get / Checkout Description Checking in a file uploads the file from the user s hard drive into the vault and creates a new file version with any changes to the file that have been saved.
Step-by-Step Guide to Basic Genetic Analysis
 Step-by-Step Guide to Basic Genetic Analysis Page 1 Introduction This document shows you how to clean up your genetic data, assess its statistical properties and perform simple analyses such as case-control
NCSBI Forensic Biology Section DNA SOP Effective Date: January 30, 2007 Title: ABI PRISM 7000: DNA Quantitation Revision 02
 1. Preparing the DNA Standards 1.1. Label eight microcentrifuge tubes to be used for dilution of standards (i.e. Std. 1, Std. 2, Std. 3, etc.) 1.2. Add required amount of TE/glycogen to each tube (See
GenomeStudio Software Release Notes
 GenomeStudio Software 2009.2 Release Notes 1. GenomeStudio Software 2009.2 Framework... 1 2. Illumina Genome Viewer v1.5...2 3. Genotyping Module v1.5... 4 4. Gene Expression Module v1.5... 6 5. Methylation
Applied Biosystems Variant Reporter Software
 Getting Started Guide Applied Biosystems Variant Reporter Software Version 1.1 Getting Started Guide Get Started Variant Reporter Software Version 1.1 Set Up the Software Set Up a Project Review a Project
CSV Roll Documentation
 CSV Roll Documentation Version 1.1 March 2015 INTRODUCTION The CSV Roll is designed to display the contents of a Microsoft Excel worksheet in a Breeze playlist. The Excel worksheet must be exported as
Manual Physical Inventory Upload Created on 3/17/2017 7:37:00 AM
 Created on 3/17/2017 7:37:00 AM Table of Contents... 1 Page ii Procedure After completing this topic, you will be able to manually upload physical inventory. Navigation: Microsoft Excel > New Workbook
SOLOMON: Parentage Analysis 1. Corresponding author: Mark Christie
 SOLOMON: Parentage Analysis 1 Corresponding author: Mark Christie christim@science.oregonstate.edu SOLOMON: Parentage Analysis 2 Table of Contents: Installing SOLOMON on Windows/Linux Pg. 3 Installing
ABI PRISM 3100-Avant and 3100 Data Collection v2.0 Software Frequently Asked Questions (FAQ)
") ABI PRISM 3100-Avant and 3100 Data Collection v2.0 Software Frequently Asked Questions (FAQ) Table of Contents General Information...2 Access Control/Auditing Features...2 Instrument/Plate Setup...3 Spectral
ABI PRISM 3100-Avant and 3100 Data Collection v2.0 Software Frequently Asked Questions (FAQ) Table of Contents General Information...2 Access Control/Auditing Features...2 Instrument/Plate Setup...3 Spectral
Importing and processing VNTR sequencer curve files
 BioNumerics Tutorial: Importing and processing VNTR sequencer curve files 1 Aim Comprehensive tools for processing electrophoresis fingerprints, both from slab gels and capillary sequencers are incorporated
Importing Geochemical Data
 Importing Geochemical Data This Importing Geochemistry Data How-to Guide introduces you to working with Geochemistry data, including how to design a new survey, import data, merge and verify, extract and
SUM - This says to add together cells F28 through F35. Notice that it will show your result is
 COUNTA - The COUNTA function will examine a set of cells and tell you how many cells are not empty. In this example, Excel analyzed 19 cells and found that only 18 were not empty. COUNTBLANK - The COUNTBLANK
HOW TO USE THE EXPORT FEATURE IN LCL
 HOW TO USE THE EXPORT FEATURE IN LCL In LCL go to the Go To menu and select Export. Select the items that you would like to have exported to the file. To select them you will click the item in the left
CCRS Quick Start Guide for Program Administrators. September Bank Handlowy w Warszawie S.A.
 CCRS Quick Start Guide for Program Administrators September 2017 www.citihandlowy.pl Bank Handlowy w Warszawie S.A. CitiManager Quick Start Guide for Program Administrators Table of Contents Table of Contents
EXCEL BASICS: MICROSOFT OFFICE 2007
 EXCEL BASICS: MICROSOFT OFFICE 2007 GETTING STARTED PAGE 02 Prerequisites What You Will Learn USING MICROSOFT EXCEL PAGE 03 Opening Microsoft Excel Microsoft Excel Features Keyboard Review Pointer Shapes
Precision Melt Analysis Software. User Guide
 Precision Melt Analysis Software User Guide Precision Melt Analysis Software User Guide Version 1.0 Bio-Rad Technical Support Department The Bio-Rad Technical Support department in the U.S. is open Monday
Spreadsheet definition: Starting a New Excel Worksheet: Navigating Through an Excel Worksheet
 Copyright 1 99 Spreadsheet definition: A spreadsheet stores and manipulates data that lends itself to being stored in a table type format (e.g. Accounts, Science Experiments, Mathematical Trends, Statistics,
Spreadsheet Warm Up for SSAC Geology of National Parks Modules, 2: Elementary Spreadsheet Manipulations and Graphing Tasks
 University of South Florida Scholar Commons Tampa Library Faculty and Staff Publications Tampa Library 2009 Spreadsheet Warm Up for SSAC Geology of National Parks Modules, 2: Elementary Spreadsheet Manipulations
Getting Started. Environmental Analysis Software
 Getting Started Environmental Analysis Software Environmental Software Overview The Environmental software is a data acquisition and data analysis package designed to assist you in complying with United
Oracle Financial Services Behavior Detection Platform: Administration Tools User Guide. Release May 2012
 Oracle Financial Services Behavior Detection Platform: Administration Tools User Guide Release 6.1.1 May 2012 Oracle Financial Services Behavior Detection Platform: Administration Tools User Guide Release
Mic qpcr. Fast. Accurate. Compact. Ultimate Performance for Real-Time PCR. Speed Accuracy Size Connectivity
 Mic qpcr Ultimate Performance for Real-Time PCR Fast. Accurate. Compact. Speed Accuracy Size Connectivity Hardware Style meets substance - ultimate performance, beautiful design. Fast results without compromise
Gallios TM Quick Reference
 Gallios TM Quick Reference Purpose: The purpose of this Quick Reference is to provide a simple step by step outline of the information needed to perform various tasks on the system. We begin with basic
QTX. Tutorial for. by Kim M.Chmielewicz Kenneth F. Manly. Software for genetic mapping of Mendelian markers and quantitative trait loci.
 Tutorial for QTX by Kim M.Chmielewicz Kenneth F. Manly Software for genetic mapping of Mendelian markers and quantitative trait loci. Available in versions for Mac OS and Microsoft Windows. revised for
Business Insight Authoring
 Business Insight Authoring Getting Started Guide ImageNow Version: 6.7.x Written by: Product Documentation, R&D Date: August 2016 2014 Perceptive Software. All rights reserved CaptureNow, ImageNow, Interact,
For additional information, please consult the Read-Me and Help documentation or contact Electro-Voice or Dynacord technical support.
 Quick Start Guide Hello, and welcome to IRIS-Net software. We want you to get the most from your IRIS-Net projects and encourage you to explore the additional Read-Me and Help documentation provided with
CellaVision Proficiency Software
 CellaVision Proficiency USER S MANUAL 2.3 CellaVision Proficiency Preface CellaVision is a trademark of CellaVision AB. All other trademarks used in this document are property of their respective owners.
Podium Plus Data Analysis Software. User Manual. SWIS10 Version
 SWIS10 Version Issue 1.10 February 2005 Contents 1 Introduction 6 1.1 What is Podium Plus? 6 1.2 About This Manual 6 1.3 Typographical Conventions 7 1.4 Getting Technical Support 7 2 Getting Started 8
Excel 2013 Intermediate
 Excel 2013 Intermediate Quick Access Toolbar... 1 Customizing Excel... 2 Keyboard Shortcuts... 2 Navigating the Spreadsheet... 2 Status Bar... 3 Worksheets... 3 Group Column/Row Adjusments... 4 Hiding
NC SBI: Forensic Biology Section DNA SOP Effective Date: July 19, 2004 Title: FMBIO Analysis Revision 04
 1. Scanning Polyacrylamide Gels 1.1 Turn on the scanner and computer. 1.2 Allow the laser in the scanner to warm up. (A red light will come on if there is an error, usually due to the scanner lid not being
Math 227 EXCEL / MEGASTAT Guide
 Math 227 EXCEL / MEGASTAT Guide Introduction Introduction: Ch2: Frequency Distributions and Graphs Construct Frequency Distributions and various types of graphs: Histograms, Polygons, Pie Charts, Stem-and-Leaf
E. coli functional genotyping: predicting phenotypic traits from whole genome sequences
 BioNumerics Tutorial: E. coli functional genotyping: predicting phenotypic traits from whole genome sequences 1 Aim In this tutorial we will screen genome sequences of Escherichia coli samples for phenotypic
1-Step Appraisals Personal Property Appraisal Software
 User Guide for 1-Step Appraisals Personal Property Appraisal Software Home & Business Software for Windows Page Table of Contents Getting Started... Page 3 Image Preferences... Page 4 Adding Business/Company
What is new in BioChek II Software version 2018
 What is new in BioChek II Software version 2018 Elisa Test Create a plate layout Automatic registration of Customers and flocks/herds: Select Customers from a drop-down list Add Last Vaccination Quick
Excel. module. Lesson 1 Create a Worksheet Lesson 2 Create and Revise. Lesson 3 Edit and Format
 module 2 Excel Lesson 1 Create a Worksheet Lesson 2 Create and Revise Formulas Lesson 3 Edit and Format Worksheets Lesson 4 Print Worksheets Lesson 5 Modify Workbooks Lesson 6 Create and Modify Charts
Creating Reports in Access 2007 Table of Contents GUIDE TO DESIGNING REPORTS... 3 DECIDE HOW TO LAY OUT YOUR REPORT... 3 MAKE A SKETCH OF YOUR
 Creating Reports in Access 2007 Table of Contents GUIDE TO DESIGNING REPORTS... 3 DECIDE HOW TO LAY OUT YOUR REPORT... 3 MAKE A SKETCH OF YOUR REPORT... 3 DECIDE WHICH DATA TO PUT IN EACH REPORT SECTION...
Creating a custom mappings similarity matrix
 BioNumerics Tutorial: Creating a custom mappings similarity matrix 1 Aim In BioNumerics, character values can be mapped to categorical names according to predefined criteria (see tutorial Importing non-numerical
LINAX Series Videographic Recorders
 User Guide 154534_8 LINAX Series Videographic Recorders DataManager Software Electrical Safety This instrument complies with the requirements of CEI/IEC 61010-1:2001-2 'Safety Requirements for Electrical
GeneMapper Software v3.5
 GeneMapper Software v3.5 User Guide August 29, 2003 9:32 am, GM v3.5 Title.fm Copyright 2003, Applied Biosystems. All rights reserved. For Research Use Only. Not for use in diagnostic procedures. Information
GPR Analyzer version 1.23 User s Manual
 GPR Analyzer version 1.23 User s Manual GPR Analyzer is a tool to quickly analyze multi- species microarrays, especially designed for use with the MIDTAL (Microarray Detection of Toxic ALgae) chip. It