Automatic Reporting. Real-Time and Wireless Recording and Alarming
|
|
|
- Toby Haynes
- 5 years ago
- Views:
Transcription
1

2 Automatic Reporting The software's Automatic Report Generator offers the ability to combine and analyze data from multiple loggers into a single report. The delta,minimum, and maximum statistics can be calculated automatically for each parameter. The graph can be printed along with the report to provide the necessary data and process information. The software offers several options for standard reports with prompts to tailor the report by exporting to MS Excel and adding your companys logo. Real-Time and Wireless Recording and Alarming The real time recording feature in the software allows a logger that is connected to the PC to report and display data on the PC screen in real time. The wireless series is configured at the PC and placed in a location to monitor. The data logger then transmits data back to the RFC101A receiver. The software can be configured for scheduled automatic saving of the data, minimizing the chance of losing valuable data. Alarm limits can be set for any type of unit. Alarm notifications can be sent via PC screen, or text messaging in any combination. notification may be used with many compatible SMS (Short Messaging Service) cell phones and pagers. Lethality Equations For customers validating pasteurization and steam sterilization processes the software automatically calculates the kill factor for either Pasteurization (PU) or Sterilization (F0), depending on the users preferences.this data is displayed in the summary tab and is automatically calculated from the data displayed in the graph tab.

3 Units of Measure and Analysis The software effortlessly converts data into the industry standard measurement units. Most common measurement units are available to minimize manual conversion. Users can easily switch from displaying one unit of measurement to another. Unit preferences can be stored such that all data is displayed in the users preferred unit and range. Complex analyses such as Mean Kinetic Temperature, Sterilization Units and Pasteurization Units can be performed with just one click of the mouse. If custom analysis is needed beyond what the software can perform, the data can be automatically exported to an MS Excel spreadsheet. Overlay Graphs Graphs from multiple data loggers can be overlayed onto a single graph for simple, easy comparison. For example, comparing the temperature data from four different data loggers that took data in the basement, first floor, second floor and attic is quickly done on one graph. Switching between viewing one data set and multiple data sets is handled by simply clicking the Graph and Composite Graph tabs located at the top of the screen. The Composite Graph tab shows overlayed data sets, while the Graph tab shows only one data set at a time. The Composite Graph can synchronize the time scales to time-align all data or simply overlay all data to compare data sets from different runs. Annotations The annotation capability allows the user to associate comments (eg. closed door) with specific data points on a graph. This is especially useful for presentations and allows for permanently demarcating salient events in the data.

4 Digital Calibration The software allows the user to calibrate the sensor channels with either a one-point or two point calibration (sensor and logger dependent). Because this feature is built into the software and is readily accessible, sensors can be calibrated and re-calibrated as necessary. This is especially useful when using probes since calibration parameters can change from one probe to another. The software has a calibration wizard which asks for the calibration points (e.g. the actual value & measured value of two separate points) and calculates, then inserts the appropriate calibration coefficients automatically Summary View and Table View The main software page has two additional tabs: Summary and Data. The Summary tab shows the statistical analyses (as appropriate) for the data visible in the graph window. For example, if the Mean Kinetic Temperature (MKT) of Temp101 data is required on March 13th, the horizontal (time) zoom tool is used to select the 24 hours of March 13th. Then when the Summary tab is clicked, the MKT of the temperature data from March 13th will be calculated and displayed. The table view (Data tab) shows the time stamp and data values of each sample in a matrix format. Customizable Graphs There are many ways the data graphs can be customized for presentation. Adding annotations (see above) and graph titles make the graph understandable. Aesthetics can also be addressed; the graphs can change in color (lines, data background), line thickness, data point frequency, data point symbols, and the time and data axis spans are fully configurable. Software Features Alarm Notification: The software offers a real-time alarm notification function which lets the user monitor user-defined alarm limits. Alarm messages can be sent in real time to your desktop or sent remotely via or pager. Overlay Multiple Graphs: Simultaneously analyze data from several units or deployments; easily switch to a single
5 data series. Automatic Time Synchronization: Automatically align data from different loggers on the same graph and synchronizes them in time. Export to Excel : Excel button on toolbar allows simple one click data export to Microsoft Excel. One click of the Excel Icon will automatically open Excel and format the data into a spread sheet. This command will automatically synchronize, in time, data from multiple data loggers and store the data in an Excel spreadsheet. Export Data: Data may be exported in the following formats:.dat - This is our own internal ASCII data format which can be viewed by most text editing or word processing software..txt - Files stored in this format contain tab delimited text and can be viewed by most word processing and spreadsheet programs..csv - Files stored in this format contain comma separated values and are directly readable by Microsoft Excel and many other spreadsheet programs. Real-Time Recording: Collect and display data in real-time while continuing to log. Statistics: Automatically calculates averages, minimum, maximum, standard deviation, and mean kinetic temperature. Summary: View statistics and alarm information in a simplified report format. Data Table: Instantly access tabular view for detailed dates, times, values, and annotations Zoom: Magnify specific data with powerful zoom and drag tools. Supports multiple zoom in and zoom out modes. Features extended zoom capabilities; box zoom, vertical zoom, and horizontal zoom as well as point and click. Formatting Options: Choose colors, line styles, plotting options, show or hide channels for desired format. Scaling Options: Autoscale function fits data to the screen, or allows values to be manually entered. Engineering Units: Define the type of units to be displayed on the graph using the Engineering Units Wizard. User defined engineering units may be applied to voltage, current, pulse, event and state loggers. Menu Accessibility: Right click on the graph for easy access to all formatting, measurement units and graphing tools menu options.
6 Annotation: Easily annotate specific data points on the graph with a click of the mouse. Graphical Cursor: One click displays readings by time, value, parameter or sample number. Printing: Automatically print graphical or tabular data. Communications: The communications port sets up automatically or user-configured. Logger Configuration: Easy installation and launch of data loggers with immediate or delayed start, preferred sample rate, and device ID. Calibration: Fully digital calibration function automatically stores parameters in device. A calibration wizard is provided in the software to simplify the calibration procedure. Uninterrupted Data Retrieval: Data may be downloaded from the logger without interrupting the operation of the unit as it continues to log data.
Procédés, Test et Mesure, Métrologie, Automation
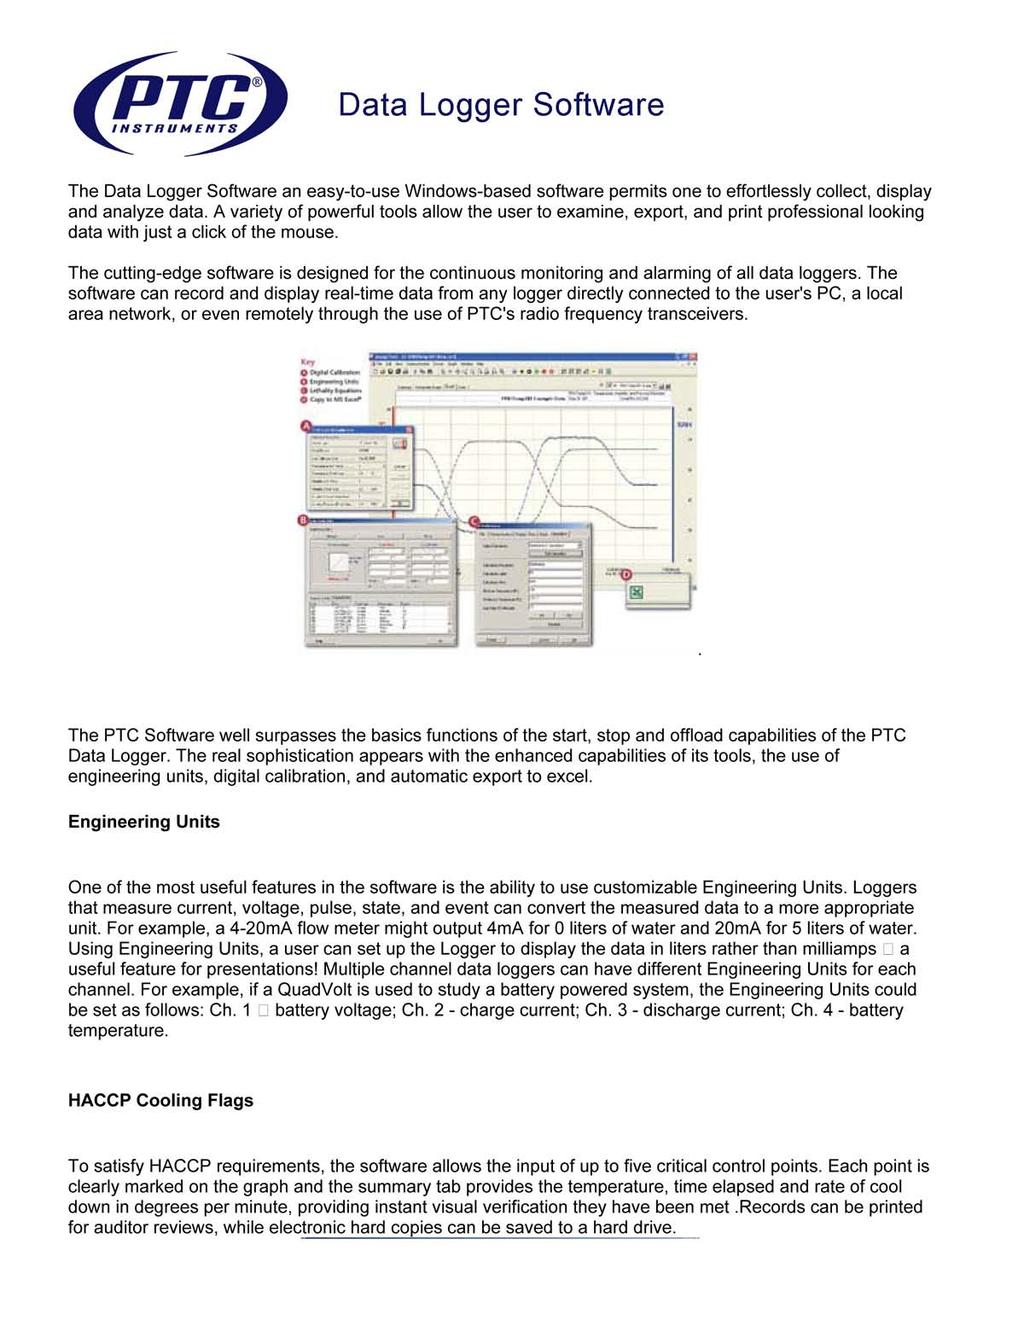
 DATA LOGGER SOFTWARE VERSION 2.00.73 The Data Logger Software an easy-to-use Windows-based software permits one to effortlessly collect, display and analyze data. A variety of powerful tools allow the
Logger Pro Resource Sheet
 Logger Pro Resource Sheet Entering and Editing Data Data Collection How to Begin How to Store Multiple Runs Data Analysis How to Scale a Graph How to Determine the X- and Y- Data Points on a Graph How
Logger Pro 3. Quick Reference
 Logger Pro 3 Quick Reference Getting Started Logger Pro Requirements To use Logger Pro, you must have the following equipment: Windows 98, 2000, ME, NT, or XP on a Pentium processor or equivalent, 133
MicroLite & MicroLab Lite User Guide. First Edition First Print February 2007 Fourier Systems Ltd.
 MicroLite & MicroLab Lite User Guide First Edition First Print February 2007 Fourier Systems Ltd. Contents Introduction... 1 Chapter 1 Using the MicroLite... 2 1.1. Overview... 3 1.2. Getting Started...
Committed to Quality. MicroLogPRO Solution. User Guide
 Committed to Quality MicroLogPRO Solution User Guide MicroLogPRO & MicroLog Plus User Guide Third Edition First Print April 2007 Fourier Systems Ltd. Contents Using the Guide... 1 Compliance with FDA
! "# $ % & '( ) *%+,* % -. ) /. 1 P a g e
 *%+,* % -. ) /. 1 P a g e") !"#$% & '()*%+,*% -.)/. 1 P a g e Table of Contents Introduction... 3 Warranty... 3 Battery Warning... 3 Battery Replacement... 3 Hardware... 4 Package Inspection... 4 System Requirements... 4 Software
!"#$% & '()*%+,*% -.)/. 1 P a g e Table of Contents Introduction... 3 Warranty... 3 Battery Warning... 3 Battery Replacement... 3 Hardware... 4 Package Inspection... 4 System Requirements... 4 Software
First Edition Termologger USB & OSAKA MicroLab Lite User guide
 First Edition Termologger USB & OSAKA MicroLab Lite User guide First Print February 2007 Introduction The Termologger USB is a compact 16-bit USB data logger designed for accurate temperature monitoring
Getting Started. Ohm Portal. v2_ec01b38. Buddy Platform, Limited Ltd.
 Getting Started Ohm Portal v2_ec01b38 Buddy Platform, Limited Ltd. GU/US/18/09 Ohm Portal Get Started Guide Workspace Basics Workspace Basics Navigation Hierarchy An Organization is the top level in the
Using DataQuest on a Handheld
 Using DataQuest on a Handheld Appendix B This appendix gives an overview of using the Vernier DataQuest application on a TI-Nspire handheld. It includes information on accessing the common tools in the
AEMLog Users Guide. Version 1.01
 AEMLog Users Guide Version 1.01 INTRODUCTION...2 DOCUMENTATION...2 INSTALLING AEMLOG...4 AEMLOG QUICK REFERENCE...5 THE MAIN GRAPH SCREEN...5 MENU COMMANDS...6 File Menu...6 Graph Menu...7 Analysis Menu...8
#61-844SW ThermalVision Software Instruction Manual
 ThermalVision Software Instruction Manual ND-7035-1 Page 1 of 23 Contents 1. Installing the ThermalVision software onto a PC... 3 2. Transferring saved images from the camera to the PC.... 3 2.1. Direct
BoxCar Pro 4.3 for Windows
 Page 1 of 6 BoxCar Pro 4.3 for Windows Onset offers two Windows applications for logger and data management. BoxCar Pro 4.3 is a powerful enhanced version of BoxCar that adds features for graphing, data
Navigator Software User s Manual. User Manual. Navigator Software. Monarch Instrument Rev 0.98 May Page 1 of 17
 User Manual Navigator Software Monarch Instrument Rev 0.98 May 2006 Page 1 of 17 Contents 1. NAVIGATOR SOFTWARE 2. INSTALLATION 3. USING NAVIGATOR SOFTWARE 3.1 STARTING THE PROGRAM 3.2 SYSTEM SET UP 3.3
Insight: Measurement Tool. User Guide
 OMERO Beta v2.2: Measurement Tool User Guide - 1 - October 2007 Insight: Measurement Tool User Guide Open Microscopy Environment: http://www.openmicroscopy.org OMERO Beta v2.2: Measurement Tool User Guide
Datalogger Graph Software Help
 Datalogger Graph Software Help Version 1.2, March 9, 2007 For additional information refer to the user guide included on the supplied program disk. CONTENTS Quick Start Guide Installing Graph Software
DataPro Quick Start Guide
 DataPro Quick Start Guide Introduction The DataPro application provides the user with the ability to download and analyze data acquired using the ULTRA-LITE PRO range of Auto Meter products. Please see
San Francisco State University
 San Francisco State University Michael Bar Instructions for Excel 1. Plotting analytical function. 2 Suppose that you need to plot the graph of a function f ( x) = x on the interval [ 5,5]. Step 1: make
TempLog & RH/TempLog User Guide. Sixth Edition First print Printed in July
 TempLog & RH/TempLog User Guide Sixth Edition First print Printed in July 2003 www.4oakton.com Contents Using the Guide... 15 Chapter 1 OaktonLog... 17 1.1. Overview... 18 1.2. Getting Started... 19 1.3.
Software for HOBO loggers
 Measurement, Control, and Datalogging Solutions Software for HOBO loggers HOBOware Software Pro and Lite versions HOBOware Pro is available for both for Windows and MAC and is Onset's most powerful software
Fitting NMR peaks for N,N DMA
 Fitting NMR peaks for N,N DMA Importing the FID file to your local system Any ftp program may be used to transfer the FID file from the NMR computer. The description below will take you through the process
AEMLog users guide V User Guide - Advanced Engine Management 2205 West 126 th st Hawthorne CA,
 AEMLog users guide V 1.00 User Guide - Advanced Engine Management 2205 West 126 th st Hawthorne CA, 90250 310-484-2322 INTRODUCTION...2 DOCUMENTATION...2 INSTALLING AEMLOG...4 TRANSFERRING DATA TO AND
Software Manual. MadgeTech 4 Data Logger Software
 Software Manual MadgeTech 4 Data Logger Software Introduction 7 About MadgeTech, Inc... 7 Software Overview 8 Getting Started... 8 System Requirements...8 Software Installation: Installing the MadgeTech
EL-USB-RT INSTALLATION AND OPERATION GUIDE. electronics
 EL-USB-RT INSTALLATION AND OPERATION GUIDE electronics SOFTWARE INSTALLATION Windows 2000/XP/Vista(32-bit) 1. Insert the EL-USB-RT Configuration Software CD into the CD drive of your computer. If the CD
DaqPRO Solution. User Guide INNOVATIVE MONITORING SOLUTIONS ALL IN ONE SOLUTION FOR DATA LOGGING AND ANALYSIS.
 INNOVATIVE MONITORING SOLUTIONS www.fourtec.com User Guide including DaqLab FACTORIES Monitoring product quality throughout the entire manufacturing cycle TESTING STANDARDS Ensuring quality control and
KeyTag Manager User Guide. Release /02/2017
 KeyTag Manager KeyTag Manager User Guide. Release 009 18/02/2017 KeyLog Recorders Copyright 2017 1 Table of Contents 1. Table of Contents 2. PRESENTATION & INSTALLATION:...4 2.1. INTRODUCTION TO KEYTAG
Track-It User s Guide. 1. Table of Contents. Track-It User Guide
 Track-It User s Guide Track-It is a PC based (Windows XP / Vista/ Windows 7) program to enable a user to program and view data from the Track-It series of micro data loggers. The program allows the loggers
Tach Facts V3.0 Software
 Tach Facts V3.0 Software Download runs from your Auto Meter Playback Tach with Tach-Facts Software. Instr. No. 2650-978 Tach Facts provides complete race analysis on your personal computer. Introduction
Introduction to Microsoft Excel
 Chapter A spreadsheet is a computer program that turns the computer into a very powerful calculator. Headings and comments can be entered along with detailed formulas. The spreadsheet screen is divided
GOSSEN METRAWATT. Safety through Competence. DranView. DranView Power Quality Software. Concise Function Overview. Power Quality
 GOSSEN METRAWATT Safety through Competence DranView DranView Power Quality Software Concise Function Overview 2 Power Quality 7 Overview Introduction 1 User Interface 1 Event Controls 2 Zoomen 2 Pan 2
EasySense Mac OSX Quick Start Guide
 EasySense Mac OSX Quick Start Guide Contents Compatibility... 1 To begin... 2 Recording data... 2 A New recording... 2 Displaying data... 4 Data Value boxes... 4 Show or Hide Channels... 4 Y-Axis display...
Dranetz s industry leading power analysis software provides professional reports and analysis to all users COMPATIBLE INSTRUMENTS
 DRAN-VIEW Dranetz s industry leading power analysis software provides professional reports and analysis to all users INTRODUCTION Dran-View is a Windows-based software package that enables power professionals
TriLink. User Guide. ISE, Inc. Second Edition October 2007 Fourier Systems
 ISE, Inc. 10100 Royalton Rd. Cleveland, OH 44133 Tel: (440) 237-3200 Fax: (440) 237-1744 http://iseinc.com TriLink User Guide Second Edition October 2007 Fourier Systems Contents Introduction...7 Chapter
Data Should Not be a Four Letter Word Microsoft Excel QUICK TOUR
 Toolbar Tour AutoSum + more functions Chart Wizard Currency, Percent, Comma Style Increase-Decrease Decimal Name Box Chart Wizard QUICK TOUR Name Box AutoSum Numeric Style Chart Wizard Formula Bar Active
addition + =5+C2 adds 5 to the value in cell C2 multiplication * =F6*0.12 multiplies the value in cell F6 by 0.12
 BIOL 001 Excel Quick Reference Guide (Office 2010) For your lab report and some of your assignments, you will need to use Excel to analyze your data and/or generate graphs. This guide highlights specific
Microsoft Excel 2007
 Microsoft Excel 2007 1 Excel is Microsoft s Spreadsheet program. Spreadsheets are often used as a method of displaying and manipulating groups of data in an effective manner. It was originally created
MDA V8.1 What s New Functionality Overview
 1 Basic Concepts of MDA V8.1 Version General Notes Ribbon Configuration File Explorer Export Measure Data Signal Explorer Instrument Box Instrument and Time Slider Oscilloscope Table Configuration Manager
User Guide DYMO Label TM v.8
 User Guide DYMO Label TM v.8 Copyright Trademarks 2012-2015 Sanford, L.P. All rights reserved. Revised 9/6/2016. No part of this document or the software may be reproduced or transmitted in any form or
Scientific Graphing in Excel 2013
 Scientific Graphing in Excel 2013 When you start Excel, you will see the screen below. Various parts of the display are labelled in red, with arrows, to define the terms used in the remainder of this overview.
Galaxie Report Editor
 Varian, Inc. 2700 Mitchell Drive Walnut Creek, CA 94598-1675/USA Galaxie Report Editor User s Guide Varian, Inc. 2008 Printed in U.S.A. 03-914949-00: Rev 6 Galaxie Report Editor i Table of Contents Introduction...
Fundamentals. Training Kit. Presentation Products, Inc. 632 W 28th St, 7th fl New York, NY f presentationproducts.
 Fundamentals Training Kit Presentation Products, Inc. 632 W 28th St, 7th fl New York, NY 10001 212.736.6350 f 212.736.6353 presentationproducts.com Table of Contents Getting Started How Does the SMART
Mini Mini GlobiLab Software Quick Start Guide
 Mini Mini GlobiLab Software Quick Start Guide This Guide is intended to help you get your Mini up and running quickly. For more detailed instructions, please see the Getting to Know Your Mini document
Using LoggerPro. Nothing is more terrible than to see ignorance in action. J. W. Goethe ( )
") Using LoggerPro Nothing is more terrible than to see ignorance in action. J. W. Goethe (1749-1832) LoggerPro is a general-purpose program for acquiring, graphing and analyzing data. It can accept input
Using LoggerPro Nothing is more terrible than to see ignorance in action. J. W. Goethe (1749-1832) LoggerPro is a general-purpose program for acquiring, graphing and analyzing data. It can accept input
Table of contents. Minimum required configuration...3 Software installation...3 Launching application...8 Software Un-installation...
 Table of contents I. Installation procedure...3 A B C D Minimum required configuration...3 Software installation...3 Launching application...8 Software Un-installation...8 II. General overview...9 A Instrument
DT Pro Quick Start Guide: MPIII Systems
 DT Pro Quick Start Guide: MPIII Systems Mesa Labs, Inc. www.mesalabs.com Rev. 01.10.2018 Table of Contents Introduction...pg 3 System Test...pg 4 Programming Loggers...pg 5 Reading Loggers...pg 8 Standard
zloggmanager User Guide Release /12/2018
 zlogg zloggmanager User Guide Release 011 02/12/2018 zlogg Copyright 2017 http://z-logg.com 1 Table of Contents 1. Table of Contents 2. PRESENTATION AND INSTALLATION:...4 2.1. INTRODUCTION TO ZLOGGMANAGER...4
MATERIALS PLUS Segmentation Measurement
 Example: Segmentation MATERIALS PLUS Segmentation is a method of image partitioning based on the intensity / gray scale range of its components. Since a phase is detected and its area is estimated on the
Technology Assignment: Scatter Plots
 The goal of this assignment is to create a scatter plot of a set of data. You could do this with any two columns of data, but for demonstration purposes we ll work with the data in the table below. You
Instruction Manual XLComm Data Acquisition Software For XL Series Meters
 Data Acquisition Software For XL Series Meters (XL 15, 20, 25, 30, 40, 50 and 60 meters) 68X090832 Rev. 0 JAN 07 Preface This manual serves to explain the use of the Acquisition Software. The manual functions
Scientific Graphing in Excel 2007
 Scientific Graphing in Excel 2007 When you start Excel, you will see the screen below. Various parts of the display are labelled in red, with arrows, to define the terms used in the remainder of this overview.
Non-Linear Least Squares Analysis with Excel
 Non-Linear Least Squares Analysis with Excel 1. Installation An add-in package for Excel, which performs certain specific non-linear least squares analyses, is available for use in Chem 452. The package,
TOF-Watch SX Monitor
 TOF-Watch SX Monitor User manual Version 1.2 Organon (Ireland) Ltd. Drynam Road Swords Co. Dublin Ireland Contents General information... 3 Getting started... 3 File Window... 7 File Menu... 10 File Open
MicroStrategy Desktop
 MicroStrategy Desktop Quick Start Guide MicroStrategy Desktop is designed to enable business professionals like you to explore data, simply and without needing direct support from IT. 1 Import data from
Quick Start Guide. Microsoft Visio 2013 looks different from previous versions, so we created this guide to help you minimize the learning curve.
 Quick Start Guide Microsoft Visio 2013 looks different from previous versions, so we created this guide to help you minimize the learning curve. Updated templates Templates help you start the drawing type
DwyerLog Logger Interface Software
 DwyerLog Logger Interface Software USER S GUIDE Version 1.4x March 21, 2013 Dwyer Instruments, Inc 102 Indiana Hwy 212 Michigan City, IN 46360 Phone: (219) 879-8868 Fax: (219) 872-9057 http://www.dwyer-inst.com
Press the Plus + key to zoom in. Press the Minus - key to zoom out. Scroll the mouse wheel away from you to zoom in; towards you to zoom out.
 Navigate Around the Map Interactive maps provide many choices for displaying information, searching for more details, and moving around the map. Most navigation uses the mouse, but at times you may also
MDA 8 preview SP3 What s New Functionality Overview
 1 Basic Concepts of MDA 8 preview SP3 Version General Notes Ribbon File Explorer Signal Explorer Configuration Instrument and Time Slider Oscilloscope Instrument Box Configuration Manager Layer Preview
Introducing Microsoft Office Specialist Excel Module 1. Adobe Captivate Wednesday, May 11, 2016
 Slide 1 - Introducing Microsoft Office Specialist Excel 2013 Introducing Microsoft Office Specialist Excel 2013 Module 1 Page 1 of 25 Slide 2 - Lesson Objectives Lesson Objectives Understand what Microsoft
Podium Data Analysis Software. User Manual. SWIS10 Version
 SWIS10 Version Issue 1.00 March 2003 Contents 1 Introduction 5 1.1 What is Podium? 5 1.2 About This Manual 5 1.3 Typographical Conventions 6 1.4 Getting Technical Support 6 2 Getting Started 7 2.1 System
9936A LogWare III. User s Guide. Revision
 9936A LogWare III User s Guide Revision 680301 Table of Contents 1 Introduction... 1 1.1 Symbols Used...1 1.2 Conventions...1 1.3 What is LogWare?...1 1.4 License Agreement...2 1.5 Requirements...2 1.6
9935 LogWare II Real-Time Data Acquisition Software User s Guide
 Hart Scientific 9935 LogWare II Real-Time Data Acquisition Software User s Guide info@ 9935 ugeng0000 051001 info@ Fluke Corporation, Hart Scientific Division (Hart) warrants this product to be free from
Starting Excel application
 MICROSOFT EXCEL 1 2 Microsoft Excel: is a special office program used to apply mathematical operations according to reading a cell automatically, just click on it. It is called electronic tables Starting
testo Comfort Software Professional 4 Instruction manual
 testo Comfort Software Professional 4 Instruction manual 2 1 Contents 1 Contents 1 Contents... 3 2 About this document... 5 3 Specifications... 6 3.1. Use... 6 3.2. System requirements... 6 4 First steps...
Chemistry 30 Tips for Creating Graphs using Microsoft Excel
 Chemistry 30 Tips for Creating Graphs using Microsoft Excel Graphing is an important skill to learn in the science classroom. Students should be encouraged to use spreadsheet programs to create graphs.
Creating Fill-able Forms using Acrobat 7.0: Part 1
 Creating Fill-able Forms using Acrobat 7.0: Part 1 The first step in creating a fill-able form in Adobe Acrobat is to generate the form with all its formatting in a program such as Microsoft Word. Then
WEEK NO. 12 MICROSOFT EXCEL 2007
 WEEK NO. 12 MICROSOFT EXCEL 2007 LESSONS OVERVIEW: GOODBYE CALCULATORS, HELLO SPREADSHEET! 1. The Excel Environment 2. Starting A Workbook 3. Modifying Columns, Rows, & Cells 4. Working with Worksheets
SMART Board Interactive Whiteboard Basics
 SMART Board Interactive Whiteboard Basics This Quick Reference Guide provides an overview of the information you need to begin using a SMART Board interactive whiteboard. Before you begin, make sure the
Decision Support Risk handout. Simulating Spreadsheet models
 Decision Support Models @ Risk handout Simulating Spreadsheet models using @RISK 1. Step 1 1.1. Open Excel and @RISK enabling any macros if prompted 1.2. There are four on line help options available.
Acrobat 6.0 Standard - Basic Tasks
 Converting Office Documents to PDF 1. Create and edit document in Office application (Word, Excel, PowerPoint) 2. Click the Convert to PDF button on the Acrobat toolbar If the buttons are not visible,
Appendix C. Vernier Tutorial
 C-1. Vernier Tutorial Introduction: In this lab course, you will collect, analyze and interpret data. The purpose of this tutorial is to teach you how to use the Vernier System to collect and transfer
Visual analysis of inversion tower temperature data
 San Luis Obispo County Cooperative Extension 2156 Sierra Way, Suite C San Luis Obispo, CA 93401 (805) 781-5940 office (805) 781-4316 fax http://cesanluisobispo.ucanr.edu Visual analysis of inversion tower
MS Excel Henrico County Public Library. I. Tour of the Excel Window
 MS Excel 2013 I. Tour of the Excel Window Start Excel by double-clicking on the Excel icon on the desktop. Excel may also be opened by clicking on the Start button>all Programs>Microsoft Office>Excel.
Excel window. This will open the Tools menu. Select. from this list, Figure 3. This will launch a window that
 Getting Started with the Superpave Calculator worksheet. The worksheet containing the Superpave macros must be copied onto the computer. The user can place the worksheet in any desired directory or folder.
9936A LogWare III. User s Guide. Revision
 9936A LogWare III User s Guide Revision 850701 Table of Contents 1 Introduction...1 1.1 Symbols Used... 1 1.2 Conventions... 1 1.3 What is LogWare?... 1 1.4 License Agreement... 2 1.5 Requirements...
SystemVue 2011 Fundamentals (version ) LAB EXERCISE 1. SystemVue Basics
 LAB EXERCISE 1. SystemVue Basics") SystemVue 2011 Fundamentals (version 1-2012) LAB EXERCISE 1 SystemVue Basics This lab exercise introduces the basic use model of SystemVue, including using the built-in templates, running analyses and
SystemVue 2011 Fundamentals (version 1-2012) LAB EXERCISE 1 SystemVue Basics This lab exercise introduces the basic use model of SystemVue, including using the built-in templates, running analyses and
motcom loganalyser User Manual
 User Manual Part No. 2 900 04 10000 Release 07.03.2016 English revision 160825 Kurt-Schumacher-Str. 28-30 66130 Saarbrücken, Germany e-mail: info@motcomgmbh.com web: www.motcomgmbh.com Contents Introduction...
Statistics with a Hemacytometer
 Statistics with a Hemacytometer Overview This exercise incorporates several different statistical analyses. Data gathered from cell counts with a hemacytometer is used to explore frequency distributions
Office of Instructional Technology
 Office of Instructional Technology Microsoft Excel 2016 Contact Information: 718-254-8565 ITEC@citytech.cuny.edu Contents Introduction to Excel 2016... 3 Opening Excel 2016... 3 Office 2016 Ribbon... 3
DOC Flo-Ware 4 Software. User Manual. July 2010, Edition 1. Hach Company, All rights reserved. Printed in the U.S.A.
 DOC026.53.80112 Flo-Ware 4 Software User Manual July 2010, Edition 1 Hach Company, 2010. All rights reserved. Printed in the U.S.A. Table of Contents Section 1 General information...3 1.1 Product overview...3
Microsoft Excel 2007 Lesson 7: Charts and Comments
 Microsoft Excel 2007 Lesson 7: Charts and Comments Open Example.xlsx if it is not already open. Click on the Example 3 tab to see the worksheet for this lesson. This is essentially the same worksheet that
9934 LogWare User s Guide
 Hart Scientific 9934 LogWare User s Guide Rev. 592201 Fluke Corporation, Hart Scientific Division (Hart) warrants this product to be free from defects in material and workmanship under normal use and service
The Figure module. Use Figure to manipulate, edit and plot figure and phase diagrams already calculated by FactSage.
 Table of contents Section 1 Section 2 Section 3 Section 4 Section 5 Section 6 Section 7 Section 8 Section 9 Section 10 Section 11 Section 12 Section 13 Section 14 The module Use to manipulate, edit and
INSTRUCTIONS FOR USING MICROSOFT EXCEL PERFORMING DESCRIPTIVE AND INFERENTIAL STATISTICS AND GRAPHING
 APPENDIX INSTRUCTIONS FOR USING MICROSOFT EXCEL PERFORMING DESCRIPTIVE AND INFERENTIAL STATISTICS AND GRAPHING (Developed by Dr. Dale Vogelien, Kennesaw State University) ** For a good review of basic
Engineering Data Management (EDM) Software
 Software") Engineering Data Management (EDM) Software Engineering Data Management (EDM) is an integrated suite of software tools from Crystal Instruments for data management and post processing. It features a single
Engineering Data Management (EDM) Software Engineering Data Management (EDM) is an integrated suite of software tools from Crystal Instruments for data management and post processing. It features a single
ForceWare Graphics Driver nview 3.5 Desktop Manager User s Guide. Driver Version for Windows
 ForceWare Graphics Driver nview 3.5 Desktop Manager User s Guide Driver Version 56.64 for Windows NVIDIA Corporation March 2004 NVIDIA ForceWare Graphics Driver User s Guide Published by NVIDIA Corporation
3/31/2016. Spreadsheets. Spreadsheets. Spreadsheets and Data Management. Unit 3. Can be used to automatically
 MICROSOFT EXCEL and Data Management Unit 3 Thursday March 31, 2016 Allow users to perform simple and complex sorting Allow users to perform calculations quickly Organizes and presents figures that can
Wave User Guide XF e Analyzer
 Wave User Guide XF e Analyzer October 2014 1 CONTENTS Chapter 1: Designing an XF e Assay Overview of the Process: Design, Run, and Analyze... 6 Step 1: Design XF e assay using Wave Desktop... 6 Step 2:
Podium Plus Data Analysis Software. User Manual. SWIS10 Version
 SWIS10 Version Issue 1.10 February 2005 Contents 1 Introduction 6 1.1 What is Podium Plus? 6 1.2 About This Manual 6 1.3 Typographical Conventions 7 1.4 Getting Technical Support 7 2 Getting Started 8
Welcome to noiselab Express 1.0
 Welcome to noiselab Express 1.0 Basic Operation Download and install the program. The program automatically unzips and installs. If you don t have a license code, you can run the program in demo mode for
RIVA / Athena Pro-Series ECU
 RIVA / Athena Pro-Series ECU USING SOFTWARE (MAYA) Running Maya for First Time Once installed, Maya is available in the Start menu under Programs -> Maya, or from a desktop short cut, if created. The first
CCRS Quick Start Guide for Program Administrators. September Bank Handlowy w Warszawie S.A.
 CCRS Quick Start Guide for Program Administrators September 2017 www.citihandlowy.pl Bank Handlowy w Warszawie S.A. CitiManager Quick Start Guide for Program Administrators Table of Contents Table of Contents
A cell is highlighted when a thick black border appears around it. Use TAB to move to the next cell to the LEFT. Use SHIFT-TAB to move to the RIGHT.
 Instructional Center for Educational Technologies EXCEL 2010 BASICS Things to Know Before You Start The cursor in Excel looks like a plus sign. When you click in a cell, the column and row headings will
Software.
 Software ebro offers exactly the software you need: Evaluation software for any applications: basic, light and pro Evaluation software for EBI 25 data loggers: web and wave Evaluation software for pharmaceutical
HOW TO DOWNLOAD BLOOMBERG DATA INTO EXCEL
 STEP-BY-STEP: HOW TO DOWNLOAD BLOOMBERG DATA INTO EXCEL Use this document to successfully download or copy data from the Bloomberg terminal into Excel. Scenarios to 4 detail the most common ways to transfer
EXCEL 2007 TIP SHEET. Dialog Box Launcher these allow you to access additional features associated with a specific Group of buttons within a Ribbon.
 EXCEL 2007 TIP SHEET GLOSSARY AutoSum a function in Excel that adds the contents of a specified range of Cells; the AutoSum button appears on the Home ribbon as a. Dialog Box Launcher these allow you to
HOW TO USE THE EXPORT FEATURE IN LCL
 HOW TO USE THE EXPORT FEATURE IN LCL In LCL go to the Go To menu and select Export. Select the items that you would like to have exported to the file. To select them you will click the item in the left
Logger Pro 3 Release Notes
 Logger Pro 3 Release Notes Version 3.3 May 6, 2004 Contents: Install Notes What s changed in Logger Pro 3.3 Logger Pro 3.3 Known Issues What s changed in Logger Pro 3.2.1 What s changed in Logger Pro 3.2
P6 Professional Reporting Guide Version 18
 P6 Professional Reporting Guide Version 18 August 2018 Contents About the P6 Professional Reporting Guide... 7 Producing Reports and Graphics... 9 Report Basics... 9 Reporting features... 9 Report Wizard...
Drawing. Chapter 11. Bridge. A. Insert Views. Step 1. Click File Menu > New, click Drawing and OK. on the View Layout toolbar.
 Chapter 11 Bridge Drawing A. Insert Views. Step 1. Click File Menu > New, click Drawing and OK. Step 2. Click Model View on the View Layout toolbar. Step 3. Click Browse in the Property Manager. Step 4.
To create a notebook on desktop version 1. Open One Note 2. File > New. o FILE. Options
 OneNote Training When you open OneNote for the first time there will be notebooks already started and you can see them on the left hand side. There is an introduction section that you can go through, if
VANGUARD LOAD TAP CHANGER ANALYZER (LTCA) VERSION 2.xx SOFTWARE MANUAL. LTCA-10, LTCA-40, WRM-10P, WRM-40, TRM-20, TRM-40, TRM-203, and TRM-403
 VERSION 2.xx SOFTWARE MANUAL. LTCA-10, LTCA-40, WRM-10P, WRM-40, TRM-20, TRM-40, TRM-203, and TRM-403") VANGUARD LOAD TAP CHANGER ANALYZER (LTCA) VERSION 2.xx SOFTWARE MANUAL For Use with Vanguard s LTCA-10, LTCA-40, WRM-10P, WRM-40, TRM-20, TRM-40, TRM-203, and TRM-403 Load Tap Changer Analyzers and Winding
VANGUARD LOAD TAP CHANGER ANALYZER (LTCA) VERSION 2.xx SOFTWARE MANUAL For Use with Vanguard s LTCA-10, LTCA-40, WRM-10P, WRM-40, TRM-20, TRM-40, TRM-203, and TRM-403 Load Tap Changer Analyzers and Winding