Using R for statistics and data analysis
|
|
|
- Darleen Montgomery
- 6 years ago
- Views:
Transcription


1 Introduction ti to R: Using R for statistics and data analysis BaRC Hot Topics October 2011 George Bell, Ph.D.
2 Why use R? To perform inferential statistics (e.g., use a statistical test to calculate a p-value) To do real statistics (unlike in Excel) To create custom figures To automate t analysis routines (and make them more reproducible) To reduce copying and pasting But Unix commands may be easier ask us To use up-to-date analysis algorithms Real statisticians use it It s free 2
3 Why not use R? A spreadsheet application already works fine You re already using another statistics package Ex: Prism, MatLab It s hard to use at first You have to know what commands to use Real statisticians use it You don t know how to get started Irrelevant if you re here today 3
4 Getting started Log into tak ssh l USERNAME tak Start R R Go to R ( t /) Download base from CRAN and install it on your computer Open the program or 4


5 Start of an R session On tak On your own computer 5
6 RStudio interface Requires R; free download from 6


7 Getting help Use the Help menu Check out Manuals org/ contributed documentation Use R s help?median [show info]??median [search docs] Search the web r-project median Our favorite book: Introductory Statistics with R (Peter Dalgard) Html help 7
8 Handling data Data can be numerical or text Data can be organized into Vectors (lists of values) Matrices (2-dimensional tables of data) Data frames (a combination of different types of data) Data can be entered By typing (using the c command to combine things) From files Names of data should start with letters Uppercase + lowercase helps (mywtmice) Can include dots (my.wt.mice) 8
9 Good practices Save all useful commands and rationale Add comments (starting with # ) Use history() to get previous commands Two approaches Write commands in R and then paste into a text file, or By convention, we end files of R commands with.r Use a specific name for file (ex: compare_wt_ko_weights.r) Write commands in a text editor and paste into R session. Use the up-arrow to get to previous command Minimize i i typing, as this increases potential ti errors. To clear your R window, use Ctrl-L 9
10 Example commands # Number of tumors (from litter 2 on 11 July 2010) wt = c(5, 6, 7) ko = c(8, 9, 11) # Try default t-test settings (Welch's 2-sample t-test) t.test(wt, ko) # Do standard 2-sample t-test t.test(wt, ko, var.equal=t) # Save the results as a variable wt.vs.ko = t.test(wt, ko, var.equal=t) # What are the different parts of this data frame? names(wt.vs.ko) # Just print the p-value wt.vs.ko$p.value # What commands did we use? history(max.show=inf) 10


 and see")
 [1]")
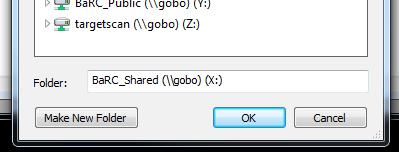
11 Reading files - intro Take R to your preferred directory () Check where you are (e.g., get your working directory) and see what files are there > getwd() [1] "X:/bell/Hot_Topics/Intro_to_R > dir() [1] "compare_wt_ko_weights.r" 11
12 Running a series of commands Copy and paste commands into R session, or Execute a script in R, or source("compare_wt_ko_weights.r") [but not so useful in this case, since we aren t creating any files] [tak only] Change to working directory with Unix command cd /nfs/barc/hot_topics/intro_to_r to R Run R, with script as input (print to screen), or R --vanilla < compare _ WT_ KO_ weights.r Run R, with script as input (save output) R --vanilla < compare_wt_ko_weights.r > R_out.txt 12
13 Command output Partial output from R on tak, if saved as a file (R_out.txt from previous slide), also looks something like this (but without the colors). 13


14 Reading data files Usually it s easiest to read data from a file Organize in Excel with one-word column names Save as tab-delimited text Check that file is there list.files() Read file tumors = read.delim("tumors_wt_ko.txt", header=t) Check that it s OK > tumors wt ko
15 Accessing data > tumors$wt # Use the column name > tumors wt ko [1] > tumors[1:3,1] # [rows, columns] [1] > tumors[,1] # missing row or column => all [1] > tumors[1:2,1:2] # select a submatrix wt ko > t.test(tumors$wt, tumors$ko) # t-test as before 15
 colnames(pvals.out) = c( two.tail\", one.tail\") rownames(pvals.out) = c(\"welch\", \"Wilcoxon\") pvals.out two.tail one.")
16 Creating an output table Most analyses involve several outputs You may want to create a matrix to hold it all Create an empty matrix name rows and columns pvals.out = matrix(data=na, ncol=2, nrow=2) colnames(pvals.out) = c( two.tail", one.tail") rownames(pvals.out) = c("welch", "Wilcoxon") pvals.out two.tail one.tail Welch NA NA Wilcoxon NA NA 16
17 Filling the output table (matrix) Do the stats # Welch s test (t-test with pooled variance) pvals.out[1,1] 1] = t.test(tumors$wt, t t(t t tumors$ko)$p.value pvals.out[1,2] = t.test(tumors$wt, tumors$ko, alt="less")$p.value # Wilcoxon rank sum test (non-parametric alternative to t-test) pvals.out[2,1] = wilcox.test(tumors$wt, tumors$ko)$p.value pvals.out[2,2] = wilcox.test(tumors$wt, tumors$ko, alt="less")$p.value pvals.out two.tail one.tail Welch Wilcoxon
 Print the matrix (table) write.")
 Warning: output column names are")
18 Printing the output table We may want to round the p-values pvals.out.rounded = round(pvals.out, 4) Print the matrix (table) write.table(pvals.out.rounded, file="tumor_pvals.txt", t" quote=f, sep="\t") Warning: output column names are shifted by 1 when read in Excel 18
19 Introduction to figures R is very powerful and very flexible with its figure generation Any aspect of a figure should be modifiable Some figures aren t available in spreadsheets Boxplot example boxplot(tumors) # Simplest case # Add some more details boxplot(tumors, col=c("gray", "red"), main="mfg appears to be a tumor suppressor", ylab="number of tumors") 19


20 Boxplot description Any points beyond the whiskers are defined as outliers IQR <= 1.5 x IQR 75 th percentile median 25 th percentile Right-click to save figure 20
21 Figure formats and sizes By default, figures on tak are saved as Rplots.pdf Helpful figure names can be included in code To select name and size (in inches) of pdf file pdf( tumor_boxplot.pdf, t df w=11, h=8.5) boxplot(tumors) # can have >1 page dev.off() # tell R that we re done To create another format (with size in pixels) png( tumor_boxplot.png, t w=1800, h=1200) boxplot(tumors) dev.off() 21
22 Bioconductor and other packages Many statisticians ti ti i have extended d R by creating packages (libraries) containing a set of commands to do something special Ex: affy, limma, edger, made4 For a huge list of Bioconductor packages, see All require the package to be installed AND explicitly called, for example, library(limma) Install what you need on your computer or, for tak, ask the IT group to install packages via 22
23 Other useful commands library() mean() round(x, n) dir() median() min() length() sd() max() dim() rbind() paste() nrow() cbind() x[x>0] ncol() sort() x[c(1,3,5)] unique() rev() seq(from, to, by) t() log(x, base) commandargs() 23
24 More resources from BaRC Statistics for Biologists course: Microarray Analysis course R scripts for Bioinformatics List of R modules installed on tak We re glad to share commands and/or scripts to get you started 24
25 Upcoming Hot Topics Introduction to R Graphics (tomorrow) Introduction to Bioconductor - microarray and RNA-Seq analysis (Thursday) Unix, Perl, and Perl modules (short course) Quality control for high-throughput data RNA-Seq analysis Gene list enrichment analysis Galaxy Sequence alignment: pairwise and multiple See Other ideas? Let us know. 25
Why use R? Getting started. Why not use R? Introduction to R: Log into tak. Start R R or. It s hard to use at first
 Why use R? Introduction to R: Using R for statistics ti ti and data analysis BaRC Hot Topics October 2011 George Bell, Ph.D. http://iona.wi.mit.edu/bio/education/r2011/ To perform inferential statistics
Why use R? Getting started. Why not use R? Introduction to R: It s hard to use at first. To perform inferential statistics (e.g., use a statistical
 Why use R? Introduction to R: Using R for statistics ti ti and data analysis BaRC Hot Topics November 2013 George W. Bell, Ph.D. http://jura.wi.mit.edu/bio/education/hot_topics/ To perform inferential
Introduction to R: Using R for statistics and data analysis
 Why use R? Introduction to R: Using R for statistics and data analysis George W Bell, Ph.D. BaRC Hot Topics November 2014 Bioinformatics and Research Computing Whitehead Institute http://barc.wi.mit.edu/hot_topics/
Introduction to R: Using R for statistics and data analysis
 Why use R? Introduction to R: Using R for statistics and data analysis George W Bell, Ph.D. BaRC Hot Topics November 2015 Bioinformatics and Research Computing Whitehead Institute http://barc.wi.mit.edu/hot_topics/
Introduction to R: Using R for Statistics and Data Analysis. BaRC Hot Topics
 Introduction to R: Using R for Statistics and Data Analysis BaRC Hot Topics http://barc.wi.mit.edu/hot_topics/ Why use R? Perform inferential statistics (e.g., use a statistical test to calculate a p-value)
Introduction to R: Using R for Statistics and Data Analysis. BaRC Hot Topics
 Introduction to R: Using R for Statistics and Data Analysis BaRC Hot Topics http://barc.wi.mit.edu/hot_topics/ Why use R? Perform inferential statistics (e.g., use a statistical test to calculate a p-value)
Introduction to R (BaRC Hot Topics)
") Introduction to R (BaRC Hot Topics) George Bell September 30, 2011 This document accompanies the slides from BaRC s Introduction to R and shows the use of some simple commands. See the accompanying slides
Introduction to R (BaRC Hot Topics) George Bell September 30, 2011 This document accompanies the slides from BaRC s Introduction to R and shows the use of some simple commands. See the accompanying slides
Mails : ; Document version: 14/09/12
 Mails : leslie.regad@univ-paris-diderot.fr ; gaelle.lelandais@univ-paris-diderot.fr Document version: 14/09/12 A freely available language and environment Statistical computing Graphics Supplementary
Topics for today Input / Output Using data frames Mathematics with vectors and matrices Summary statistics Basic graphics
 Topics for today Input / Output Using data frames Mathematics with vectors and matrices Summary statistics Basic graphics Introduction to S-Plus 1 Input: Data files For rectangular data files (n rows,
Lab 1: Getting started with R and RStudio Questions? or
 Lab 1: Getting started with R and RStudio Questions? david.montwe@ualberta.ca or isaacren@ualberta.ca 1. Installing R and RStudio To install R, go to https://cran.r-project.org/ and click on the Download
file:///users/williams03/a/workshops/2015.march/final/intro_to_r.html
 Intro to R R is a functional programming language, which means that most of what one does is apply functions to objects. We will begin with a brief introduction to R objects and how functions work, and
An Introduction to R- Programming
 An Introduction to R- Programming Hadeel Alkofide, Msc, PhD NOT a biostatistician or R expert just simply an R user Some slides were adapted from lectures by Angie Mae Rodday MSc, PhD at Tufts University
POL 345: Quantitative Analysis and Politics
 POL 345: Quantitative Analysis and Politics Precept Handout 1 Week 2 (Verzani Chapter 1: Sections 1.2.4 1.4.31) Remember to complete the entire handout and submit the precept questions to the Blackboard
RNA-Seq. Joshua Ainsley, PhD Postdoctoral Researcher Lab of Leon Reijmers Neuroscience Department Tufts University
 RNA-Seq Joshua Ainsley, PhD Postdoctoral Researcher Lab of Leon Reijmers Neuroscience Department Tufts University joshua.ainsley@tufts.edu Day four Quantifying expression Intro to R Differential expression
GS Analysis of Microarray Data
 GS01 0163 Analysis of Microarray Data Keith Baggerly and Kevin Coombes Section of Bioinformatics Department of Biostatistics and Applied Mathematics UT M. D. Anderson Cancer Center kabagg@mdanderson.org
Introduction to R statistical environment
 Introduction to R statistical environment R Nano Course Series Aishwarya Gogate Computational Biologist I Green Center for Reproductive Biology Sciences History of R R is a free software environment for
a suite of operators for calculations on arrays, in particular
 The R Environment (Adapted from the Venables and Smith R Manual on www.r-project.org and from Andreas Buja s web site for Applied Statistics at http://www-stat.wharton.upenn.edu/ buja/stat-541/notes-stat-541.r)
Introduction to R. UCLA Statistical Consulting Center R Bootcamp. Irina Kukuyeva September 20, 2010
 UCLA Statistical Consulting Center R Bootcamp Irina Kukuyeva ikukuyeva@stat.ucla.edu September 20, 2010 Outline 1 Introduction 2 Preliminaries 3 Working with Vectors and Matrices 4 Data Sets in R 5 Overview
Introduction to Statistics using R/Rstudio
 Introduction to Statistics using R/Rstudio R and Rstudio Getting Started Assume that R for Windows and Macs already installed on your laptop. (Instructions for installations sent) R on Windows R on MACs
Automated Bioinformatics Analysis System on Chip ABASOC. version 1.1
 Automated Bioinformatics Analysis System on Chip ABASOC version 1.1 Phillip Winston Miller, Priyam Patel, Daniel L. Johnson, PhD. University of Tennessee Health Science Center Office of Research Molecular
A brief introduction to R
 A brief introduction to R Cavan Reilly September 29, 2017 Table of contents Background R objects Operations on objects Factors Input and Output Figures Missing Data Random Numbers Control structures Background
Chapter 3 Understanding and Comparing Distributions
 Chapter 3 Understanding and Comparing Distributions In this chapter, we will meet a new statistics plot based on numerical summaries, a plot to track the changes in a data set through time, and ways to
Exploring cdna Data. Achim Tresch, Andreas Buness, Wolfgang Huber, Tim Beißbarth
 Exploring cdna Data Achim Tresch, Andreas Buness, Wolfgang Huber, Tim Beißbarth Practical DNA Microarray Analysis http://compdiag.molgen.mpg.de/ngfn/pma0nov.shtml The following exercise will guide you
An introduction to R WS 2013/2014
 An introduction to R WS 2013/2014 Dr. Noémie Becker (AG Metzler) Dr. Sonja Grath (AG Parsch) Special thanks to: Dr. Martin Hutzenthaler (previously AG Metzler, now University of Frankfurt) course development,
Lecture 1: Getting Started and Data Basics
 Lecture 1: Getting Started and Data Basics The first lecture is intended to provide you the basics for running R. Outline: 1. An Introductory R Session 2. R as a Calculator 3. Import, export and manipulate
Instruction: Download and Install R and RStudio
 1 Instruction: Download and Install R and RStudio We will use a free statistical package R, and a free version of RStudio. Please refer to the following two steps to download both R and RStudio on your
Creating a data file and entering data
 4 Creating a data file and entering data There are a number of stages in the process of setting up a data file and analysing the data. The flow chart shown on the next page outlines the main steps that
Exploring cdna Data. Achim Tresch, Andreas Buness, Tim Beißbarth, Wolfgang Huber
 Exploring cdna Data Achim Tresch, Andreas Buness, Tim Beißbarth, Wolfgang Huber Practical DNA Microarray Analysis http://compdiag.molgen.mpg.de/ngfn/pma0nov.shtml The following exercise will guide you
Description/History Objects/Language Description Commonly Used Basic Functions. More Specific Functionality Further Resources
 R Outline Description/History Objects/Language Description Commonly Used Basic Functions Basic Stats and distributions I/O Plotting Programming More Specific Functionality Further Resources www.r-project.org
R version has been released on (Linux source code versions)
") Installation of R and Bioconductor R is a free software environment for statistical computing and graphics. It is based on the statistical computer language S. It is famous for its wide set of statistical
Installation of R and Bioconductor R is a free software environment for statistical computing and graphics. It is based on the statistical computer language S. It is famous for its wide set of statistical
Lecture 3: Basics of R Programming
 Lecture 3: Basics of R Programming This lecture introduces you to how to do more things with R beyond simple commands. Outline: 1. R as a programming language 2. Grouping, loops and conditional execution
Introduction to R Benedikt Brors Dept. Intelligent Bioinformatics Systems German Cancer Research Center
 Introduction to R Benedikt Brors Dept. Intelligent Bioinformatics Systems German Cancer Research Center What is R? R is a statistical computing environment with graphics capabilites It is fully scriptable
Lecture 3: Basics of R Programming
 Lecture 3: Basics of R Programming This lecture introduces how to do things with R beyond simple commands. We will explore programming in R. What is programming? It is the act of instructing a computer
Canadian Bioinforma,cs Workshops.
 Canadian Bioinforma,cs Workshops www.bioinforma,cs.ca Module #: Title of Module 2 Modified from Richard De Borja, Cindy Yao and Florence Cavalli R Review Objectives To review the basic commands in R To
GS Analysis of Microarray Data
 GS01 0163 Analysis of Microarray Data Keith Baggerly and Bradley Broom Department of Bioinformatics and Computational Biology UT M. D. Anderson Cancer Center kabagg@mdanderson.org bmbroom@mdanderson.org
Computer lab 2 Course: Introduction to R for Biologists
 Computer lab 2 Course: Introduction to R for Biologists April 23, 2012 1 Scripting As you have seen, you often want to run a sequence of commands several times, perhaps with small changes. An efficient
A whirlwind introduction to using R for your research
 A whirlwind introduction to using R for your research Jeremy Chacón 1 Outline 1. Why use R? 2. The R-Studio work environment 3. The mock experimental analysis: 1. Writing and running code 2. Getting data
Exploring cdna Data. Achim Tresch, Andreas Buness, Tim Beißbarth, Wolfgang Huber
 Exploring cdna Data Achim Tresch, Andreas Buness, Tim Beißbarth, Wolfgang Huber Practical DNA Microarray Analysis, Heidelberg, March 2005 http://compdiag.molgen.mpg.de/ngfn/pma2005mar.shtml The following
A brief introduction to R
 A brief introduction to R Ionuţ Florescu Dept. of Mathematical Sciences Stevens Institute of Technology May 15, 2009 1 What is R? Where to obtain it? R is a software package, one of the most versatile
R package
 R package www.r-project.org Download choose the R version for your OS install R for the first time Download R 3 run R MAGDA MIELCZAREK 2 help help( nameofthefunction )? nameofthefunction args(nameofthefunction)
Demo yeast mutant analysis
 Demo yeast mutant analysis Jean-Yves Sgro February 20, 2018 Contents 1 Analysis of yeast growth data 1 1.1 Set working directory........................................ 1 1.2 List all files in directory.......................................
EPIB Four Lecture Overview of R
 EPIB-613 - Four Lecture Overview of R R is a package with enormous capacity for complex statistical analysis. We will see only a small proportion of what it can do. The R component of EPIB-613 is divided
Survey of Math: Excel Spreadsheet Guide (for Excel 2016) Page 1 of 9
 Page 1 of 9") Survey of Math: Excel Spreadsheet Guide (for Excel 2016) Page 1 of 9 Contents 1 Introduction to Using Excel Spreadsheets 2 1.1 A Serious Note About Data Security.................................... 2 1.2
Survey of Math: Excel Spreadsheet Guide (for Excel 2016) Page 1 of 9 Contents 1 Introduction to Using Excel Spreadsheets 2 1.1 A Serious Note About Data Security.................................... 2 1.2
SISG/SISMID Module 3
 SISG/SISMID Module 3 Introduction to R Ken Rice Tim Thornton University of Washington Seattle, July 2018 Introduction: Course Aims This is a first course in R. We aim to cover; Reading in, summarizing
An Introduction to the R Commander
 An Introduction to the R Commander BIO/MAT 460, Spring 2011 Christopher J. Mecklin Department of Mathematics & Statistics Biomathematics Research Group Murray State University Murray, KY 42071 christopher.mecklin@murraystate.edu
Introduction into R. A Short Overview. Thomas Girke. December 8, Introduction into R Slide 1/21
 Introduction into R A Short Overview Thomas Girke December 8, 212 Introduction into R Slide 1/21 Introduction Look and Feel of the R Environment R Library Depositories Installation Getting Around Basic
Ch 1 : Descriptive Statistics
 Summer 2017 UAkron Dept. of Stats [3470 : 461/561] Applied Statistics Ch 1 : Descriptive Statistics Contents 1 Preliminaries 2 1.1 Course Web Page................................................................
Regression III: Advanced Methods
 Lecture 2: Software Introduction Regression III: Advanced Methods William G. Jacoby Department of Political Science Michigan State University jacoby@msu.edu Getting Started with R What is R? A tiny R session
Bioinformatics Workshop - NM-AIST
 Bioinformatics Workshop - NM-AIST Day 2 Introduction to R Thomas Girke July 24, 212 Bioinformatics Workshop - NM-AIST Slide 1/21 Introduction Look and Feel of the R Environment R Library Depositories Installation
Introduction to Cancer Genomics
 Introduction to Cancer Genomics Gene expression data analysis part I David Gfeller Computational Cancer Biology Ludwig Center for Cancer research david.gfeller@unil.ch 1 Overview 1. Basic understanding
An Introduction to R. Subhajit Dutta Stat-Math Unit. Indian Statistical Institute, Kolkata October 17, 2012
 An Introduction to R Subhajit Dutta Stat-Math Unit Indian Statistical Institute, Kolkata October 17, 2012 Why R? It is FREE!! Basic as well as specialized data analysis technique at your fingertips. Highly
Exercise 1-Solutions TMA4255 Applied Statistics
 Exercise 1-Solutions TMA4255 Applied Statistics January 16, 2017 Intro 0.1 Start MINITAB Start MINITAB on your laptop, or remote desktop to cauchy.math.ntnu.no and log in with win-ntnu-no\yourusername
Statistics 528: Minitab Handout 1
 Statistics 528: Minitab Handout 1 Throughout the STAT 528-530 sequence, you will be asked to perform numerous statistical calculations with the aid of the Minitab software package. This handout will get
Exploring extreme weather with Excel - The basics
 Exploring extreme weather with Excel - The basics These activities will help to develop your data skills using Excel and explore extreme weather in the UK. This activity introduces the basics of using
Part I. An Introduction to R
 Part I An Introduction to R 1 Chapter 1 Getting Started R is a programming language and comprehensive statistical platform for data exploration and analysis. It is free and open source, which means anyone
Basic R programming. Ana Teresa Maia DCBM / CBME
 Basic R programming Ana Teresa Maia DCBM / CBME Today Sources! Introduction Documentation and help Packages R Studio Basics and Syntax Data Types vectors; lists; data.frames; matrices R Programming Basic
Unit I Supplement OpenIntro Statistics 3rd ed., Ch. 1
 Unit I Supplement OpenIntro Statistics 3rd ed., Ch. 1 KEY SKILLS: Organize a data set into a frequency distribution. Construct a histogram to summarize a data set. Compute the percentile for a particular
STA Module 2B Organizing Data and Comparing Distributions (Part II)
") STA 2023 Module 2B Organizing Data and Comparing Distributions (Part II) Learning Objectives Upon completing this module, you should be able to 1 Explain the purpose of a measure of center 2 Obtain and
STA 2023 Module 2B Organizing Data and Comparing Distributions (Part II) Learning Objectives Upon completing this module, you should be able to 1 Explain the purpose of a measure of center 2 Obtain and
STA Learning Objectives. Learning Objectives (cont.) Module 2B Organizing Data and Comparing Distributions (Part II)
 Module 2B Organizing Data and Comparing Distributions (Part II)") STA 2023 Module 2B Organizing Data and Comparing Distributions (Part II) Learning Objectives Upon completing this module, you should be able to 1 Explain the purpose of a measure of center 2 Obtain and
STA 2023 Module 2B Organizing Data and Comparing Distributions (Part II) Learning Objectives Upon completing this module, you should be able to 1 Explain the purpose of a measure of center 2 Obtain and
MATLAB Introduction To Engineering for ECE Topics Covered: 1. Creating Script Files (.m files) 2. Using the Real Time Debugger
 2. Using the Real Time Debugger") 25.108 Introduction To Engineering for ECE Topics Covered: 1. Creating Script Files (.m files) 2. Using the Real Time Debugger SCRIPT FILE 77-78 A script file is a sequence of MATLAB commands, called a
25.108 Introduction To Engineering for ECE Topics Covered: 1. Creating Script Files (.m files) 2. Using the Real Time Debugger SCRIPT FILE 77-78 A script file is a sequence of MATLAB commands, called a
Helsinki 19 Jan Practical course in genome bioinformatics DAY 0
 Helsinki 19 Jan 2017 529028 Practical course in genome bioinformatics DAY 0 This document can be downloaded at: http://ekhidna.biocenter.helsinki.fi/downloads/teaching/spring2017/exercises_day0.pdf The
STA Rev. F Learning Objectives. Learning Objectives (Cont.) Module 3 Descriptive Measures
 Module 3 Descriptive Measures") STA 2023 Module 3 Descriptive Measures Learning Objectives Upon completing this module, you should be able to: 1. Explain the purpose of a measure of center. 2. Obtain and interpret the mean, median, and
STA 2023 Module 3 Descriptive Measures Learning Objectives Upon completing this module, you should be able to: 1. Explain the purpose of a measure of center. 2. Obtain and interpret the mean, median, and
Introduction to Minitab 1
 Introduction to Minitab 1 We begin by first starting Minitab. You may choose to either 1. click on the Minitab icon in the corner of your screen 2. go to the lower left and hit Start, then from All Programs,
Reference guided RNA-seq data analysis using BioHPC Lab computers
 Reference guided RNA-seq data analysis using BioHPC Lab computers This document assumes that you already know some basics of how to use a Linux computer. Some of the command lines in this document are
Chapter 1 Introduction to using R with Mind on Statistics
 Chapter 1 Introduction to using R with Mind on Statistics Manual overview The purpose of this manual is to help you learn how to use the free R software to perform the graphs, simulations, and data analyses
Math 120 Introduction to Statistics Mr. Toner s Lecture Notes 3.1 Measures of Central Tendency
 Math 1 Introduction to Statistics Mr. Toner s Lecture Notes 3.1 Measures of Central Tendency lowest value + highest value midrange The word average: is very ambiguous and can actually refer to the mean,
EXCEL BASICS: MICROSOFT OFFICE 2007
 EXCEL BASICS: MICROSOFT OFFICE 2007 GETTING STARTED PAGE 02 Prerequisites What You Will Learn USING MICROSOFT EXCEL PAGE 03 Opening Microsoft Excel Microsoft Excel Features Keyboard Review Pointer Shapes
Lecture Notes 3: Data summarization
 Lecture Notes 3: Data summarization Highlights: Average Median Quartiles 5-number summary (and relation to boxplots) Outliers Range & IQR Variance and standard deviation Determining shape using mean &
Boxplots. Lecture 17 Section Robb T. Koether. Hampden-Sydney College. Wed, Feb 10, 2010
 Boxplots Lecture 17 Section 5.3.3 Robb T. Koether Hampden-Sydney College Wed, Feb 10, 2010 Robb T. Koether (Hampden-Sydney College) Boxplots Wed, Feb 10, 2010 1 / 34 Outline 1 Boxplots TI-83 Boxplots 2
Weekly Discussion Sections & Readings
 Weekly Discussion Sections & Readings Teaching Fellows (TA) Name Office Email Mengting Gu Bass 437 mengting.gu (at) yale.edu Paul Muir Bass437 Paul.muir (at) yale.edu Please E-mail cbb752@gersteinlab.org
MATLAB - Lecture # 4
 MATLAB - Lecture # 4 Script Files / Chapter 4 Topics Covered: 1. Script files. SCRIPT FILE 77-78! A script file is a sequence of MATLAB commands, called a program.! When a file runs, MATLAB executes the
Office Suites Seminar
 - 1 - Seminar a Bowie Senior Center Seminar, July 2007 Teacher: Eric Hein (hein1@verizon.net) Download the seminar slides: Start Internet_Explorer go to http://home.comcast.net/~bscclub/training.htm right-click
Bioconductor exercises 1. Exploring cdna data. June Wolfgang Huber and Andreas Buness
 Bioconductor exercises Exploring cdna data June 2004 Wolfgang Huber and Andreas Buness The following exercise will show you some possibilities to load data from spotted cdna microarrays into R, and to
Data Management Project Using Software to Carry Out Data Analysis Tasks
 Data Management Project Using Software to Carry Out Data Analysis Tasks This activity involves two parts: Part A deals with finding values for: Mean, Median, Mode, Range, Standard Deviation, Max and Min
Tutorial: SeqAPass Boxplot Generator
 1 Tutorial: SeqAPass Boxplot Generator 1. Access SeqAPASS by opening https://seqapass.epa.gov/seqapass/ using Mozilla Firefox web browser 2. Open the About link on the login page or upon logging in to
IRA Basic Running Financial Reports
 IRA Basic Running Financial Reports Updated 6-7-2013 1 Training Index Part I Introduction to the IRA Reporting Tool IRA Resources (3) Logging onto the system (4) Navigating the Dashboard (5-9) Running
MBV4410/9410 Fall Bioinformatics for Molecular Biology. Introduction to R
 MBV4410/9410 Fall 2018 Bioinformatics for Molecular Biology Introduction to R Outline Introduce R Basic operations RStudio Bioconductor? Goal of the lecture Introduce you to R Show how to run R, basic
Introduction to R. Nishant Gopalakrishnan, Martin Morgan January, Fred Hutchinson Cancer Research Center
 Introduction to R Nishant Gopalakrishnan, Martin Morgan Fred Hutchinson Cancer Research Center 19-21 January, 2011 Getting Started Atomic Data structures Creating vectors Subsetting vectors Factors Matrices
2.1: Frequency Distributions and Their Graphs
 2.1: Frequency Distributions and Their Graphs Frequency Distribution - way to display data that has many entries - table that shows classes or intervals of data entries and the number of entries in each
Chapter 2 Describing, Exploring, and Comparing Data
 Slide 1 Chapter 2 Describing, Exploring, and Comparing Data Slide 2 2-1 Overview 2-2 Frequency Distributions 2-3 Visualizing Data 2-4 Measures of Center 2-5 Measures of Variation 2-6 Measures of Relative
Basic matrix math in R
 1 Basic matrix math in R This chapter reviews the basic matrix math operations that you will need to understand the course material and how to do these operations in R. 1.1 Creating matrices in R Create
R basics workshop Sohee Kang
 R basics workshop Sohee Kang Math and Stats Learning Centre Department of Computer and Mathematical Sciences Objective To teach the basic knowledge necessary to use R independently, thus helping participants
Unit 3 Fill Series, Functions, Sorting
 Unit 3 Fill Series, Functions, Sorting Fill enter repetitive values or formulas in an indicated direction Using the Fill command is much faster than using copy and paste you can do entire operation in
1 Introduction to Using Excel Spreadsheets
 Survey of Math: Excel Spreadsheet Guide (for Excel 2007) Page 1 of 6 1 Introduction to Using Excel Spreadsheets This section of the guide is based on the file (a faux grade sheet created for messing with)
Basic R Part 1 BTI Plant Bioinformatics Course
 Basic R Part 1 BTI Plant Bioinformatics Course Spring 2013 Sol Genomics Network Boyce Thompson Institute for Plant Research by Jeremy D. Edwards What is R? Statistical programming language Derived from
Unit 3 Functions Review, Fill Series, Sorting, Merge & Center
 Unit 3 Functions Review, Fill Series, Sorting, Merge & Center Function built-in formula that performs simple or complex calculations automatically names a function instead of using operators (+, -, *,
Assignment 0. Nothing here to hand in
 Assignment 0 Nothing here to hand in The questions here have solutions attached. Follow the solutions to see what to do, if you cannot otherwise guess. Though there is nothing here to hand in, it is very
How to Set up a Budget Advanced Excel Part B
 How to Set up a Budget Advanced Excel Part B A budget is probably the most important spreadsheet you can create. A good budget will keep you focused on your ultimate financial goal and help you avoid spending
STA Module 4 The Normal Distribution
 STA 2023 Module 4 The Normal Distribution Learning Objectives Upon completing this module, you should be able to 1. Explain what it means for a variable to be normally distributed or approximately normally
STA /25/12. Module 4 The Normal Distribution. Learning Objectives. Let s Look at Some Examples of Normal Curves
 STA 2023 Module 4 The Normal Distribution Learning Objectives Upon completing this module, you should be able to 1. Explain what it means for a variable to be normally distributed or approximately normally
Example how not to do it: JMP in a nutshell 1 HR, 17 Apr Subject Gender Condition Turn Reactiontime. A1 male filler
 JMP in a nutshell 1 HR, 17 Apr 2018 The software JMP Pro 14 is installed on the Macs of the Phonetics Institute. Private versions can be bought from
Introduction to MATLAB
 Chapter 1 Introduction to MATLAB 1.1 Software Philosophy Matrix-based numeric computation MATrix LABoratory built-in support for standard matrix and vector operations High-level programming language Programming
Prepare a stem-and-leaf graph for the following data. In your final display, you should arrange the leaves for each stem in increasing order.
 Chapter 2 2.1 Descriptive Statistics A stem-and-leaf graph, also called a stemplot, allows for a nice overview of quantitative data without losing information on individual observations. It can be a good
Goals of this course. Crash Course in R. Getting Started with R. What is R? What is R? Getting you setup to use R under Windows
 Oxford Spring School, April 2013 Effective Presentation ti Monday morning lecture: Crash Course in R Robert Andersen Department of Sociology University of Toronto And Dave Armstrong Department of Political
Exercise 1. RNA-seq alignment and quantification. Part 1. Prepare the working directory. Part 2. Examine qualities of the RNA-seq data files
 Exercise 1. RNA-seq alignment and quantification Part 1. Prepare the working directory. 1. Connect to your assigned computer. If you do not know how, follow the instruction at http://cbsu.tc.cornell.edu/lab/doc/remote_access.pdf
BGGN 213 Working with R packages Barry Grant
 BGGN 213 Working with R packages Barry Grant http://thegrantlab.org/bggn213 Recap From Last Time: Why it is important to visualize data during exploratory data analysis. Discussed data visualization best
Introduction to Stata - Session 1
 Introduction to Stata - Session 1 Simon, Hong based on Andrea Papini ECON 3150/4150, UiO January 15, 2018 1 / 33 Preparation Before we start Sit in teams of two Download the file auto.dta from the course
ClaNC: The Manual (v1.1)
") ClaNC: The Manual (v1.1) Alan R. Dabney June 23, 2008 Contents 1 Installation 3 1.1 The R programming language............................... 3 1.2 X11 with Mac OS X....................................
ClaNC: The Manual (v1.1) Alan R. Dabney June 23, 2008 Contents 1 Installation 3 1.1 The R programming language............................... 3 1.2 X11 with Mac OS X....................................
Depending on the computer you find yourself in front of, here s what you ll need to do to open SPSS.
 1 SPSS 13.0 for Windows Introductory Assignment Material covered: Creating a new SPSS data file, variable labels, value labels, saving data files, opening an existing SPSS data file, generating frequency
Intro to Stata for Political Scientists
 Intro to Stata for Political Scientists Andrew S. Rosenberg Junior PRISM Fellow Department of Political Science Workshop Description This is an Introduction to Stata I will assume little/no prior knowledge