Cytometry Data Analysis in FlowJo V10. Timothy Quinn Crawford, PhD Application Scientist FlowJo, LLC
|
|
|
- Miranda Glenn
- 6 years ago
- Views:
Transcription

1 Cytometry Data Analysis in FlowJo V10 Timothy Quinn Crawford, PhD Application Scientist FlowJo, LLC
2 Outline Part I Intro to FlowJo Navigating the V10 Workspace Customizing Ribbons Demo Data Background Creating and Editing Groups Graphs, Gating and Ancestry The Layout Editor Batching and Exporting Graphics The Table Editor and Exporting Statistics

3 The FlowJo v10 Workspace A graphical interface to organize your data. Ribbon Tabs and Bands Groups and Group Analysis Samples and sample analysis

4 Ribbons, Tabs and Bands Ribbon organization allows easy visual navigation of workspace functions. Application Button Task Bar Tabs Bands Ribbon Configuration & Preferences Tabs group similar Bands together. Bands group similar Actions together.

5 Customizing Ribbons Click on the Ribbon icon to configure 1. Drag the icon for any Band into the Ribbon à set of Actions added to your selected Tab. 2.


6 Importing Data Three possible methods: 1. Drag and drop into samples pane 2. Click Add Samples button 3. Press ;
7 Todays Demo Data Set: Phospho-Flow + Intracellular Cytokine Staining (PFICS) Polyclonal PFICS Assay: Thaw and rest cryopreserved human PBMC overnight SBmulate with PMA+Ionomycin (PI) for 2 hours or rest (NS) while blocking protein secrebon à signaling and cytokines Stain for viability (AARD) and surface anbgens (CD3, CD4, CD8, CD38 and HLA-DR) SBmulate PI for 20 minutes or NS rest Fix, perm and stain for intracellular anbgens (phopho-erk1/2, IFN-γ and Perforin) Thaw&Rest PBMC STIM 1 Stain Surface STIM 2 Fix&Perm Stain Intracellular Run on Cytometer

8 PFICS Stim Conditions 2 SBms à 4 potenbal combinabons/condibons Condi7on Total S7m Time phospho-erk Response IFN-γ Response NS+NS 0 min - - NS+PI 20 min PI+NS 120 min PI+PI 140 min
 controls Leave one reagent out of")

9 PFICS Samples 46 Total Samples 20 experimental All Stain samples Stained with all reagents in the panel à Real Experiment 14 Fluorescence Minus One (FMO) controls Leave one reagent out of panel à GaBng Control 12 Compensa7on controls Stained with single reagent to isolate the fluorochrome emission spectrum and determine spillover into detectors. All Stain No HLA-DR FMO CD3 Ax700 Comp
. Groups act like folders to organize your samples, allows master gating and unique report generation.")
10 Group Pane The Group area lists all groups in the Workspace, # of samples in each group (Size), and the Role of that group (ex. Test, Compensation, Controls). Groups act like folders to organize your samples, allows master gating and unique report generation. Group owned analysis gains the group color.


11 Creating and Editing Groups To create a new group type G, or click the Create Group Icon located in either the task bar at the top of the workspace, or within the Navigate band. Double click on an existing group to edit its properties.
, a user defined Keyword value, or any")
12 Sample Inclusion Criteria Live groups automatically include samples based on user-defined Sample Inclusion Criteria. Sample Inclusion Criteria could include the staining panel, characters in the $FIL (file name), a user defined Keyword value, or any combination of these features.
 can be displayed as columns.")
13 Samples and Sample Analysis Displays the sample list and associated analysis of the currently selected group. Statistic and #Cells columns are displayed by default. Additional information (Keywords) can be displayed as columns. Double click on a sample to open a Graph Window and add gates.
 User defined descriptive Keywords (ex.")
14 Keywords Keywords attach descriptive metadata to samples Examples: FCS file standard required keywords (ex. $FIL, $PnS) User defined descriptive Keywords (ex. Patient ID, Timepoint) Workspace Tab à Keywords Bandà Add Keyword allows user to define new Keywords and add metadata


15 Keywords Configure Tab à Settings Band à Edit Columns allows user to display Keywords as columns in the workspace samples pane


16 The Graph Window Facilitates data visualization and gating. Gating Tools Plot View Options Graph Type Active Gate Options Several different plot types are available to display flow data. Click on the Options Menu below the graph image and select Graph Type from the dropdown menu.

17 Graph Display Options Try them all and pick what pleases you, or best represents your data.


18 Gating tools Are located at the top left in a Graph Window. Gating Tools Undo!! Gates can always be modified or removed, so don t be shy. Explore the gating options and pick what works best for you.

19 Transforming Data Your data may initially look squished. Click the Transformation [ T ] button and Select Customize Axis to change the visual display.

20 Transform Options 1. Select parameter(s) 2. Add or remove extra Pos. decades/range on top end 3. Select scale (Biex displays linear around zero and log further out) 4. Add or remove extra Neg. decades/range on bottom end 5. Width basis scales how much visual display is given to linear vs. log range of the Biex scale 6. Click the Apply button at bottom right to apply the transformation settings to selected parameters
. 3.")
21 Effects of Transformation Effects: 1. Gets rid of the squishing of cells. 2. Ensures the visual population center better correlates with the statistical center (median). 3. Make high resolution compensated digital cytometry data more appealing to the eye.

22 Boolean Combination Gates Calculate all possible combinations based on single marker gates (#combinations = 2 #gates ).

23 Add a statistic to any gated population selected within a sample gating hierarchy. Adding Statistics Statistic nodes can be groupapplied just like a gate.

24 The Layout Editor A tool for creating graphical reports. Type L, or click on the Layout Editor icon. Drag populations from a sample to Layout Editor.


25 Working in Layout Editor Similar to the Workspace. Layout Editor has its own customizable Ribbon with Tabs and Bands to organize actions. Tabs Bands Ribbon ConfiguraBon & Preferences Text and Draw Tools Try clicking on the different tabs to see what types of actions are available.

26 Within Layout Editor Graphs can be organized and re-formatted. Statistics, keywords, text and even shapes or objects can be added to illustrate your analysis. Right Click on a graph plot for Ancestry and Backgating options Right click and select Properties for additional graph formatting


27 Working in Layout Editor Double Click a graph to change its properties/ formatting with 4 tabs of Graph Definition options

28 Batch Analysis of Layout Editor Graphics Batch operations perform repetitive analysis on multiple samples, applying the layout to an entire set of samples. Specify Group, Iterate by, Report type and Location, then Click Create Batch Report.
 Specify type of Report Specify Location to write report Click Create Batch")
29 Batch Report Layouts Specify Group Choose Iterate by option Sample Panel Keyword Iterate By (must be Same for all samples displayed in layout) Discriminator (must be Different for all samples displayed in layout) Specify type of Report Specify Location to write report Click Create Batch Report

30 The Table Editor A tool for creating statistical reports. Type T, or click on the Table Editor icon. Drag Populations & Statistics to Table Editor.


31 Within Table Editor Again, the Table Editor has its own customizable Ribbon with Tabs and Bands to organize actions. Tabs Bands Ribbon Configuration & Preferences Specify the group you wish to batch, and how to iterate the batch process, then in the Output band, specify where you want the batch output to go.
, then select the visualization.")
32 Table Editor Visualize Tools Table formatting/visualization options such as heat mapping are contained within the Visualize Tab. Highlight row(s), then select the visualization. Expected Ranges can be set within Preferences à Ranges
 produce statistics tables lacking visualization formatting.")
33 Table Editor Output Formatting/visualization options are maintained when a table is batched to either Display or HTML formats. Other file types (ex. Text, CSV, Excel) produce statistics tables lacking visualization formatting.
34 Outline Part II Advanced Tools and Platforms Compensation Export/Concatenate Cell Cycle Analysis The Plate Editor Plugins Downsample & tsne Templates Additional Training Resources

35 Compensation Compensation corrects for spillover between fluorochrome emission spectra. Compensation is essential for multicolor panels
36 Three Rules of Compensation First, there must be a single stained control for every parameter in the experiment! In Addition, there are three rules for good compensation controls. 1. Controls need to be at least as bright or brighter than any sample the compensation will be applied to. 2. Background fluorescence should be the same for the positive and negative control. 3. Compensation controls MUST match the exact experimental fluorochrome.
37 PFICS Compensation Controls PBMC Cells 1. Unstained Cells 2. AARD 3. CD3 Alexa700 Compensation Beads 1. Unstained Beads with Fix and Perm 2. CD4 PE-TexasRed 3. CD8 Pacific Blue 4. CD38 PE-Cy5 5. HLA-DR APC-H7 6. Unstained Beads without Fix and Perm 7. p-erk1/2 Alexa IFN-g PE-Cy7 9. Perforin PE


38 Compensation Select a Compensation Group in the groups window, then click in the task bar. The wizard auto gates samples

39 Compensation Then fills in the positive and negative. Choose from the dropdown lists for each parameter. Double click preview graphs to modify gates.


 to Modify, Apply,")
40 Note that you can always create your own gates on a sample and then choose those from the drop down menus. When set up is complete, select View Matrix (top right) to Modify, Apply, Save or Preview the matrix you ve created.
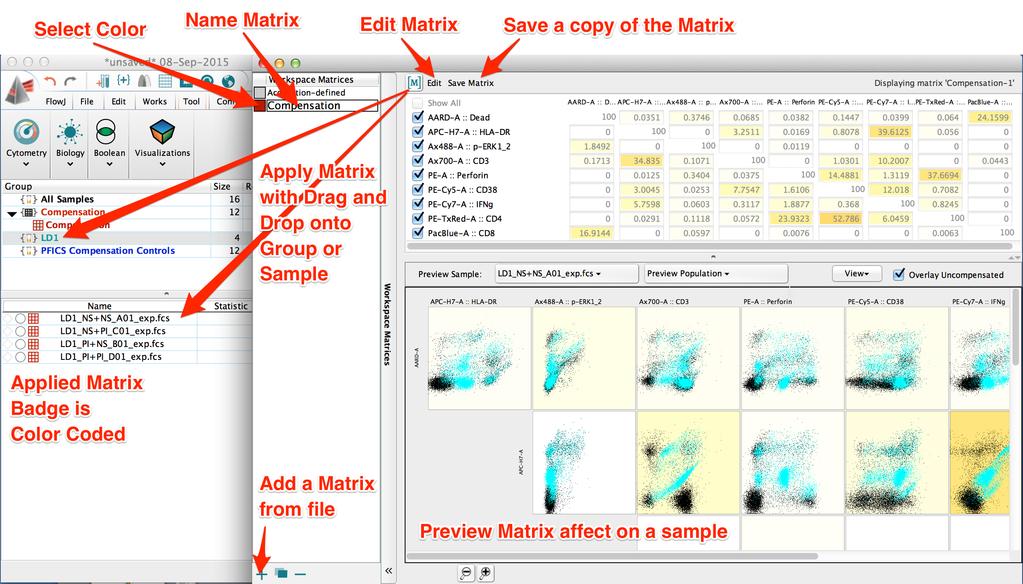
41 Compensation
42 Effect of Compensation Uncompensated Compensated

43 Export and Concatenate Add and embed keyword metadata Merge data from multiple files Identify specific populations Isolate events for further computational analysis Titrate reagents for optimal staining and stimulation conditions Visualize responses
 Export/Concatenate Populations à subset of events defined by gating hierarchy/phenotype 2) Export/Concatenate Group à all or a")
44 Export or Concatenate Data The Data Export/Concatenate action button is located by default in the Document band within the workspace File tab. Choose from two options in the drop down menu: 1) Export/Concatenate Populations à subset of events defined by gating hierarchy/phenotype 2) Export/Concatenate Group à all or a subset of events independent of phenotype
 The Group Export or Concatenate dialog window will")
45 Exporting Groups Highlight a group containing the samples you wish to export Then, choose Export/Concatenate Group (hotkey = shift+ +X) The Group Export or Concatenate dialog window will appear
46 Export Options Output panel Format selects file format (FCS3 or CSV) Destination specifies directory where output files will be saved File name example displays example of naming scheme as specified in Advanced Options à File Naming Include Events panel Include all events or down-sample randomly with Include no more than # Parameters panel Choose All uncompensated parameters (default selection) is recommended. If the sample is compensated, compensated parameters will also be written to the file. Advanced Options File naming panel Prefix specifies a common prefix to add Body specifies the keywords to create a unique name for each file Pattern displays keyword pattern for body naming scheme Suffix specifies a suffix to add Status panel Tells how many files will be produced

47 Custom File Naming Specific options for Export function Allows unique keyword pattern to be defined as a distinct naming scheme between exported files. Add a Keyword value Will add an additional keyword value option To change a Keyword value Select from the drop down keyword list To remove a Keyword value Click the red X button

48 Concatenating Groups Highlight a group containing the samples you wish to export Then, choose Export/Concatenate Group and click the Concatenate button at the top of the dialog Group Concatenation panel Concatenate all files together Concatenate every n files together Concatenate files with equal keyword values Additional Parameters panel Tells how many files will be produced

49 Concatenating Populations Highlight the equivalent population nodes within the gating tree of samples you wish to merge. Choose Export/Concatenate Populations.

50 Additional Parameters You can select one or more keywords to create new parameters in the concatenated output file. Note that you will always get a new parameter called Sample ID in the concatenated file. Selecting Sample ID allows you to see the different samples that were merged.

51 Cell Cycle Analysis The Cell Cycle platform allows 1D modeling of cell cycle phases based on DNA content V10.1 has 1D Watson and Dean-Jea-Fox models.

52 The Plate Editor Viewer to add keywords in a plate format Located in the visualizations Band within the Tools Tab Add new keyword/value pairs to the right. Drag and drop on selected wells.

53 Plate Visualizations

54 Plugins Java programs that extend the functionality of FlowJo. Access from the Plugins menu WorkspaceàPopulations bandàplugins menu
.")
55 Workspace Templates Allows saving all analysis reports in your workspace without data. Streamlines repetitive analysis of multiple runs using the same staining panel(s). File Tab à Document Band à Save As à Export as a Template (WSPT)
56 FlowJo Enterprise Is a server-based version of FlowJo v10, designed to assist with data archiving, analysis, and report generation for high dimension, high throughput flow or mass cytometry data. Can handle data upload directly from the cytometer, store it on a secure server, and provide computational power and automated analysis features for scientists. Is an optional add-on component of the FlowJo Licensing Server (FLS) institutional site license. Is offered as 1 of 4 tiered packages, with each tier introducing additional features and levels of service.

57 FlowJo Enterprise Components for information
58 Additional Training Resources Webinars on basic and advanced features of FlowJo, held on the 1 st and 3 rd Thursday of each month. Webinar Schedule can be found at Technical Documentation for V10 can be found at The Daily Dongle provides tips, tricks and answers to common questions.
59 Questions? FlowJo is here to help with all your cytometry analysis needs. Contact for general questions and support. Contact for science questions, additional training resources and information on FlowJo Enterprise. Thank You!
Cytometry Data Analysis in FlowJo V10. Timothy Quinn Crawford, PhD Application Scientist FlowJo, LLC
 Cytometry Data Analysis in FlowJo V10 Timothy Quinn Crawford, PhD Application Scientist FlowJo, LLC timc@flowjo.com Outline Navigating the V10 Workspace Demo Data background Creating and editing Groups
Cytometry Data Analysis in FlowJo V10
 Cytometry Data Analysis in FlowJo V10 產品專員蔣明涵 Michelle techsupport@gtbiotech.com.tw Outline-Part I What is FlowJo? Navigating the V10 Workspace Graphs, Gating and Ancestry The Table Editor The Layout Editor
Basic Tutorial. Data Analysis Software for Flow Cytometry Windows/Mac user documentation
 Basic Tutorial Data Analysis Software for Flow Cytometry Windows/Mac user documentation FlowJo, its tutorials, documentation and web site are copyright FlowJo, LLC 2018. All Rights Reserved. Version 2.0
Hacking FlowJo VX. 42 Time-Saving FlowJo Shortcuts To Help You Get Your Data Published No Matter What Flow Cytometer It Came From
 Hacking FlowJo VX 42 Time-Saving FlowJo Shortcuts To Help You Get Your Data Published No Matter What Flow Cytometer It Came From Contents 1. Change the default name of your files. 2. Edit your workspace
FlowJo Software Lecture Outline:
 FlowJo Software Lecture Outline: Workspace Basics: 3 major components 1) The Ribbons (toolbar) The availability of buttons here can be customized. *One of the best assets of FlowJo is the help feature*
Getting Started in FCS Express for Previous FlowJo Users
 Getting Started in FCS Express for Previous FlowJo Users The instructions below emphasize similarities and differences between FCS Express 5 and FlowJo v10 and are meant to serve as a translation guide
FACScan 4 and 5 Color Upgrade Rainbow Users Guide
 FACScan 4 and 5 Color Upgrade Rainbow Users Guide For Research Use Only 1 Table of Contents Overview... 3 Hardware Specifications... 3 Rainbow Software... 4 Rainbow Preferences Window... 5 Setting up the
Unscrew and remove the cap from the waste tank
 Stanford Cytoflex HTS User Guide 11232015 Starting up 1. Check the sheath fluid level every time you use the cytometer. This ensures that you do not run out of sheath fluid during an experiment. Replenish
Tutorial: FCAP Array Software with BD FACSArray Bioanalyzer
 Tutorial: FCAP Array Software with BD FACSArray Bioanalyzer After completing this tutorial you will be able to: Create an Experiment with the Experiment Wizard in FCAP Array software. Export the Experiment
Science is hard. Flow cytometry should be easy.
 Science is hard. Flow cytometry should be easy. CFlow User Guide TABLE OF CONTENTS 1 INTRODUCTION TO CFLOW... 1 1.1 Installing CFlow... 1 1.2 Starting CFlow... 1 1.3 CFlow Workspace... 2 1.4 Opening a
Release Notes Life Technologies Attune NxT Software v2.3
 Release Notes Life Technologies Attune NxT Software v2.3 In the following pages you will find instructions describing: New software features Known software/system issues with troubleshooting guidance Software
BD CellQuest Pro Acquisition Tutorial
 BD CellQuest Pro Acquisition Tutorial Introduction This tutorial guides you through a CellQuest Pro Acquisition run like the one demonstrated in the CellQuest Pro Acquisition Movie on the BD FACStation
Flowlogic. User Manual. Developed by scientists, for scientists. Version Flow Cytometry Analysis Software
 Flowlogic Flow Cytometry Analysis Software Developed by scientists, for scientists User Manual Version 7.2.1 www.inivai.com TABLE OF CONTENTS FlowLogic 7.2.1 - Introduction... 5 Layout Overview GateLogic,
BD Multiwell AutoSampler Additional Features Tutorial
 BD Multiwell AutoSampler Additional Features Tutorial Introduction This tutorial provides step-by-step instructions on how to use the additional features available in BD Multiwell Plate Manager (MPM) software
Flow Cytometry Analysis Software. Developed by scientists, for scientists. User Manual. Version Introduction:
 Flowlogic Flow Cytometry Analysis Software Developed by scientists, for scientists User Manual Version 7.2.1 Introduction: Overview, Preferences, Saving and Opening Analysis Files www.inivai.com TABLE
FACSLyric TM General User instructions
 flowkon Flow Cytometry User Instructions at the University of Konstanz FACSLyric TM General User instructions In BD FACSuite software, you can measure and analyze samples using either assays or experiments.
BD CellQuest Pro Software Acquisition Tutorial
 BD CellQuest Pro Software Acquisition Tutorial This tutorial guides you through a typical acquisition using BD CellQuest Pro software. If you are already familiar with previous versions of BD CellQuest
LEGENDplex Data Analysis Software Version 8 User Guide
 LEGENDplex Data Analysis Software Version 8 User Guide Introduction Welcome to the user s guide for Version 8 of the LEGENDplex data analysis software for Windows based computers 1. This tutorial will
BD CellQuest Pro Analysis Tutorial
 BD CellQuest Pro Analysis Tutorial Introduction This tutorial guides you through a CellQuest Pro Analysis run like the one demonstrated in the CellQuest Pro Analysis Movie on the BD FACStation Software
FACSLSRFortessa SORP QUICK REFERENCE GUIDE
 FACSLSRFortessa SORP QUICK REFERENCE GUIDE INSTRUMENT: 1. The computer is left on at all times. Note: If not Username: Administrator Password: BDIS 2. Unlock the screen with your PPMS account (UTSW username
Quick Guide FAST HR. For more resources, including a guide on FAST HR codes, visit # Instructions Screenshot
 Tips & tricks This quick guide describes basic navigation within the FAST HR reporting tool, including how to use filter options, format columns and export reports. For more resources, including a guide
DataPro Quick Start Guide
 DataPro Quick Start Guide Introduction The DataPro application provides the user with the ability to download and analyze data acquired using the ULTRA-LITE PRO range of Auto Meter products. Please see
University of North Dakota PeopleSoft Finance Tip Sheets. Utilizing the Query Download Feature
 There is a custom feature available in Query Viewer that allows files to be created from queries and copied to a user s PC. This feature doesn t have the same size limitations as running a query to HTML
Release Notes Life Technologies Attune NxT Software v2.2
 Release Notes Life Technologies Attune NxT Software v2.2 In the following pages you will find instructions describing: New software features Known software/system issues with troubleshooting guidance Software
Log into the computer using your CU Denver username and password. Log into the DIVA software using your CU and Username and the password flow
 Log into the computer using your CU Denver username and password Log into the DIVA software using your CU and Username and the password flow When DIVA opens, IF a CST Mismatch pop up box appears, then
Flowlogic. User Manual Version GraphLogic: Developed by scientists, for scientists. Graphing and Statistical Analysis.
 Flowlogic Flow Cytometry Analysis Software Developed by scientists, for scientists User Manual Version 7.2.1 GraphLogic: Graphing and Statistical Analysis www.inivai.com TABLE OF CONTENTS GraphLogic Graphing
Overview. Experiment Specifications. This tutorial will enable you to
 Defining a protocol in BioAssay Overview BioAssay provides an interface to store, manipulate, and retrieve biological assay data. The application allows users to define customized protocol tables representing
 Page 1 of 6 Procedures > Pages > Procedures Use -the-system > MI-generate-report MI - Generate Report I Like It Tags & Notes MI - Generate Report This is an explanation of how to access, view and filter
Technical Note. Display of BD Accuri C6 Software- Generated FCS 3.0 Files Using FlowJo for PC and Mac v7.6. Introduction
 Display of BD Accuri C6 Software- Generated FCS 3.0 Files Using FlowJo for PC and Mac v7.6 Contents 1 Introduction 2 Before You Begin 3 Using Global FlowJo Preferences 5 Usinig the Transform Button 5 Saving
CELLQuest Acquisition Tutorial
 CELLQuest Acquisition Tutorial Introduction This tutorial guides you through a CELLQuest Acquisition run like the one demonstrated in the CELLQuest Acquisition Movie on the FACStation Overview CD-ROM.
The walkthrough is available at /
 The walkthrough is available at https://downloads.openmicroscopy.org/presentations/2018/gbi-sydney / Description We will demonstrate a number of features of the OMERO platform using an OMERO server based
Hints for Working with Diva FCS 3.0 files in FlowJo Workspaces By Julie Yuan, SickKids-UHN Flow and Mass Cytometry Facility
 Hints for Working with Diva FCS 3.0 files in FlowJo Workspaces By Julie Yuan, SickKids-UHN Flow and Mass Cytometry Facility Naming FCS Files in Diva Software If you are using FlowJo for data analysis it
Kaluza C Analysis Software PROTECTS YOUR DATA AND YOUR REPUTATION.
 Kaluza C Analysis Software PROTECTS YOUR DATA AND YOUR REPUTATION. KALUZA C ANALYSIS SOFTWARE Kaluza C Flow Cytometry Analysis Software is built upon our successful Kaluza Analysis research use platform.
Contents Part I: Background Information About This Handbook... 2 Excel Terminology Part II: Advanced Excel Tasks...
 Version 3 Updated November 29, 2007 Contents Contents... 3 Part I: Background Information... 1 About This Handbook... 2 Excel Terminology... 3 Part II:... 4 Advanced Excel Tasks... 4 Export Data from
BD Lyoplate Human Screen Analysis Instructions For analysis using FCS Express or FlowJo and heatmap representation in Excel 2007
 BD Biosciences Technical Resources Page 1 For use with the BD Lyoplate Human Cell Surface Marker Screening Panel (Cat. No. 560747). Please check that your catalog numbers for the FCS Express Excel templates
FACCalibur Users Guide
 FACCalibur Users Guide FACSCalibur Start Up Procedure If the Instrument is OFF: 1. Check the sheath and waste tanks. Open the fluidics drawer (front of instrument) and check the levels of sheath fluid
Kaluza Analysis Software SOPHISTICATED FLOW CYTOMETRY, SIMPLIFIED.
 Kaluza Analysis Software SOPHISTICATED FLOW CYTOMETRY, SIMPLIFIED. SOPHISTICATED FLOW CYTOMETRY, SIMPLIFIED Kaluza Flow Cytometry Analysis Software is revolutionary in many ways, but principally in that
Desktop Studio: Charts
 Desktop Studio: Charts Intellicus Enterprise Reporting and BI Platform Intellicus Technologies info@intellicus.com www.intellicus.com Working with Charts i Copyright 2011 Intellicus Technologies This document
Instructor Info: Dave Tucker, LSSMBB ProModel Senior Consultant Office:
 This course is intended for previous Users of Process Simulator who have completed Basic Training but may not have used the software for a while. Our hope is that this training will help these Users brush
You can clear the sample data from the table by selecting the table and pressing Delete.
 Making Quick Tables Choose Insert tab. Then click Table. Then click Quick Tables. Select the style of table from the Quick Tables Gallery. You can clear the sample data from the table by selecting the
Multivariate Calibration Quick Guide
 Last Updated: 06.06.2007 Table Of Contents 1. HOW TO CREATE CALIBRATION MODELS...1 1.1. Introduction into Multivariate Calibration Modelling... 1 1.1.1. Preparing Data... 1 1.2. Step 1: Calibration Wizard
Importing Geochemical Data
 Importing Geochemical Data This Importing Geochemistry Data How-to Guide introduces you to working with Geochemistry data, including how to design a new survey, import data, merge and verify, extract and
Excel 2013 Intermediate
 Instructor s Excel 2013 Tutorial 2 - Charts Excel 2013 Intermediate 103-124 Unit 2 - Charts Quick Links Chart Concepts Page EX197 EX199 EX200 Selecting Source Data Pages EX198 EX234 EX237 Creating a Chart
Designing Adhoc Reports
 Designing Adhoc Reports Intellicus Web-based Reporting Suite Version 4.5 Enterprise Professional Smart Developer Smart Viewer Intellicus Technologies info@intellicus.com www.intellicus.com Copyright 2009
Basic Intro to ETO Results
 Basic Intro to ETO Results Who is the intended audience? Registrants of the 8 hour ETO Results Orientation (this training is a prerequisite) Anyone who wants to learn more but is not ready to attend the
Desktop Studio: Charts. Version: 7.3
 Desktop Studio: Charts Version: 7.3 Copyright 2015 Intellicus Technologies This document and its content is copyrighted material of Intellicus Technologies. The content may not be copied or derived from,
EXCEL 2007 TIP SHEET. Dialog Box Launcher these allow you to access additional features associated with a specific Group of buttons within a Ribbon.
 EXCEL 2007 TIP SHEET GLOSSARY AutoSum a function in Excel that adds the contents of a specified range of Cells; the AutoSum button appears on the Home ribbon as a. Dialog Box Launcher these allow you to
Hands-On Lab. Developing BI Applications. Lab version: Last updated: 2/23/2011
 Hands-On Lab Developing BI Applications Lab version: 1.0.0 Last updated: 2/23/2011 CONTENTS OVERVIEW... 3 EXERCISE 1: USING THE CHART WEB PART... 4 Task 1 Add the Chart Web Part to the page... 4 Task 2
Intellicus Enterprise Reporting and BI Platform
 Designing Adhoc Reports Intellicus Enterprise Reporting and BI Platform Intellicus Technologies info@intellicus.com www.intellicus.com Designing Adhoc Reports i Copyright 2012 Intellicus Technologies This
MERGE FILES TUTORIAL. Version 1.4
 MERGE FILES TUTORIAL Version 1.4 1. INTRODUCTION The merge process consists on adding two or more sample data files from the same sample or from different samples. The file resulting from the merging will
LIMS QUICK START GUIDE. A Multi Step Guide to Assist in the Construction of a LIMS Database. Rev 1.22
 LIMS QUICK START GUIDE A Multi Step Guide to Assist in the Construction of a LIMS Database Rev 1.22 Contents Contents...1 Overview - Creating a LIMS Database...2 1.0 Folders...3 2.0 Data Fields...3 2.1
Module 4: Creating Content Lesson 4: Creating Charts Learn
 Module 4: Creating Content Lesson 4: Creating Charts Learn Welcome to Module 4, Lesson 4. In this lesson, you will learn how to create, edit, and save new charts based on your uploaded data using InfoAssist+.
Excel 2010 Charts and Graphs
 Excel 2010 Charts and Graphs In older versions of Excel the chart engine looked tired and old. Little had changed in 15 years in charting. The popular chart wizard has been replaced in Excel 2010 by a
Quick Start Guide: COLLECT
 Quick Start Guide: COLLECT Ready, Set, Run! The Collect tab is used to collect or import a sample, configure the run settings and set up plots and gates. Collect a Sample 1. Start the C6 Flow Cytometer,
Definiens. Tissue Studio 4.2. Tutorial 3: Metadata Import, Manual ROI Selection and Vessel Detection
 Definiens Tissue Studio 4.2 Tutorial 3: Metadata Import, Manual ROI Selection and Vessel Detection Tutorial 3: Metadata Import, Manual ROI Selection and Vessel Detection Imprint and Version Copyright 2015
Importing Career Standards Benchmark Scores
 Importing Career Standards Benchmark Scores The Career Standards Benchmark assessments that are reported on the PIMS Student Fact Template for Career Standards Benchmarks can be imported en masse using
Quick Start Guide. Paraben s SIM Card Seizure. For Authorized Distribution Only. For use with Microsoft Windows XP/Vista/7
 For Authorized Distribution Only Quick Start Guide Paraben s SIM Card Seizure For use with Microsoft Windows XP/Vista/7 Paraben s SIM Card Seizure Getting Started Guide Contact Information Product Support
CREATING CUSTOMER MAILING LABELS
 CREATING CUSTOMER MAILING LABELS agrē has a built-in exports to make it easy to create a data file of customer address information, but how do you turn a list of names and addresses into mailing labels?
Workflow 1. Description
 Workflow 1 Description Determine protein staining intensities and distances in mitotic apparatus in z-stack intensity images, which were stained for the inner-centromere protein INCENP, and compare the
Act! Marketing Automation
 Act! Marketing Automation A Guide to Getting Started Helping your business grow with marketing automation Act! Marketing Automation Getting Started Guide 2 Contents Page Page 8 Page 10 Page 11 Page 11
UIS USER GUIDE SEPTEMBER 2013 USER GUIDE FOR UIS.STAT (BETA)
") UIS USER GUIDE SEPTEMBER 2013 USER GUIDE FOR UIS.STAT (BETA) Published in 2013 by: UNESCO Institute for Statistics P.O. Box 6128, Succursale Centre-Ville Montreal, Quebec H3C 3J7 Canada Tel: (1 514) 343-6880
UIS USER GUIDE SEPTEMBER 2013 USER GUIDE FOR UIS.STAT (BETA) Published in 2013 by: UNESCO Institute for Statistics P.O. Box 6128, Succursale Centre-Ville Montreal, Quebec H3C 3J7 Canada Tel: (1 514) 343-6880
Designing Adhoc Reports
 Designing Adhoc Reports Intellicus Enterprise Reporting and BI Platform Intellicus Technologies info@intellicus.com www.intellicus.com Copyright 2010 Intellicus Technologies This document and its content
GETTING STARTED. A Step-by-Step Guide to Using MarketSight
 GETTING STARTED A Step-by-Step Guide to Using MarketSight Analyze any dataset Run crosstabs Test statistical significance Create charts and dashboards Share results online Introduction MarketSight is a
PlayerLync Forms User Guide (MachForm)
") PlayerLync Forms User Guide (MachForm) Table of Contents FORM MANAGER... 1 FORM BUILDER... 3 ENTRY MANAGER... 4 THEME EDITOR... 6 NOTIFICATIONS... 8 FORM CODE... 9 FORM MANAGER The form manager is where
PlayerLync Forms User Guide (MachForm) Table of Contents FORM MANAGER... 1 FORM BUILDER... 3 ENTRY MANAGER... 4 THEME EDITOR... 6 NOTIFICATIONS... 8 FORM CODE... 9 FORM MANAGER The form manager is where
FlowJo (Macintosh) Table of Contents. FlowJo (Macintosh)...1 Manual for Macintosh...1. Workspace Overview...2. Workspace Overview...
 Table of Contents. FlowJo (Macintosh)...1 Manual for Macintosh...1. Workspace Overview...2. Workspace Overview...") Table of Contents FlowJo (Macintosh) FlowJo (Macintosh)...1 Manual for Macintosh...1 Workspace Overview...2 Workspace Overview...4 Adding Samples...6 Groups...7 Batch Analysis...9 Statistics...11 Summary
Table of Contents FlowJo (Macintosh) FlowJo (Macintosh)...1 Manual for Macintosh...1 Workspace Overview...2 Workspace Overview...4 Adding Samples...6 Groups...7 Batch Analysis...9 Statistics...11 Summary
Function. Description
 Function Check In Get / Checkout Description Checking in a file uploads the file from the user s hard drive into the vault and creates a new file version with any changes to the file that have been saved.
Excel 2010 Level 1: The Excel Environment
 Excel 2010 Level 1: The Excel Environment Table of Contents The Excel 2010 Environment... 1 The Excel Window... 1 File Tab... 1 The Quick Access Toolbar... 4 Access the Customize the Quick Access Toolbar
Nintex Reporting 2008 Help
 Nintex Reporting 2008 Help Last updated: Thursday, 24 December 2009 1 Using Nintex Reporting 2008 1.1 Chart Viewer Web Part 1.2 Importing and Exporting Reports 1.3 Import Nintex report page 1.4 Item Level
Session 10 MS Word. Mail Merge
 Session 10 MS Word Mail Merge Table of Contents SESSION 10 - MAIL MERGE... 3 How Mail Merge Works?... 3 Getting Started... 4 Start the Mail Merge Wizard... 4 Selecting the starting document... 5 Letters:...
Blue Form Builder extension for Magento 2
 Blue Form Builder extension for Magento 2 User Guide Version 1.0 Table of Contents I) Introduction......5 II) General Configurations....6 1) General Settings.....7 2) ReCaptcha... 8 III) Manage Forms......
Agilent G6854AA MassHunter Personal Compound Database
 Agilent G6854AA MassHunter Personal Compound Database Quick Start Guide This guide describes how to install and use MassHunter Personal Compound Database. Where to find more information What is Personal
Sample A2J Guided Interview & HotDocs Template Exercise
 Sample A2J Guided Interview & HotDocs Template Exercise HotDocs Template We are going to create this template in HotDocs. You can find the Word document to start with here. Figure 1: Form to automate Converting
Automated data analysis of Flow Cytometry (FCM) data
 data") Automated data analysis of Flow Cytometry (FCM) data These exercises are divided into two parts: 1. Getting to know and be more comfortable with FCM data. 2. The automated analysis of some FCM data. Part
Automated data analysis of Flow Cytometry (FCM) data These exercises are divided into two parts: 1. Getting to know and be more comfortable with FCM data. 2. The automated analysis of some FCM data. Part
Lead Discovery 5.2. User Guide. Powered by TIBCO Spotfire
 User Guide Powered by TIBCO Spotfire Last Modified: July 26, 2013 Table of Contents 1. Introduction... 5 2. Loading Data... 6 2.1. Opening an SDFile... 6 2.2. Importing a ChemDraw for Excel File... 6 2.3.
Shopping Cart: Queries, Personalizations, Filters, and Settings
 Shopping Cart: Queries, Personalizations, Filters, and Settings on the Shopping Cart Home Page Use this Job Aid to: Learn how to organize the Shopping Cart home page so that it is easier to use. BEFORE
MetaXpress. High Content Image Acquisition & Analysis Software Version 6.1. Analysis Guide
 MetaXpress High Content Image Acquisition & Analysis Software Version 6.1 Analysis Guide 5039429 B September 2015 This document is provided to customers who have purchased Molecular Devices equipment,
SchoolDesk University
 SchoolDesk University Forms, Surveys, and Polls Module 101 Guided Walk-through for the basic fields, terminology, and location of tools. What is the NEW SD7 Forms Module? The NEW SchoolDesk Forms Module,
Human Peripheral Blood Phenotyping Panel Kit Cytobank Guide to SPADE Analysis v 1.0
 The Premier Platform for Single Cell Analysis Human Peripheral Blood Phenotyping Panel Kit Cytobank Guide to SPADE Analysis v 1.0 Cytobank guide for the identification of cell types from the Human Peripheral
Microsoft Office 2016 Mail Merge
 Microsoft Office 2016 Mail Merge Mail Merge Components In order to understand how mail merge works you need to examine the elements involved in the process. In any mail merge, you'll deal with three different
Sedao Ltd. QuickChange PROject. User Manual for QuickChange PROject version 2.1.5
 Sedao Ltd QuickChange PROject User Manual for QuickChange PROject version 2.1.5 Contents What is QuickChange PROject?... 2 Simple Artwork Creation... 5 Creating a project... 7 QuickChange PROject Template
Working with Mailbox Manager
 Working with Mailbox Manager A user guide for Mailbox Manager supporting the Message Storage Server component of the Avaya S3400 Message Server Mailbox Manager Version 5.0 February 2003 Copyright 2003
UNC Flow Cytometry Core Facility LSR II Operation 2018
 Reference: Startup BD FACSDiva 6 Online Course BD Training & elearning 1. Check Sheath and Waste containers: Empty Waste container in the sink Add bleach to the black mark ( ~10% final concentration).
Creating Dynamic Chyron Templates. (a guide)
") Creating Dynamic Chyron Templates (a guide) Contents Standard Lower Third Design.......................... 2 Populating a Lower Third... 6 Creating a Dynamic Box. 8 Populating a Graphic. 12 Adding Assets
Creating Dynamic Chyron Templates (a guide) Contents Standard Lower Third Design.......................... 2 Populating a Lower Third... 6 Creating a Dynamic Box. 8 Populating a Graphic. 12 Adding Assets
Offline Flow Cytometry Analysis Software: Importance of Scaling and Data Visualization
 WHITEPAPER Offline Flow Cytometry Analysis Software: Importance of Scaling and Data Visualization Objectives Learn about the flow cytometry open platform data structure and how it facilitates for robust
Table of Contents. Page 2 of 72. High Impact 4.0 User Manual
 Table of Contents Introduction 5 Installing High Impact email 6 Installation Location 6 Select Mail Client 6 Create a ReadyShare Account 6 Create a Default Profile 6 Outlook Configuration Message 6 Complete
Offline Flow Cytometry Analysis Software: Importance of Scaling and Data Visualization
 WHITEPAPER Offline Flow Cytometry Analysis Software: Importance of Scaling and Data Visualization Objectives Learn about the flow cytometry open platform data structure and how it facilitates for robust
Frequency tables Create a new Frequency Table
 Frequency tables Create a new Frequency Table Contents FREQUENCY TABLES CREATE A NEW FREQUENCY TABLE... 1 Results Table... 2 Calculate Descriptive Statistics for Frequency Tables... 6 Transfer Results
CalPlan. Creating a Unit Plan Navigating CalPlan Workbook 1/25/18
 CalPlan Creating a Unit Plan Workbook 1/25/18 Table of Contents Exercise 1: Log into the Workspace & Run a CalPlan Report... 3 Exercise 2: Launching CalPlan and Setting Your Entity... 10 Exercise 3: Actualized
1. AUTO CORRECT. To auto correct a text in MS Word the text manipulation includes following step.
 1. AUTO CORRECT - To auto correct a text in MS Word the text manipulation includes following step. - STEP 1: Click on office button STEP 2:- Select the word option button in the list. STEP 3:- In the word
Near UV Laser System Performance on the CytoFLEX S
 Near UV Laser System Performance on the CytoFLEX S APPLICATION NOTE Authors: Jeffrey Cobb James Tung Affiliation: Life Science, Beckman Coulter, Inc., Miami, FL, United States Introduction Material and
DataSweet also has a whole host of improvements which are not covered in this document.
 Page 1 Introduction DataSweet 3.5.0 contains many new features that make DataSweet a really powerful tool for data handling in the classroom. This document only covers the new features and how they work.
Release Notes Life Technologies Attune NxT Cytometric Software v 2.0.0
 Release Notes Life Technologies Attune NxT Cytometric Software v 2.0.0 In the following pages you will find instructions describing: 1. Software installation 2. New software features and fixes 3. Known
Rev. B 12/16/2015 Downers Grove Public Library Page 1 of 40
 Objectives... 3 Introduction... 3 Excel Ribbon Components... 3 File Tab... 4 Quick Access Toolbar... 5 Excel Worksheet Components... 8 Navigating Through a Worksheet... 9 Downloading Templates... 9 Using
Creating Automated Dashboard Excel 2013 Contents
 Creating Automated Dashboard Excel 2013 Contents Summarize Data Using Pivot Table... 2 Constructing Report Summary... 2 Create a PivotTable from worksheet data... 2 Add fields to a PivotTable... 2 Grouping
Designing a Web Page Using MS SharePoint Designer Reference Manual
 Designing a Web Page Using MS SharePoint Designer 2007 Reference Manual SHAREPOINT DESIGNER 2007 BASICS 1. Opening SharePoint Designer 2007 application - Click start>all Programs>Microsoft Office>Microsoft
Open. Select the database and click. Print. Set printing options using the dropdown menus, then click the
 The Original Quick Reference Guides Microsoft Access 2010 Access is a tool for creating and managing databases collections of related records structured in an easily accessible format such as a table,
Vela Web User Guide Vela Systems, Inc. All rights reserved.
 The Vela Systems Web application is designed to enable the administration, management, and reporting of the Vela Field Management Suite, as well as give project teams the ability to collaborate on issues,
Instructions: DRDP Online Child Upload
 Instructions: DRDP Online Child Upload Version 1.00 10/29/2018 Table of Contents Introduction... 2 Upload Roles... 2 Upload Template... 2 Entering Data into the Template... 3 Uploading to DRDP Online...
Tabular Building Template Manager (BTM)
") Tabular Building Template Manager (BTM) User Guide IES Vi rtual Environment Copyright 2015 Integrated Environmental Solutions Limited. All rights reserved. No part of the manual is to be copied or reproduced
Tabular Building Template Manager (BTM) User Guide IES Vi rtual Environment Copyright 2015 Integrated Environmental Solutions Limited. All rights reserved. No part of the manual is to be copied or reproduced
XLCubed Version 9 QuickStart
 XLCubed Version 9 QuickStart 1 P a g e Contents Welcome... 3 Connecting to your data... 3 XLCubed for Pivot Table users... 3 Adding a Grid, and the Report Designer... 5 Working with Grids... 7 Grid Components...