QGIS Raster Operations
|
|
|
- Daisy Watts
- 5 years ago
- Views:
Transcription
1 QGIS Raster Operations I) Raster Calculator II) Thematic Map Symbology III) Interpolation IV) Image Clipping V) Slope creation VI) Zonal statistics VII) Generating Contours VIII) Vector to Raster Conversion 1


2 Open QGIS I) Raster Calculator 1. Press Add Raster Layer icon 2. Access Liss3 data from \QGIS_Raster_Operations\L3Data\Hyd1DL3.img 3. Select projection EPSG:4326 from the Coordinate Reference System Selector window 4. Press OK and see the Multispectral image 2
3 5. Select and click from Raster Menu and view the following window 6. Select output file and write ( "Hyd1DL3@3" - "Hyd1DL3@2" ) / ( "Hyd1DL3@3" + "Hyd1DL3@2" ) in Raster Calculator Expression 3


4 7. Press OK to view the NDVI Image as shown below II) Thematic Map Symbology 1. Add NDVI Image either created or load from..\qgis_raster_operations\ndvi\ndvi.img 2. Right Click on Ndvi from layers window and select the Properties 4


5 3. Choose the following properties : Render Type Singleband pseudocolor Color Interpolation Discrete Spectral 11 for color map Mode- Equal Interval Classes Press Classify Button to view the following window 5

6 5. Press OK button to view the NDVI image with Symbology III) Interpolation 1. Add AWS data from..\qgis_raster_operations\aws_data\indiastns.shp 2. Select Interpolation command from Raster Menu 6


7 3. View the following window 4. Provide the following parameters Select ELEVATION for Interpolation attribute and press Add button See the default parameters for Interpolation method, Number of columns, Number of rows, cellsizex, Cellsize Y or provide the desire parameters. Provide the Output file See the following window. 7

8 5. Press OK and see the interpolated image in the main window. 8


9 IV) Image Clipping 1. Add DEM which is created in previous exercise or add form QGIS_Raster_Operations\IDW_Elevation\India_AWS_IDW_300.asc 2. Press Add vector icon from the toolbar 3. Access the polygon(ap State Boundary) from the path \QGIS_Raster_Operations\AP_Vectors\AP_State.shp 4. Press Open 5. Select Raster>Extraction>Clipper 9

10 6. Provide the outputfile 7. Select Mask radio button and view the following window 8. Press OK button to see the following window 10


11 V) Slope creation 1. Use AP_Elevation map from previous exercise or add from..\qgis_raster_operations\idw_elevation_ap\ap_elevation.tif 2. Select slope from Raster>Terrain Analysis>Slope as shown below 3. Provide the output file name in the following Window 4. Press OK button provide the symbology as given earlier exercise to see the following window 11


12 VI) Zonal statistics 1. Add the NDVI image created in earlier exercise or add from \QGIS_Raster_Operations\NDVI\ndvi.img 2. Add vector layer from \QGIS_Raster_Operations\AP_Vectors\Hyd_Poly.shp 3. Select zonal statistics from Raster>Zonal stistics>zonal statistics 4. See that the layers are automatically selected and Provide the column prefix as slope 5. Press OK 6. Select HYD_POLY and right click to select Open Attribute Table to see the following details 7. Observe that new three columns slopecount, slopesum, slopemean 12


13 VII) Generating Contours 1. Open a new project from by selecting icon 2. Add the DEM created from earlier exercise or add from \QGIS_Raster_Operations\IDW_Elevation\India_AWS_IDW_300.asc 3. Select Raster>Extraction>Contour as shown below 4. Provide output file name 5. Provide interval between contours as Select Attribute Name Checkbox and provide as Elev and see the window as given below 7. Press OK button 8. See the following window 13


14 9. Right Click on contour file and select Open Attribute Table to see the elevation values as shown below 14

 and")
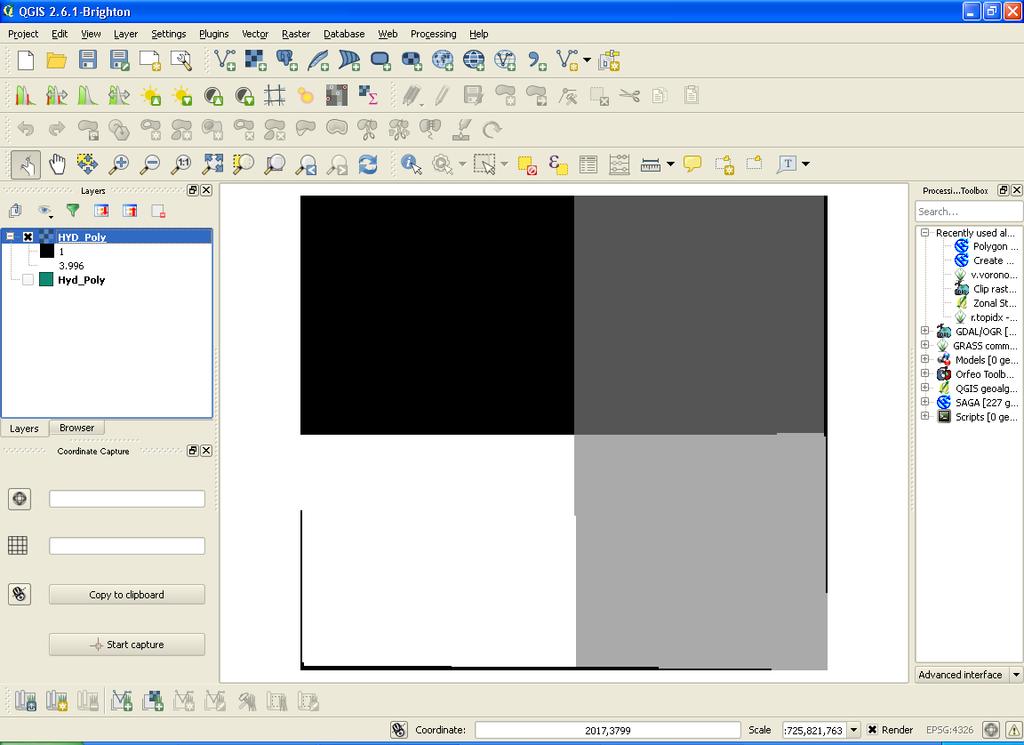
15 VIII) Vector to Raster Conversion 1. Open new project 2. Add Hyd_Poly from the path \QGIS_Raster_Operations\AP_Vectors\Hyd_Poly.shp 3. Select Raster>Conversion>Rasterize(Vector to Raster) as shown below 4. See that Input file already selected and Provide output file for rasterized vectors (raster) and Raster size in pixels as 300 in each Widht and Height 5. Press OK see the raster as given below 15
16 16
CHAPTER 5 DIGITAL ELEVATION MODEL AND 3D VISUALIZATION
 CHAPTER 5 DIGITAL ELEVATION MODEL AND 3D VISUALIZATION A digital elevation model (DEM) is a digital model or 3D representation of a terrain's surface. A DEM can be represented as a raster (a grid of squares,
Exercise 3-1: Soil property mapping
 Exercise 3-1: Soil property mapping Mapping objectives: Create a soil analysis point layer from tabular data in QGIS Create a continuous surface soil property map using Kriging Interpolation in SAGA GIS
Lab 12: Sampling and Interpolation
 Lab 12: Sampling and Interpolation What You ll Learn: -Systematic and random sampling -Majority filtering -Stratified sampling -A few basic interpolation methods Data for the exercise are in the L12 subdirectory.
Download the Latest LTR QGIS version (2.18) from the QGIS website: download.qgis.org/ >> Settings > Options > Locale
 from the QGIS website: download.qgis.org/ >> Settings > Options > Locale") Exercise 1: Introduction to QGIS Aim: To understand the basis of GIS To learn the basics of a GIS software (QGIS) INTRODUCTION Software Access Download the Latest LTR QGIS version (2.18) from the QGIS
Exercise 1: Introduction to QGIS Aim: To understand the basis of GIS To learn the basics of a GIS software (QGIS) INTRODUCTION Software Access Download the Latest LTR QGIS version (2.18) from the QGIS
RASTER ANALYSIS GIS Analysis Fall 2013
 RASTER ANALYSIS GIS Analysis Fall 2013 Raster Data The Basics Raster Data Format Matrix of cells (pixels) organized into rows and columns (grid); each cell contains a value representing information. What
RASTER ANALYSIS GIS Analysis Winter 2016
 RASTER ANALYSIS GIS Analysis Winter 2016 Raster Data The Basics Raster Data Format Matrix of cells (pixels) organized into rows and columns (grid); each cell contains a value representing information.
GY301 Geomorphology Lab 5 Topographic Map: Final GIS Map Construction
 GY301 Geomorphology Lab 5 Topographic Map: Final GIS Map Construction Introduction This document describes how to take the data collected with the total station for the campus topographic map project and
Module: Rasters. 8.1 Lesson: Working with Raster Data Follow along: Loading Raster Data CHAPTER 8
 CHAPTER 8 Module: Rasters We ve used rasters for digitizing before, but raster data can also be used directly. In this module, you ll see how it s done in QGIS. 8.1 Lesson: Working with Raster Data Raster
Raster Data Model & Analysis
 Topics: 1. Understanding Raster Data 2. Adding and displaying raster data in ArcMap 3. Converting between floating-point raster and integer raster 4. Converting Vector data to Raster 5. Querying Raster
Manual for Satellite Data Analysis. ecognition Developer
 - Manual for Satellite Data Analysis ecognition Developer PNGFA. December 2013 Table of Contents Chapter 1. Introduction... 2 Chapter 2. Characteristics of Spectrums... 5 Chapter 3. Differences between
Introduction to GIS 2011
 Introduction to GIS 2011 Digital Elevation Models CREATING A TIN SURFACE FROM CONTOUR LINES 1. Start ArcCatalog from either Desktop or Start Menu. 2. In ArcCatalog, create a new folder dem under your c:\introgis_2011
v Importing Rasters SMS 11.2 Tutorial Requirements Raster Module Map Module Mesh Module Time minutes Prerequisites Overview Tutorial
 v. 11.2 SMS 11.2 Tutorial Objectives This tutorial teaches how to import a Raster, view elevations at individual points, change display options for multiple views of the data, show the 2D profile plots,
QGIS Tutorials Documentation
 QGIS Tutorials Documentation Release 0.1 Nathaniel Roth November 30, 2016 Contents 1 Installation 3 1.1 Basic Installation............................................. 3 1.2 Advanced Installation..........................................
Working with demographic grids in QGIS
 Working with demographic grids in QGIS Anna Dmowska dmowska@amu.edu.pl April 2017 1. Introduction SocScape (Social Landscape) is a research project which provides open access to high resolution (30 m)
Practical guidance on mapping and visualisation of crime and social data in QGIS
 Practical guidance on mapping and visualisation of crime and social data in QGIS Lesson 4: Mapping of aggregated crime data in QGIS This work is licensed under a Creative Commons Attribution-NonCommercial-ShareAlike
All data is in Universal Transverse Mercator (UTM) Zone 6 projection, and WGS 84 datum.
 Zone 6 projection, and WGS 84 datum.") 111 Mulford Hall, College of Natural Resources, UC Berkeley (510) 643-4539 EXPLORING MOOREA DATA WITH QUANTUM GIS In this exercise, you will be using an open-source FREE GIS software, called Quantum GIS,
111 Mulford Hall, College of Natural Resources, UC Berkeley (510) 643-4539 EXPLORING MOOREA DATA WITH QUANTUM GIS In this exercise, you will be using an open-source FREE GIS software, called Quantum GIS,
Using GIS to Site Minimal Excavation Helicopter Landings
 Using GIS to Site Minimal Excavation Helicopter Landings The objective of this analysis is to develop a suitability map for aid in locating helicopter landings in mountainous terrain. The tutorial uses
Combine Yield Data From Combine to Contour Map Ag Leader
 Combine Yield Data From Combine to Contour Map Ag Leader Exporting the Yield Data Using SMS Program 1. Data format On Hard Drive. 2. Start program SMS Basic. a. In the File menu choose Open. b. Click on
Glacier Mapping and Monitoring
 Glacier Mapping and Monitoring Exercises Tobias Bolch Universität Zürich TU Dresden tobias.bolch@geo.uzh.ch Exercise 1: Visualizing multi-spectral images with Erdas Imagine 2011 a) View raster data: Open
v Working with Rasters SMS 12.1 Tutorial Requirements Raster Module Map Module Mesh Module Time minutes Prerequisites Overview Tutorial
 v. 12.1 SMS 12.1 Tutorial Objectives This tutorial teaches how to import a Raster, view elevations at individual points, change display options for multiple views of the data, show the 2D profile plots,
I.1. Digitize landslide region and micro-topography using satellite image
 I. Data Preparation At this part, it will be shown the stages of process on preparing all types of data which required in making of landslide potential and banjir bandang hazard map. I.1. Digitize landslide
Working with Elevation Data URPL 969 Applied GIS Workshop: Rethinking New Orleans After Hurricane Katrina Spring 2006
 Working with Elevation Data URPL 969 Applied GIS Workshop: Rethinking New Orleans After Hurricane Katrina Spring 2006 This GIS lab exercise will explore Light Detection And Ranging (LiDAR) data for New
Server Usage & Third-Party Viewers
 Server Usage & Third-Party Viewers October 2016 HiPER LOOK Version 1.4.16.0 Copyright 2015 PIXIA Corp. All Rights Reserved. Table of Contents HiPER LOOK Server Introduction... 2 Google Earth... 2 Installation...2
Spatial Analysis with Raster Datasets
 Spatial Analysis with Raster Datasets Francisco Olivera, Ph.D., P.E. Srikanth Koka Lauren Walker Aishwarya Vijaykumar Keri Clary Department of Civil Engineering April 21, 2014 Contents Brief Overview of
Introduction. Contour Lines Generation
 Introduction Over the years the e-foto project has been developed and the need for integration with other Geographic Information Systems software became more evident. From this need several improvements
Field-Scale Watershed Analysis
 Conservation Applications of LiDAR Field-Scale Watershed Analysis A Supplemental Exercise for the Hydrologic Applications Module Andy Jenks, University of Minnesota Department of Forest Resources 2013
Lab 12: Sampling and Interpolation
 Lab 12: Sampling and Interpolation What You ll Learn: -Systematic and random sampling -Majority filtering -Stratified sampling -A few basic interpolation methods Videos that show how to copy/paste data
Module 7 Raster operations
 Introduction Geo-Information Science Practical Manual Module 7 Raster operations 7. INTRODUCTION 7-1 LOCAL OPERATIONS 7-2 Mathematical functions and operators 7-5 Raster overlay 7-7 FOCAL OPERATIONS 7-8
GEOGRAPHIC INFORMATION SYSTEMS Lecture 25: 3D Analyst
 GEOGRAPHIC INFORMATION SYSTEMS Lecture 25: 3D Analyst 3D Analyst - 3D Analyst is an ArcGIS extension designed to work with TIN data (triangulated irregular network) - many of the tools in 3D Analyst also
Lesson 5 - Creating Prescription Maps. Exercise 5-1
 Lesson 5 - Creating Prescription Maps Exercise 5-1 Objective: Create a phosphorus prescription map based on the University of Nebraska-Lincoln recommendations. 1. File-Open Project_5-0.map. The required
Your Prioritized List. Priority 1 Faulted gridding and contouring. Priority 2 Geoprocessing. Priority 3 Raster format
 Your Prioritized List Priority 1 Faulted gridding and contouring Priority 2 Geoprocessing Priority 3 Raster format Priority 4 Raster Catalogs and SDE Priority 5 Expanded 3D Functionality Priority 1 Faulted
Making Yield Contour Maps Using John Deere Data
 Making Yield Contour Maps Using John Deere Data Exporting the Yield Data Using JDOffice 1. Data Format On Hard Drive 2. Start program JD Office. a. From the PC Card menu on the left of the screen choose
Basics of Using LiDAR Data
 Conservation Applications of LiDAR Basics of Using LiDAR Data Exercise #2: Raster Processing 2013 Joel Nelson, University of Minnesota Department of Soil, Water, and Climate This exercise was developed
AutoCAD Civil 3D 2011 ESSENTIALS
 AutoCAD Civil 3D 2011 ESSENTIALS SDC PUBLICATIONS www.sdcpublications.com Schroff Development Corporation Table of Contents Table of Contents Preface...ix Module 1 The AutoCAD Civil 3D Interface... 1-1
Steps for Modeling a Proposed New Reservoir in GIS
 Steps for Modeling a Proposed New Reservoir in GIS Requirements: ArcGIS ArcMap, ArcScene, Spatial Analyst, and 3D Analyst There s a new reservoir proposed for Right Hand Fork in Logan Canyon. I wanted
RASTER ANALYSIS S H A W N L. P E N M A N E A R T H D A T A A N A LY S I S C E N T E R U N I V E R S I T Y O F N E W M E X I C O
 RASTER ANALYSIS S H A W N L. P E N M A N E A R T H D A T A A N A LY S I S C E N T E R U N I V E R S I T Y O F N E W M E X I C O TOPICS COVERED Spatial Analyst basics Raster / Vector conversion Raster data
Objectives Learn how GMS uses rasters to support all kinds of digital elevation models and how rasters can be used for interpolation in GMS.
 v. 9.1 GMS 9.1 Tutorial Using rasters for interpolation and visualization in GMS Objectives Learn how GMS uses rasters to support all kinds of digital elevation models and how rasters can be used for interpolation
GEOGRAPHIC INFORMATION SYSTEMS Lecture 24: Spatial Analyst Continued
 GEOGRAPHIC INFORMATION SYSTEMS Lecture 24: Spatial Analyst Continued Spatial Analyst - Spatial Analyst is an ArcGIS extension designed to work with raster data - in lecture I went through a series of demonstrations
CROP MAPPING WITH SENTINEL-2 JULY 2017, SPAIN
 _p TRAINING KIT LAND01 CROP MAPPING WITH SENTINEL-2 JULY 2017, SPAIN Table of Contents 1 Introduction to RUS... 3 2 Crop mapping background... 3 3 Training... 3 3.1 Data used... 3 3.2 Software in RUS environment...
QGIS LAB SERIES GST 102: Spatial Analysis Lab 7: Raster Data Analysis - Density Surfaces
 QGIS LAB SERIES GST 102: Spatial Analysis Lab 7: Raster Data Analysis - Density Surfaces Objective Learn Density Analysis Methods Document Version: 2014-07-11 (Beta) Contents Introduction...2 Objective:
Using LIDAR to Design Embankments in ArcGIS. Written by Scott Ralston U.S. Fish & Wildlife Service Windom Wetland Management District
 Using LIDAR to Design Embankments in ArcGIS Written by Scott Ralston U.S. Fish & Wildlife Service Windom Wetland Management District This tutorial covers the basics of how to design a dike, embankment
Digging Into Autodesk Map 3D 2007 Level 1 Training Rick Ellis Michael Carris Russell Martin
 Digging Into Autodesk Map 3D 2007 Level 1 Training Rick Ellis Michael Carris Russell Martin PO Box 344 Canby Oregon 97013 www.cadapult-software.com training@cadapult-software.com (503) 829-8929 Table of
Modern Tools for NTDs Control Programmes
 Modern Tools for NTDs Control Programmes www.thiswormyworld.org Practical 1 Becoming familiar with QGIS interface and GIS features www.thiswormyworld.org 2 Aim of practical This first practical aims to
v SMS Tutorials Working with Rasters Prerequisites Requirements Time Objectives
 v. 12.2 SMS 12.2 Tutorial Objectives Learn how to import a Raster, view elevations at individual points, change display options for multiple views of the data, show the 2D profile plots, and interpolate
I CALCULATIONS WITHIN AN ATTRIBUTE TABLE
 Geology & Geophysics REU GPS/GIS 1-day workshop handout #4: Working with data in ArcGIS You will create a raster DEM by interpolating contour data, create a shaded relief image, and pull data out of the
Exercise 4: Extracting Information from DEMs in ArcMap
 Exercise 4: Extracting Information from DEMs in ArcMap Introduction This exercise covers sample activities for extracting information from DEMs in ArcMap. Topics include point and profile queries and surface
Ex. 4: Locational Editing of The BARC
 Ex. 4: Locational Editing of The BARC Using the BARC for BAER Support Document Updated: April 2010 These exercises are written for ArcGIS 9.x. Some steps may vary slightly if you are working in ArcGIS
Extracting Elevation from Air Photos
 Extracting Elevation from Air Photos TUTORIAL A digital elevation model (DEM) is a digital raster surface representing the elevations of a terrain for all spatial ground positions in the image. Traditionally
16) After contour layer is chosen, on column height_field, choose Elevation, and on tag_field column, choose <None>. Click OK button.
 After contour layer is chosen, on column height_field, choose Elevation, and on tag_field column, choose <None>. Click OK button.") 16) After contour layer is chosen, on column height_field, choose Elevation, and on tag_field column, choose . Click OK button. 17) The process of TIN making will take some time. Various process
16) After contour layer is chosen, on column height_field, choose Elevation, and on tag_field column, choose . Click OK button. 17) The process of TIN making will take some time. Various process
INTRODUCTION TO IDRISI
 INTRODUCTION TO IDRISI Introduction The aim of this practical is to familiarise yourself with the IDRISI GIS environment. IDRISI is primarily designed to process and analyse raster information (remember,
Ice surface velocities using SAR
 Ice surface velocities using SAR Thomas Schellenberger, PhD ESA Cryosphere Remote Sensing Training Course 2018 UNIS Longyearbyen, Svalbard 12 th June 2018 thomas.schellenberger@geo.uio.no Outline Data
Data Assembly, Part II. GIS Cyberinfrastructure Module Day 4
 Data Assembly, Part II GIS Cyberinfrastructure Module Day 4 Objectives Continuation of effective troubleshooting Create shapefiles for analysis with buffers, union, and dissolve functions Calculate polygon
Exercise 5. Height above Nearest Drainage Flood Inundation Analysis
 Exercise 5. Height above Nearest Drainage Flood Inundation Analysis GIS in Water Resources, Fall 2016 Prepared by David G Tarboton Purpose The purpose of this exercise is to illustrate the use of TauDEM
START>PROGRAMS>ARCGIS>
 Department of Urban Studies and Planning Spring 2006 Department of Architecture Site and Urban Systems Planning 11.304J / 4.255J GIS EXERCISE 2 Objectives: To generate the following maps using ArcGIS Software:
Biomapper file preparation and preliminary analysis 6 steps to create 1 0 (Boolean) files for species data in Arc Map
 files for species data in Arc Map") Biomapper file preparation and preliminary analysis 6 steps to create 1 0 (Boolean) files for species data in Arc Map Before starting Make sure that the study area raster (or shapefile) and the species
Biomapper file preparation and preliminary analysis 6 steps to create 1 0 (Boolean) files for species data in Arc Map Before starting Make sure that the study area raster (or shapefile) and the species
A Second Look at DEM s
 A Second Look at DEM s Overview Detailed topographic data is available for the U.S. from several sources and in several formats. Perhaps the most readily available and easy to use is the National Elevation
Advanced GIS Using GRASS to create SVF and LRM
 Advanced GIS Using GRASS to create SVF and LRM Table of Contents Aims...2 Outcomes...2 How to use this booklet...2 Task 1 Creating a GRASS location from QGIS...3 Task 2 Changing the GRASS Region...8 Task
Mapping Regional Inundation with Spaceborne L-band SAR
 Making remote-sensing data accessible since 1991 Mapping Regional Inundation with Spaceborne L-band SAR Using open-source software such as QGIS and GIMP Adapted from Bruce Chapman 1, Rick Guritz 2, and
By Colin Childs, ESRI Education Services. Catalog
 s resolve many traditional raster management issues By Colin Childs, ESRI Education Services Source images ArcGIS 10 introduces Catalog Mosaicked images Sources, mosaic methods, and functions are used
Tutorial (Intermediate level): Dense Cloud Classification and DTM generation with Agisoft PhotoScan Pro 1.1
: Dense Cloud Classification and DTM generation with Agisoft PhotoScan Pro 1.1") Tutorial (Intermediate level): Dense Cloud Classification and DTM generation with Agisoft PhotoScan Pro 1.1 This tutorial illustrates how to perform dense point cloud classification in manual and automatic
Tutorial (Intermediate level): Dense Cloud Classification and DTM generation with Agisoft PhotoScan Pro 1.1 This tutorial illustrates how to perform dense point cloud classification in manual and automatic
Creating Contours using ArcMap
 Creating Contours with ArcMap and ArcScene Digital elevation models (DEMs) are geospatial datasets that contain elevation values sampled according to a regularly spaced rectangular grid. They can be used
An Introduction to GIS. Using QGIS (v. 3.0)
") An Introduction to GIS Using QGIS (v. 3.0) Author: Michael L. Treglia mtreglia@gmail.com 13 May 2018 License: This work is licensed under a Creative Commons Attribution- NonCommercial-ShareAlike 4.0 International
An Introduction to GIS Using QGIS (v. 3.0) Author: Michael L. Treglia mtreglia@gmail.com 13 May 2018 License: This work is licensed under a Creative Commons Attribution- NonCommercial-ShareAlike 4.0 International
Arcgis 10 Manually Move Labels
 Arcgis 10 Manually Move Labels The "easy custom labeling" Tool in QGIS seems to come close to the ArcGIS solution. However, after I created my custom label layer I am not able to move my labels at the
OPTIONAL EXERCISE 3 Creating a Fusion Project Part C
 OPTIONAL EXERCISE 3 Creating a Fusion Project Part C Objective Last Updated: April, 2016 Version: Fusion 3.50 In this exercise you will continue building the Fusion project data by creating a Canopy Surface
Lab 9. Raster Analyses. Tomislav Sapic GIS Technologist Faculty of Natural Resources Management Lakehead University
 Lab 9 Raster Analyses Tomislav Sapic GIS Technologist Faculty of Natural Resources Management Lakehead University How to Interpolate Surface Turn on the Spatial Analyst extension: Tools > Extensions >
Live (2.5D) DEM Editing Geomatica 2015 Tutorial
 DEM Editing Geomatica 2015 Tutorial") Live (2.5D) DEM Editing Geomatica 2015 Tutorial The DEM Editing tool is a quick and easy tool created to smooth out irregularities and create a more accurate model, and in turn, generate more accurate
Live (2.5D) DEM Editing Geomatica 2015 Tutorial The DEM Editing tool is a quick and easy tool created to smooth out irregularities and create a more accurate model, and in turn, generate more accurate
Imagery and Raster Data in ArcGIS. Abhilash and Abhijit
 Imagery and Raster Data in ArcGIS Abhilash and Abhijit Agenda Imagery in ArcGIS Mosaic datasets Raster processing ArcGIS is a Comprehensive Imagery System Integrating All Types, Sources, and Sensor Models
Last class. A vertex (w x, w y, w z, w) - clipping is in the - windowing and viewport normalized view volume if: - scan conversion/ rasterization
 - clipping is in the - windowing and viewport normalized view volume if: - scan conversion/ rasterization") Lecture 6 Last class Last lecture (clip coordinates): A vertex (w x, w y, w z, w) - clipping is in the - windowing and viewport normalized view volume if: - scan conversion/ rasterization normalized view
Lecture 6 Last class Last lecture (clip coordinates): A vertex (w x, w y, w z, w) - clipping is in the - windowing and viewport normalized view volume if: - scan conversion/ rasterization normalized view
Geographical Information Systems Institute. Center for Geographic Analysis, Harvard University. LAB EXERCISE 1: Basic Mapping in ArcMap
 Harvard University Introduction to ArcMap Geographical Information Systems Institute Center for Geographic Analysis, Harvard University LAB EXERCISE 1: Basic Mapping in ArcMap Individual files (lab instructions,
George Mason University Department of Civil, Environmental and Infrastructure Engineering. Dr. Celso Ferreira
 George Mason University Department of Civil, Environmental and Infrastructure Engineering Dr. Celso Ferreira Exercise Topic: HEC GeoRAS Post-Processing Objectives: This tutorial is designed to walk you
QGIS LAB SERIES GST 103: Data Acquisition and Management Lab 5: Raster Data Structure
 QGIS LAB SERIES GST 103: Data Acquisition and Management Lab 5: Raster Data Structure Objective Work with the Raster Data Model Document Version: 2014-08-19 (Final) Author: Kurt Menke, GISP Copyright National
Introduction to the Image Analyst Extension. Mike Muller, Vinay Viswambharan
 Introduction to the Image Analyst Extension Mike Muller, Vinay Viswambharan What is the Image Analyst Extension? The Image Analyst Extension (IA) is an application extension which extends ArcGIS Pro with
Georeferencing Topo Sheets and Scanned Maps
 Georeferencing Topo Sheets and Scanned Maps QGIS Tutorials and Tips Author Ujaval Gandhi http://www.spatialthoughts.com This work is licensed under a Creative Commons Attribution 4.0 International License.
Initial Analysis of Natural and Anthropogenic Adjustments in the Lower Mississippi River since 1880
 Richard Knox CE 394K Fall 2011 Initial Analysis of Natural and Anthropogenic Adjustments in the Lower Mississippi River since 1880 Objective: The objective of this term project is to use ArcGIS to evaluate
You can download missing data from the course website, together with the codes R and python that we will run in this exercise.
 Exercise 4: Samples Characterization Aim: Sampling environmental conditions Principal Component Analysis of environmental conditions Hierarchical clustering of sampling spots Interpretation of the environmental
Tutorial 18: 3D and Spatial Analyst - Creating a TIN and Visual Analysis
 Tutorial 18: 3D and Spatial Analyst - Creating a TIN and Visual Analysis Module content 18.1. Creating a TIN 18.2. Spatial Analyst Viewsheds, Slopes, Hillshades and Density. 18.1 Creating a TIN Sometimes
Terrain Modeling with ArcView GIS from ArcUser magazine
 Lesson 6: DEM-Based Terrain Modeling Lesson Goal: Lean how to output a grid theme that can be used to generate a thematic two-dimensional map, compute an attractive hillshaded map, and create a contour
Pond Distance and Habitat for use in Wildlife Modeling
 Pond Distance and Habitat for use in Wildlife Modeling These instructions enable you to aggregate layers within a study area, calculate new fields, and create new data out of existing data, for use in
Conservation Applications of LiDAR. Terrain Analysis. Workshop Exercises
 Conservation Applications of LiDAR Terrain Analysis Workshop Exercises 2012 These exercises are part of the Conservation Applications of LiDAR project a series of hands on workshops designed to help Minnesota
Feature Analyst Quick Start Guide
 Feature Analyst Quick Start Guide Change Detection Change Detection allows you to identify changes in images over time. By automating the process, it speeds up a acquisition of data from image archives.
Exercise 1-1: Using GPS track data to create a field boundary
 Exercise 1-1: Using GPS track data to create a field boundary Learning objectives: Add QGIS plugins Create a point vector file from a text file Convert GPS tracking points to a field boundary Data folder:
Using rasters for interpolation and visualization in GMS
 v. 10.3 GMS 10.3 Tutorial Using rasters for interpolation and visualization in GMS Objectives This tutorial teaches how GMS uses rasters to support all kinds of digital elevation models and how rasters
Stream network delineation and scaling issues with high resolution data
 Stream network delineation and scaling issues with high resolution data Roman DiBiase, Arizona State University, May 1, 2008 Abstract: In this tutorial, we will go through the process of extracting a stream
LAB #7 Creating TIN and 3D scenes (ArcScene) GISC, UNIVERSITY OF CALIFORNIA BERKELEY
 GISC, UNIVERSITY OF CALIFORNIA BERKELEY") LAB #7 Creating TIN and 3D scenes (ArcScene) GISC, UNIVERSITY OF CALIFORNIA BERKELEY The purpose of this laboratory is to introduce and explore surface data analysis using a vector data model: TIN. We
LAB #7 Creating TIN and 3D scenes (ArcScene) GISC, UNIVERSITY OF CALIFORNIA BERKELEY The purpose of this laboratory is to introduce and explore surface data analysis using a vector data model: TIN. We
George Mason University Department of Civil, Environmental and Infrastructure Engineering
 George Mason University Department of Civil, Environmental and Infrastructure Engineering Dr. Celso Ferreira Prepared by Lora Baumgartner December 2015 Revised by Brian Ross July 2016 Exercise Topic: GIS
Lecture 22 - Chapter 8 (Raster Analysis, part 3)
") GEOL 452/552 - GIS for Geoscientists I Lecture 22 - Chapter 8 (Raster Analysis, part 3) Today: Zonal Analysis (statistics) for polygons, lines, points, interpolation (IDW), Effects Toolbar, analysis masks
GEOL 452/552 - GIS for Geoscientists I Lecture 22 - Chapter 8 (Raster Analysis, part 3) Today: Zonal Analysis (statistics) for polygons, lines, points, interpolation (IDW), Effects Toolbar, analysis masks
What s New in Imagery in ArcGIS. Presented by: Christopher Patterson Date: September 12, 2017
 What s New in Imagery in ArcGIS Presented by: Christopher Patterson Date: September 12, 2017 Agenda Ortho Mapping Elevation extraction Drone2Map Raster Analytics ArcGIS is a Comprehensive Imagery System
Purpose: To explore the raster grid and vector map element concepts in GIS.
 GIS INTRODUCTION TO RASTER GRIDS AND VECTOR MAP ELEMENTS c:wou:nssi:vecrasex.wpd Purpose: To explore the raster grid and vector map element concepts in GIS. PART A. RASTER GRID NETWORKS Task A- Examine
Building 3D models with the horizons method
 ARC HYDRO GROUNDWATER TUTORIALS SUBSURFACE ANALYST Building 3D models with the horizons method Arc Hydro Groundwater (AHGW) is a geodatabase design for representing groundwater datasets within ArcGIS.
Preparation of contouring, hill shade and slope map of erode district by using QGIS
 ISSN:2348-2079 Volume-6 Issue-2 International Journal of Intellectual Advancements and Research in Engineering Computations Preparation of contouring, hill shade and slope map of erode district by using
Working with Imagery in ArcGIS. Christopher Patterson October 11, 2018
 Working with Imagery in ArcGIS Christopher Patterson October 11, 2018 Imagery What s New Overview Providing Advanced Processing, Analysis, and Management Desktop and Web Full-Motion Video Mensuration NDVI
Using Imagery for Intelligence Analysis
 2013 Esri International User Conference July 8 12, 2013 San Diego, California Technical Workshop Using Imagery for Intelligence Analysis Renee Bernstein Natalie Campos Esri UC2013. Technical Workshop.
Getting Started with Spatial Analyst. Steve Kopp Elizabeth Graham
 Getting Started with Spatial Analyst Steve Kopp Elizabeth Graham Spatial Analyst Overview Over 100 geoprocessing tools plus raster functions Raster and vector analysis Construct workflows with ModelBuilder,
Raster GIS applications
 Raster GIS applications Columns Rows Image: cell value = amount of reflection from surface DEM: cell value = elevation (also slope/aspect/hillshade/curvature) Thematic layer: cell value = category or measured
Exercise 1: Introduction to ILWIS with the Riskcity dataset
 Exercise 1: Introduction to ILWIS with the Riskcity dataset Expected time: 2.5 hour Data: data from subdirectory: CENN_DVD\ILWIS_ExerciseData\IntroRiskCity Objectives: After this exercise you will be able
Import, view, edit, convert, and digitize triangulated irregular networks
 v. 10.1 WMS 10.1 Tutorial Import, view, edit, convert, and digitize triangulated irregular networks Objectives Import survey data in an XYZ format. Digitize elevation points using contour imagery. Edit
Terms and definitions * keep definitions of processes and terms that may be useful for tests, assignments
 Lecture 1 Core of GIS Thematic layers Terms and definitions * keep definitions of processes and terms that may be useful for tests, assignments Lecture 2 What is GIS? Info: value added data Data to solve
EXERCISE 2: GETTING STARTED WITH FUSION
 Document Updated: May, 2010 Fusion v2.8 Introduction In this exercise, you ll be using the fully-prepared example data to explore the basics of FUSION. Prerequisites Successful completion of Exercise 1
GIS LAB 8. Raster Data Applications Watershed Delineation
 GIS LAB 8 Raster Data Applications Watershed Delineation This lab will require you to further your familiarity with raster data structures and the Spatial Analyst. The data for this lab are drawn from
GY461 GIS 1: Environmental Campus Topography Project with ArcGIS 9.x
 I. Introduction GY461 GIS 1: Environmental In this project you will use data from a topographic survey of the USA campus to generate 2 separate maps: 1. A color-coded 2-dimensional topographic contour