Advanced GIS Using GRASS to create SVF and LRM
|
|
|
- Rose Jenkins
- 6 years ago
- Views:
Transcription
1 Advanced GIS Using GRASS to create SVF and LRM Table of Contents Aims...2 Outcomes...2 How to use this booklet...2 Task 1 Creating a GRASS location from QGIS...3 Task 2 Changing the GRASS Region...8 Task 3 Import the Lidar raster data to GRASS...17 Task 4 Create a PCA model in GRASS...18 Task 4 Create a SVF model in GRASS...24 Task 5 Create an LRM in GRASS...35 Course Materials designed by Rebecca Bennett, July 2014 Please use freely for your own information and the instruction of others but recognise the rights of the author to be acknowledged if the material contained is disseminated. 1
2 Pre-requisites You should have completed all of the tasks in Lab 1 to be familiar with QGIS before beginning this workshop. You should also have read the technical papers introducing Local Relief Modelling (LRM) and the Sky View Factor (SVF). Aims The aim of this lab is familiarise yourself with advanced processing techniques fro lidar data using QGIS and GRASS GIS. set up a new project in GRASS (using the QGIS step by step guide) set the GRASS region (raster processing settings) create a SVF (horizon) model in GRASS create a local relief model in GRASS using custom commands export your work. Each of these tasks stand alone as useful GIS tools but together they provide a workflow for advanced processing of lidar. Outcomes At the end of the lab you will submit a printed map of your LRM and SVF in pdf form to demonstrate your completion of the technical exercises. How to use this booklet Illustrations in this booklet show the icons on screen for each task. The full menu options are notated as follows: File > Open. 2

3 Task 1 Creating a GRASS location from QGIS GRASS GIS is a very powerful opensource GIS software originally developed for the US Army. It features many high-level raster processing functions that do not exist in QGIS alone including the ability to create LRM and SVF models and scripting of processes. GRASS has a reputation for having a steep learning curve, but fortunately you can use QGIS as a front-end to smooth the transition between the software. 1. Go to Go to Plugins> Manage Python Plugins. Ensure that GRASS has a check beside it to display the GRASS Toolbar. 2. The first step is to create a GRASS Location, which is essentially a directory in which GRASS will store the raster and vector files you make for any project. The structure of this directory is very important and can be fiddly to get right in GRASS itself the QGIS plugin makes the process of establishing a location much easier and the location created can be used through the QGIS GRASS plug in or in GRASS alone. Click on the Create new mapset icon to open the window below: 3


4 3. Browse to a directory in which to store your data. When using for the first time you should create a directory called grassdata to keep all your GRASS locations in. Click next. 4. Select create a new location, give your location a name (with no spaces or special characters) and click next. 4
5 5


6 5. We will now set the CRS for the GRASS location. You will see that the plugin suggests recently used systems at the bottom of the window. Select the OSGB36 CRS (using the same ESPG ID as before). Click next. 6. Set the Region of interest. This part is particularly important as GRASS only performs its operations within the bounds of this region of interest. For simplicity here select the current QGIS extent. Click set and the North, South, East and West bounds will change. Click next. 6


7 7. Within the location create a mapset to work in. This could be the name of the processing e.g SVF. Click next. 8. The final screen confirms the location and mapset you have created. Click finish to return to the QGIS main screen. The mapset will now be open and the GRASS toolbar icons active. 7

8 Task 2 Changing the GRASS Region The Region settings in GRASS control all the raster processing areas and resolutions. Before we can undertake any processing with the lidar data we need to amend the region to match our data. 1. To do this we will import the Area vector file we created in workshop one into the GRASS mapset and set the region to match it. First open your area shapefile. 2. On the GRASS tool bar select the GRASS tools icon. 3. In the Modules Tree tab navigate to File management > Import into GRASS > Import Vector into Grass > Import Loaded Vector. Click to open the tool. 8


9 4. Select your vector file (created in task 2) from the drop down menu. Give the GRASS vector you will create a name (you may wish to prefix this with GRASS if you intend to use the same name as the original shapefile to denote that it is a GRASS vector e.g. GRASSarea). Click Run then View Output to add the GRASS vector to the navigation menu to the left of the QGIS screen. 5. You will see both the original and GRASS area vector in the QGIS view. Remember you can check the source of a file by hovering your mouse over its name in the navigation bar. The symbology of the GRASS vector can be edited in the same way as for QGIS vectors (See task 2). 9

10 6. 7. To set the region to match this vector select the GRASS tools Icon again and navigate to Region Settings > Set Region to match multiple vectors 8. Type in the name of your vector file. Click Run and close. 10

11 9. To make sure that the region is set, switch off both your area vector files in the layer manager and use the Display Current GRASS Region icon 10. A red line will now appear on your screen showing the extent of the current GRASS region. 11
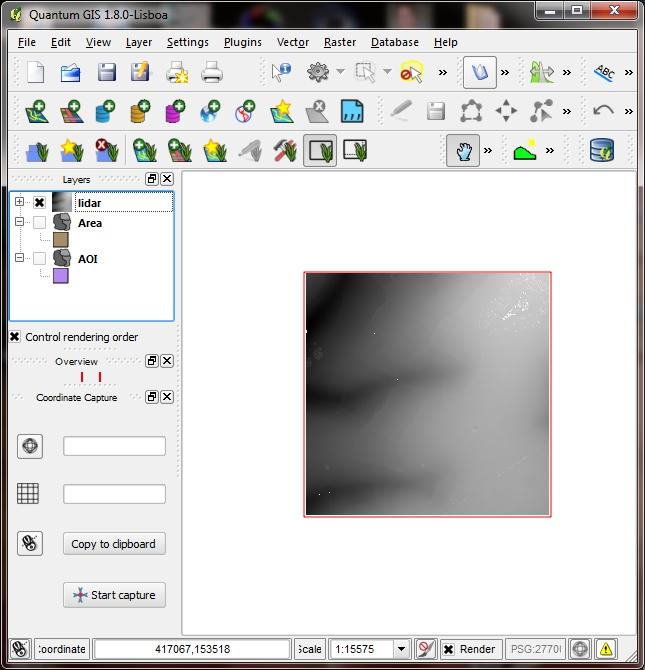
12 12


13 11. The QGIS /GRASS toolbar gives only a selection of the most common GRASS functions. You can access all the GRASS functions by using the GRASS shell to enter commands. We will now use the GRASS shell within QGIS to check the resolution of the region. From the GRASS Tools window, click to open the GRASS shell. 12. In the shell window type g.region (the GRASS command for the region settings). Hit return. A new window will open. 13
 are set to over 1m per pixel.")
14 13. To check your current settings switch to the Print tab and tick Print the Current region. Click Run. 14. The window will switch to the Command Output tab where the current region settings will be displayed. You will see that the resolution settings (nsres and ewres) are set to over 1m per pixel. As the data we will be using is of 0.5m resolution we need to change this setting. 14


15 15. In the Existing tab select your imported vector from the drop down menu. 16. In the Resolution tab enter the value 1 in the NS and EW grid resolution boxes. Click run. 15


16 17. The module will switch to the Command Output tab where the new resolution settings will be displayed. 18. Close the window and the shell window to return to QGIS. 16


17 Task 3 Import the Lidar dtm raster to GRASS 1. Open GRASS Tools 2. Navigate to File Management >Import raster into GRASS> Import Raster into GRASS from QGIS view> r.ingdal Import loaded raster. 3. Pick the lidar raster layer for import, give the GRASS output raster a name and check Override Projection. Click Run then View Output. 4. Your GRASS lidar raster will now be displayed in the QGIS window. Remove the non-grass lidar raster and area vector and save your project. Close QGIS 17
18 Task 4 Create a PCA model in GRASS Now we have set up our GRASS project we will switch from QGIS to GRASS to create a PCA model of the shaded relief models. 1. Open GRASS from the desktop 2. You will need to navigate to the Location and Mapset you created in QGIS during the previous task. When you have browsed to the directory grassdata select the location then the mapset. Then click Start GRASS 18
19 3. You may get a lock file warning. The lock file exists to prevent concurrent use of the same GRASS location by two different people, but when using the QGIS GRASS plugin the lock file is often not removed when QGIS is closed. It is safe to remove the lock file when you are the only person working on the location so click OK twice. 4. Grass will then open two windows as shown below. On the left is the Map Display where graphics are displayed, to the right is the GIS or Layer Manager where layers are added and modified and where the menus are found for each function. 5. First we will add a vector and a raster to the display. In the GIS Manager click on the Add Vector Icon in the same window and select the vector file representing the study area that you imported in Task 2 (Area). 6. Then click on the Add Raster icon and pick the lidar raster from the drop down menu. 19

20 Your screen should now look something like the image below. 7. Now we will create shaded relief models from the lidar data imported. Got to Raster > Terrain Analysis shaded relief. 20


21 8. In the Required tab pick your lidar raster from the drop down menu. 9. In the Optional tab enter the output file name, altitude, azimuth and z exaggeration. Use the visual comparisons from QGIS workshop 1 to select the best parameters. Click Run. 10. Without closing the window create 7 more shaded relief models at 45 intervals, keeping the same altitude and z exaggeration. 21


22 11. Now we will perform a PCA analysis on the 8 shaded relief models. Go to Imagery > Transform > Principal Components 12. Add all 8 of your shaded relief files to the Input field. Give your output rasters a prefix. Click run. 13. Notice that the tool makes as many PCA images as original shaded relief images. Add your first PCA to the map display using the add raster icon, then add the others. Take a few minutes to compare the features visible in the different PCA images. 14. We will now export the PCA map as a geotiff to view in any GIS software. Go to File > Export Raster 22
23 Map > Common export formats [r.out.gdal]. In the Required tab pick the first PCA file and browse to your directory to save the geotiff. 23

24 Task 4 Create a SVF model in GRASS Now we have set up our GRASS project we will switch from QGIS to GRASS to create a SVF model. 1. Open GRASS from the desktop 2. You will need to navigate to the Location and Mapset you created in QGIS during the previous task. When you have browsed to the directory grassdata select the location then the mapset. Then click Start GRASS 24


25 3. You may get a lock file warning. The lock file exists to prevent concurrent use of the same GRASS location by two different people, but when using the QGIS GRASS plugin the lock file is often not removed when QGIS is closed. It is safe to remove the lock file when you are the only person working on the location so click OK twice. 4. Grass will then open two windows as shown below. On the left is the Map Display where graphics are displayed, to the right is the GIS or Layer Manager where layers are added and modified and where the menus are found for each function. 5. First we will add a vector and a raster to the display. In the GIS Manager click on the Add Vector Icon in the same window and select the vector file representing the study area that you imported in Task 2 (Area). 6. Then click on the Add Raster icon and pick the lidar raster from the drop down menu. 25

26 Your screen should now look something like the image below. 7. We will now use the r.horizon tool to create a SVF. To open the module navigate to Raster > Terrain Analysis > Horizon Angle [r.horizon]. 26

27 8. The r.horizon tool works in two modes, as explained in the header to the tool. To create an SVF model we use the second mode. In the Required tab pick your lidar raster as the input. 9. We will compute 8 models at 45 intervals starting at 0. The step size will be 30 to match the published work. Enter the parameters on the Input_options tab as show below. 27

28 10. In the Output_options tab enter the prefix of the output maps and click run. 11. The tool will switch to the Command output tab to show you the progress of the processing. Depending on the speed of your processor this may take some time. Note the command input is displayed at the base of the tool GUI. You can use this on its own to create the models from the Layer Manager window. 28


29 12. When the process is complete we will have created 8 rasters of incident light that we need to average into an SVF model. To do this we will use the r.mapcalc tool. Go to Raster > Raster Map Calculator [r.mapcalc] 13. Enter the name of the output raster. Remember to include the processing options in the file name as we did with the hillshade models. Add the expression in the Expression window using the Insert existing raster map drop down to add your SFV rasters. There should be no spaces between the raster names and the operand (+). 29


30 14. We can change the display of the raster to greyscale. Right-click on the raster in the layer menu and select Set Color Table 15. On the colours tab select histogram equalisation and pick a grey colour table. Click Run to view the result 30
![16. We will now export the SVF map as a geotif to view in QGIS. Go to File > Export Raster Map > Common export formats [r.out.gdal].](/docs-images/72/66677625/images/31-0.jpg "In the Required tab pick the SVF file and browse to your directory to save the geotiff. 17.")
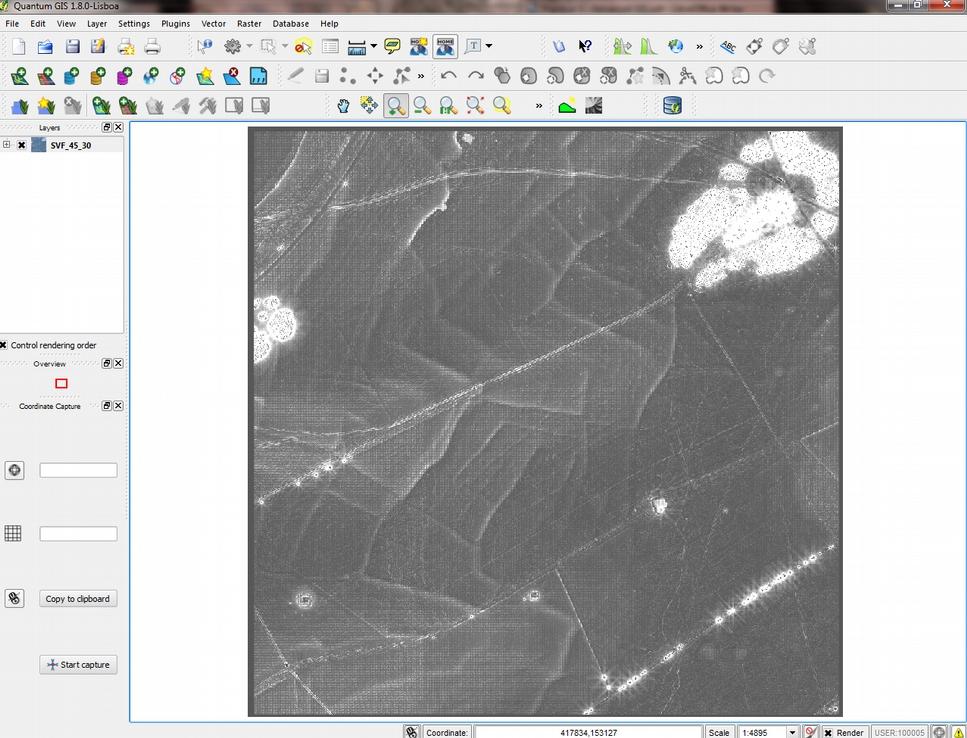
31 16. We will now export the SVF map as a geotif to view in QGIS. Go to File > Export Raster Map > Common export formats [r.out.gdal]. In the Required tab pick the SVF file and browse to your directory to save the geotiff. 17. In the Options tab you will see that there are lots of output formats. Select Gttiff. 31

32 18. Open QGIS and add the SVF geotiff. 32
33 33


34 Task 5 Create an LRM in GRASS We can also use GRASS to create a local relief model. This process has many steps, including raster and vector processing be sure to work through each carefully and in order. Preparation 1. First we will connect to a database to store our vector files. In the Layer Manager go to Database > Manage Databases > Connect 2. Select sqlite as the database format and name your database, (don't forget the.db at the end!). Click Run then Close. 34
35 3. Now we will check our region settings. Go to Settings > Region > Display Region. The layer manager will switch to the command window and display the region parameters. Check the extent and resolution. 35


36 Create the LRM 1. First make a copy of the lidar DSM to work with. We can use the command console to access any tools' GUI so in the console type g.copy and hit return twice. Click Run. 2. In the g.copy window type the name of your lidar DSM followed by a comma then the new name ground e.g. lidar,ground 3. Now we will perform the low pass filter. Go to to your command console and type r.mfilter. Hit return twice. 4. Select ground as your input map, name your output map LRM_lowpass. Grass uses a text file to undertake the filter (see the detail format specification here: ). Navigate to the filter files folder on 36


37 the z drive and select the 9m filter. Click Run. The lowpass filtered raster will be shown in the display. 5. Now we will take the lowpass filter from the ground raster. Go to Raster > Raster Map Calculator Name your new map LP_subtract and add the expression ground@lidar LRMlowpass@lidar. Click run, 37


38 6. Extract the zero contours from the LP_subtract raster. Go to Raster > Generate contour lines. In the Required tab add LP_subtract as the input raster and name your output vector LP_contours. 7. In the optional tab set your min and max levels to 0 and your step size to 10. Click Run. 8. Now convert your contour lines into points. Go to Vector > Generate points > Generate points along lines. Add LP_contours and name your output LP_contours_points 38

39 9. In the Optional tab de select point, boundary and centroid to leave only line. Set a maximum distance of 10. Click run. This process may take a few minutes be patient! 10. Now we will add a column to the point data in the database in order to store a height value extracted from the ground raster. Go to Database > Vector database connections > Add columns In the Required tab, pick your point map LP_contours_points Add a column called height with a type double. 39

40 11. In the Options tab select layer 2. Click Run. 12. Now we will extract the raster values to the points vector. Go to Vector > Update point attributes from raster > sample raster at point locations. In the required tab add the LP_contours_points as your input, ground as the raster to be queried and column as height. 13. In the optional tab select layer 2. Click Run. 14. Now we have to interpolate a model that is purged of the archaeology. This can take some time depending on the size of your data and speed of your processor, so be patient! Go to Raster > Interpolate raster from vector points > bilinear and bicubic from vector points In the Required tab add the LP_contours_points vector In the Settings tab select layer 2 and the height column. In the Optional tab add the name of your output raster: LP_purged Click Run. Go make some tea. 40

41 15. When the LP_purged raster is finished processing, we can make the LRM by subtracting the LP_purged raster from the ground raster using r.mapcalc. 16. Change the colour table of the LRM to greyscale and export the LRM to a geotiff to view in QGIS. 41
Using the RVT and LiVT Toolboxes (beta) a quick guide
 a quick guide") Using the RVT and LiVT Toolboxes (beta) a quick guide Table of Contents Aims...2 Using RVT...2 Task 1 Exporting your data to.tif...2 Task 2 Using RVT...4 Task 3 Viewing the model...7 Using LiVT...8 Task
Using the RVT and LiVT Toolboxes (beta) a quick guide Table of Contents Aims...2 Using RVT...2 Task 1 Exporting your data to.tif...2 Task 2 Using RVT...4 Task 3 Viewing the model...7 Using LiVT...8 Task
Low Cost and Free Public Health Mapping Tools
 Low Cost and Free Public Health Mapping Tools Quantum GIS - QGIS 1) Download and Install a) QGIS can be quickly and easily installed on Windows, Macs and Linux from installers found here: http://hub.qgis.org/projects/quantum-gis/wiki/download
+ Make it from the satellite images in sale, (Easier & Faster, but not always available) (It does cost much. An astronomical number!
 (It does cost much. An astronomical number!") BaseMap: + Look for it among the existent digital maps, (Easiest & Fastest because no processing required) (Therefore, the most desirable, but not always available) (It can cost much) + Make it from the
BaseMap: + Look for it among the existent digital maps, (Easiest & Fastest because no processing required) (Therefore, the most desirable, but not always available) (It can cost much) + Make it from the
Introduction. Contour Lines Generation
 Introduction Over the years the e-foto project has been developed and the need for integration with other Geographic Information Systems software became more evident. From this need several improvements
Lab 12: Sampling and Interpolation
 Lab 12: Sampling and Interpolation What You ll Learn: -Systematic and random sampling -Majority filtering -Stratified sampling -A few basic interpolation methods Data for the exercise are in the L12 subdirectory.
START>PROGRAMS>ARCGIS>
 Department of Urban Studies and Planning Spring 2006 Department of Architecture Site and Urban Systems Planning 11.304J / 4.255J GIS EXERCISE 2 Objectives: To generate the following maps using ArcGIS Software:
Terrain Analysis. Using QGIS and SAGA
 Terrain Analysis Using QGIS and SAGA Tutorial ID: IGET_RS_010 This tutorial has been developed by BVIEER as part of the IGET web portal intended to provide easy access to geospatial education. This tutorial
A Practical Guide to Using QGIS
 A Practical Guide to Using QGIS 1.1 INTRODUCTION Quantum GIS (QGIS) is a useful mapping software that enables the compilation and displaying of spatial data in the form of a map. Gaining experience in
I CALCULATIONS WITHIN AN ATTRIBUTE TABLE
 Geology & Geophysics REU GPS/GIS 1-day workshop handout #4: Working with data in ArcGIS You will create a raster DEM by interpolating contour data, create a shaded relief image, and pull data out of the
University of California, Los Angeles Department of Statistics
 Statistics C173/C273 University of California, Los Angeles Department of Statistics Instructor: Nicolas Christou Introduction to Geographical Resources Analysis Support System (GRASS) General information:
Final project: Lecture 21 - Chapter 8 (Raster Analysis, part2) GEOL 452/552 - GIS for Geoscientists I
 GEOL 452/552 - GIS for Geoscientists I") GEOL 452/552 - GIS for Geoscientists I Lecture 21 - Chapter 8 (Raster Analysis, part2) Talk about class project (copy follow_along_data\ch8a_class_ex into U:\ArcGIS\ if needed) Catch up with lecture 20
GEOL 452/552 - GIS for Geoscientists I Lecture 21 - Chapter 8 (Raster Analysis, part2) Talk about class project (copy follow_along_data\ch8a_class_ex into U:\ArcGIS\ if needed) Catch up with lecture 20
A Second Look at DEM s
 A Second Look at DEM s Overview Detailed topographic data is available for the U.S. from several sources and in several formats. Perhaps the most readily available and easy to use is the National Elevation
Introduction to using QGIS for Archaeology and History Workshop by the Empirical Reasoning Center
 Introduction to using QGIS for Archaeology and History Workshop by the Empirical Reasoning Center In this workshop, we will cover the basics of working with spatial data, as well as its main uses for archaeology.
GY301 Geomorphology Lab 5 Topographic Map: Final GIS Map Construction
 GY301 Geomorphology Lab 5 Topographic Map: Final GIS Map Construction Introduction This document describes how to take the data collected with the total station for the campus topographic map project and
All data is in Universal Transverse Mercator (UTM) Zone 6 projection, and WGS 84 datum.
 Zone 6 projection, and WGS 84 datum.") 111 Mulford Hall, College of Natural Resources, UC Berkeley (510) 643-4539 EXPLORING MOOREA DATA WITH QUANTUM GIS In this exercise, you will be using an open-source FREE GIS software, called Quantum GIS,
111 Mulford Hall, College of Natural Resources, UC Berkeley (510) 643-4539 EXPLORING MOOREA DATA WITH QUANTUM GIS In this exercise, you will be using an open-source FREE GIS software, called Quantum GIS,
Digital Elevation Model & Surface Analysis
 Topics: Digital Elevation Model & Surface Analysis 1. Introduction 2. Create raster DEM 3. Examine Lidar DEM 4. Deriving secondary surface products 5. Mapping contours 6. Viewshed Analysis 7. Extract elevation
Lab 10: Raster Analyses
 Lab 10: Raster Analyses What You ll Learn: Spatial analysis and modeling with raster data. You will estimate the access costs for all points on a landscape, based on slope and distance to roads. You ll
Lecture 21 - Chapter 8 (Raster Analysis, part2)
") GEOL 452/552 - GIS for Geoscientists I Lecture 21 - Chapter 8 (Raster Analysis, part2) Today: Digital Elevation Models (DEMs), Topographic functions (surface analysis): slope, aspect hillshade, viewshed,
GEOL 452/552 - GIS for Geoscientists I Lecture 21 - Chapter 8 (Raster Analysis, part2) Today: Digital Elevation Models (DEMs), Topographic functions (surface analysis): slope, aspect hillshade, viewshed,
Working with Elevation Data URPL 969 Applied GIS Workshop: Rethinking New Orleans After Hurricane Katrina Spring 2006
 Working with Elevation Data URPL 969 Applied GIS Workshop: Rethinking New Orleans After Hurricane Katrina Spring 2006 This GIS lab exercise will explore Light Detection And Ranging (LiDAR) data for New
Tutorial 18: 3D and Spatial Analyst - Creating a TIN and Visual Analysis
 Tutorial 18: 3D and Spatial Analyst - Creating a TIN and Visual Analysis Module content 18.1. Creating a TIN 18.2. Spatial Analyst Viewsheds, Slopes, Hillshades and Density. 18.1 Creating a TIN Sometimes
Introduction to SAGA GIS
 GIS Tutorial ID: IGET_RS_001 This tutorial has been developed by BVIEER as part of the IGET web portal intended to provide easy access to geospatial education. This tutorial is released under the Creative
NEW SKILLS Begin to learn how to add data in QGIS. Exploration of some of the vector and raster analysis capabilities of QGIS
 Lab 3 VECTOR AND RASTER MODELING Last modified 7 May 2014 NEW SKILLS Begin to learn how to add data in QGIS. Exploration of some of the vector and raster analysis capabilities of QGIS 1. In this exercise
Lab 11: Terrain Analysis
 Lab 11: Terrain Analysis What You ll Learn: Basic terrain analysis functions, including watershed, viewshed, and profile processing. You should read chapter 11 in the GIS Fundamentals textbook before performing
Lab 10: Raster Analyses
 Lab 10: Raster Analyses What You ll Learn: Spatial analysis and modeling with raster data. You will estimate the access costs for all points on a landscape, based on slope and distance to roads. You ll
GEO 465/565 - Lab 7 Working with GTOPO30 Data in ArcGIS 9
 GEO 465/565 - Lab 7 Working with GTOPO30 Data in ArcGIS 9 This lab explains how work with a Global 30-Arc-Second (GTOPO30) digital elevation model (DEM) from the U.S. Geological Survey. This dataset can
Introduction to Grass GIS. Chandan M C IIT-KGP
 Introduction to Grass GIS Chandan M C IIT-KGP Create a new folder in your local drive (for ex: D or E drive) and rename it as Grass. Do not add any folders inside this. Install Grass latest version. 2
Orchard Link Mapping Workshop (QGIS Training) Contact
 Contact") Orchard Link Mapping Workshop (QGIS Training) Contact email: info@neetmaps.co.uk for technical support, bespoke mapping or further information or visit www.neetmaps.co.uk 1 2 1: Introduction to QGIS What
Orchard Link Mapping Workshop (QGIS Training) Contact email: info@neetmaps.co.uk for technical support, bespoke mapping or further information or visit www.neetmaps.co.uk 1 2 1: Introduction to QGIS What
Lab 11: Terrain Analyses
 Lab 11: Terrain Analyses What You ll Learn: Basic terrain analysis functions, including watershed, viewshed, and profile processing. There is a mix of old and new functions used in this lab. We ll explain
GST 105: Introduction to Remote Sensing Lab 5: Unsupervised Classification
 GST 105: Introduction to Remote Sensing Lab 5: Unsupervised Classification Objective Perform an unsupervised classification Document Version: 2014-07-15 (Beta) Author: Richard : Smith, Ph.D. Texas A&M
GIS OPERATION MANUAL
 GIS OPERATION MANUAL 1. Computer System Description Hardware Make Compaq Presario 5004 CPU AMD Athlon 1.1 Ghz Main Memory 640MB CD-ROM 52 X CD-RW 8 X HD 57GB Monitor 19 inch Video Adapter 16 Mb Nvidia
Server Usage & Third-Party Viewers
 Server Usage & Third-Party Viewers October 2016 HiPER LOOK Version 1.4.16.0 Copyright 2015 PIXIA Corp. All Rights Reserved. Table of Contents HiPER LOOK Server Introduction... 2 Google Earth... 2 Installation...2
OS OpenData masterclass 2013 Cartographic Design workshop
 OS OpenData masterclass 2013 Cartographic Design workshop 1 Quantum GIS Quantum GIS (QGIS) is a user-friendly Open Source Geographic Information System (GIS,) licensed under the GNU General Public License.
Importing GPS points and Hyperlinking images.
 Geol 3050 GIS for Geologists Exercise 15 Exercise 15 Making a Virtual Fieldtrip: Importing GPS points and Hyperlinking images. Due: Thursday, March 22. Goal: A) Get familiar with importing GPS points and
CONTENTS 1 INTRODUCTION 3 ARCGIS 5 START ARCMAP 11 IMPORT 1: MAP DATA 12 ADD WIND FARM DATA 21 CREATE A MAP TO INSERT IN A REPORT 32
 CONTENTS CONTENTS 1 INTRODUCTION 3 SCENARIO 3 WHAT WILL I LEARN? 3 WHAT DATA DO I HAVE? 4 ARCGIS 5 ARCMAP 6 ARCCATALOG 8 ARCTOOLBOX 9 START ARCMAP 11 IMPORT 1:250000 MAP DATA 12 CREATE A GROUP LAYER 16
HEC-RAS 5.0 Training New Zealand Workshop Guide
 HEC-RAS 5.0 Training New Zealand Workshop Guide Prepared by: Krey Price Surface Water Solutions 57 Bromfield Drive Kelmscott WA 6111 Australia Tel. +61 400 367 542 e-mail: info@surfacewater.biz website:
Introduction to GIS 2011
 Introduction to GIS 2011 Digital Elevation Models CREATING A TIN SURFACE FROM CONTOUR LINES 1. Start ArcCatalog from either Desktop or Start Menu. 2. In ArcCatalog, create a new folder dem under your c:\introgis_2011
Exercise 1: Introduction to ILWIS with the Riskcity dataset
 Exercise 1: Introduction to ILWIS with the Riskcity dataset Expected time: 2.5 hour Data: data from subdirectory: CENN_DVD\ILWIS_ExerciseData\IntroRiskCity Objectives: After this exercise you will be able
Lab 1: Landuse and Hydrology, learning ArcGIS
 Lab 1: Landuse and Hydrology, learning ArcGIS The following lab exercises are designed to give you experience using ArcMap in order to visualize and analyze datasets that are relevant to important geomorphological/
CHAPTER 5 DIGITAL ELEVATION MODEL AND 3D VISUALIZATION
 CHAPTER 5 DIGITAL ELEVATION MODEL AND 3D VISUALIZATION A digital elevation model (DEM) is a digital model or 3D representation of a terrain's surface. A DEM can be represented as a raster (a grid of squares,
Tricks and Tips of Creating a Layered, Geo-Enabled Adobe PDF Map
 Tricks and Tips of Creating a Layered, Geo-Enabled Adobe PDF Map John M. Bocan GIS Programmer/Analyst West Virginia Geological and Economic Survey (WVGES) Digital Mapping Techniques Williamsburg, VA. May
PISCES Installation and Getting Started 1
 This document will walk you through the PISCES setup process and get you started accessing the suite of available tools. It will begin with what options to choose during the actual installation and the
Table of Contents. 1. Prepare Data for Input. CVEN 2012 Intro Geomatics Final Project Help Using ArcGIS
 Table of Contents 1. Prepare Data for Input... 1 2. ArcMap Preliminaries... 2 3. Adding the Point Data... 2 4. Set Map Units... 3 5. Styling Point Data: Symbology... 4 6. Styling Point Data: Labels...
Working with demographic grids in QGIS
 Working with demographic grids in QGIS Anna Dmowska dmowska@amu.edu.pl April 2017 1. Introduction SocScape (Social Landscape) is a research project which provides open access to high resolution (30 m)
3.1 Conceptual Modeling
 Quick Start Tutorials 35 3.1 Conceptual Modeling Conceptual Modeling Tutorial The following example is a quick walk through of the basics of building a conceptual model and converting this to a numerical
Using rasters for interpolation and visualization in GMS
 v. 10.3 GMS 10.3 Tutorial Using rasters for interpolation and visualization in GMS Objectives This tutorial teaches how GMS uses rasters to support all kinds of digital elevation models and how rasters
Objectives Learn how GMS uses rasters to support all kinds of digital elevation models and how rasters can be used for interpolation in GMS.
 v. 9.1 GMS 9.1 Tutorial Using rasters for interpolation and visualization in GMS Objectives Learn how GMS uses rasters to support all kinds of digital elevation models and how rasters can be used for interpolation
Files Used in this Tutorial
 Generate Point Clouds and DSM Tutorial This tutorial shows how to generate point clouds and a digital surface model (DSM) from IKONOS satellite stereo imagery. You will view the resulting point clouds
Introduction to QGIS
 Introduction to QGIS David Kramar, Ph.D. Minnesota State University Moorhead Department of Anthropology and Earth Science http://www.qgis.org/en/site/ Overview of Workshop What is QGIS? How do I get QGIS
Basic Tasks in ArcGIS 10.3.x
 Basic Tasks in ArcGIS 10.3.x This guide provides instructions for performing a few basic tasks in ArcGIS 10.3.1, such as adding data to a map document, viewing and changing coordinate system information,
Norwegian Polar Institute, February 2018 Project website: quantarctica.npolar.no
 Get started with Quantarctica 3 Norwegian Polar Institute, February 2018 Project website: quantarctica.npolar.no Quantarctica is the result of an initiative by the Norwegian Polar Institute (NPI) to develop
Module: Rasters. 8.1 Lesson: Working with Raster Data Follow along: Loading Raster Data CHAPTER 8
 CHAPTER 8 Module: Rasters We ve used rasters for digitizing before, but raster data can also be used directly. In this module, you ll see how it s done in QGIS. 8.1 Lesson: Working with Raster Data Raster
Client Care Desktop V4
 Client Care Desktop V4 V4.1 Quay Document Manager V4.1 Contents 1. LOCATIONS...3 1.1. Client... 3 1.2. Holdings... 4 1.3. Providers... 4 1.4. Contacts/Introducers... 5 1.5. Adviser... 5 2. ADDING EXISTING
Field-Scale Watershed Analysis
 Conservation Applications of LiDAR Field-Scale Watershed Analysis A Supplemental Exercise for the Hydrologic Applications Module Andy Jenks, University of Minnesota Department of Forest Resources 2013
Building Vector Layers
 Building Vector Layers in QGIS Introduction: Spatially referenced data can be separated into two categories, raster and vector data. This week, we focus on the building of vector features. Vector shapefiles
Uploading Files to CMS
 Uploading Files to CMS Li Gardiner Room 1111 East Building 212-772- 4855 DesignSS@hunter.cuny.edu 1 Uploading a file (such as a PDF or an image) to your CMS Web site for the first time Log into the Hunter
How to plot a species distribution on a simple map of New Zealand from an Excel file
 How to plot a species distribution on a simple map of New Zealand from an Excel file This is a very simple step by step guide created by a beginner using QGIS for a beginner using QGIS. It will help you
Download the Latest LTR QGIS version (2.18) from the QGIS website: download.qgis.org/ >> Settings > Options > Locale
 from the QGIS website: download.qgis.org/ >> Settings > Options > Locale") Exercise 1: Introduction to QGIS Aim: To understand the basis of GIS To learn the basics of a GIS software (QGIS) INTRODUCTION Software Access Download the Latest LTR QGIS version (2.18) from the QGIS
Exercise 1: Introduction to QGIS Aim: To understand the basis of GIS To learn the basics of a GIS software (QGIS) INTRODUCTION Software Access Download the Latest LTR QGIS version (2.18) from the QGIS
Stream network delineation and scaling issues with high resolution data
 Stream network delineation and scaling issues with high resolution data Roman DiBiase, Arizona State University, May 1, 2008 Abstract: In this tutorial, we will go through the process of extracting a stream
GIS LAB 8. Raster Data Applications Watershed Delineation
 GIS LAB 8 Raster Data Applications Watershed Delineation This lab will require you to further your familiarity with raster data structures and the Spatial Analyst. The data for this lab are drawn from
GRASS GIS - Introduction
 GRASS GIS - Introduction What is a GIS A system for managing geographic data. Information about the shapes of objects. Information about attributes of those objects. Spatial variation of measurements across
Introduction to GIS & Mapping: ArcGIS Desktop
 Introduction to GIS & Mapping: ArcGIS Desktop Your task in this exercise is to determine the best place to build a mixed use facility in Hudson County, NJ. In order to revitalize the community and take
Client Care Desktop v4.3. Document Manager V4.3
 Client Care Desktop v4.3 Document Manager V4.3 Contents 1. LOCATIONS... 3 1.1. Client... 3 1.2. Enquiries... 4 1.3. Holdings... 4 1.4. Providers... 5 1.5. Contacts/Introducers... 6 1.6. Adviser... 6 2.
Tutorial: Conceptual Modeling Tutorial. Integrated Conceptual & Numerical Groundwater Modeling Software by Waterloo Hydrogeologic
 Tutorial: Visual MODFLOW Flex 5.1 Integrated Conceptual & Numerical Groundwater Modeling Software 1 1 Visual MODFLOW Flex 5.1 The following example is a quick walk-through of the basics of building a conceptual
EDINA Workshop: Creating a Campus Map and Displaying it in OpenLayers
 Contents Introduction... 2 What steps are involved?... 3 Before you start... 4 Create your campus map... 5 1. Load the basemap data into ArcMap... 5 2. Set up Symbology and Labels of Layers... 6 Improve
ECMWF New Users Metview Tutorial
 ECMWF New Users Metview Tutorial Author: Date: URL: Iain Russell 06-Mar-2014 08:43 https://software.ecmwf.int/wiki/display/metv/ecmwf+new+users+metview+tutorial 1 of 12 Table of Contents 1 Preparation
Background on Kingdom Suite for the Imperial Barrel Competition 3D Horizon/Fault Interpretation Parts 1 & 2 - Fault Interpretation and Correlation
 Background on Kingdom Suite for the Imperial Barrel Competition 3D Horizon/Fault Interpretation Parts 1 & 2 - Fault Interpretation and Correlation Wilson (2010) 1 Fault/Horizon Interpretation Using Seismic
INTRODUCTION TO GIS WORKSHOP EXERCISE
 111 Mulford Hall, College of Natural Resources, UC Berkeley (510) 643-4539 INTRODUCTION TO GIS WORKSHOP EXERCISE This exercise is a survey of some GIS and spatial analysis tools for ecological and natural
Practical guidance on mapping and visualisation of crime and social data in QGIS
 Practical guidance on mapping and visualisation of crime and social data in QGIS Lesson 4: Mapping of aggregated crime data in QGIS This work is licensed under a Creative Commons Attribution-NonCommercial-ShareAlike
Basics of Using LiDAR Data
 Conservation Applications of LiDAR Basics of Using LiDAR Data Exercise #2: Raster Processing 2013 Joel Nelson, University of Minnesota Department of Soil, Water, and Climate This exercise was developed
Job Aid. Remote Access BAIRS Printing and Saving a Report. Table of Contents
 Remote Access BAIRS Printing and Saving a Report Table of Contents Remote Access BAIRS Printing a Report PDF HTML... 2 Remote Access BAIRS Printing a Report Export to PDF Interactive Reporting... 3 Remote
Combine Yield Data From Combine to Contour Map Ag Leader
 Combine Yield Data From Combine to Contour Map Ag Leader Exporting the Yield Data Using SMS Program 1. Data format On Hard Drive. 2. Start program SMS Basic. a. In the File menu choose Open. b. Click on
GRASS. Geographic Resources Analysis Support System Current versions. Related software
 GRASS Geographic Resources Analysis Support System http://grass.osgeo.org Current versions 6.3 stable (old) 6.4 next stable (new) 7 development (future) Related software QGIS http://qgis.org GRASS Capabilities
Natural Light in Design: IAP 2009
 ECOTECT TUTORIAL --Si Siân Kleindienst-- 1 Getting Started 1.1 -- Entering the License The first time you start Ecotect, it will present you with this screen: You should begin by clicking on activate license
_Tutorials. Arcmap. Linking additional files outside from Geodata
 _Tutorials Arcmap Linking additional files outside from Geodata 2017 Sourcing the Data (Option 1): Extracting Data from Auckland Council GIS P1 First you want to get onto the Auckland Council GIS website
CHAPTER 2 GEOREFERENCING AND SHAPEFILE CREATION
 CHAPTER 2 GEOREFERENCING AND SHAPEFILE CREATION Georeferencing is the process of assigning real-world coordinates to each pixel of the raster. These coordinates are obtained by doing field surveys - collecting
Creating USNG Mapbooks
 Creating USNG Mapbooks This is a basic guide for creating a map book based on the U.S. National Grid (USNG), using Data Driven Pages in ArcMap. Data Driven Pages is a feature of ArcMap that was added at
Geographical Information Systems Institute. Center for Geographic Analysis, Harvard University. LAB EXERCISE 1: Basic Mapping in ArcMap
 Harvard University Introduction to ArcMap Geographical Information Systems Institute Center for Geographic Analysis, Harvard University LAB EXERCISE 1: Basic Mapping in ArcMap Individual files (lab instructions,
Getting Started with GIS using ArcGIS 10.6 What is GIS? and - Module 1 Creating a map document
 Getting Started with GIS using ArcGIS 10.6 What is GIS? and - Module 1 Creating a map document Marcel Fortin Map & Data Library mdl@library.utoronto.ca 2018 http://mdl.library.utoronto.ca This workshop
QGIS LAB SERIES GST 102: Spatial Analysis Lab 7: Raster Data Analysis - Density Surfaces
 QGIS LAB SERIES GST 102: Spatial Analysis Lab 7: Raster Data Analysis - Density Surfaces Objective Learn Density Analysis Methods Document Version: 2014-07-11 (Beta) Contents Introduction...2 Objective:
Explore some of the new functionality in ArcMap 10
 Explore some of the new functionality in ArcMap 10 Scenario In this exercise, imagine you are a GIS analyst working for Old Dominion University. Construction will begin shortly on renovation of the new
The following guidance document can be used to ensure the correct tools are available and configured to run the GRASP AF and/or COPD audits.
 The following guidance document can be used to ensure the correct tools are available and configured to run the GRASP AF and/or COPD audits. SystmOne version Checklist There are a number of things that
Workshop #1: Set Up Project File and RAS Mapper
 Workshop #1: Set Up Project File and RAS Mapper 1 In this workshop, you will: Install and open HEC-RAS 5.0.3 Create a project file Obtain terrain and projection data Import terrain data into RAS Mapper
HEC-RAS 2D Flood Modelling Tutorial
 HEC-RAS 2D Flood Modelling Tutorial Civil Site Design and HECRAS 2D Flood Modelling HECRAS version 5 and later includes functionality to analyse water flows moving across a surface. this is known as 2D
Print Station. Point-and-Click Printing WHITE PAPER
 Print Station Point-and-Click Printing WHITE PAPER Contents Overview 3 Printing with Print Station 4 Easy-to-use Browser Interface 4 Familiar Folder Navigation 5 Search Functionality 6 Informative Display
Lab 11: Terrain Analyses
 Lab 11: Terrain Analyses What You ll Learn: Basic terrain analysis functions, including watershed, viewshed, and profile processing. There is a mix of old and new functions used in this lab. We ll explain
Tutorial (Intermediate level): Dense Cloud Classification and DTM generation with Agisoft PhotoScan Pro 1.1
: Dense Cloud Classification and DTM generation with Agisoft PhotoScan Pro 1.1") Tutorial (Intermediate level): Dense Cloud Classification and DTM generation with Agisoft PhotoScan Pro 1.1 This tutorial illustrates how to perform dense point cloud classification in manual and automatic
Tutorial (Intermediate level): Dense Cloud Classification and DTM generation with Agisoft PhotoScan Pro 1.1 This tutorial illustrates how to perform dense point cloud classification in manual and automatic
Software Tutorial for the Installation of Quantum GIS 1.8
 Software Tutorial for the Installation of Quantum GIS 1.8 JOU1526 - COMPUTER-ASSISTED REPORTING Algonquin College Fall Semester 2013 Professor : David McKie GIS Assistant: Matt Pulleyblank 1 Installation
Lidar WebGIS Application Guide
 Lidar WebGIS Application Guide How to use the application Welcome to the LiDAR WebGIS application guide. This guide will provide you with all the information you will need to use the application as well
Basic Mapping: Livelihood Zones In Haiti
 Basic Mapping: Livelihood Zones In Haiti - 2009 Barbara Parmenter, revised by Carolyn Talmadge 9/10/2017 for ArcMap 10.5.1 DATA SOURCES... 1 MAPPING NETWORK DRIVES OUTSIDE THE DATA LAB... 2 SETTING UP
INTRODUCTION TO IDRISI
 INTRODUCTION TO IDRISI Introduction The aim of this practical is to familiarise yourself with the IDRISI GIS environment. IDRISI is primarily designed to process and analyse raster information (remember,
MAPLOGIC CORPORATION. GIS Software Solutions. Getting Started. With MapLogic Layout Manager
 MAPLOGIC CORPORATION GIS Software Solutions Getting Started With MapLogic Layout Manager Getting Started with MapLogic Layout Manager 2008 MapLogic Corporation All Rights Reserved 330 West Canton Ave.,
Google Earth II: Create a tour with Google Earth
 Google Earth II: Create a tour with Google Earth This workshop is a continuation of The Google Earth Workshop I: Map-making Basics. You will create a tour to show the main and satellite campuses of the
GGR 375 QGIS Tutorial
 GGR 375 QGIS Tutorial With text taken from: Sherman, Gary E. Shuffling Quantum GIS into the Open Source GIS Stack. Free and Open Source Software for Geospatial (FOSS4G) Conference. 2007. Available online
Lab 12: Sampling and Interpolation
 Lab 12: Sampling and Interpolation What You ll Learn: -Systematic and random sampling -Majority filtering -Stratified sampling -A few basic interpolation methods Videos that show how to copy/paste data
GeoEarthScope NoCAL San Andreas System LiDAR pre computed DEM tutorial
 GeoEarthScope NoCAL San Andreas System LiDAR pre computed DEM tutorial J Ramón Arrowsmith Chris Crosby School of Earth and Space Exploration Arizona State University ramon.arrowsmith@asu.edu http://lidar.asu.edu
Getting Started With LP360
 Getting Started With LP360 12/22/2015 1 Contents What is LP360?... 3 System Requirements... 3 Installing LP360... 4 How to Enable the LP360 Extension... 4 How to Display the LP360 Toolbar... 4 How to Import
The Data Journalist Chapter 7 tutorial Geocoding in ArcGIS Desktop
 The Data Journalist Chapter 7 tutorial Geocoding in ArcGIS Desktop Summary: In many cases, online geocoding services are all you will need to convert addresses and other location data into geographic data.
CROP MAPPING WITH SENTINEL-2 JULY 2017, SPAIN
 _p TRAINING KIT LAND01 CROP MAPPING WITH SENTINEL-2 JULY 2017, SPAIN Table of Contents 1 Introduction to RUS... 3 2 Crop mapping background... 3 3 Training... 3 3.1 Data used... 3 3.2 Software in RUS environment...
Tutorial: MODFLOW-USG Tutorial
 Tutorial: Visual MODFLOW Flex 5.0 Integrated Conceptual & Numerical Groundwater Modeling Software 1 1 Visual MODFLOW Flex 5.0 The following example is a walk through of creating a MODFLOW-USG groundwater
Exercise 2.2. Explore QGIS. GIS Techniques for Monitoring and Evaluation of HIV/AIDS and Related Programs
 GIS Techniques for Monitoring and Evaluation of HIV/AIDS and Related Programs Exercise 2.2 Explore QGIS *This training was developed as part of a joint effort between MEASURE Evaluation and MEASURE DHS,