2.1: Frequency Distributions and Their Graphs
|
|
|
- Veronica Powers
- 5 years ago
- Views:
Transcription


1 2.1: Frequency Distributions and Their Graphs Frequency Distribution - way to display data that has many entries - table that shows classes or intervals of data entries and the number of entries in each class - the frequency, f, of a class is the number of data entries in the class Constructing a frequency distribution 1. Decide on the number of classes to include 2. Find class width. Round up to the next convenient number. Max Min Class width Number of classes( Given) 3. Find class limits. Use the minimum data entry and the lower limit of the first class. To find the remaining lower limit, add the class width to the lower limit of the preceding class. 4. Use tally marks to total the entries for each class. 5. Count the tally marks to find the frequency for each class. For Example.
2 Example 1: Construct a frequency distribution using the ages of the residents of Akhiok given below. Use six classes. 1, 1, 1, 2, 2, 2, 3, 3, 4, 4, 4, 5, 5, 5, 6, 6, 6, 6, 7, 7, 8, 8, 9, 10, 10, 10, 11, 11, 11, 12, 12, 13, 15, 16, 16, 17, 17, 21, 21, 22, 23, 24, 25, 25, 26, 27, 27, 28, 28, 29, 30, 31, 31, 32, 32, 33, 33, 34, 36, 39, 41, 42, 45, 46, 47, 48, 49, 50, 50, 51, 52, 53, 54, 55, 56, 60, 61 Definitions Midpoint sum of the lower and upper limits of each class divided by two. After finding the first midpoint, you can find the remaining midpoints by adding the class width to the previous midpoint. Relative Frequency portion or percent of the data that falls in that class. Divide the frequency, f, of the class by the sample size, n. Cumulative Frequency sum of the frequency for that class and all previous classes. The cumulative frequency of the last class is equal to the sample size.
3 Example 2: Using the frequency distribution constructed in Example1, find the midpoint, relative frequency, and cumulative frequency for each class. Identify any patterns and characteristics. LB Class Limits UB Midpoint f Cumulative f Relative f Graphs of Frequency Distributions A frequency histogram is a bar graph that represents the frequency distribution of a data set. 1. The horizontal scale is quantitative and measures the data values. 2. The vertical scale measures the frequencies of the classes 3. Consecutive bars must touch. Therefore, bars must begin and end at class boundaries instead of class limits. You can mark the horizontal scale using the class boundaries or midpoints.
4 A frequency polygon is a line graph that emphasizes the continuous changes in frequencies. Use midpoints.
5 Relative Frequency Histogram-vertical scale measure relative frequencies. Cumulative Frequency Graph (Ogive) a line graph that displays the cumulative frequency of each class at its upper class boundary. The upper boundaries are marked on the horizontal axis and the cumulative frequencies are marked on the vertical axis.

6 2.2: More Graphs and Displays Graphing Quantitative Data Sets Stem-and-Leaf Plot newer way of displaying data. Construct 2 stem and leaf plots. For the first, use the key 1 55 = 155. For the second, use the key 15 5 = 155. Dot Plot each data entry is plotted, using a point, above a horizontal axis. Data from Example 1 turned into a dot plot: Are there any outliers? Circle the outliers. Should they be removed? Why or why not?


7 Graphing Qualitative Data Sets Pie Chart circle graph. Steps to constructing a pie chart: 1. Find the relative frequency of each data entry. 2. Multiply each relative frequency by 360 to find the appropriate angle measures. 3. Construct pie chart and be sure to label appropriately. (Label using percents.) Example 4: The numbers of motor vehicle occupants killed in crashes in 1995 are shown in the table. Use a pie chart to organize the data.


8 Pareto Chart Vertical bar graph in which the height of the bar represents frequency or relative frequency.
9 Graphing Paired Data Sets Scatter Plots ordered pairs are graphed as points in a coordinate plane. Example 6: The lengths of employment and the salaries of 10 employees are listed in the table at the left. Graph the data using a scatter plot. Length of Employment (in Salary (in dollars) years) 5 32, , , , , , , , , ,000
10 Time Series Chart composed of entries taken at regular intervals over a period of time. Example 7: Use the table to construct a time series chart for a subscribers average local monthly cellular telephone bill for the years 1987 through Use a broken x-axis. Year Average Bill (in dollars)

11 2.3: Measures of Central Tendency Measures of Central Tendency represents a typical, or central, entry of a data set. Median middle data entry when the data set is sorted in ascending or descending order. If the data set has an even # of entries, the median is the mean of the two middle data entries. Mode data entry that occurs the most often. If no entry is repeated, the data set has no mode. If there is a tie, then the data set is bimodal meaning it has 2 modes! Example 1: Find the sample mean, median and mode for the following data set Mean = Median = Mode = Are there any outliers (values that look like they do not belong)? Remove them and recalculate. Mean = Mode = Median = Is the data set: Without a Mode? Modal? Bimodal?
12 Weighted Mean and Mean of Grouped Data data sets that contain entries that have a greater effect on the mean than do other entries. (For example: the way your grade is calculated in this class). Weighted mean mean of a data set whose entries have varying weights. xw x, where w is the weight of each entry. w Example 2: Your grade in this class is determined from five scores: 45% from your test mean, 20% from final exam, 15% from quizzes and 20% from homework. Your scores are 86 (test), 96 (final exam), 82 (quizzes), and 100 (homework). What is the weighted mean (your average in the class) of your scores? Source Score, x Weight, w (xw) Test Final Quiz Homework w 1 Add the column. xw Add the column. Mean of a frequency distribution - the frequency of a class. x xf n, where x is the midpoint of a class and f is Example 3: Use the following frequency distribution to determine the mean. Height Frequency, f Midpoint, x xf
13
14 2.4: Measures of Variation Definitions and Formulas Range difference between the maximum and minimum entries in a data set Deviation The deviation of an entry x in a population set is the difference between the entry and the population mean. Deviation of xx * For any data set, the sum of the deviations is zero, so finding the average of the deviations wouldn t make sense. We use population variance. Population Variance the mean of the squares of the deviations. 2 x 2 Population Variance, where N is the number of entries. N Population Standard Deviation allows you to return to the original unit of the data set. Population standard deviation x 2 N Example 1: Corporation A has hired 10 graduates. The starting salaries for the 10 graduates at corporation A are as follows. Starting Salaries for corporation A (in thousands of dollars) Salary Question 1: What is the range? Question 2: What is the population variance and standard deviation? Data Entries Mean Deviation x x x 2 = x 2 x 2 5 This number is your variance N x 2 N 16 This number is your s.d.
15 * Sometimes information about a population is unknown so variance and standard deviation must be estimated using a sample. Sample variance s 2 Sample standard deviation x x 2 n 1 2 s s x x 2 n 1 Question 3: What is the sample variance and standard deviation? This part is easy go back to step 4, and divide that number by n-1 instead. Recalculate from there. Example 2: Now complete the previous problem using your calculator. Calculator stuff Stat Calc 1-VAR STATS x x x 2 sx x n


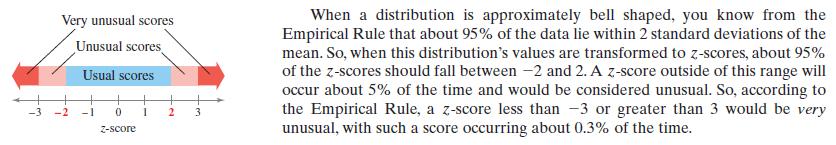
16 Empirical Rule o Helps you see how valuable the standard deviation can be as a measure of variation. o For data with a bell-shaped distribution, the standard deviation has the following characteristics. 1. About 68% of the data set lies within 1 standard deviation of the mean. 2. About 95% of the data set lies within 2 standard deviations of the mean. 3. About 99.7% of the data set lies within 3 standard deviations of the mean.
17 Example 4: Heights of American Women Sample mean = 64 Sample standard deviation = Estimate the percent of heights that are between 64 and 69.5 inches. 2. Estimate the percent of heights that are below inches. 3. Estimate the percent of heights that are above Estimate the percent of heights that are below and above Between what two heights do 68% of all American women fall between? 6. Between what two heights do 95% of all American women fall between? 7. Between what two heights do 99.7% of all American women fall between?
18 2.5: Measures of Position Fractiles are numbers that divide an ordered data set into equal parts. o Quartiles divide a data set into four equal parts. o Deciles divide a data set into 10 equal parts. o Percentiles divide a data set into 100 equal parts. Example 1: Find the first, second, and third quartiles of the following data set Interquartile Range (IQR) Q3 Q1, this tells how much the middle half of a data set varies. Find the IQR for example 1: Example 2 Using the TI-83 graphing calculator find Q 1, Q 2, and Q 3 of the following data set


19 . Example 3: Using a calculator find the 5-number summary for example 1 and draw a box-and-whisker plot. 1 VAR STAT Outliers Numbers in a data set that fall 1.5IQR away from Q 1 or Q 3. Example 4: Are there any outliers for the data set in Example 1? If so, what are they? Other TILES!!!!

20 Now another idea.
21
a. divided by the. 1) Always round!! a) Even if class width comes out to a, go up one.
 Always round!! a) Even if class width comes out to a, go up one.") Probability and Statistics Chapter 2 Notes I Section 2-1 A Steps to Constructing Frequency Distributions 1 Determine number of (may be given to you) a Should be between and classes 2 Find the Range a The
Probability and Statistics Chapter 2 Notes I Section 2-1 A Steps to Constructing Frequency Distributions 1 Determine number of (may be given to you) a Should be between and classes 2 Find the Range a The
Section 2-2 Frequency Distributions. Copyright 2010, 2007, 2004 Pearson Education, Inc
 Section 2-2 Frequency Distributions Copyright 2010, 2007, 2004 Pearson Education, Inc. 2.1-1 Frequency Distribution Frequency Distribution (or Frequency Table) It shows how a data set is partitioned among
Chapter 2 Describing, Exploring, and Comparing Data
 Slide 1 Chapter 2 Describing, Exploring, and Comparing Data Slide 2 2-1 Overview 2-2 Frequency Distributions 2-3 Visualizing Data 2-4 Measures of Center 2-5 Measures of Variation 2-6 Measures of Relative
Measures of Position
 Measures of Position In this section, we will learn to use fractiles. Fractiles are numbers that partition, or divide, an ordered data set into equal parts (each part has the same number of data entries).
Overview. Frequency Distributions. Chapter 2 Summarizing & Graphing Data. Descriptive Statistics. Inferential Statistics. Frequency Distribution
 Chapter 2 Summarizing & Graphing Data Slide 1 Overview Descriptive Statistics Slide 2 A) Overview B) Frequency Distributions C) Visualizing Data summarize or describe the important characteristics of a
Measures of Central Tendency
 Page of 6 Measures of Central Tendency A measure of central tendency is a value used to represent the typical or average value in a data set. The Mean The sum of all data values divided by the number of
Chapter 1. Looking at Data-Distribution
 Chapter 1. Looking at Data-Distribution Statistics is the scientific discipline that provides methods to draw right conclusions: 1)Collecting the data 2)Describing the data 3)Drawing the conclusions Raw
Prepare a stem-and-leaf graph for the following data. In your final display, you should arrange the leaves for each stem in increasing order.
 Chapter 2 2.1 Descriptive Statistics A stem-and-leaf graph, also called a stemplot, allows for a nice overview of quantitative data without losing information on individual observations. It can be a good
15 Wyner Statistics Fall 2013
 15 Wyner Statistics Fall 2013 CHAPTER THREE: CENTRAL TENDENCY AND VARIATION Summary, Terms, and Objectives The two most important aspects of a numerical data set are its central tendencies and its variation.
Chapter 2. Descriptive Statistics: Organizing, Displaying and Summarizing Data
 Chapter 2 Descriptive Statistics: Organizing, Displaying and Summarizing Data Objectives Student should be able to Organize data Tabulate data into frequency/relative frequency tables Display data graphically
Measures of Central Tendency. A measure of central tendency is a value used to represent the typical or average value in a data set.
 Measures of Central Tendency A measure of central tendency is a value used to represent the typical or average value in a data set. The Mean the sum of all data values divided by the number of values in
CHAPTER 2 DESCRIPTIVE STATISTICS
 CHAPTER 2 DESCRIPTIVE STATISTICS 1. Stem-and-Leaf Graphs, Line Graphs, and Bar Graphs The distribution of data is how the data is spread or distributed over the range of the data values. This is one of
MATH1635, Statistics (2)
") MATH1635, Statistics (2) Chapter 2 Histograms and Frequency Distributions I. A Histogram is a form of bar graph in which: A. The width of a bar is designated by an interval or ratio data value and thus
MATH1635, Statistics (2) Chapter 2 Histograms and Frequency Distributions I. A Histogram is a form of bar graph in which: A. The width of a bar is designated by an interval or ratio data value and thus
CHAPTER 2: SAMPLING AND DATA
 CHAPTER 2: SAMPLING AND DATA This presentation is based on material and graphs from Open Stax and is copyrighted by Open Stax and Georgia Highlands College. OUTLINE 2.1 Stem-and-Leaf Graphs (Stemplots),
Name Date Types of Graphs and Creating Graphs Notes
 Name Date Types of Graphs and Creating Graphs Notes Graphs are helpful visual representations of data. Different graphs display data in different ways. Some graphs show individual data, but many do not.
Elementary Statistics
 1 Elementary Statistics Introduction Statistics is the collection of methods for planning experiments, obtaining data, and then organizing, summarizing, presenting, analyzing, interpreting, and drawing
Chapter 3 - Displaying and Summarizing Quantitative Data
 Chapter 3 - Displaying and Summarizing Quantitative Data 3.1 Graphs for Quantitative Data (LABEL GRAPHS) August 25, 2014 Histogram (p. 44) - Graph that uses bars to represent different frequencies or relative
Chapter 2 Organizing and Graphing Data. 2.1 Organizing and Graphing Qualitative Data
 Chapter 2 Organizing and Graphing Data 2.1 Organizing and Graphing Qualitative Data 2.2 Organizing and Graphing Quantitative Data 2.3 Stem-and-leaf Displays 2.4 Dotplots 2.1 Organizing and Graphing Qualitative
Lecture Slides. Elementary Statistics Tenth Edition. by Mario F. Triola. and the Triola Statistics Series. Slide 1
 Lecture Slides Elementary Statistics Tenth Edition and the Triola Statistics Series by Mario F. Triola Slide 1 Chapter 2 Summarizing and Graphing Data 2-1 Overview 2-2 Frequency Distributions 2-3 Histograms
10.4 Measures of Central Tendency and Variation
 10.4 Measures of Central Tendency and Variation Mode-->The number that occurs most frequently; there can be more than one mode ; if each number appears equally often, then there is no mode at all. (mode
10.4 Measures of Central Tendency and Variation
 10.4 Measures of Central Tendency and Variation Mode-->The number that occurs most frequently; there can be more than one mode ; if each number appears equally often, then there is no mode at all. (mode
Lecture Slides. Elementary Statistics Twelfth Edition. by Mario F. Triola. and the Triola Statistics Series. Section 2.1- #
 Lecture Slides Elementary Statistics Twelfth Edition and the Triola Statistics Series by Mario F. Triola Chapter 2 Summarizing and Graphing Data 2-1 Review and Preview 2-2 Frequency Distributions 2-3 Histograms
Unit 7 Statistics. AFM Mrs. Valentine. 7.1 Samples and Surveys
 Unit 7 Statistics AFM Mrs. Valentine 7.1 Samples and Surveys v Obj.: I will understand the different methods of sampling and studying data. I will be able to determine the type used in an example, and
Math 120 Introduction to Statistics Mr. Toner s Lecture Notes 3.1 Measures of Central Tendency
 Math 1 Introduction to Statistics Mr. Toner s Lecture Notes 3.1 Measures of Central Tendency lowest value + highest value midrange The word average: is very ambiguous and can actually refer to the mean,
2.1 Objectives. Math Chapter 2. Chapter 2. Variable. Categorical Variable EXPLORING DATA WITH GRAPHS AND NUMERICAL SUMMARIES
 EXPLORING DATA WITH GRAPHS AND NUMERICAL SUMMARIES Chapter 2 2.1 Objectives 2.1 What Are the Types of Data? www.managementscientist.org 1. Know the definitions of a. Variable b. Categorical versus quantitative
UNIT 1A EXPLORING UNIVARIATE DATA
 A.P. STATISTICS E. Villarreal Lincoln HS Math Department UNIT 1A EXPLORING UNIVARIATE DATA LESSON 1: TYPES OF DATA Here is a list of important terms that we must understand as we begin our study of statistics
Test Bank for Privitera, Statistics for the Behavioral Sciences
 1. A simple frequency distribution A) can be used to summarize grouped data B) can be used to summarize ungrouped data C) summarizes the frequency of scores in a given category or range 2. To determine
STP 226 ELEMENTARY STATISTICS NOTES PART 2 - DESCRIPTIVE STATISTICS CHAPTER 3 DESCRIPTIVE MEASURES
 STP 6 ELEMENTARY STATISTICS NOTES PART - DESCRIPTIVE STATISTICS CHAPTER 3 DESCRIPTIVE MEASURES Chapter covered organizing data into tables, and summarizing data with graphical displays. We will now use
Chapter 2 - Graphical Summaries of Data
 Chapter 2 - Graphical Summaries of Data Data recorded in the sequence in which they are collected and before they are processed or ranked are called raw data. Raw data is often difficult to make sense
CHAPTER 2: DESCRIPTIVE STATISTICS Lecture Notes for Introductory Statistics 1. Daphne Skipper, Augusta University (2016)
") CHAPTER 2: DESCRIPTIVE STATISTICS Lecture Notes for Introductory Statistics 1 Daphne Skipper, Augusta University (2016) 1. Stem-and-Leaf Graphs, Line Graphs, and Bar Graphs The distribution of data is
CHAPTER 2: DESCRIPTIVE STATISTICS Lecture Notes for Introductory Statistics 1 Daphne Skipper, Augusta University (2016) 1. Stem-and-Leaf Graphs, Line Graphs, and Bar Graphs The distribution of data is
Chpt 3. Data Description. 3-2 Measures of Central Tendency /40
 Chpt 3 Data Description 3-2 Measures of Central Tendency 1 /40 Chpt 3 Homework 3-2 Read pages 96-109 p109 Applying the Concepts p110 1, 8, 11, 15, 27, 33 2 /40 Chpt 3 3.2 Objectives l Summarize data using
Create a bar graph that displays the data from the frequency table in Example 1. See the examples on p Does our graph look different?
 A frequency table is a table with two columns, one for the categories and another for the number of times each category occurs. See Example 1 on p. 247. Create a bar graph that displays the data from the
This chapter will show how to organize data and then construct appropriate graphs to represent the data in a concise, easy-to-understand form.
 CHAPTER 2 Frequency Distributions and Graphs Objectives Organize data using frequency distributions. Represent data in frequency distributions graphically using histograms, frequency polygons, and ogives.
Further Maths Notes. Common Mistakes. Read the bold words in the exam! Always check data entry. Write equations in terms of variables
 Further Maths Notes Common Mistakes Read the bold words in the exam! Always check data entry Remember to interpret data with the multipliers specified (e.g. in thousands) Write equations in terms of variables
AND NUMERICAL SUMMARIES. Chapter 2
 EXPLORING DATA WITH GRAPHS AND NUMERICAL SUMMARIES Chapter 2 2.1 What Are the Types of Data? 2.1 Objectives www.managementscientist.org 1. Know the definitions of a. Variable b. Categorical versus quantitative
WHOLE NUMBER AND DECIMAL OPERATIONS
 WHOLE NUMBER AND DECIMAL OPERATIONS Whole Number Place Value : 5,854,902 = Ten thousands thousands millions Hundred thousands Ten thousands Adding & Subtracting Decimals : Line up the decimals vertically.
M7D1.a: Formulate questions and collect data from a census of at least 30 objects and from samples of varying sizes.
 M7D1.a: Formulate questions and collect data from a census of at least 30 objects and from samples of varying sizes. Population: Census: Biased: Sample: The entire group of objects or individuals considered
LESSON 3: CENTRAL TENDENCY
 LESSON 3: CENTRAL TENDENCY Outline Arithmetic mean, median and mode Ungrouped data Grouped data Percentiles, fractiles, and quartiles Ungrouped data Grouped data 1 MEAN Mean is defined as follows: Sum
Univariate Statistics Summary
 Further Maths Univariate Statistics Summary Types of Data Data can be classified as categorical or numerical. Categorical data are observations or records that are arranged according to category. For example:
Averages and Variation
 Averages and Variation 3 Copyright Cengage Learning. All rights reserved. 3.1-1 Section 3.1 Measures of Central Tendency: Mode, Median, and Mean Copyright Cengage Learning. All rights reserved. 3.1-2 Focus
Measures of Dispersion
 Measures of Dispersion 6-3 I Will... Find measures of dispersion of sets of data. Find standard deviation and analyze normal distribution. Day 1: Dispersion Vocabulary Measures of Variation (Dispersion
Using a percent or a letter grade allows us a very easy way to analyze our performance. Not a big deal, just something we do regularly.
 GRAPHING We have used statistics all our lives, what we intend to do now is formalize that knowledge. Statistics can best be defined as a collection and analysis of numerical information. Often times we
September 11, Unit 2 Day 1 Notes Measures of Central Tendency.notebook
 Measures of Central Tendency: Mean, Median, Mode and Midrange A Measure of Central Tendency is a value that represents a typical or central entry of a data set. Four most commonly used measures of central
STA Module 2B Organizing Data and Comparing Distributions (Part II)
") STA 2023 Module 2B Organizing Data and Comparing Distributions (Part II) Learning Objectives Upon completing this module, you should be able to 1 Explain the purpose of a measure of center 2 Obtain and
STA 2023 Module 2B Organizing Data and Comparing Distributions (Part II) Learning Objectives Upon completing this module, you should be able to 1 Explain the purpose of a measure of center 2 Obtain and
STA Learning Objectives. Learning Objectives (cont.) Module 2B Organizing Data and Comparing Distributions (Part II)
 Module 2B Organizing Data and Comparing Distributions (Part II)") STA 2023 Module 2B Organizing Data and Comparing Distributions (Part II) Learning Objectives Upon completing this module, you should be able to 1 Explain the purpose of a measure of center 2 Obtain and
STA 2023 Module 2B Organizing Data and Comparing Distributions (Part II) Learning Objectives Upon completing this module, you should be able to 1 Explain the purpose of a measure of center 2 Obtain and
CHAPTER 1. Introduction. Statistics: Statistics is the science of collecting, organizing, analyzing, presenting and interpreting data.
 1 CHAPTER 1 Introduction Statistics: Statistics is the science of collecting, organizing, analyzing, presenting and interpreting data. Variable: Any characteristic of a person or thing that can be expressed
Name Geometry Intro to Stats. Find the mean, median, and mode of the data set. 1. 1,6,3,9,6,8,4,4,4. Mean = Median = Mode = 2.
 Name Geometry Intro to Stats Statistics are numerical values used to summarize and compare sets of data. Two important types of statistics are measures of central tendency and measures of dispersion. A
Chapter 3: Data Description - Part 3. Homework: Exercises 1-21 odd, odd, odd, 107, 109, 118, 119, 120, odd
 Chapter 3: Data Description - Part 3 Read: Sections 1 through 5 pp 92-149 Work the following text examples: Section 3.2, 3-1 through 3-17 Section 3.3, 3-22 through 3.28, 3-42 through 3.82 Section 3.4,
Descriptive Statistics
 Chapter 2 Descriptive Statistics 2.1 Descriptive Statistics 1 2.1.1 Student Learning Objectives By the end of this chapter, the student should be able to: Display data graphically and interpret graphs:
STA 570 Spring Lecture 5 Tuesday, Feb 1
 STA 570 Spring 2011 Lecture 5 Tuesday, Feb 1 Descriptive Statistics Summarizing Univariate Data o Standard Deviation, Empirical Rule, IQR o Boxplots Summarizing Bivariate Data o Contingency Tables o Row
MATH NATION SECTION 9 H.M.H. RESOURCES
 MATH NATION SECTION 9 H.M.H. RESOURCES SPECIAL NOTE: These resources were assembled to assist in student readiness for their upcoming Algebra 1 EOC. Although these resources have been compiled for your
B. Graphing Representation of Data
 B Graphing Representation of Data The second way of displaying data is by use of graphs Although such visual aids are even easier to read than tables, they often do not give the same detail It is essential
Basic Statistical Terms and Definitions
 I. Basics Basic Statistical Terms and Definitions Statistics is a collection of methods for planning experiments, and obtaining data. The data is then organized and summarized so that professionals can
Date Lesson TOPIC HOMEWORK. Displaying Data WS 6.1. Measures of Central Tendency WS 6.2. Common Distributions WS 6.6. Outliers WS 6.
 UNIT 6 ONE VARIABLE STATISTICS Date Lesson TOPIC HOMEWORK 6.1 3.3 6.2 3.4 Displaying Data WS 6.1 Measures of Central Tendency WS 6.2 6.3 6.4 3.5 6.5 3.5 Grouped Data Central Tendency Measures of Spread
MATH 117 Statistical Methods for Management I Chapter Two
 Jubail University College MATH 117 Statistical Methods for Management I Chapter Two There are a wide variety of ways to summarize, organize, and present data: I. Tables 1. Distribution Table (Categorical
Chapter 6: DESCRIPTIVE STATISTICS
 Chapter 6: DESCRIPTIVE STATISTICS Random Sampling Numerical Summaries Stem-n-Leaf plots Histograms, and Box plots Time Sequence Plots Normal Probability Plots Sections 6-1 to 6-5, and 6-7 Random Sampling
2.1: Frequency Distributions
 2.1: Frequency Distributions Frequency Distribution: organization of data into groups called. A: Categorical Frequency Distribution used for and level qualitative data that can be put into categories.
Measures of Position. 1. Determine which student did better
 Measures of Position z-score (standard score) = number of standard deviations that a given value is above or below the mean (Round z to two decimal places) Sample z -score x x z = s Population z - score
Probability and Statistics. Copyright Cengage Learning. All rights reserved.
 Probability and Statistics Copyright Cengage Learning. All rights reserved. 14.5 Descriptive Statistics (Numerical) Copyright Cengage Learning. All rights reserved. Objectives Measures of Central Tendency:
Vocabulary. 5-number summary Rule. Area principle. Bar chart. Boxplot. Categorical data condition. Categorical variable.
 5-number summary 68-95-99.7 Rule Area principle Bar chart Bimodal Boxplot Case Categorical data Categorical variable Center Changing center and spread Conditional distribution Context Contingency table
STA Rev. F Learning Objectives. Learning Objectives (Cont.) Module 3 Descriptive Measures
 Module 3 Descriptive Measures") STA 2023 Module 3 Descriptive Measures Learning Objectives Upon completing this module, you should be able to: 1. Explain the purpose of a measure of center. 2. Obtain and interpret the mean, median, and
STA 2023 Module 3 Descriptive Measures Learning Objectives Upon completing this module, you should be able to: 1. Explain the purpose of a measure of center. 2. Obtain and interpret the mean, median, and
1.2. Pictorial and Tabular Methods in Descriptive Statistics
 1.2. Pictorial and Tabular Methods in Descriptive Statistics Section Objectives. 1. Stem-and-Leaf displays. 2. Dotplots. 3. Histogram. Types of histogram shapes. Common notation. Sample size n : the number
Measures of Dispersion
 Lesson 7.6 Objectives Find the variance of a set of data. Calculate standard deviation for a set of data. Read data from a normal curve. Estimate the area under a curve. Variance Measures of Dispersion
Special Review Section. Copyright 2014 Pearson Education, Inc.
 Special Review Section SRS-1--1 Special Review Section Chapter 1: The Where, Why, and How of Data Collection Chapter 2: Graphs, Charts, and Tables Describing Your Data Chapter 3: Describing Data Using
CHAPTER 3: Data Description
 CHAPTER 3: Data Description You ve tabulated and made pretty pictures. Now what numbers do you use to summarize your data? Ch3: Data Description Santorico Page 68 You ll find a link on our website to a
1 Overview of Statistics; Essential Vocabulary
 1 Overview of Statistics; Essential Vocabulary Statistics: the science of collecting, organizing, analyzing, and interpreting data in order to make decisions Population and sample Population: the entire
TMTH 3360 NOTES ON COMMON GRAPHS AND CHARTS
 To Describe Data, consider: Symmetry Skewness TMTH 3360 NOTES ON COMMON GRAPHS AND CHARTS Unimodal or bimodal or uniform Extreme values Range of Values and mid-range Most frequently occurring values In
No. of blue jelly beans No. of bags
 Math 167 Ch5 Review 1 (c) Janice Epstein CHAPTER 5 EXPLORING DATA DISTRIBUTIONS A sample of jelly bean bags is chosen and the number of blue jelly beans in each bag is counted. The results are shown in
Chapter 5snow year.notebook March 15, 2018
 Chapter 5: Statistical Reasoning Section 5.1 Exploring Data Measures of central tendency (Mean, Median and Mode) attempt to describe a set of data by identifying the central position within a set of data
Basic Commands. Consider the data set: {15, 22, 32, 31, 52, 41, 11}
 Entering Data: Basic Commands Consider the data set: {15, 22, 32, 31, 52, 41, 11} Data is stored in Lists on the calculator. Locate and press the STAT button on the calculator. Choose EDIT. The calculator
MATH 1070 Introductory Statistics Lecture notes Descriptive Statistics and Graphical Representation
 MATH 1070 Introductory Statistics Lecture notes Descriptive Statistics and Graphical Representation Objectives: 1. Learn the meaning of descriptive versus inferential statistics 2. Identify bar graphs,
Raw Data. Statistics 1/8/2016. Relative Frequency Distribution. Frequency Distributions for Qualitative Data
 Statistics Raw Data Raw data is random and unranked data. Organizing Data Frequency distributions list all the categories and the numbers of elements that belong to each category Frequency Distributions
DAY 52 BOX-AND-WHISKER
 DAY 52 BOX-AND-WHISKER VOCABULARY The Median is the middle number of a set of data when the numbers are arranged in numerical order. The Range of a set of data is the difference between the highest and
Math 227 EXCEL / MEGASTAT Guide
 Math 227 EXCEL / MEGASTAT Guide Introduction Introduction: Ch2: Frequency Distributions and Graphs Construct Frequency Distributions and various types of graphs: Histograms, Polygons, Pie Charts, Stem-and-Leaf
Table of Contents (As covered from textbook)
") Table of Contents (As covered from textbook) Ch 1 Data and Decisions Ch 2 Displaying and Describing Categorical Data Ch 3 Displaying and Describing Quantitative Data Ch 4 Correlation and Linear Regression
Table of Contents (As covered from textbook) Ch 1 Data and Decisions Ch 2 Displaying and Describing Categorical Data Ch 3 Displaying and Describing Quantitative Data Ch 4 Correlation and Linear Regression
AP Statistics Prerequisite Packet
 Types of Data Quantitative (or measurement) Data These are data that take on numerical values that actually represent a measurement such as size, weight, how many, how long, score on a test, etc. For these
SCHOOL OF BUSINESS, ECONOMICS AND MANAGEMENT BBA240 STATISTICS/ QUANTITATIVE METHODS FOR BUSINESS AND ECONOMICS
 SCHOOL OF BUSINESS, ECONOMICS AND MANAGEMENT BBA240 STATISTICS/ QUANTITATIVE METHODS FOR BUSINESS AND ECONOMICS Unit Two Moses Mwale e-mail: moses.mwale@ictar.ac.zm ii Contents Contents UNIT 2: Numerical
Chapter 2: Graphical Summaries of Data 2.1 Graphical Summaries for Qualitative Data. Frequency: Frequency distribution:
 Chapter 2: Graphical Summaries of Data 2.1 Graphical Summaries for Qualitative Data Frequency: Frequency distribution: Example 2.1 The following are survey results from Fall 2014 Statistics class regarding
Box Plots. OpenStax College
 Connexions module: m46920 1 Box Plots OpenStax College This work is produced by The Connexions Project and licensed under the Creative Commons Attribution License 3.0 Box plots (also called box-and-whisker
Chapter 5: The standard deviation as a ruler and the normal model p131
 Chapter 5: The standard deviation as a ruler and the normal model p131 Which is the better exam score? 67 on an exam with mean 50 and SD 10 62 on an exam with mean 40 and SD 12? Is it fair to say: 67 is
1.3 Graphical Summaries of Data
 Arkansas Tech University MATH 3513: Applied Statistics I Dr. Marcel B. Finan 1.3 Graphical Summaries of Data In the previous section we discussed numerical summaries of either a sample or a data. In this
Statistics can best be defined as a collection and analysis of numerical information.
 Statistical Graphs There are many ways to organize data pictorially using statistical graphs. There are line graphs, stem and leaf plots, frequency tables, histograms, bar graphs, pictographs, circle graphs
Frequency Distributions and Graphs
 //05 C H A P T E R T W O s and s and Outline CHAPTER - Organizing Data - Histograms, Polygons, and - Other Types of -4 Paired Data and Scatter Plots Learning Objectives Organize data using a frequency
MAT 142 College Mathematics. Module ST. Statistics. Terri Miller revised July 14, 2015
 MAT 142 College Mathematics Statistics Module ST Terri Miller revised July 14, 2015 2 Statistics Data Organization and Visualization Basic Terms. A population is the set of all objects under study, a sample
8 Organizing and Displaying
 CHAPTER 8 Organizing and Displaying Data for Comparison Chapter Outline 8.1 BASIC GRAPH TYPES 8.2 DOUBLE LINE GRAPHS 8.3 TWO-SIDED STEM-AND-LEAF PLOTS 8.4 DOUBLE BAR GRAPHS 8.5 DOUBLE BOX-AND-WHISKER PLOTS
Chapter 3 Analyzing Normal Quantitative Data
 Chapter 3 Analyzing Normal Quantitative Data Introduction: In chapters 1 and 2, we focused on analyzing categorical data and exploring relationships between categorical data sets. We will now be doing
Chapter 2 Modeling Distributions of Data
 Chapter 2 Modeling Distributions of Data Section 2.1 Describing Location in a Distribution Describing Location in a Distribution Learning Objectives After this section, you should be able to: FIND and
Unit I Supplement OpenIntro Statistics 3rd ed., Ch. 1
 Unit I Supplement OpenIntro Statistics 3rd ed., Ch. 1 KEY SKILLS: Organize a data set into a frequency distribution. Construct a histogram to summarize a data set. Compute the percentile for a particular
Day 4 Percentiles and Box and Whisker.notebook. April 20, 2018
 Day 4 Box & Whisker Plots and Percentiles In a previous lesson, we learned that the median divides a set a data into 2 equal parts. Sometimes it is necessary to divide the data into smaller more precise
The main issue is that the mean and standard deviations are not accurate and should not be used in the analysis. Then what statistics should we use?
 Chapter 4 Analyzing Skewed Quantitative Data Introduction: In chapter 3, we focused on analyzing bell shaped (normal) data, but many data sets are not bell shaped. How do we analyze quantitative data when
Frequency Distributions
 Displaying Data Frequency Distributions After collecting data, the first task for a researcher is to organize and summarize the data so that it is possible to get a general overview of the results. Remember,
STP 226 ELEMENTARY STATISTICS NOTES
 ELEMENTARY STATISTICS NOTES PART 2 - DESCRIPTIVE STATISTICS CHAPTER 2 ORGANIZING DATA Descriptive Statistics - include methods for organizing and summarizing information clearly and effectively. - classify
Slide Copyright 2005 Pearson Education, Inc. SEVENTH EDITION and EXPANDED SEVENTH EDITION. Chapter 13. Statistics Sampling Techniques
 SEVENTH EDITION and EXPANDED SEVENTH EDITION Slide - Chapter Statistics. Sampling Techniques Statistics Statistics is the art and science of gathering, analyzing, and making inferences from numerical information
Bar Graphs and Dot Plots
 CONDENSED LESSON 1.1 Bar Graphs and Dot Plots In this lesson you will interpret and create a variety of graphs find some summary values for a data set draw conclusions about a data set based on graphs
Downloaded from
 UNIT 2 WHAT IS STATISTICS? Researchers deal with a large amount of data and have to draw dependable conclusions on the basis of data collected for the purpose. Statistics help the researchers in making
Chapter 3: Describing, Exploring & Comparing Data
 Chapter 3: Describing, Exploring & Comparing Data Section Title Notes Pages 1 Overview 1 2 Measures of Center 2 5 3 Measures of Variation 6 12 4 Measures of Relative Standing & Boxplots 13 16 3.1 Overview
AP Statistics Summer Assignment:
 AP Statistics Summer Assignment: Read the following and use the information to help answer your summer assignment questions. You will be responsible for knowing all of the information contained in this
Chapter 2: Understanding Data Distributions with Tables and Graphs
 Test Bank Chapter 2: Understanding Data with Tables and Graphs Multiple Choice 1. Which of the following would best depict nominal level data? a. pie chart b. line graph c. histogram d. polygon Ans: A
Chapter 2: Descriptive Statistics
 Chapter 2: Descriptive Statistics Student Learning Outcomes By the end of this chapter, you should be able to: Display data graphically and interpret graphs: stemplots, histograms and boxplots. Recognize,
Descriptive Statistics
 Chapter 2 Descriptive Statistics 2.1 Descriptive Statistics 1 2.1.1 Student Learning Objectives By the end of this chapter, the student should be able to: Display data graphically and interpret graphs: