Lecture Slides. Elementary Statistics Twelfth Edition. by Mario F. Triola. and the Triola Statistics Series. Section 2.1- #
|
|
|
- Rosamond Janice Tate
- 5 years ago
- Views:
Transcription

1 Lecture Slides Elementary Statistics Twelfth Edition and the Triola Statistics Series by Mario F. Triola
2 Chapter 2 Summarizing and Graphing Data 2-1 Review and Preview 2-2 Frequency Distributions 2-3 Histograms 2-4 Graphs that Enlighten and Graphs that Deceive
3 Preview Characteristics of Data 1. Center: A representative value that indicates where the middle of the data set is located. 2. Variation: A measure of the amount that the data values vary. 3. Distribution: The nature or shape of the spread of data over the range of values (such as bell-shaped, uniform, or skewed). 4. Outliers: Sample values that lie very far away from the vast majority of other sample values. 5. Time: Changing characteristics of the data over time.
4 Chapter 2 Summarizing and Graphing Data 2-1 Review and Preview 2-2 Frequency Distributions 2-3 Histograms 2-4 Graphs that Enlighten and Graphs that Deceive
5 Key Concept When working with large data sets, it is often helpful to organize and summarize data by constructing a table called a frequency distribution. Because computer software and calculators can generate frequency distributions, the details of constructing them are not as important as what they tell us about data sets.
6 Definition v Frequency Distribution (or Frequency Table) shows how a data set is partitioned among all of several categories (or classes) by listing all of the categories along with the number (frequency) of data values in each of them.
7 IQ Scores of Low Lead Group IQ Score Frequency Lower Class Limits are the smallest numbers that can actually belong to different classes
8 IQ Scores of Low Lead Group IQ Score Frequency Upper Class Limits are the largest numbers that can actually belong to different classes
9 IQ Scores of Low Lead Group Class Boundaries are the numbers used to separate classes, but without the gaps created by class limits. IQ Score Frequency
10 IQ Scores of Low Lead Group IQ Score Frequency Class Midpoints are the values in the middle of the classes and can be found by adding the lower class limit to the upper class limit and dividing the sum by
11 IQ Scores of Low Lead Group IQ Score Frequency Class Width is the difference between two consecutive lower class limits or two consecutive lower class boundaries
12 Reasons for Constructing Frequency Distributions 1. Large data sets can be summarized. 2. We can analyze the nature of data. 3. We have a basis for constructing important graphs.
13 Constructing A Frequency Distribution 1. Determine the number of classes (should be between 5 and 20). 2. Calculate the class width (round up). class width (maximum value) (minimum value) number of classes 3. Starting point: Choose the minimum data value or a convenient value below it as the first lower class limit. 4. Using the first lower class limit and class width, proceed to list the other lower class limits. 5. List the lower class limits in a vertical column and proceed to enter the upper class limits. 6. Take each individual data value and put a tally mark in the appropriate class. Add the tally marks to get the frequency.
14 Relative Frequency Distribution includes the same class limits as a frequency distribution, but the frequency of a class is replaced with a relative frequencies (a proportion) or a percentage frequency ( a percent) relative frequency = class frequency sum of all frequencies percentage frequency = class frequency sum of all frequencies 100%
15 Relative Frequency Distribution IQ Score Frequency Relative Frequency % % % % %
16 Cumulative Frequency Distribution IQ Score Frequency Cumulative Frequency Cumulative Frequencies
17 Critical Thinking: Using Frequency Distributions to Understand Data In later chapters, there will be frequent reference to data with a normal distribution. One key characteristic of a normal distribution is that it has a bell shape. v The frequencies start low, then increase to one or two high frequencies, and then decrease to a low frequency. v The distribution is approximately symmetric, with frequencies preceding the maximum being roughly a mirror image of those that follow the maximum.
18 Gaps v Gaps The presence of gaps can show that we have data from two or more different populations. However, the converse is not true, because data from different populations do not necessarily result in gaps.
19 Example v v v v The table on the next slide is a frequency distribution of randomly selected pennies. The weights of pennies (grams) are presented, and examination of the frequencies suggests we have two different populations. Pennies made before 1983 are 95% copper and 5% zinc. Pennies made after 1983 are 2.5% copper and 97.5% zinc.
20 Example (continued) The presence of gaps can suggest the data are from two or more different populations.
21 Chapter 2 Summarizing and Graphing Data 2-1 Review and Preview 2-2 Frequency Distributions 2-3 Histograms 2-4 Graphs that Enlighten and Graphs that Deceive
22 Key Concept We use a visual tool called a histogram to analyze the shape of the distribution of the data.
23 Histogram A graph consisting of bars of equal width drawn adjacent to each other (unless there are gaps in the data) The horizontal scale represents the classes of quantitative data values and the vertical scale represents the frequencies. The heights of the bars correspond to the frequency values.

24 Example IQ scores from children with low levels of lead. IQ Score Frequency
25 Histogram A histogram is basically a graph of a frequency distribution. Histograms can usually be generated using technology.

26 Relative Frequency Histogram has the same shape and horizontal scale as a histogram, but the vertical scale is marked with relative frequencies instead of actual frequencies IQ Score Relative Frequency % % % % %
27 Critical Thinking Interpreting Histograms Objective is not simply to construct a histogram, but rather to understand something about the data. When graphed, a normal distribution has a bell shape. Characteristic of the bell shape are (1) The frequencies increase to a maximum, and then decrease, and (2) symmetry, with the left half of the graph roughly a mirror image of the right half. The histogram on the next slide illustrates this.

28 Example IQ Scores What is the shape of this distribution? What is the center? How much variation is in the data? Are there any outliers?
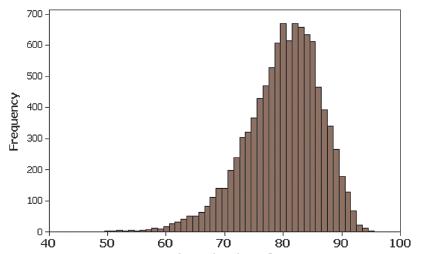
29 Skewness A distribution of data is skewed if it is not symmetric and extends more to one side to the other. Data skewed to the right (positively skewed) have a longer right tail. Data skewed to the left (negative skewed) have a longer left tail.

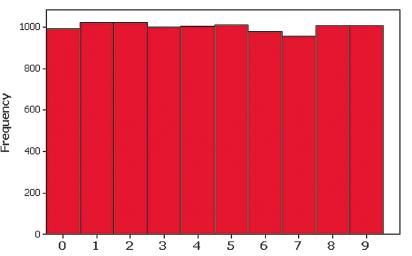
30 Example Discuss the Shape
31 Assessing Normality with a Normal Quantile Plot Many methods we will use later in the text require that the sample data must be from a population with a normal distribution. A normal quantile plot can be interpreted on the following criteria: Normal Distribution: Points are reasonably close to a straight line Not a Normal Distribution: Points not reasonably close to a straight line or the points show some systemic pattern that is not straight
32 Assessing Normality with a Normal Quantile Plot
33 Chapter 2 Summarizing and Graphing Data 2-1 Review and Preview 2-2 Frequency Distributions 2-3 Histograms 2-4 Graphs that Enlighten and Graphs that Deceive
34 Key Concept This section discusses other types of statistical graphs. Our objective is to identify a suitable graph for representing the data set. The graph should be effective in revealing the important characteristics of the data.
35 Key Concept Some graphs are bad in the sense that they contain errors. Some are bad because they are technically correct, but misleading. It is important to develop the ability to recognize bad graphs and identify exactly how they are misleading.
36 Scatterplot (or Scatter Diagram) A plot of paired (x, y) quantitative data with a horizontal x-axis and a vertical y-axis. Used to determine whether there is a relationship between the two variables. Randomly selected males the pattern suggests there is a relationship.
37 Time-Series Graph Data that have been collected at different points in time: time-series data Yearly high values of the Dow Jones Industrial Average
38 Dotplot Consists of a graph in which each data value is plotted as a point (or dot) along a scale of values. Dots representing equal values are stacked.
39 Stemplot (or Stem-and-Leaf Plot) represents quantitative data by separating each value into two parts: the stem (such as the leftmost digit) and the leaf (such as the rightmost digit).
40 Bar Graph Uses bars of equal width to show frequencies of categorical, or qualitative, data. Vertical scale represents frequencies or relative frequencies. Horizontal scale identifies the different categories of qualitative data. A multiple bar graph has two or more sets of bars and is used to compare two or more data sets.

41 Multiple Bar Graph

42 Pareto Chart A bar graph for qualitative data, with the bars arranged in descending order according to frequencies

43 Pie Chart A graph depicting qualitative data as slices of a circle, in which the size of each slice is proportional to frequency count
44 Frequency Polygon uses line segments connected to points directly above class midpoint values.
45 Relative Frequency Polygon Uses relative frequencies (proportions or percentages) for the vertical scale.
46 Ogive A line graph that depicts cumulative frequencies

47 Graphs That Deceive Nonzero Axis: Graphs can be misleading because one or both of the axes begin at some value other than zero, so that differences are exaggerated.
48 Pictographs Drawings of objects. Three-dimensional objects - money bags, stacks of coins, army tanks (for army expenditures), people (for population sizes), barrels (for oil production), and houses (for home construction) are commonly used to depict data. These drawings can create false impressions that distort the data. If you double each side of a square, the area does not merely double; it increases by a factor of four; if you double each side of a cube, the volume does not merely double; it increases by a factor of eight. Pictographs using areas and volumes can therefore be very misleading.

49 Example Income and Education Bars have same width, too busy, too difficult to understand.

50 Example Income and Education Misleading. Depicts one-dimensional data with three-dimensional boxes. Last box is 64 times as large as first box, but income is only 4 times as large.

51 Example Income and Education Fair, objective, unencumbered by distracting features.
52 Important Principles Suggested by Edward Tufte For small data sets of 20 values or fewer, use a table instead of a graph. A graph of data should make the viewer focus on the true nature of the data, not on other elements, such as eye-catching but distracting design features. Do not distort data. Construct a graph to reveal the true nature of the data. Almost all of the ink in a graph should be used for the data, not for the other design elements.
Section 2-2 Frequency Distributions. Copyright 2010, 2007, 2004 Pearson Education, Inc
 Section 2-2 Frequency Distributions Copyright 2010, 2007, 2004 Pearson Education, Inc. 2.1-1 Frequency Distribution Frequency Distribution (or Frequency Table) It shows how a data set is partitioned among
Lecture Slides. Elementary Statistics Tenth Edition. by Mario F. Triola. and the Triola Statistics Series. Slide 1
 Lecture Slides Elementary Statistics Tenth Edition and the Triola Statistics Series by Mario F. Triola Slide 1 Chapter 2 Summarizing and Graphing Data 2-1 Overview 2-2 Frequency Distributions 2-3 Histograms
Overview. Frequency Distributions. Chapter 2 Summarizing & Graphing Data. Descriptive Statistics. Inferential Statistics. Frequency Distribution
 Chapter 2 Summarizing & Graphing Data Slide 1 Overview Descriptive Statistics Slide 2 A) Overview B) Frequency Distributions C) Visualizing Data summarize or describe the important characteristics of a
Raw Data. Statistics 1/8/2016. Relative Frequency Distribution. Frequency Distributions for Qualitative Data
 Statistics Raw Data Raw data is random and unranked data. Organizing Data Frequency distributions list all the categories and the numbers of elements that belong to each category Frequency Distributions
Chapter 2 - Graphical Summaries of Data
 Chapter 2 - Graphical Summaries of Data Data recorded in the sequence in which they are collected and before they are processed or ranked are called raw data. Raw data is often difficult to make sense
Chapter 2 Describing, Exploring, and Comparing Data
 Slide 1 Chapter 2 Describing, Exploring, and Comparing Data Slide 2 2-1 Overview 2-2 Frequency Distributions 2-3 Visualizing Data 2-4 Measures of Center 2-5 Measures of Variation 2-6 Measures of Relative
Chapter 2. Frequency distribution. Summarizing and Graphing Data
 Frequency distribution Chapter 2 Summarizing and Graphing Data Shows how data are partitioned among several categories (or classes) by listing the categories along with the number (frequency) of data values
2.1: Frequency Distributions
 2.1: Frequency Distributions Frequency Distribution: organization of data into groups called. A: Categorical Frequency Distribution used for and level qualitative data that can be put into categories.
Prepare a stem-and-leaf graph for the following data. In your final display, you should arrange the leaves for each stem in increasing order.
 Chapter 2 2.1 Descriptive Statistics A stem-and-leaf graph, also called a stemplot, allows for a nice overview of quantitative data without losing information on individual observations. It can be a good
+ Statistical Methods in
 + Statistical Methods in Practice STA/MTH 3379 + Dr. A. B. W. Manage Associate Professor of Statistics Department of Mathematics & Statistics Sam Houston State University Discovering Statistics 2nd Edition
Chapter 2: Graphical Summaries of Data 2.1 Graphical Summaries for Qualitative Data. Frequency: Frequency distribution:
 Chapter 2: Graphical Summaries of Data 2.1 Graphical Summaries for Qualitative Data Frequency: Frequency distribution: Example 2.1 The following are survey results from Fall 2014 Statistics class regarding
Chapter 2 Organizing and Graphing Data. 2.1 Organizing and Graphing Qualitative Data
 Chapter 2 Organizing and Graphing Data 2.1 Organizing and Graphing Qualitative Data 2.2 Organizing and Graphing Quantitative Data 2.3 Stem-and-leaf Displays 2.4 Dotplots 2.1 Organizing and Graphing Qualitative
2.4-Statistical Graphs
 2.4-Statistical Graphs Frequency Polygon: A frequency polygon uses line segments connected to points directly above class midpoint values. Example: Given the following frequency table for the pulse rate
This chapter will show how to organize data and then construct appropriate graphs to represent the data in a concise, easy-to-understand form.
 CHAPTER 2 Frequency Distributions and Graphs Objectives Organize data using frequency distributions. Represent data in frequency distributions graphically using histograms, frequency polygons, and ogives.
2.1 Objectives. Math Chapter 2. Chapter 2. Variable. Categorical Variable EXPLORING DATA WITH GRAPHS AND NUMERICAL SUMMARIES
 EXPLORING DATA WITH GRAPHS AND NUMERICAL SUMMARIES Chapter 2 2.1 Objectives 2.1 What Are the Types of Data? www.managementscientist.org 1. Know the definitions of a. Variable b. Categorical versus quantitative
AND NUMERICAL SUMMARIES. Chapter 2
 EXPLORING DATA WITH GRAPHS AND NUMERICAL SUMMARIES Chapter 2 2.1 What Are the Types of Data? 2.1 Objectives www.managementscientist.org 1. Know the definitions of a. Variable b. Categorical versus quantitative
2.1: Frequency Distributions and Their Graphs
 2.1: Frequency Distributions and Their Graphs Frequency Distribution - way to display data that has many entries - table that shows classes or intervals of data entries and the number of entries in each
TMTH 3360 NOTES ON COMMON GRAPHS AND CHARTS
 To Describe Data, consider: Symmetry Skewness TMTH 3360 NOTES ON COMMON GRAPHS AND CHARTS Unimodal or bimodal or uniform Extreme values Range of Values and mid-range Most frequently occurring values In
Organizing and Summarizing Data
 1 Organizing and Summarizing Data Key Definitions Frequency Distribution: This lists each category of data and how often they occur. : The percent of observations within the one of the categories. This
Elementary Statistics
 1 Elementary Statistics Introduction Statistics is the collection of methods for planning experiments, obtaining data, and then organizing, summarizing, presenting, analyzing, interpreting, and drawing
Section 1.2. Displaying Quantitative Data with Graphs. Mrs. Daniel AP Stats 8/22/2013. Dotplots. How to Make a Dotplot. Mrs. Daniel AP Statistics
 Section. Displaying Quantitative Data with Graphs Mrs. Daniel AP Statistics Section. Displaying Quantitative Data with Graphs After this section, you should be able to CONSTRUCT and INTERPRET dotplots,
Name Date Types of Graphs and Creating Graphs Notes
 Name Date Types of Graphs and Creating Graphs Notes Graphs are helpful visual representations of data. Different graphs display data in different ways. Some graphs show individual data, but many do not.
Test Bank for Privitera, Statistics for the Behavioral Sciences
 1. A simple frequency distribution A) can be used to summarize grouped data B) can be used to summarize ungrouped data C) summarizes the frequency of scores in a given category or range 2. To determine
Frequency Distributions and Graphs
 //05 C H A P T E R T W O s and s and Outline CHAPTER - Organizing Data - Histograms, Polygons, and - Other Types of -4 Paired Data and Scatter Plots Learning Objectives Organize data using a frequency
B. Graphing Representation of Data
 B Graphing Representation of Data The second way of displaying data is by use of graphs Although such visual aids are even easier to read than tables, they often do not give the same detail It is essential
MATH 117 Statistical Methods for Management I Chapter Two
 Jubail University College MATH 117 Statistical Methods for Management I Chapter Two There are a wide variety of ways to summarize, organize, and present data: I. Tables 1. Distribution Table (Categorical
Frequency Distributions
 Displaying Data Frequency Distributions After collecting data, the first task for a researcher is to organize and summarize the data so that it is possible to get a general overview of the results. Remember,
The basic arrangement of numeric data is called an ARRAY. Array is the derived data from fundamental data Example :- To store marks of 50 student
 Organizing data Learning Outcome 1. make an array 2. divide the array into class intervals 3. describe the characteristics of a table 4. construct a frequency distribution table 5. constructing a composite
Chapter 2. Frequency Distributions and Graphs. Bluman, Chapter 2
 Chapter 2 Frequency Distributions and Graphs 1 Chapter 2 Overview Introduction 2-1 Organizing Data 2-2 Histograms, Frequency Polygons, and Ogives 2-3 Other Types of Graphs 2 Chapter 2 Objectives 1. Organize
Chapter 2: Understanding Data Distributions with Tables and Graphs
 Test Bank Chapter 2: Understanding Data with Tables and Graphs Multiple Choice 1. Which of the following would best depict nominal level data? a. pie chart b. line graph c. histogram d. polygon Ans: A
CHAPTER 1. Introduction. Statistics: Statistics is the science of collecting, organizing, analyzing, presenting and interpreting data.
 1 CHAPTER 1 Introduction Statistics: Statistics is the science of collecting, organizing, analyzing, presenting and interpreting data. Variable: Any characteristic of a person or thing that can be expressed
Chapter 3 - Displaying and Summarizing Quantitative Data
 Chapter 3 - Displaying and Summarizing Quantitative Data 3.1 Graphs for Quantitative Data (LABEL GRAPHS) August 25, 2014 Histogram (p. 44) - Graph that uses bars to represent different frequencies or relative
No. of blue jelly beans No. of bags
 Math 167 Ch5 Review 1 (c) Janice Epstein CHAPTER 5 EXPLORING DATA DISTRIBUTIONS A sample of jelly bean bags is chosen and the number of blue jelly beans in each bag is counted. The results are shown in
STP 226 ELEMENTARY STATISTICS NOTES
 ELEMENTARY STATISTICS NOTES PART 2 - DESCRIPTIVE STATISTICS CHAPTER 2 ORGANIZING DATA Descriptive Statistics - include methods for organizing and summarizing information clearly and effectively. - classify
Vocabulary. 5-number summary Rule. Area principle. Bar chart. Boxplot. Categorical data condition. Categorical variable.
 5-number summary 68-95-99.7 Rule Area principle Bar chart Bimodal Boxplot Case Categorical data Categorical variable Center Changing center and spread Conditional distribution Context Contingency table
a. divided by the. 1) Always round!! a) Even if class width comes out to a, go up one.
 Always round!! a) Even if class width comes out to a, go up one.") Probability and Statistics Chapter 2 Notes I Section 2-1 A Steps to Constructing Frequency Distributions 1 Determine number of (may be given to you) a Should be between and classes 2 Find the Range a The
Probability and Statistics Chapter 2 Notes I Section 2-1 A Steps to Constructing Frequency Distributions 1 Determine number of (may be given to you) a Should be between and classes 2 Find the Range a The
28 CHAPTER 2 Summarizing and Graphing Data
 8 CHAPTER Summarizing and Graphing Data. The two requested histograms are given below. They give very different visual images of the shape of the distribution. An outlier can have a significant effect
Chapter 2 - Frequency Distributions and Graphs
 1. Which of the following does not need to be done when constructing a frequency distribution? A) select the number of classes desired B) find the range C) make the class width an even number D) use classes
2.3 Organizing Quantitative Data
 2.3 Organizing Quantitative Data This section will focus on ways to organize quantitative data into tables, charts, and graphs. Quantitative data is organized by dividing the observations into classes
Chapter 2. Descriptive Statistics: Organizing, Displaying and Summarizing Data
 Chapter 2 Descriptive Statistics: Organizing, Displaying and Summarizing Data Objectives Student should be able to Organize data Tabulate data into frequency/relative frequency tables Display data graphically
MATH1635, Statistics (2)
") MATH1635, Statistics (2) Chapter 2 Histograms and Frequency Distributions I. A Histogram is a form of bar graph in which: A. The width of a bar is designated by an interval or ratio data value and thus
MATH1635, Statistics (2) Chapter 2 Histograms and Frequency Distributions I. A Histogram is a form of bar graph in which: A. The width of a bar is designated by an interval or ratio data value and thus
Making Science Graphs and Interpreting Data
 Making Science Graphs and Interpreting Data Eye Opener: 5 mins What do you see? What do you think? Look up terms you don t know What do Graphs Tell You? A graph is a way of expressing a relationship between
Chapter 2: Descriptive Statistics (Part 1)
") Frequency 0 2 4 6 8 12 Chapter 2: Descriptive Statistics (Part 1) 2.1: Frequency Distributions and their Graphs Definition A frequency distribution is something (usually a table) that shows what values
Frequency 0 2 4 6 8 12 Chapter 2: Descriptive Statistics (Part 1) 2.1: Frequency Distributions and their Graphs Definition A frequency distribution is something (usually a table) that shows what values
Courtesy :
 STATISTICS The Nature of Statistics Introduction Statistics is the science of data Statistics is the science of conducting studies to collect, organize, summarize, analyze, and draw conclusions from data.
Ms Nurazrin Jupri. Frequency Distributions
 Frequency Distributions Frequency Distributions After collecting data, the first task for a researcher is to organize and simplify the data so that it is possible to get a general overview of the results.
Table of Contents (As covered from textbook)
") Table of Contents (As covered from textbook) Ch 1 Data and Decisions Ch 2 Displaying and Describing Categorical Data Ch 3 Displaying and Describing Quantitative Data Ch 4 Correlation and Linear Regression
Table of Contents (As covered from textbook) Ch 1 Data and Decisions Ch 2 Displaying and Describing Categorical Data Ch 3 Displaying and Describing Quantitative Data Ch 4 Correlation and Linear Regression
1.3 Graphical Summaries of Data
 Arkansas Tech University MATH 3513: Applied Statistics I Dr. Marcel B. Finan 1.3 Graphical Summaries of Data In the previous section we discussed numerical summaries of either a sample or a data. In this
12. A(n) is the number of times an item or number occurs in a data set.
 is the number of times an item or number occurs in a data set.") Chapter 15 Vocabulary Practice Match each definition to its corresponding term. a. data b. statistical question c. population d. sample e. data analysis f. parameter g. statistic h. survey i. experiment
Chapter 15 Vocabulary Practice Match each definition to its corresponding term. a. data b. statistical question c. population d. sample e. data analysis f. parameter g. statistic h. survey i. experiment
Chapter 1. Looking at Data-Distribution
 Chapter 1. Looking at Data-Distribution Statistics is the scientific discipline that provides methods to draw right conclusions: 1)Collecting the data 2)Describing the data 3)Drawing the conclusions Raw
CHAPTER 2 DESCRIPTIVE STATISTICS
 CHAPTER 2 DESCRIPTIVE STATISTICS 1. Stem-and-Leaf Graphs, Line Graphs, and Bar Graphs The distribution of data is how the data is spread or distributed over the range of the data values. This is one of
CHAPTER 2: SAMPLING AND DATA
 CHAPTER 2: SAMPLING AND DATA This presentation is based on material and graphs from Open Stax and is copyrighted by Open Stax and Georgia Highlands College. OUTLINE 2.1 Stem-and-Leaf Graphs (Stemplots),
Chapter 2: Descriptive Statistics
 Chapter 2: Descriptive Statistics Student Learning Outcomes By the end of this chapter, you should be able to: Display data graphically and interpret graphs: stemplots, histograms and boxplots. Recognize,
Data can be in the form of numbers, words, measurements, observations or even just descriptions of things.
 + What is Data? Data is a collection of facts. Data can be in the form of numbers, words, measurements, observations or even just descriptions of things. In most cases, data needs to be interpreted and
Parents Names Mom Cell/Work # Dad Cell/Work # Parent List the Math Courses you have taken and the grade you received 1 st 2 nd 3 rd 4th
 Full Name Phone # Parents Names Birthday Mom Cell/Work # Dad Cell/Work # Parent email: Extracurricular Activities: List the Math Courses you have taken and the grade you received 1 st 2 nd 3 rd 4th Turn
Raw Data is data before it has been arranged in a useful manner or analyzed using statistical techniques.
 Section 2.1 - Introduction Graphs are commonly used to organize, summarize, and analyze collections of data. Using a graph to visually present a data set makes it easy to comprehend and to describe the
CHAPTER 2. Objectives. Frequency Distributions and Graphs. Basic Vocabulary. Introduction. Organise data using frequency distributions.
 CHAPTER 2 Objectives Organise data using frequency distributions. Distributions and Graphs Represent data in frequency distributions graphically using histograms, frequency polygons, and ogives. Represent
Chapter 5snow year.notebook March 15, 2018
 Chapter 5: Statistical Reasoning Section 5.1 Exploring Data Measures of central tendency (Mean, Median and Mode) attempt to describe a set of data by identifying the central position within a set of data
Statistics can best be defined as a collection and analysis of numerical information.
 Statistical Graphs There are many ways to organize data pictorially using statistical graphs. There are line graphs, stem and leaf plots, frequency tables, histograms, bar graphs, pictographs, circle graphs
Chapter 2 Modeling Distributions of Data
 Chapter 2 Modeling Distributions of Data Section 2.1 Describing Location in a Distribution Describing Location in a Distribution Learning Objectives After this section, you should be able to: FIND and
Graphical Presentation for Statistical Data (Relevant to AAT Examination Paper 4: Business Economics and Financial Mathematics) Introduction
 Introduction") Graphical Presentation for Statistical Data (Relevant to AAT Examination Paper 4: Business Economics and Financial Mathematics) Y O Lam, SCOPE, City University of Hong Kong Introduction The most convenient
Graphical Presentation for Statistical Data (Relevant to AAT Examination Paper 4: Business Economics and Financial Mathematics) Y O Lam, SCOPE, City University of Hong Kong Introduction The most convenient
Averages and Variation
 Averages and Variation 3 Copyright Cengage Learning. All rights reserved. 3.1-1 Section 3.1 Measures of Central Tendency: Mode, Median, and Mean Copyright Cengage Learning. All rights reserved. 3.1-2 Focus
- 1 - Class Intervals
 - 1 - Class Intervals To work with continuous numeric data and to represent it in some sort of a graph or a chart, you have to separate the data into class intervals that is, intervals of equal length.
CHAPTER 2: DESCRIPTIVE STATISTICS Lecture Notes for Introductory Statistics 1. Daphne Skipper, Augusta University (2016)
") CHAPTER 2: DESCRIPTIVE STATISTICS Lecture Notes for Introductory Statistics 1 Daphne Skipper, Augusta University (2016) 1. Stem-and-Leaf Graphs, Line Graphs, and Bar Graphs The distribution of data is
CHAPTER 2: DESCRIPTIVE STATISTICS Lecture Notes for Introductory Statistics 1 Daphne Skipper, Augusta University (2016) 1. Stem-and-Leaf Graphs, Line Graphs, and Bar Graphs The distribution of data is
Further Maths Notes. Common Mistakes. Read the bold words in the exam! Always check data entry. Write equations in terms of variables
 Further Maths Notes Common Mistakes Read the bold words in the exam! Always check data entry Remember to interpret data with the multipliers specified (e.g. in thousands) Write equations in terms of variables
2. The histogram. class limits class boundaries frequency cumulative frequency
 MA 115 Lecture 03 - Some Standard Graphs Friday, September, 017 Objectives: Introduce some standard statistical graph types. 1. Some Standard Kinds of Graphs Last week, we looked at the Frequency Distribution
Statistical Methods. Instructor: Lingsong Zhang. Any questions, ask me during the office hour, or me, I will answer promptly.
 Statistical Methods Instructor: Lingsong Zhang 1 Issues before Class Statistical Methods Lingsong Zhang Office: Math 544 Email: lingsong@purdue.edu Phone: 765-494-7913 Office Hour: Monday 1:00 pm - 2:00
Spell out your full name (first, middle and last)
") Spell out your full name (first, middle and last) Be ready to share the following counts: Number of letters in your full name. Number of vowels Number of consonants Section 2-1 Organizing Data After completing
Spell out your full name (first, middle and last) Be ready to share the following counts: Number of letters in your full name. Number of vowels Number of consonants Section 2-1 Organizing Data After completing
MATH& 146 Lesson 10. Section 1.6 Graphing Numerical Data
 MATH& 146 Lesson 10 Section 1.6 Graphing Numerical Data 1 Graphs of Numerical Data One major reason for constructing a graph of numerical data is to display its distribution, or the pattern of variability
Visualizing Data: Freq. Tables, Histograms
 Visualizing Data: Freq. Tables, Histograms Engineering Statistics Section 1.2 Josh Engwer TTU 25 January 2016 Josh Engwer (TTU) Visualizing Data: Freq. Tables, Histograms 25 January 2016 1 / 23 Descriptive
Downloaded from
 UNIT 2 WHAT IS STATISTICS? Researchers deal with a large amount of data and have to draw dependable conclusions on the basis of data collected for the purpose. Statistics help the researchers in making
Density Curve (p52) Density curve is a curve that - is always on or above the horizontal axis.
 Density curve is a curve that - is always on or above the horizontal axis.") 1.3 Density curves p50 Some times the overall pattern of a large number of observations is so regular that we can describe it by a smooth curve. It is easier to work with a smooth curve, because the histogram
1.3 Density curves p50 Some times the overall pattern of a large number of observations is so regular that we can describe it by a smooth curve. It is easier to work with a smooth curve, because the histogram
UNIT 1A EXPLORING UNIVARIATE DATA
 A.P. STATISTICS E. Villarreal Lincoln HS Math Department UNIT 1A EXPLORING UNIVARIATE DATA LESSON 1: TYPES OF DATA Here is a list of important terms that we must understand as we begin our study of statistics
Lecture Slides. Elementary Statistics Twelfth Edition. by Mario F. Triola. and the Triola Statistics Series. Section 6.2-1
 Lecture Slides Elementary Statistics Twelfth Edition and the Triola Statistics Series by Mario F. Triola Section 6.2-1 Chapter 6 Normal Probability Distributions 6-1 Review and Preview 6-2 The Standard
BUSINESS DECISION MAKING. Topic 1 Introduction to Statistical Thinking and Business Decision Making Process; Data Collection and Presentation
 BUSINESS DECISION MAKING Topic 1 Introduction to Statistical Thinking and Business Decision Making Process; Data Collection and Presentation (Chap 1 The Nature of Probability and Statistics) (Chap 2 Frequency
TIMSS 2011 Fourth Grade Mathematics Item Descriptions developed during the TIMSS 2011 Benchmarking
 TIMSS 2011 Fourth Grade Mathematics Item Descriptions developed during the TIMSS 2011 Benchmarking Items at Low International Benchmark (400) M01_05 M05_01 M07_04 M08_01 M09_01 M13_01 Solves a word problem
STP 226 ELEMENTARY STATISTICS NOTES PART 2 - DESCRIPTIVE STATISTICS CHAPTER 3 DESCRIPTIVE MEASURES
 STP 6 ELEMENTARY STATISTICS NOTES PART - DESCRIPTIVE STATISTICS CHAPTER 3 DESCRIPTIVE MEASURES Chapter covered organizing data into tables, and summarizing data with graphical displays. We will now use
Basic Statistical Terms and Definitions
 I. Basics Basic Statistical Terms and Definitions Statistics is a collection of methods for planning experiments, and obtaining data. The data is then organized and summarized so that professionals can
AP Statistics Summer Assignment:
 AP Statistics Summer Assignment: Read the following and use the information to help answer your summer assignment questions. You will be responsible for knowing all of the information contained in this
Measures of Central Tendency. A measure of central tendency is a value used to represent the typical or average value in a data set.
 Measures of Central Tendency A measure of central tendency is a value used to represent the typical or average value in a data set. The Mean the sum of all data values divided by the number of values in
At the end of the chapter, you will learn to: Present data in textual form. Construct different types of table and graphs
 DATA PRESENTATION At the end of the chapter, you will learn to: Present data in textual form Construct different types of table and graphs Identify the characteristics of a good table and graph Identify
Elementary Statistics. Chapter 2 Review: Summarizing & Graphing Data
 Name Elementary Statistics Date Period Chapter 2 Review: Summarizing & Graphing Data Quick Quiz p.74 #1-10 Use the following information to answer questions 1-3: When one is constructing a table representing
download instant at Summarizing Data: Listing and Grouping
 Ch. 2 download instant at www.easysemester.com Summarizing Data: Listing and Grouping 2.1 Multiple Choice Questions MULTIPLE CHOICE. Choose the one alternative that best completes the statement or answers
Univariate Statistics Summary
 Further Maths Univariate Statistics Summary Types of Data Data can be classified as categorical or numerical. Categorical data are observations or records that are arranged according to category. For example:
Slides Prepared by JOHN S. LOUCKS St. Edward s s University Thomson/South-Western. Slide
 s Prepared by JOHN S. LOUCKS St. Edward s s University 1 Chapter 2 Descriptive Statistics: Tabular and Graphical Presentations Part B Exploratory Data Analysis Crosstabulations and y Scatter Diagrams x
STA Rev. F Learning Objectives. Learning Objectives (Cont.) Module 3 Descriptive Measures
 Module 3 Descriptive Measures") STA 2023 Module 3 Descriptive Measures Learning Objectives Upon completing this module, you should be able to: 1. Explain the purpose of a measure of center. 2. Obtain and interpret the mean, median, and
STA 2023 Module 3 Descriptive Measures Learning Objectives Upon completing this module, you should be able to: 1. Explain the purpose of a measure of center. 2. Obtain and interpret the mean, median, and
Chapter Two: Descriptive Methods 1/50
 Chapter Two: Descriptive Methods 1/50 2.1 Introduction 2/50 2.1 Introduction We previously said that descriptive statistics is made up of various techniques used to summarize the information contained
Chapter 2 Descriptive Statistics I: Tabular and Graphical Presentations. Learning objectives
 Chapter 2 Descriptive Statistics I: Tabular and Graphical Presentations Slide 1 Learning objectives 1. Single variable 1.1. How to use Tables and Graphs to summarize data 1.1.1. Qualitative data 1.1.2.
Prob and Stats, Sep 4
 Prob and Stats, Sep 4 Variations on the Frequency Histogram Book Sections: N/A Essential Questions: What are the methods for displaying data, and how can I build them? What are variations of the frequency
Chapter2 Description of samples and populations. 2.1 Introduction.
 Chapter2 Description of samples and populations. 2.1 Introduction. Statistics=science of analyzing data. Information collected (data) is gathered in terms of variables (characteristics of a subject that
STAT STATISTICAL METHODS. Statistics: The science of using data to make decisions and draw conclusions
 STAT 515 --- STATISTICAL METHODS Statistics: The science of using data to make decisions and draw conclusions Two branches: Descriptive Statistics: The collection and presentation (through graphical and
Slide Copyright 2005 Pearson Education, Inc. SEVENTH EDITION and EXPANDED SEVENTH EDITION. Chapter 13. Statistics Sampling Techniques
 SEVENTH EDITION and EXPANDED SEVENTH EDITION Slide - Chapter Statistics. Sampling Techniques Statistics Statistics is the art and science of gathering, analyzing, and making inferences from numerical information
Describing Data: Frequency Tables, Frequency Distributions, and Graphic Presentation
 Describing Data: Frequency Tables, Frequency Distributions, and Graphic Presentation Chapter 2 McGraw-Hill/Irwin Copyright 2010 by The McGraw-Hill Companies, Inc. All rights reserved. GOALS 1. Organize
Math Tech IIII, Sep 14
 Math Tech IIII, Sep 14 Variations on the Frequency Histogram 2 Book Sections: 2.3 Essential Questions: What are the methods for displaying data, and how can I build them? What are variations of the frequency
STA 570 Spring Lecture 5 Tuesday, Feb 1
 STA 570 Spring 2011 Lecture 5 Tuesday, Feb 1 Descriptive Statistics Summarizing Univariate Data o Standard Deviation, Empirical Rule, IQR o Boxplots Summarizing Bivariate Data o Contingency Tables o Row
Chapter 6: DESCRIPTIVE STATISTICS
 Chapter 6: DESCRIPTIVE STATISTICS Random Sampling Numerical Summaries Stem-n-Leaf plots Histograms, and Box plots Time Sequence Plots Normal Probability Plots Sections 6-1 to 6-5, and 6-7 Random Sampling
Bar Charts and Frequency Distributions
 Bar Charts and Frequency Distributions Use to display the distribution of categorical (nominal or ordinal) variables. For the continuous (numeric) variables, see the page Histograms, Descriptive Stats
Using a percent or a letter grade allows us a very easy way to analyze our performance. Not a big deal, just something we do regularly.
 GRAPHING We have used statistics all our lives, what we intend to do now is formalize that knowledge. Statistics can best be defined as a collection and analysis of numerical information. Often times we
Lecture 3 Questions that we should be able to answer by the end of this lecture:
 Lecture 3 Questions that we should be able to answer by the end of this lecture: Which is the better exam score? 67 on an exam with mean 50 and SD 10 or 62 on an exam with mean 40 and SD 12 Is it fair
Lecture 3 Questions that we should be able to answer by the end of this lecture:
 Lecture 3 Questions that we should be able to answer by the end of this lecture: Which is the better exam score? 67 on an exam with mean 50 and SD 10 or 62 on an exam with mean 40 and SD 12 Is it fair
1.2. Pictorial and Tabular Methods in Descriptive Statistics
 1.2. Pictorial and Tabular Methods in Descriptive Statistics Section Objectives. 1. Stem-and-Leaf displays. 2. Dotplots. 3. Histogram. Types of histogram shapes. Common notation. Sample size n : the number