Local Recoverable Reserves Prediction with Block LU Simulation
|
|
|
- Harvey Richardson
- 5 years ago
- Views:
Transcription
1 Local Recoverable Reserves Prediction with Block LU Simulation Julián Ortiz C. 1 and Clayton V. Deutsch 1 Department of Mining Engineering University of Chile Centre for Computational Geostatistics (CCG) University of Alberta Prediction of local recoverable reserves is an important problem in ore reserve evaluation. The relatively wide spacing of exploration data leads to unavoidable uncertainty in the grades at unsampled locations. Deterministic methods such as kriging do not explicitly account for this lack of perfect information and the anticipated selectivity of the mining operation. We present a methodology and software for assessing recoverable reserves at selective mining unit (SMU) resolution over larger production panels. These reserves and their uncertainty are calculated by performing matrix (LU) simulation at a fine resolution over panels, and then scaling these simulated models to SMU size to calculate the expected tonnage and average grade above several cutoffs. Measures of uncertainty in the SMU grade distribution in the panels are also presented and future enhancements are discussed. Introduction This paper presents a technique to predict local recoverable reserves in a single pass without storing and processing multiple simulated realizations. The approach consists on considering panels of a relatively large size, where the distribution of selective mining units (SMUs) is estimated by locally simulating the grade values via the matrix decomposition (LU) method (Davis, 1987). We first review the existing methods for estimating recoverable reserves. Then, the proposed methodology is described along with the program that has been implemented. The method of local LU has been around for a while (see Glacken, 1996); this paper presents the methodology and a GSLIB-like program. The paper concludes with a case study where we show the use of the program and discuss possible enhancements and conclusions. Review of Existing Methods There are many techniques for recoverable reserves estimation. They may be grouped into (1) global recoverable reserves estimation, () deterministic mapping, (3) probabilistic mapping, and (4) simulation. Global recoverable reserves estimation without any local precision is possible by correcting a representative data-scale histogram (Isaaks and Srivastava, 1989). The distribution of sample values, usually composited to a constant volume, are used to build a declustered histogram, that is, one where the relative frequencies assigned to each sample are corrected to account for the spatial clustering due to preferential sampling commonly found in exploration campaigns. The representative histogram can be obtained with many techniques, such as polygonal weighting, cell declustering, and declustering based on the accumulation of ordinary kriging weights. This representative histogram is then corrected to account for the volumes of the anticipated selective mining units. The results provide no local precision, but could be used to calibrate deterministic mapping. Volume-variance relations based on average variogram values are used to calculate the variance reduction from the exploration data to the SMU scale. Recalling the expression for calculating the dispersion variance of the regionalized variable measured over a volume v within a larger domain of volume V : D ( v V ) = γ ( V, V ) γ ( v, v) 1 where γ ( v, v) = γ( y y') dy dy' represents the average variogram value with the head and tail v v v of a separation vector spanning the corresponding volume v (Journel and Huijbregts, 1978). In the case of global recoverable reserves, the volumes of interest are v = volume of a SMU and V =volume of the entire 304-1
2 domain or deposit. The dispersion variance reflects the expected variability around the mean of grades measured over volumes the size of a SMU. Once the variance of SMUs over the domain is known, the variance reduction factor can be calculated as: D ( A) D ( v A) γ ( A, A) γ ( v, v) γ ( v, v) f = = 1 = D ( A) γ ( A, A) γ (, ) σ The variance reduction factor is the standardized difference between the dispersion variance of points within the domain and blocks within the domain. Each one can be replaced by the corresponding average variograms and these can be simplified, since γ ( A, A) = σ and γ (, ) = 0. σ is the representative sample variance. A change of shape model must be applied to adjust the sample histogram, which is considered at point support, to the volumetric support of the SMU ( v ). Several models are available: affine correction, indirect lognormal correction and the discrete Gaussian model are the more popular. The tonnage above cutoff and the grade above cutoff can be calculated from the corrected histograms (Figure 1). Deterministic mapping such as kriging or inverse distance does not account for uncertainty due to widely spaced data. In areas where the samples are sparse, the estimated grades appear smooth and all approach the local or global mean. This gives an unrealistic sense of low variability. These techniques could be calibrated to give similar global results to the corrected global estimation mentioned above. This is done at a cost of a higher conditional bias of the estimated grades as compared to the actual grades that are eventually mined out. Ordinary kriging with a restricted search is very common in the mining industry (Figure ). Probabilistic mapping techniques are based on kriging and provide a local probability distribution. The methods include indicator kriging (IK), multivariate Gaussian kriging (MG), disjunctive kriging (DK), uniform conditioning (UC) and other variants. Indicator kriging (Journel, 1983; Journel and Alabert, 1989) estimates the probability of not exceeding several cutoffs, by performing simple or ordinary kriging over indicator coded sample values. This procedure is repeated at different thresholds and requires the estimation and modeling of an indicator variogram for each cutoff. The estimated probabilities are used to construct a discretized conditional distribution, which allows inferring the local uncertainty at point support. This distribution can be corrected to account for change of support, providing a model for the local uncertainty of block grades. Incorporating secondary variables and managing trends is possible, but cumbersome. MutliGaussian kriging (Verly, 1983) approaches the problem by considering that the normally transformed samples are distributed as a multigaussian variable. Under this assumption, the conditional distributions can be calculated with ease, since the local mean and variance of the conditional distributions, the only parameters required to fully define the full local distribution, are provided by the simple kriging mean and kriging variance. The quantiles of these distributions can be backtransformed to give any summary statistic required for characterizing the uncertainty (Ortiz and Deutsch, 004). Trends and change of support are problematic with this method, mainly, because of theoretical reasons: ordinary kriging should not be used for estimating the parameters of the local distributions, and values do not average linearly in transformed units, hence, change of support should not be done by block kriging the normally transformed values. Considering secondary variables is not straightforward. Disjunctive kriging is rarely used because of its theoretical complexity (Rendu, 1980; Rivoirard, 1994). The method estimates any function of the samples by decomposing this function in an infinite series of polynomials, whose coefficients must be estimated. The lack of flexible commercial software for using DK has provoked its selfish use in industrial applications. Uniform conditioning (Remacre, 1989) aims at determining the distribution of blocks within a panel, by proceeding in two steps: firstly, an ordinary kriging estimation of the grades of large panels is done to define the local conditioning value for the second step, which is to compute the 304-
3 distribution of block (SMU) grades within the panel, conditional to its estimated value, by means of a change of support model, based on a bivariate Gaussian assumption of the distribution of blocks and panels. This method allows accounting for local fluctuations in the average grade, but cannot straightforwardly account for secondary information. These techniques are not that common because they depend heavily on stationarity and are sensitive to many modeling decisions. These techniques are awkward to implement in presence of multiple variables and anticipated grade control practices. They are proven successful in cases where they can be calibrated to actual production data. The simulation alternative consists of simulating a large part of the deposit at a high resolution, scaling the realizations to an SMU scale and accounting for the results (Journel, 1974; Gómez-Hernández and Journel, 199). This is the modern approach to calculate the recoverable reserves. Among the advantages of this approach, one can mention the consistency of the fine resolution model when considering change of support to several block sizes and the possibility to account for secondary variables and trends. Also, the simulation approach provides realizations that can be used to emulate the performance of the large volumes in relation to grade uncertainty, metallurgical recovery, grade control, etc. The simulated realizations allow accounting for joint uncertainty, that is, the uncertainty over a function that considers several points at the same time. Advanced applications consist of simulating the grade control procedures such as the spacing of grade control samples, sample error, and estimation such as blasthole kriging. One of the main limitations of approaching the problem of estimating recoverable reserves by simulation is the size of the models. This complicates the handling and storage of the models and also requires a significantly large CPU time to compute the large number of realizations. We propose an approach that keeps the advantage of a full simulation study, but allows a much faster and direct computation of the summary statistics of interest. Local LU Simulation Rather than simulating the full domain of interest, which can account for several millions of nodes in a high resolution model, we propose a local simulation approach, where panels are considered independent from each other and the computation of recoverable reserves is done on a SMU scale within the panels and considering the local information. This idea of moving neighborhood LU simulation has been around for some time. The thesis of Ian Glacken (1996) presents a comprehensive review of the method (Glacken, 1997). The method works as illustrated in Figure 3, by considering a panel and the SMUs within it. A single search is done to find the nearest samples in the neighborhood. These samples will condition the simulation of a high resolution local simulation, which is performed with the matrix decomposition algorithm considering the discretization nodes of the panel. The LU simulation algorithm provides an appropriate tool for the fast simulation of several hundreds joint realizations of the discretization points within the panel. The method requires: Transforming the data to a standard Gaussian distribution. Calculate and model the variogram of these normally transformed data. Compute the covariance matrix for the locations of the available data in the search neighborhood and the locations of the discretizing nodes within the panel. Decompose the covariance matrix via the Cholesky decomposition into a lower and an upper triangular matrix. This decomposition also implies that the upper triangular matriz is equal to the transpose of the lower triangular matrix. Compute simulated values for the nodes within the panel, by multiplying the lower triangular matrix with a vector of random normal deviates. This operation can be quickly repeated several hundreds (or thousands) times
4 Back-transform the simulated values to grade units. These simulated values are then internally stored and manipulated to calculate and display relevant statistics. The resulting models from the LU simulation within a panel can be easily handled to calculate the mean grade of the panel, the distribution of SMU grades within the panel which can be summarized as the variance of SMU grades with respect to the average panel grade for a specific simulation, or with respect to the global average value of the panel, the expected proportion of SMUs and their grade, above a specified cutoff, etc. Since the software works like a kriging program, the size of the model is not a significant limitation. The only limit is derived from the number of nodes with which the panel is discretized. Furthermore, the manipulation of multiple realizations operates behind the scenes, easing the work of the practitioner. The program can be modified to provide any relevant summary statistics. BLUSIM Program The BLUSIM program was assembled from the KT3D and LUSIM codes in GSLIB with significant modifications to post process the local distributions. The program runs as a GSLIB program (Deutsch and Journel, 1998). Input parameters A parameter file is created when first run (Figure 4). The parameter file requires the following: Information about the sample data (lines 5 to 7): Name of the datafile, columns for the coordinates X, Y, Z and the variable and declustering weight, trimming limits to discard missing values coded with a particular value. Transformation options (lines 8 to 15): The program offers the possibility of using the original sample data or an already transformed database, name of the transformation table (for checking), switch to consider a reference distribution. If turned off, the transformation is done considering the weighted sample distribution as the reference, name of the file with the reference distribution, columns for variable and declustering weight on the reference distribution file, and lower and upper tail options. Debugging options (lines 16 and 17): Debugging level. If set to three or higher, large amounts of information about the calculations will be done, debugging file. It stores all the information. This file can be considerably large if a high debugging level is used, and as an additional feature, the program writes out the last full realization at point and SMU support, for checking purposes. These are automatically output in files: dbgsim.out and dbgsmu.out. Simulation grid and discretization parameters (lines 19 to 4): Number of realizations for panel and SMU statistics calculations, grid definition for panel support, number of SMUs per panel, panel total discretization. Cutoff reporting parameters (lines 5 to 6): The number of cutoffs for reporting the proportion and grade of SMUs within the panel, and the cutoffs considered. Seed for random number generator (line 7) Search parameters for nearby samples (lines 8 to 31): Minimum and maximum number of samples in the neighborhood for simulation, Maximum samples per octant, if octant search is on, and search radii and angles for the search ellipsoid. Variogram model parameters (lines 3 to 34): Nugget effect and number of nested structures for the three-dimensional variogram model, variogram type, sill contribution, angles and ranges for each variogram structure considered
5 Output results The program outputs a file that contains, for every panel, the following summary statistics: Panel average grade Average variance of the SMU grades within the panel with respect to the average grade of the panel for each particular realization Average variance of all the SMU simulated grades (for all SMU within the panel and for all realizations) within the panel with respect to the average grade of the panel Mean grade of SMUs above cutoffs Proportion of SMUs within the panel above cutoff As mentioned earlier, to check the results, the program also outputs one full point and SMU realization. Examples BLUSIM can be used to provide point support statistics, by not discretizing the panel, that is, by considering a panel with only one SMU, with a single discretizing point at its center. A result equivalent to applying multigaussian kriging at a point support is then obtained. To check the program, a dataset of copper grades is used. BLUSIM and KT3D are compared, when working in Gaussian units, that is, using the dataset already transformed to a standard normal distribution as input. Figure 5 shows the comparison of these results: First, the comparison of mean and variance is done for the results in Gaussian units of BLUSIM and the result of performing NSCORE transformation of the sample values and then running KT3D for the estimation of the ordinary kriging mean and variance of the points. Slight differences are due to precision in BLUSIM, since only 1000 realizations of the point values are calculated. KT3D provides the exact calculation of the variance. Second, a comparison of block simulation in Gaussian units is done. A bias in the estimation of the variance can be seen for high valued blocks, which can be explained by the difficulty in obtaining by simulation very high values to reproduce correctly the true variance obtained by multigaussian kriging. Third, a point simulation of grades is done, to check if the back transformed values are correctly computed. These values are compared with the post-processed multigaussian kriging results with POSTMG. The result is quite good and the differences can be assigned to the precision of BLUSIM due to the number of realizations (1000) and to the post-processing of the multigaussian kriging results to estimate the variance in original units. The last test shows the comparison of the statistics of block simulated values computed with BLUSIM and those calculated by multigaussian kriging. Notice that in multigaussian kriging the back transformation is done from the Gaussian average of simulated nodes within each block and considering the transformation table at point support. This is not theoretically correct and it explains the bias in mean and variance. A second example is prepared to show the assessment of uncertainty that provides BLUSIM. The same copper data are used to compute panel grades and the dispersion of SMU grades within the panels. Results are illustrated in Figure 6. Figure 7 shows the computation of mean grades and proportions above increasing cutoffs. This allows the calculation of recoverable reserves above the cutoff grade and could also be used to forecast the dilution expected during mining, since higher SMU variability within panels implies more complicated selection in grade control. Figure 8 shows a realization of the point values and the SMU values. The obvious discontinuity seen between panels is explained by the fact that each panel is simulated independently hence no correlation 304-5
6 across the boundary of a panel is used to simulate the adjacent panels. However, it is clear that inside each panel, point grade simulated show spatial correlation. Discussion and Proposed Future Work Although this a fairly straightforward implementation of the idea of locally simulating the grades in a fine grid and then getting block averaged statistics for uncertainty quantification, there are several possible extensions that could be of interest: We could enhance the method to simulate mining (add sampling errors, simulate grade control and dilution, simulate the scaling to trucks, classify based on the estimated grades, then report the true results). Other measures of heterogeneity for the values within the block could be reported. One is to calculate the kriged surface (in Gaussian units) and to calculate a gradient of that surface. A second idea is to quantify the dispersion of the grades/smus within the mining volume. Something is going on whenever the proportion/tonnage of ore differs from 0 or the full tonnage of the mining volume (T). The two principal reasons are (1) uncertainty due to sparse data, and () the natural variability of the grades in the volume. We could devise a simple measure of how much the Δ from 0/T is due to sparse data and how much is due to local geological variability. We should report measures of uncertainty such as scaled up probability to be within a probabilistic tolerance this could be used to support a geometric classification of resources. Consider reading in a high resolution rock type model and simulate only within a specified rock type. The program could consider only one rock type at a time. Perhaps we simulate the entire block as the rock type under consideration and report a fraction of the block that the results apply to. It may be important to consider multiple correlated variables under a full LMC or a Markov model. This may be important for practical problems. It would be easy to convert all secondary elements/assays to the primary one under an equivalent grade model. More complex calculations that include grade tonnage curves are probably beyond the scope of our analysis. An important modern consideration is the consideration of multiple ore dispositions (e.g., stockpile, leach, or plant). We should at least discuss this and comment on how the approach could be tailored to calculate the probability that the SMUs should report to each disposition associated to tonnage. Conclusions Predicting local recoverable reserves with exploration data is a critical problem. The program presented here combines the best features of simulation and estimation to lead to direct predictions of local reserves. It allows inferring the variability of SMUs within panels and the expected proportion and grade above cutoff to determine the recoverable reserves. The methodology permits forecasting the recoverable reserves for long term planning, from drillhole sample data. It can incorporate other factors affecting the recovery, such as sampling errors, dilution, and could be adapted to better understand the uncertainty due to data sparcity and due to geological heterogeneity. Acknowledgements The authors thank the industry sponsors of the Centre for Computational Geostatistics at the University of Alberta for financial support. Dr. Deutsch holds the Alberta Chamber of Resources Industry Chair in Mining Engineering. Dr. Ortiz acknowledges the support of Codelco Chile at the Department of Mining Engineering, University of Chile
7 References Davis, M. W., Production of conditional simulations via the LU triangular decomposition of the covariance matrix. Mathematical Geology, vol. 19, no., 1987, p Deutsch, C.V. and Journel, A.G., 1998, GSLIB: Geostatistical Software Library: and User s Guide. Oxford University Press, New York, nd Ed. Glacken, I. M., Change of Support and Use of Economic Parameters for Block Selection, in Geostatistics Wollongong '96, E. Y. Baafi and N. A. Schofield (eds.), volume, pages , Kluwer, Gómez-Hernández, J. J., and Journel, A. G. Joint Sequential Simulation of Multigaussian Fields. In Geostat Troia 199, ed. Soares, Kluwer Publ., 199. Isaaks E. and Srivastava R., 1989, An Introduction to applied geostatistics, Oxford University Press, New York Journel, A. G. Geostatistics for conditional simulation of orebodies, Economic Geology, Vol. 69, p , Journel, A. G. Nonparametric estimation of spatial distribution. Mathematical Geology, 15(3): , Journel, A. G., and Alabert, F. Non-Gaussian data expansion in the Earth Sciences. Terra Nova, 1:13 134, Journel, A. G., and Huijbregts, C. J., Mining geostatistics, London: Academic Press, 1978, 600 p. Ortiz, J. M., and Deutsch, C. V., A Methodology to Assess Block Grade Uncertainty, CIM Conference and Exhibition, Edmonton 004, May 9 to 1, 004. Remacre, A. Z. Uniform conditioning versus indicator kriging, in Geostatistics, M. Armstrong (ed.), Volume, pages , Kluwer, Rendu, J.-M., Disjunctive Kriging: Comparison of Theory with Actual Results, Mathematical Geology, 1(4): , 1980 Rivoirard, J. Introduction to disjunctive kriging and nonlinear geostatistics. 1994, Oxford, Oxford University Press. Verly, G. The multigaussian approach and its applications to the estimation of local reserves. Mathematical Geology, 15():59 86, Figure 1: Point and block support distributions of copper grades. The block support distribution was calculated by affine correction from the point support declustered histogram
8 Figure : Quantile-quantile plots showing the comparison between the distribution of block estimated obtained by ordinary kriging and the expected block grade distribution. As the search neighborhood is constrained, the distribution of estimated block grades increases its variance, appearing closer to the distribution of actual block grades. Figure 3: schematic -D illustration of the problem setting including the local neighborhood, exploration data, a mining volume discretized by some number of points and SMUs within the mining volume
9 1 Parameters for BLUSIM ********************* 3 4 START OF PARAMETERS: 5 cluster.dat -file with data columns for X,Y,Z,var,wt 7-1.0e1 1.0e1 - trimming limits 8 1 -transform the data (0=no, 1=yes) 9 blusim.trn - file for output trans table consider ref. dist (0=no, 1=yes) 11 histsmth.out - file with ref. dist distribution columns for vr and wt zmin,zmax(tail extrapolation) lower tail option, parameter upper tail option, parameter debugging level: 0,1,,3 17 blusim.dbg -file for debugging output 18 blusim.out -file for kriged output number of realizations to generate nx,xmn,xsiz - Pannel Size ny,ymn,ysiz nz,zmn,zsiz nbx,nby,nbz- SMUs per Pannel x,y and z block discretization 5 5 -number of cutoffs for reporting cutoffs random number seed min, max data for kriging 9 0 -max per octant (0-> not used) maximum search radii angles for search ellipsoid nst, nugget effect it,cc,ang1,ang,ang a_hmax, a_hmin, a_vert Figure 4: parameter file for BLUSIM
, panel grades estimated for 40 x 40 x 1m 3 (top right), and two")
 and variance of the simulated SMU grades with respect to the average panel value computed globally (bottom")
10 Figure 5: Comparison of BLUSIM with multigaussian kriging using KT3D of the normal scores and POSTMG for back-transformation. Figure 6: Location map of the copper data used for the example (top left), panel grades estimated for 40 x 40 x 1m 3 (top right), and two maps showing measures of dispersion within the panels: average variance of SMU grades with respect of the panel simulated grade over all realizations (bottom left) and variance of the simulated SMU grades with respect to the average panel value computed globally (bottom right)


11 Figure 7: Mean grades and proportions of SMU within panels above increasing cutoffs

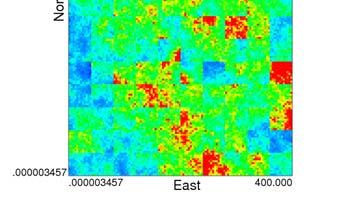


12 Figure 8: A point and SMU realization for checking
Indicator Simulation for Categorical Variables
 Reservoir Modeling with GSLIB Indicator Simulation for Categorical Variables Sequential Simulation: the Concept Steps in Sequential Simulation SISIM Program Sequential Simulation: the Concept 2 1 3 1.
Geostatistical Reservoir Characterization of McMurray Formation by 2-D Modeling
 Geostatistical Reservoir Characterization of McMurray Formation by 2-D Modeling Weishan Ren, Oy Leuangthong and Clayton V. Deutsch Department of Civil & Environmental Engineering, University of Alberta
Indicator Simulation Accounting for Multiple-Point Statistics
 Indicator Simulation Accounting for Multiple-Point Statistics Julián M. Ortiz 1 and Clayton V. Deutsch 2 Geostatistical simulation aims at reproducing the variability of the real underlying phenomena.
Modeling Multiple Rock Types with Distance Functions: Methodology and Software
 Modeling Multiple Rock Types with Distance Functions: Methodology and Software Daniel A. Silva and Clayton V. Deutsch The sub division of the deposit into estimation domains that are internally consistent
Selected Implementation Issues with Sequential Gaussian Simulation
 Selected Implementation Issues with Sequential Gaussian Simulation Abstract Stefan Zanon (szanon@ualberta.ca) and Oy Leuangthong (oy@ualberta.ca) Department of Civil & Environmental Engineering University
Direct Sequential Co-simulation with Joint Probability Distributions
 Math Geosci (2010) 42: 269 292 DOI 10.1007/s11004-010-9265-x Direct Sequential Co-simulation with Joint Probability Distributions Ana Horta Amílcar Soares Received: 13 May 2009 / Accepted: 3 January 2010
A Program for Robust Calculation of Drillhole Spacing in Three Dimensions
 A Program for Robust Calculation of Drillhole Spacing in Three Dimensions David F. Machuca Mory and Clayton V. Deutsch Centre for Computational Geostatistics (CCG) Department of Civil & Environmental Engineering
Short Note: Some Implementation Aspects of Multiple-Point Simulation
 Short Note: Some Implementation Aspects of Multiple-Point Simulation Steven Lyster 1, Clayton V. Deutsch 1, and Julián M. Ortiz 2 1 Department of Civil & Environmental Engineering University of Alberta
A Geostatistical and Flow Simulation Study on a Real Training Image
 A Geostatistical and Flow Simulation Study on a Real Training Image Weishan Ren (wren@ualberta.ca) Department of Civil & Environmental Engineering, University of Alberta Abstract A 12 cm by 18 cm slab
Non Stationary Variograms Based on Continuously Varying Weights
 Non Stationary Variograms Based on Continuously Varying Weights David F. Machuca-Mory and Clayton V. Deutsch Centre for Computational Geostatistics Department of Civil & Environmental Engineering University
The Proportional Effect: What it is and how do we model it?
 The Proportional Effect: What it is and how do we model it? John Manchuk Centre for Computational Geostatistics Department of Civil & Environmental Engineering University of Alberta One of the outstanding
Using Blast Data to infer Training Images for MPS Simulation of Continuous Variables
 Paper 34, CCG Annual Report 14, 212 ( 212) Using Blast Data to infer Training Images for MPS Simulation of Continuous Variables Hai T. Nguyen and Jeff B. Boisvert Multiple-point simulation (MPS) methods
Application of MPS Simulation with Multiple Training Image (MultiTI-MPS) to the Red Dog Deposit
 to the Red Dog Deposit") Application of MPS Simulation with Multiple Training Image (MultiTI-MPS) to the Red Dog Deposit Daniel A. Silva and Clayton V. Deutsch A Multiple Point Statistics simulation based on the mixing of two
Application of MPS Simulation with Multiple Training Image (MultiTI-MPS) to the Red Dog Deposit Daniel A. Silva and Clayton V. Deutsch A Multiple Point Statistics simulation based on the mixing of two
Multiple Point Statistics with Multiple Training Images
 Multiple Point Statistics with Multiple Training Images Daniel A. Silva and Clayton V. Deutsch Abstract Characterization of complex geological features and patterns has been one of the main tasks of geostatistics.
USE OF DIRECT AND INDIRECT DISTRIBUTIONS OF SELECTIVE MINING UNITS FOR ESTIMATION OF RECOVERABLE RESOURCE/RESERVES FOR NEW MINING PROJECTS
 USE OF DIRECT AND INDIRECT DISTRIBUTIONS OF SELECTIVE MINING UNITS FOR ESTIMATION OF RECOVERABLE RESOURCE/RESERVES FOR NEW MINING PROJECTS W Assibey-Bonsu 1 and D G Krige 2 1 Gold Fields Limited, South
Tensor Based Approaches for LVA Field Inference
 Tensor Based Approaches for LVA Field Inference Maksuda Lillah and Jeff Boisvert The importance of locally varying anisotropy (LVA) in model construction can be significant; however, it is often ignored
Programs for MDE Modeling and Conditional Distribution Calculation
 Programs for MDE Modeling and Conditional Distribution Calculation Sahyun Hong and Clayton V. Deutsch Improved numerical reservoir models are constructed when all available diverse data sources are accounted
Multivariate Standard Normal Transformation
 Multivariate Standard Normal Transformation Clayton V. Deutsch Transforming K regionalized variables with complex multivariate relationships to K independent multivariate standard normal variables is an
Flexible Lag Definition for Experimental Variogram Calculation
 Flexible Lag Definition for Experimental Variogram Calculation Yupeng Li and Miguel Cuba The inference of the experimental variogram in geostatistics commonly relies on the method of moments approach.
Sampling informative/complex a priori probability distributions using Gibbs sampling assisted by sequential simulation
 Sampling informative/complex a priori probability distributions using Gibbs sampling assisted by sequential simulation Thomas Mejer Hansen, Klaus Mosegaard, and Knud Skou Cordua 1 1 Center for Energy Resources
VARFIT: A Program for Semi-Automatic Variogram Modelling
 VARFIT: A Program for Semi-Automatic Variogram Modelling Paula F. Larrondo (larrondo@ualberta.ca), Chad T. Neufeld (neufeld@ualberta.ca), and Clayton V. Deutsch (cdeutsch@ualberta.ca) Department of Civil
High Resolution Geomodeling, Ranking and Flow Simulation at SAGD Pad Scale
 High Resolution Geomodeling, Ranking and Flow Simulation at SAGD Pad Scale Chad T. Neufeld, Clayton V. Deutsch, C. Palmgren and T. B. Boyle Increasing computer power and improved reservoir simulation software
The Components of Geostatistical Simulation
 This file was created by scanning the printed publication. Errors identified by the software have been corrected; however, some errors may remain. The Components of Geostatistical Simulation Carol A. ~otwayl
Improvements in Continuous Variable Simulation with Multiple Point Statistics
 Improvements in Continuous Variable Simulation with Multiple Point Statistics Jeff B. Boisvert A modified version of Mariethoz et al s (2010) algorithm for simulating continuous variables using multiple
Markov Bayes Simulation for Structural Uncertainty Estimation
 P - 200 Markov Bayes Simulation for Structural Uncertainty Estimation Samik Sil*, Sanjay Srinivasan and Mrinal K Sen. University of Texas at Austin, samiksil@gmail.com Summary Reservoir models are built
Projection Pursuit Multivariate Transform
 Projection Pursuit Multivariate Transform Ryan M. Barnett, John G. Manchuk, and Clayton V. Deutsch Transforming complex multivariate geological data to be multivariate Gaussian is an important and challenging
Geostatistical modelling of offshore diamond deposits
 Geostatistical modelling of offshore diamond deposits JEF CAERS AND LUC ROMBOUTS STANFORD UNIVERSITY, Department of Petroleum Engineering, Stanford, CA 94305-2220, USA jef@pangea.stanford.edu TERRACONSULT,
CONDITIONAL SIMULATION OF TRUNCATED RANDOM FIELDS USING GRADIENT METHODS
 CONDITIONAL SIMULATION OF TRUNCATED RANDOM FIELDS USING GRADIENT METHODS Introduction Ning Liu and Dean S. Oliver University of Oklahoma, Norman, Oklahoma, USA; ning@ou.edu The problem of estimating the
Simulating Geological Structures Based on Training Images and Pattern Classifications
 Simulating Geological Structures Based on Training Images and Pattern Classifications P. Switzer, T. Zhang, A. Journel Department of Geological and Environmental Sciences Stanford University CA, 9435,
Geostatistics 2D GMS 7.0 TUTORIALS. 1 Introduction. 1.1 Contents
 GMS 7.0 TUTORIALS 1 Introduction Two-dimensional geostatistics (interpolation) can be performed in GMS using the 2D Scatter Point module. The module is used to interpolate from sets of 2D scatter points
Spatial Interpolation & Geostatistics
 (Z i Z j ) 2 / 2 Spatial Interpolation & Geostatistics Lag Lag Mean Distance between pairs of points 11/3/2016 GEO327G/386G, UT Austin 1 Tobler s Law All places are related, but nearby places are related
Variogram Inversion and Uncertainty Using Dynamic Data. Simultaneouos Inversion with Variogram Updating
 Variogram Inversion and Uncertainty Using Dynamic Data Z. A. Reza (zreza@ualberta.ca) and C. V. Deutsch (cdeutsch@civil.ualberta.ca) Department of Civil & Environmental Engineering, University of Alberta
Trend Modeling Techniques and Guidelines
 Trend Modeling Techniques and Guidelines Jason A. M c Lennan, Oy Leuangthong, and Clayton V. Deutsch Centre for Computational Geostatistics (CCG) Department of Civil and Environmental Engineering University
University of Alberta. Multivariate Analysis of Diverse Data for Improved Geostatistical Reservoir Modeling
 University of Alberta Multivariate Analysis of Diverse Data for Improved Geostatistical Reservoir Modeling by Sahyun Hong A thesis submitted to the Faculty of Graduate Studies and Research in partial fulfillment
A workflow to account for uncertainty in well-log data in 3D geostatistical reservoir modeling
 A workflow to account for uncertainty in well-log data in 3D geostatistical reservoir Jose Akamine and Jef Caers May, 2007 Stanford Center for Reservoir Forecasting Abstract Traditionally well log data
B002 DeliveryMassager - Propagating Seismic Inversion Information into Reservoir Flow Models
 B2 DeliveryMassager - Propagating Seismic Inversion Information into Reservoir Flow Models J. Gunning* (CSIRO Petroleum) & M.E. Glinsky (BHP Billiton Petroleum) SUMMARY We present a new open-source program
DISTRIBUTION STATEMENT A Approved for public release: distribution unlimited.
 AVIA Test Selection through Spatial Variance Bounding Method for Autonomy Under Test By Miles Thompson Senior Research Engineer Aerospace, Transportation, and Advanced Systems Lab DISTRIBUTION STATEMENT
2D Geostatistical Modeling and Volume Estimation of an Important Part of Western Onland Oil Field, India.
 and Volume Estimation of an Important Part of Western Onland Oil Field, India Summary Satyajit Mondal*, Liendon Ziete, and B.S.Bisht ( GEOPIC, ONGC) M.A.Z.Mallik (E&D, Directorate, ONGC) Email: mondal_satyajit@ongc.co.in
Integration of Geostatistical Modeling with History Matching: Global and Regional Perturbation
 Integration of Geostatistical Modeling with History Matching: Global and Regional Perturbation Oliveira, Gonçalo Soares Soares, Amílcar Oliveira (CERENA/IST) Schiozer, Denis José (UNISIM/UNICAMP) Introduction
Spatial Interpolation & Geostatistics
 (Z i Z j ) 2 / 2 Spatial Interpolation & Geostatistics Lag Lag Mean Distance between pairs of points 1 Tobler s Law All places are related, but nearby places are related more than distant places Corollary:
Datamine Solutions for Industrial Minerals and Construction Materials, including Dimension Stones.
 Datamine Solutions for Industrial Minerals and Construction Materials, including Dimension Stones. Datamine Overview Global Presence 250 staff in 12 countries Canada, USA, Peru, Chile, Mexico, Brazil,
Spatial Interpolation - Geostatistics 4/3/2018
 Spatial Interpolation - Geostatistics 4/3/201 (Z i Z j ) 2 / 2 Spatial Interpolation & Geostatistics Lag Distance between pairs of points Lag Mean Tobler s Law All places are related, but nearby places
Geostatistics on Stratigraphic Grid
 Geostatistics on Stratigraphic Grid Antoine Bertoncello 1, Jef Caers 1, Pierre Biver 2 and Guillaume Caumon 3. 1 ERE department / Stanford University, Stanford CA USA; 2 Total CSTJF, Pau France; 3 CRPG-CNRS
Gridding and Contouring in Geochemistry for ArcGIS
 Gridding and Contouring in Geochemistry for ArcGIS The Geochemsitry for ArcGIS extension includes three gridding options: Minimum Curvature Gridding, Kriging and a new Inverse Distance Weighting algorithm.
surface but these local maxima may not be optimal to the objective function. In this paper, we propose a combination of heuristic methods: first, addi
 MetaHeuristics for a Non-Linear Spatial Sampling Problem Eric M. Delmelle Department of Geography and Earth Sciences University of North Carolina at Charlotte eric.delmelle@uncc.edu 1 Introduction In spatial
Calibration of NFR models with interpreted well-test k.h data. Michel Garcia
 Calibration of NFR models with interpreted well-test k.h data Michel Garcia Calibration with interpreted well-test k.h data Intermediate step between Reservoir characterization Static model conditioned
Multiple-point geostatistics: a quantitative vehicle for integrating geologic analogs into multiple reservoir models
 Multiple-point geostatistics: a quantitative vehicle for integrating geologic analogs into multiple reservoir models JEF CAERS AND TUANFENG ZHANG Stanford University, Stanford Center for Reservoir Forecasting
The Effect of Changing Grid Size in the Creation of Laser Scanner Digital Surface Models
 The Effect of Changing Grid Size in the Creation of Laser Scanner Digital Surface Models Smith, S.L 1, Holland, D.A 1, and Longley, P.A 2 1 Research & Innovation, Ordnance Survey, Romsey Road, Southampton,
SOME PRACTICAL COMPUTATIONAL ASPECTS OF MINE PLANNING
 M. Guarascio et al (eds.), Advanced Geostatistics in the Mining Industry, 391-399. All Rights Reserved. Copyright 1976 by D. Reidel Publishing Company, Dordrecht-Holland. SOME PRACTICAL COMPUTATIONAL ASPECTS
Nonparametric regression using kernel and spline methods
 Nonparametric regression using kernel and spline methods Jean D. Opsomer F. Jay Breidt March 3, 016 1 The statistical model When applying nonparametric regression methods, the researcher is interested
Rotation and affinity invariance in multiple-point geostatistics
 Rotation and ainity invariance in multiple-point geostatistics Tuanfeng Zhang December, 2001 Abstract Multiple-point stochastic simulation of facies spatial distribution requires a training image depicting
Surface Smoothing Using Kriging
 1 AutoCAD Civil 3D has the ability to add data points to a surface based on mathematical criteria. This gives you the ability to strengthen the surface definition in areas where data may be sparse or where
A Geostatistical Study to Quantify Uncertainty in Tailings Fines Content as a Function of Data Spacing AND
 A Geostatistical Study to Quantify Uncertainty in Tailings Fines Content as a Function of Data Spacing AND Workflow and Software Guide for Constructing a Three Dimensional Geostatistical Model of a Tailings
CONDITIONING FACIES SIMULATIONS WITH CONNECTIVITY DATA
 CONDITIONING FACIES SIMULATIONS WITH CONNECTIVITY DATA PHILIPPE RENARD (1) and JEF CAERS (2) (1) Centre for Hydrogeology, University of Neuchâtel, Switzerland (2) Stanford Center for Reservoir Forecasting,
Crosswell Tomographic Inversion with Block Kriging
 Crosswell Tomographic Inversion with Block Kriging Yongshe Liu Stanford Center for Reservoir Forecasting Petroleum Engineering Department Stanford University May, Abstract Crosswell tomographic data can
Implicit Boundary Modeling (BOUNDSIM)
") Implicit Boundary Modeling (BOUNDSIM) Jason A. McLennan and Clayton V. Deutsch Centre for Computational Geostatistics Department of Civil & Environmental Engineering University of Alberta Boundary modeling
Implicit Boundary Modeling (BOUNDSIM) Jason A. McLennan and Clayton V. Deutsch Centre for Computational Geostatistics Department of Civil & Environmental Engineering University of Alberta Boundary modeling
Accounting for Estimation Optimality Criteria in Simulated Annealing 1
 Mathematical Geology, Vol. 30, No. 5, 1998 Accounting for Estimation Optimality Criteria in Simulated Annealing 1 P. Goovaerts 2 This paper presents both estimation and simulation as optimization problems
Pre-exploitation mesh optimisation in a Nickel deposits (New- Caledonia) Jacques Deraisme (GV), Olivier Bertoli (GV), Jérôme Michaud (SLN)
 Jacques Deraisme (GV), Olivier Bertoli (GV), Jérôme Michaud (SLN)") Pre-exploitation mesh optimisation in a Nickel deposits (New- Caledonia) Jacques Deraisme (GV), Olivier Bertoli (GV), Jérôme Michaud (SLN) 1 Context Optimising drill spacing pattern: a challenging task.
Pre-exploitation mesh optimisation in a Nickel deposits (New- Caledonia) Jacques Deraisme (GV), Olivier Bertoli (GV), Jérôme Michaud (SLN) 1 Context Optimising drill spacing pattern: a challenging task.
11-Geostatistical Methods for Seismic Inversion. Amílcar Soares CERENA-IST
 11-Geostatistical Methods for Seismic Inversion Amílcar Soares CERENA-IST asoares@ist.utl.pt 01 - Introduction Seismic and Log Scale Seismic Data Recap: basic concepts Acoustic Impedance Velocity X Density
B. Todd Hoffman and Jef Caers Stanford University, California, USA
 Sequential Simulation under local non-linear constraints: Application to history matching B. Todd Hoffman and Jef Caers Stanford University, California, USA Introduction Sequential simulation has emerged
MULTIVARIATE TEXTURE DISCRIMINATION USING A PRINCIPAL GEODESIC CLASSIFIER
 MULTIVARIATE TEXTURE DISCRIMINATION USING A PRINCIPAL GEODESIC CLASSIFIER A.Shabbir 1, 2 and G.Verdoolaege 1, 3 1 Department of Applied Physics, Ghent University, B-9000 Ghent, Belgium 2 Max Planck Institute
Multivariate Standard Normal Transform: Advances and Case Studies
 Multivariate Standard Normal Transform: Advances and Case Studies Ryan M. Barnett and Clayton V. Deutsch The Multivariate Standard Normal Transformation (MSNT) was recently proposed to transform arbitrary
MPS Simulation with a Gibbs Sampler Algorithm
 MPS Simulation with a Gibbs Sampler Algorithm Steve Lyster and Clayton V. Deutsch Complex geologic structure cannot be captured and reproduced by variogram-based geostatistical methods. Multiple-point
Dijkstra's Algorithm
 Shortest Path Algorithm Dijkstra's Algorithm To find the shortest path from the origin node to the destination node No matrix calculation Floyd s Algorithm To find all the shortest paths from the nodes
Algorithm-driven and Representation-driven Random Function : A New Formalism for Applied Geostatistics
 Algorithm-driven and Representation-driven Random Function : A New Formalism for Applied Geostatistics Alexandre Boucher Dept of Geological and Environmental Sciences Stanford University Abstract This
Exploring Direct Sampling and Iterative Spatial Resampling in History Matching
 Exploring Direct Sampling and Iterative Spatial Resampling in History Matching Matz Haugen, Grergoire Mariethoz and Tapan Mukerji Department of Energy Resources Engineering Stanford University Abstract
D025 Geostatistical Stochastic Elastic Iinversion - An Efficient Method for Integrating Seismic and Well Data Constraints
 D025 Geostatistical Stochastic Elastic Iinversion - An Efficient Method for Integrating Seismic and Well Data Constraints P.R. Williamson (Total E&P USA Inc.), A.J. Cherrett* (Total SA) & R. Bornard (CGGVeritas)
Hierarchical Trend Models Based on Architectural Elements
 Hierarchical Trend Models Based on Architectural Elements Michael J. Pyrcz (mpyrcz@ualberta.ca) and Clayton V. Deutsch (cdeutsch@ualberta.ca) Department of Civil & Environmental Engineering University
Modeling Uncertainty in the Earth Sciences Jef Caers Stanford University
 Modeling spatial continuity Modeling Uncertainty in the Earth Sciences Jef Caers Stanford University Motivation uncertain uncertain certain or uncertain uncertain Spatial Input parameters Spatial Stochastic
Adaptive spatial resampling as a Markov chain Monte Carlo method for uncertainty quantification in seismic reservoir characterization
 1 Adaptive spatial resampling as a Markov chain Monte Carlo method for uncertainty quantification in seismic reservoir characterization Cheolkyun Jeong, Tapan Mukerji, and Gregoire Mariethoz Department
Applying Supervised Learning
 Applying Supervised Learning When to Consider Supervised Learning A supervised learning algorithm takes a known set of input data (the training set) and known responses to the data (output), and trains
FMA901F: Machine Learning Lecture 3: Linear Models for Regression. Cristian Sminchisescu
 FMA901F: Machine Learning Lecture 3: Linear Models for Regression Cristian Sminchisescu Machine Learning: Frequentist vs. Bayesian In the frequentist setting, we seek a fixed parameter (vector), with value(s)
Vivekananda. Collegee of Engineering & Technology. Question and Answers on 10CS762 /10IS762 UNIT- 5 : IMAGE ENHANCEMENT.
 Vivekananda Collegee of Engineering & Technology Question and Answers on 10CS762 /10IS762 UNIT- 5 : IMAGE ENHANCEMENT Dept. Prepared by Harivinod N Assistant Professor, of Computer Science and Engineering,
Using Kriging Methods to Estimate Damage Distribution
 Lehigh University Lehigh Preserve Theses and Dissertations 2011 Using Kriging Methods to Estimate Damage Distribution Bing Wang Lehigh University Follow this and additional works at: http://preserve.lehigh.edu/etd
Data Mining Chapter 3: Visualizing and Exploring Data Fall 2011 Ming Li Department of Computer Science and Technology Nanjing University
 Data Mining Chapter 3: Visualizing and Exploring Data Fall 2011 Ming Li Department of Computer Science and Technology Nanjing University Exploratory data analysis tasks Examine the data, in search of structures
INFERENCE OF THE BOOLEAN MODEL ON A NON STATIONARY CASE
 8 th annual conference of the International Association for Mathematical Geology, 15-20 September 2002, Berlin INFERENCE OF THE BOOLEAN MODEL ON A NON STATIONARY CASE M. BENITO GARCÍA-MORALES and H. BEUCHER
Methods to define confidence intervals for kriged values: Application on Precision Viticulture data.
 Methods to define confidence intervals for kriged values: Application on Precision Viticulture data. J-N. Paoli 1, B. Tisseyre 1, O. Strauss 2, J-M. Roger 3 1 Agricultural Engineering University of Montpellier,
A009 HISTORY MATCHING WITH THE PROBABILITY PERTURBATION METHOD APPLICATION TO A NORTH SEA RESERVOIR
 1 A009 HISTORY MATCHING WITH THE PROBABILITY PERTURBATION METHOD APPLICATION TO A NORTH SEA RESERVOIR B. Todd HOFFMAN and Jef CAERS Stanford University, Petroleum Engineering, Stanford CA 94305-2220 USA
Chapter 5: Outlier Detection
 Ludwig-Maximilians-Universität München Institut für Informatik Lehr- und Forschungseinheit für Datenbanksysteme Knowledge Discovery in Databases SS 2016 Chapter 5: Outlier Detection Lecture: Prof. Dr.
keywords: geostatistical simulation; scenario reduction; machine learning; net present value (NPV).
.") http://dx.doi.org/10.1590/0370-44672018720135 Ryu Okada 1,2 http://orcid.org/0000-0001-9629-9358 João Felipe Coimbra Leite Costa 1,3 Áttila Leães Rodrigues 1,4 http://orcid.org/0000-0003-4524-4087 Bruno
http://dx.doi.org/10.1590/0370-44672018720135 Ryu Okada 1,2 http://orcid.org/0000-0001-9629-9358 João Felipe Coimbra Leite Costa 1,3 Áttila Leães Rodrigues 1,4 http://orcid.org/0000-0003-4524-4087 Bruno
Introduction to Geophysical Inversion
 Introduction to Geophysical Inversion Goals Understand the non-uniqueness in geophysical interpretations Understand the concepts of inversion. Basic workflow for solving inversion problems. Some important
Fast FILTERSIM Simulation with Score-based Distance Function
 Fast FILTERSIM Simulation with Score-based Distance Function Jianbing Wu (1), André G. Journel (1) and Tuanfeng Zhang (2) (1) Department of Energy Resources Engineering, Stanford, CA (2) Schlumberger Doll
Diogo Sousa Figueiredo Silva. Master of Science. Mining Engineering. Department of Civil and Environmental Engineering University of Alberta
 Mineral Resource Classification and Drill Hole Optimization Using Novel Geostatistical Algorithms with a Comparison to Traditional Techniques by Diogo Sousa Figueiredo Silva A thesis submitted in partial
SPE Copyright 2002, Society of Petroleum Engineers Inc.
 SPE 77958 Reservoir Modelling With Neural Networks And Geostatistics: A Case Study From The Lower Tertiary Of The Shengli Oilfield, East China L. Wang, S. Tyson, Geo Visual Systems Australia Pty Ltd, X.
Variography Setting up the Parameters When a data file has been loaded, and the Variography tab selected, the following screen will be displayed.
 Variography - Introduction The variogram (or semi-variogram) is a graph relating the variance of the difference in value of a variable at pairs of sample points to the separation distance between those
Conditioning a hybrid geostatistical model to wells and seismic data
 Conditioning a hybrid geostatistical model to wells and seismic data Antoine Bertoncello, Gregoire Mariethoz, Tao Sun and Jef Caers ABSTRACT Hybrid geostatistical models imitate a sequence of depositional
Chapter 5. Track Geometry Data Analysis
 Chapter Track Geometry Data Analysis This chapter explains how and why the data collected for the track geometry was manipulated. The results of these studies in the time and frequency domain are addressed.
Stochastic Models for Gravity Flow: Numerical Considerations
 Page Stochastic Models for Gravity Flow: Numerical Considerations W H Gibson This paper was first presented at Caving 204, 3 rd International Symposium on Block and Sublevel Caving, Santiago, Chile, 5-6
CLASS VS. THRESHOLD INDICATOR SIMULATION
 CHAPTER 4 CLASS VS. THRESHOLD INDICATOR SIMULATION With traditional discrete multiple indicator conditional simulation, semivariogram models are based on the spatial variance of data above and below selected
Distribution-free Predictive Approaches
 Distribution-free Predictive Approaches The methods discussed in the previous sections are essentially model-based. Model-free approaches such as tree-based classification also exist and are popular for
SPE Copyright 1999, Society of Petroleum Engineers Inc.
 SPE 56654 Methodology for Variogram Interpretation and Modeling for Improved Reservoir Characterization E. Gringarten, SPE, Landmark Graphics Corp., and C. V. Deutsch, SPE, University of Alberta Copyright
Further Simulation Results on Resampling Confidence Intervals for Empirical Variograms
 University of Wollongong Research Online Centre for Statistical & Survey Methodology Working Paper Series Faculty of Engineering and Information Sciences 2010 Further Simulation Results on Resampling Confidence
Nonparametric Regression
 Nonparametric Regression John Fox Department of Sociology McMaster University 1280 Main Street West Hamilton, Ontario Canada L8S 4M4 jfox@mcmaster.ca February 2004 Abstract Nonparametric regression analysis
Fluid flow modelling with seismic cluster analysis
 Fluid flow modelling with seismic cluster analysis Fluid flow modelling with seismic cluster analysis Laurence R. Bentley, Xuri Huang 1 and Claude Laflamme 2 ABSTRACT Cluster analysis is used to construct
Machine Learning for Pre-emptive Identification of Performance Problems in UNIX Servers Helen Cunningham
 Final Report for cs229: Machine Learning for Pre-emptive Identification of Performance Problems in UNIX Servers Helen Cunningham Abstract. The goal of this work is to use machine learning to understand
Oasis montaj Advanced Mapping
 Oasis montaj Advanced Mapping As more information becomes available in digital format, Earth science specialists are recognizing that it is essential to work with a variety of data from different sources.
On internal consistency, conditioning and models of uncertainty
 On internal consistency, conditioning and models of uncertainty Jef Caers, Stanford University Abstract Recent research has been tending towards building models of uncertainty of the Earth, not just building
HIERARCHICAL SIMULATION OF MULTIPLE-FACIES RESERVOIRS USING MULTIPLE-POINT GEOSTATISTICS
 HIERARCHICAL SIMULATION OF MULTIPLE-FACIES RESERVOIRS USING MULTIPLE-POINT GEOSTATISTICS AREPORT SUBMITTED TO THE DEPARTMENT OF PETROLEUM ENGINEERING OF STANFORD UNIVERSITY IN PARTIAL FULFILLMENT OF THE
3. Data Analysis and Statistics
 3. Data Analysis and Statistics 3.1 Visual Analysis of Data 3.2.1 Basic Statistics Examples 3.2.2 Basic Statistical Theory 3.3 Normal Distributions 3.4 Bivariate Data 3.1 Visual Analysis of Data Visual
Software Tutorial Session Universal Kriging
 Software Tutorial Session Universal Kriging The example session with PG2000 which is described in this and Part 1 is intended as an example run to familiarise the user with the package. This documented