Modeling Uncertainty in the Earth Sciences Jef Caers Stanford University
|
|
|
- Ashley Gilbert
- 5 years ago
- Views:
Transcription

1 Modeling spatial continuity Modeling Uncertainty in the Earth Sciences Jef Caers Stanford University


2 Motivation uncertain uncertain certain or uncertain uncertain Spatial Input parameters Spatial Stochastic model Physical model response Forecast and decision model uncertain Datasets Physical input parameters uncertain Raw observations uncertain/error


3 Motivation Calculate expected costs / profits Build models Get responses
4 Motivation Earth phenomena are not randomly distributed in space and time: this makes them predictable! Surface and subsurface modeling: a medium exists that has been created by processes (geological, morphological etc ) A form of continuity exists discontinuity (e.g. faults) is a specific form of such continuity


5 Why modeling spatial continuity? What are mathematical or computer-based models that describe the spatial distribution of properties observed in these (complete or incomplete) datasets

6 Why modeling spatial continuity? Data What is the spatial variation like???? How does one build a model that looks like what I think is there and constrained to data??
7 Why modeling spatial continuity? Geologist 1 interprets channels data Boolean Channel model Boolean simulator Earth models Boolean Mound model Geologist 2 interprets mounds
8 Why modeling spatial continuity? A model allows filtering and exporting the spatial variation seen in the dataset Allows building Earth models with similar spatial variation, but possibly constrained to data Allows randomizing the spatial variation and represent spatial uncertainty
9 Most common type models Variogram-based models Simple, few parameters Limited modeling capabilities Boolean (or object-based) models More realistic Difficult to constrain Training image-based models Realistic Easy to constrain

10 Limitations of these methods Not applicable to modeling structures
11 The variogram Modeling spatial continuity
12 Autocorrelation Yt ( ) "signal", "reponse", "measurement" scatter plot for t y( t t) t t lag distance t+ t time t yt ()
13 Autocorrelation r 1 Lag distance t

14 Case 1 Case 2 time t Case 3 Case 4 Case 5
15 Case 1 Case 2 r(t) r(t) Time t Case 3 Time t r(t) Case 4 Case 5 Time t r(t) r(t) Time t Time t
16 Autocorrelation in 2D y( u h) y() u direction lag vector h autocorrelation for direction scatter plot for direction and lag-spacing h 1 r( h ) y( u h) Lag distance h y() u
17 Properties of the correlogram autocorrelation for direction Always starts at 1 1 Decreases to zero r( h ) correlation length Lag distance h

 r(h) Distance h")
18 Examples Case 1 Case 2 NW direction NE direction NW direction NE direction r(h) r(h) Distance h Distance h

 r(h)")

19 Examples Case 3 Case 4 Case 5 r(h) r(h) r(h) Distance h Distance h Distance h
20 Other representations Autocorrelation function r(h) 1 Distance Multiply with variance Covariance function C(h) Variance of Z Variogram g(h) Variance of Z Flip the function Distance Distance
21 Typical experimental (semi)-variogram Sill Range Nugget
22 Summarizing variograms What is the range and how does it vary with direction What is the nugget effect What is the behavior at the origin What is the sill value These four elements constitute a model, i.e. you summarized a complex spatial variation with a limited set of parameters
23 Why modeling spatial continuity? Data What is the spatial variation like???? How does one build a model that looks like what I think is there and constrained to data??

24 Limitations of variograms Variograms: modeling homogeneous heterogeneity for modeling properties within major layers or facies Vertical variogram Horizontal variogram


25 Limitations of the variogram Data What is the spatial variation like???? How does one build a model that looks like what I think is there and constrained to data??

26 What does the Earth really look like?


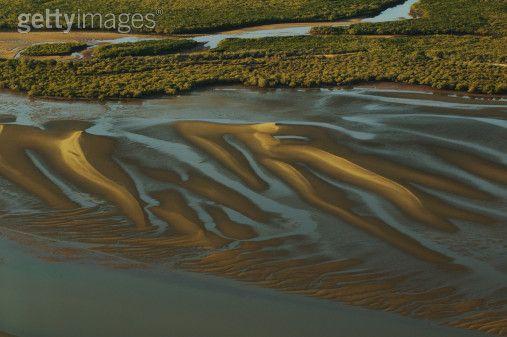
27 Tidal sand bars Meandering rivers Deltas Craters

28 Carbonate Reefs (today)

29 Carbonate Mounds (paleo)
")
30 Atol (today) Atol (paleo)

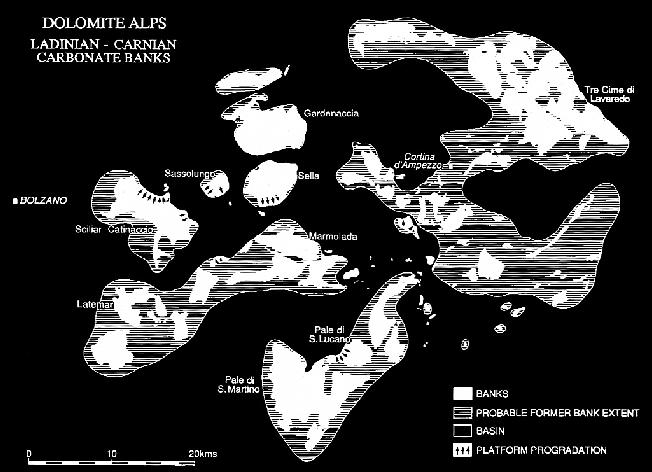
31 Spatial distribution of Atols

32 Inner architecture of an Atol


33 How to create Earth models that represent this observation? Simulate the physical processes of deposition on a computer Observed Simulated
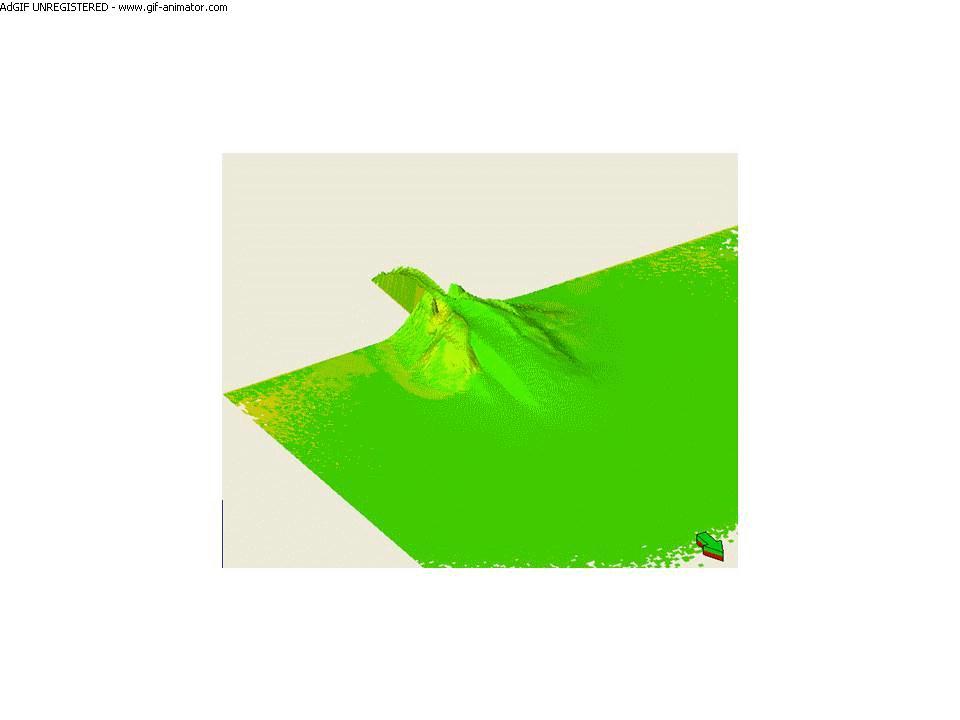
34 Physical-process models
35 Physical process models Take weeks to run on a computer Results are deterministic: one computer run = one model => NO UNCERTAINTY

")
36 Idea: mimic the physical process with a statistical process Process model Boolean or object model Weeks Seconds (Quantifying uncertainty is possible)
37 The object-based or Boolean model Modeling spatial continuity

38 Object (Boolean) model Define spatial variation as a set of objects, each type of object defined using a limited set of parameters Define spatial placement of an object and interaction between objects We can raster the objects on a grid

39 Building a Boolean model Carbonate Geology
40 Hierarchy Depo-Time: era of deposition Depo-system: deepwater, fluvial, deltaic Depo-zones: regions with similar depo-shapes Depo-shapes: basic geometries, geobodies Depo-elements: internal architectures Depo-facies: lithologies, associations
41 Constructing a Boolean model Define a hierarchy of objects Define object geometry Define internal architecture of the object Define placement of object spatially Define interaction between objects
 External variables controlling the shape spatial properties such as")
42 Geometries/dimensions Example Internal parameters of the object those parameters defining geometries (e.g. width, length, orientation) External variables controlling the shape spatial properties such as topography, water depth that control shape

43 Architectural elements Example
44 Spatial distribution Most basic statistical process = Poisson Process
45 Extensions of Poisson Poisson process with spatially varying intensity (density of points) Cluster Process

46 Marked Poisson process Each poisson point gets a mark which could be an object with varying size
47 Rules Spatial distribution of depo-shapes: default = Poisson process Interaction between depo-shapes (overlap and erosion) Rules are parameterized with internal parameters(e.g. Poisson intensity) that may be controlled by external variables (e.g. topography)

 Angles Shear -45 0")
48 Parameterization of the object Every parameter can be defined as constant or a distribution Parameter values can be either constant or following an intensity function (locally varying property) Angles Shear

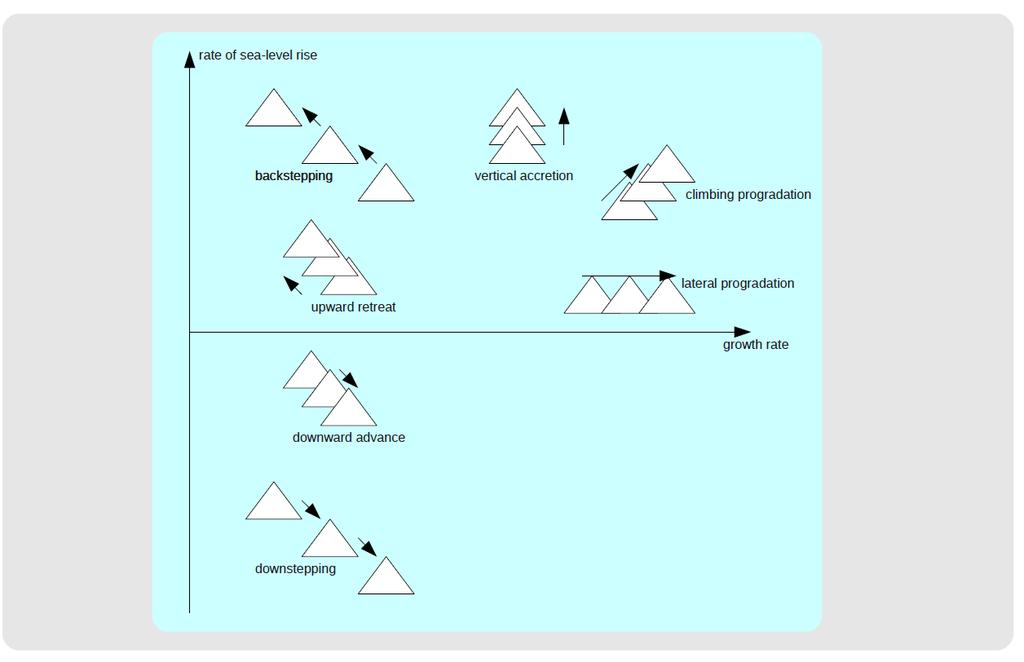
49 Carbonate mounds on a anticline Increased shearing Decreasing outer envelope Rapidly decreasing core size Mound Inner part function of the slope
50 Positioning Intensity Field
51 Stacking
52 Stacking cdf x cdf y Base plane
53 Interaction between objects Hierarchy by the order of definition First defined object erodes the second one etc Overlap rules No overlap Full overlap Attach
What is Tetris? An object-based simulator for creating training images with the following specifications
 Boolean models What is Tetris? An object-based simulator for creating training images with the following specifications It has two hierarchies, objects and elements It is expandable, new objects can be
Modeling Uncertainty in the Earth Sciences Jef Caers Stanford University
 Modeling response uncertainty Modeling Uncertainty in the Earth Sciences Jef Caers Stanford University Modeling Uncertainty in the Earth Sciences High dimensional Low dimensional uncertain uncertain certain
A009 HISTORY MATCHING WITH THE PROBABILITY PERTURBATION METHOD APPLICATION TO A NORTH SEA RESERVOIR
 1 A009 HISTORY MATCHING WITH THE PROBABILITY PERTURBATION METHOD APPLICATION TO A NORTH SEA RESERVOIR B. Todd HOFFMAN and Jef CAERS Stanford University, Petroleum Engineering, Stanford CA 94305-2220 USA
Geostatistical modelling of offshore diamond deposits
 Geostatistical modelling of offshore diamond deposits JEF CAERS AND LUC ROMBOUTS STANFORD UNIVERSITY, Department of Petroleum Engineering, Stanford, CA 94305-2220, USA jef@pangea.stanford.edu TERRACONSULT,
Adaptive spatial resampling as a Markov chain Monte Carlo method for uncertainty quantification in seismic reservoir characterization
 1 Adaptive spatial resampling as a Markov chain Monte Carlo method for uncertainty quantification in seismic reservoir characterization Cheolkyun Jeong, Tapan Mukerji, and Gregoire Mariethoz Department
Hierarchical modeling of multi-scale flow barriers in channelized reservoirs
 Hierarchical modeling of multi-scale flow barriers in channelized reservoirs Hongmei Li and Jef Caers Stanford Center for Reservoir Forecasting Stanford University Abstract Channelized reservoirs often
CONDITIONING SURFACE-BASED MODELS TO WELL AND THICKNESS DATA
 CONDITIONING SURFACE-BASED MODELS TO WELL AND THICKNESS DATA A DISSERTATION SUBMITTED TO THE DEPARTMENT OF ENERGY RESOURCES ENGINEERING AND THE COMMITTEE ON GRADUATE STUDIES OF STANFORD UNIVERSITY IN PARTIAL
Conditioning a hybrid geostatistical model to wells and seismic data
 Conditioning a hybrid geostatistical model to wells and seismic data Antoine Bertoncello, Gregoire Mariethoz, Tao Sun and Jef Caers ABSTRACT Hybrid geostatistical models imitate a sequence of depositional
Antoine Bertoncello, Hongmei Li and Jef Caers
 Antoine Bertoncello, Hongmei Li and Jef Caers model created by surface based model (Bertoncello and Caers, 2010) A conditioning methodology have been developed and tested on a model with few parameters
Spatial Interpolation & Geostatistics
 (Z i Z j ) 2 / 2 Spatial Interpolation & Geostatistics Lag Lag Mean Distance between pairs of points 1 Tobler s Law All places are related, but nearby places are related more than distant places Corollary:
Spatial Interpolation - Geostatistics 4/3/2018
 Spatial Interpolation - Geostatistics 4/3/201 (Z i Z j ) 2 / 2 Spatial Interpolation & Geostatistics Lag Distance between pairs of points Lag Mean Tobler s Law All places are related, but nearby places
On internal consistency, conditioning and models of uncertainty
 On internal consistency, conditioning and models of uncertainty Jef Caers, Stanford University Abstract Recent research has been tending towards building models of uncertainty of the Earth, not just building
STOCHASTIC OBJECT-BASED SIMULATION OF CHANNELS CONSTRAINED ABSTRACT INTRODUCTION 1 DATA AND GEOLOGICAL FRAMEWORK BY HIGH RESOLUTION SEISMIC DATA
 STOCHASTIC OBJECT-BASED SIMULATION OF CHANNELS CONSTRAINED BY HIGH RESOLUTION SEISMIC DATA S. Viseur, A. Shtuka, J-L. Mallet ABSTRACT Recent progresses in exploration techniques (sonar images, high resolution
B. Todd Hoffman and Jef Caers Stanford University, California, USA
 Sequential Simulation under local non-linear constraints: Application to history matching B. Todd Hoffman and Jef Caers Stanford University, California, USA Introduction Sequential simulation has emerged
Non Stationary Variograms Based on Continuously Varying Weights
 Non Stationary Variograms Based on Continuously Varying Weights David F. Machuca-Mory and Clayton V. Deutsch Centre for Computational Geostatistics Department of Civil & Environmental Engineering University
Geostatistics on Stratigraphic Grid
 Geostatistics on Stratigraphic Grid Antoine Bertoncello 1, Jef Caers 1, Pierre Biver 2 and Guillaume Caumon 3. 1 ERE department / Stanford University, Stanford CA USA; 2 Total CSTJF, Pau France; 3 CRPG-CNRS
Spatial Interpolation & Geostatistics
 (Z i Z j ) 2 / 2 Spatial Interpolation & Geostatistics Lag Lag Mean Distance between pairs of points 11/3/2016 GEO327G/386G, UT Austin 1 Tobler s Law All places are related, but nearby places are related
A workflow to account for uncertainty in well-log data in 3D geostatistical reservoir modeling
 A workflow to account for uncertainty in well-log data in 3D geostatistical reservoir Jose Akamine and Jef Caers May, 2007 Stanford Center for Reservoir Forecasting Abstract Traditionally well log data
CONDITIONING FACIES SIMULATIONS WITH CONNECTIVITY DATA
 CONDITIONING FACIES SIMULATIONS WITH CONNECTIVITY DATA PHILIPPE RENARD (1) and JEF CAERS (2) (1) Centre for Hydrogeology, University of Neuchâtel, Switzerland (2) Stanford Center for Reservoir Forecasting,
TPG4160 Reservoir simulation, Building a reservoir model
 TPG4160 Reservoir simulation, Building a reservoir model Per Arne Slotte Week 8 2018 Overview Plan for the lectures The main goal for these lectures is to present the main concepts of reservoir models
Joint quantification of uncertainty on spatial and non-spatial reservoir parameters
 Joint quantification of uncertainty on spatial and non-spatial reservoir parameters Comparison between the Method and Distance Kernel Method Céline Scheidt and Jef Caers Stanford Center for Reservoir Forecasting,
2D Geostatistical Modeling and Volume Estimation of an Important Part of Western Onland Oil Field, India.
 and Volume Estimation of an Important Part of Western Onland Oil Field, India Summary Satyajit Mondal*, Liendon Ziete, and B.S.Bisht ( GEOPIC, ONGC) M.A.Z.Mallik (E&D, Directorate, ONGC) Email: mondal_satyajit@ongc.co.in
CONDITIONAL SIMULATION OF TRUNCATED RANDOM FIELDS USING GRADIENT METHODS
 CONDITIONAL SIMULATION OF TRUNCATED RANDOM FIELDS USING GRADIENT METHODS Introduction Ning Liu and Dean S. Oliver University of Oklahoma, Norman, Oklahoma, USA; ning@ou.edu The problem of estimating the
Grid-less Simulation of a Fluvio-Deltaic Environment
 Grid-less Simulation of a Fluvio-Deltaic Environment R. Mohan Srivastava, FSS Canada Consultants, Toronto, Canada MoSrivastava@fssconsultants.ca and Marko Maucec, Halliburton Consulting and Project Management,
Variogram Inversion and Uncertainty Using Dynamic Data. Simultaneouos Inversion with Variogram Updating
 Variogram Inversion and Uncertainty Using Dynamic Data Z. A. Reza (zreza@ualberta.ca) and C. V. Deutsch (cdeutsch@civil.ualberta.ca) Department of Civil & Environmental Engineering, University of Alberta
A Geostatistical and Flow Simulation Study on a Real Training Image
 A Geostatistical and Flow Simulation Study on a Real Training Image Weishan Ren (wren@ualberta.ca) Department of Civil & Environmental Engineering, University of Alberta Abstract A 12 cm by 18 cm slab
Multiple-point geostatistics: a quantitative vehicle for integrating geologic analogs into multiple reservoir models
 Multiple-point geostatistics: a quantitative vehicle for integrating geologic analogs into multiple reservoir models JEF CAERS AND TUANFENG ZHANG Stanford University, Stanford Center for Reservoir Forecasting
HIERARCHICAL SIMULATION OF MULTIPLE-FACIES RESERVOIRS USING MULTIPLE-POINT GEOSTATISTICS
 HIERARCHICAL SIMULATION OF MULTIPLE-FACIES RESERVOIRS USING MULTIPLE-POINT GEOSTATISTICS AREPORT SUBMITTED TO THE DEPARTMENT OF PETROLEUM ENGINEERING OF STANFORD UNIVERSITY IN PARTIAL FULFILLMENT OF THE
Surface-based model conditioning using an hybrid optimization: methodology and application
 Surface-based model conditioning using an hybrid optimization: methodology and application Antoine Bertoncello, Jef Caers, Hongmei Li and Tao Sun Department of Energy Resources Engineering Stanford University
Methods to define confidence intervals for kriged values: Application on Precision Viticulture data.
 Methods to define confidence intervals for kriged values: Application on Precision Viticulture data. J-N. Paoli 1, B. Tisseyre 1, O. Strauss 2, J-M. Roger 3 1 Agricultural Engineering University of Montpellier,
A Geomodeling workflow used to model a complex carbonate reservoir with limited well control : modeling facies zones like fluid zones.
 A Geomodeling workflow used to model a complex carbonate reservoir with limited well control : modeling facies zones like fluid zones. Thomas Jerome (RPS), Ke Lovan (WesternZagros) and Suzanne Gentile
arxiv: v1 [eess.iv] 25 Dec 2018
![arxiv: v1 [eess.iv] 25 Dec 2018](/thumbs/92/111039733.jpg "arxiv: v1 [eess.iv] 25 Dec 2018") Vector Field-based Simulation of Tree-Like Non-Stationary Geostatistical Models arxiv:1812.11030v1 [eess.iv] 25 Dec 2018 Viviana Lorena Vargas, Sinesio Pesco Pontificia Universidade Catolica, Rio de Janeiro
Vector Field-based Simulation of Tree-Like Non-Stationary Geostatistical Models arxiv:1812.11030v1 [eess.iv] 25 Dec 2018 Viviana Lorena Vargas, Sinesio Pesco Pontificia Universidade Catolica, Rio de Janeiro
Displaying Strike and Dip Measurements on Your Map in Surfer
 Displaying Strike and Dip Measurements on Your Map in Surfer Measuring strike and dip is a fundamental part of geological mapping, and displaying strike and dip information on a map is an effective way
PGS hyperbeam - rapid scenario-testing of velocity models to optimize depth imaging
 A Publication of Petroleum Geo-Services Vol. 10 No. 4 April 2010 PGS hyperbeam - rapid scenario-testing of velocity models to optimize depth imaging Introduction Depth imaging is now established as a key
Datamine Solutions for Industrial Minerals and Construction Materials, including Dimension Stones.
 Datamine Solutions for Industrial Minerals and Construction Materials, including Dimension Stones. Datamine Overview Global Presence 250 staff in 12 countries Canada, USA, Peru, Chile, Mexico, Brazil,
VARFIT: A Program for Semi-Automatic Variogram Modelling
 VARFIT: A Program for Semi-Automatic Variogram Modelling Paula F. Larrondo (larrondo@ualberta.ca), Chad T. Neufeld (neufeld@ualberta.ca), and Clayton V. Deutsch (cdeutsch@ualberta.ca) Department of Civil
Appropriate algorithm method for Petrophysical properties to construct 3D modeling for Mishrif formation in Amara oil field Jawad K.
 Appropriate algorithm method for Petrophysical properties to construct 3D modeling for Mishrif formation in Amara oil field Jawad K. Radhy AlBahadily Department of geology, college of science, Baghdad
Basics of treatment planning II
 Basics of treatment planning II Sastry Vedam PhD DABR Introduction to Medical Physics III: Therapy Spring 2015 Monte Carlo Methods 1 Monte Carlo! Most accurate at predicting dose distributions! Based on
B002 DeliveryMassager - Propagating Seismic Inversion Information into Reservoir Flow Models
 B2 DeliveryMassager - Propagating Seismic Inversion Information into Reservoir Flow Models J. Gunning* (CSIRO Petroleum) & M.E. Glinsky (BHP Billiton Petroleum) SUMMARY We present a new open-source program
A methodology for establishing a data reliability measure for value of spatial information problems
 A methodology for establishing a data reliability measure for value of spatial information problems Whitney J. Trainor-Guitton 1, Jef Caers 2 and Tapan Mukerji 2 1 Program of Earth, Energy and Environmental
GEO 580 Lab 4 Geostatistical Analysis
 GEO 580 Lab 4 Geostatistical Analysis In this lab, you will move beyond basic spatial analysis (querying, buffering, clipping, joining, etc.) to learn the application of some powerful statistical techniques
Creating 3D Models of Lithologic/Soil Zones using 3D Grids
 65 Creating 3D Models of Lithologic/Soil Zones using 3D Grids By Skip Pack Dynamic Graphics, Inc 1015 Atlantic Avenue Alameda, CA 94501 Telephone: (510) 522-0700, ext 3118 Fax: (510) 522-5670 e-mail: skip@dgicom
Stage terrain 3A Heissenstein. Electrical surveying
 Stage terrain 3A Heissenstein Electrical surveying Introduction The principle method for measuring the surface resistivity is always the same. An electric current is sent into the subsurface through two
COMBINING MULTIPLE GEOPHYSICAL DATA SETS INTO A SINGLE 3D IMAGE. Abstract
 COMBINING MULTIPLE GEOPHYSICAL DATA SETS INTO A SINGLE 3D IMAGE Jeffrey J. Daniels*, Mark Vendl+, Jennifer Holt*, and Erich Guy* *OSU, Columbus, OH +USEPA, Chicago, IL Abstract Traditional geophysical
A Direct Simulation-Based Study of Radiance in a Dynamic Ocean
 A Direct Simulation-Based Study of Radiance in a Dynamic Ocean Lian Shen Department of Civil Engineering Johns Hopkins University Baltimore, MD 21218 phone: (410) 516-5033 fax: (410) 516-7473 email: LianShen@jhu.edu
RM03 Integrating Petro-elastic Seismic Inversion and Static Model Building
 RM03 Integrating Petro-elastic Seismic Inversion and Static Model Building P. Gelderblom* (Shell Global Solutions International BV) SUMMARY This presentation focuses on various aspects of how the results
Dijkstra's Algorithm
 Shortest Path Algorithm Dijkstra's Algorithm To find the shortest path from the origin node to the destination node No matrix calculation Floyd s Algorithm To find all the shortest paths from the nodes
Airborne discrete return LiDAR data was collected on September 3-4, 2007 by
 SUPPLEMENTAL MATERIAL 2 LiDAR Specifications Airborne discrete return LiDAR data was collected on September 3-4, 2007 by Watershed Sciences, Inc. (Corvallis, Oregon USA). LiDAR was collected approximately
Cell based GIS. Introduction to rasters
 Week 9 Cell based GIS Introduction to rasters topics of the week Spatial Problems Modeling Raster basics Application functions Analysis environment, the mask Application functions Spatial Analyst in ArcGIS
Instruction with Hands-on Practice: Grid Generation and Forcing
 Instruction with Hands-on Practice: Grid Generation and Forcing Introduction For this section of the hands-on tutorial, we will be using a merged dataset of bathymetry points. You will need the following
Reservoir Modeling Combining Geostatistics with Markov Chain Monte Carlo Inversion
 Reservoir Modeling Combining Geostatistics with Markov Chain Monte Carlo Inversion Andrea Zunino, Katrine Lange, Yulia Melnikova, Thomas Mejer Hansen and Klaus Mosegaard 1 Introduction Reservoir modeling
Using Statistical Techniques to Improve the QC Process of Swell Noise Filtering
 Using Statistical Techniques to Improve the QC Process of Swell Noise Filtering A. Spanos* (Petroleum Geo-Services) & M. Bekara (PGS - Petroleum Geo- Services) SUMMARY The current approach for the quality
A Parallel, Multiscale Approach to Reservoir Modeling. Omer Inanc Tureyen and Jef Caers Department of Petroleum Engineering Stanford University
 A Parallel, Multiscale Approach to Reservoir Modeling Omer Inanc Tureyen and Jef Caers Department of Petroleum Engineering Stanford University 1 Abstract With the advance of CPU power, numerical reservoir
Watershed Sciences 4930 & 6920 ADVANCED GIS
 Watershed Sciences 4930 & 6920 ADVANCED GIS TERRESTRIAL LASER SCANNING (AKA GROUND BASED LIDAR) Joe Wheaton PURPOSE OF TODAY S DEMONSTRATION Introduce you to TLS Demystify TLS & LiDaR TODAY S PLAN I. What
Quantifying the Dynamic Ocean Surface Using Underwater Radiometric Measurement
 DISTRIBUTION STATEMENT A. Approved for public release; distribution is unlimited. Quantifying the Dynamic Ocean Surface Using Underwater Radiometric Measurement Lian Shen Department of Mechanical Engineering
Data Acquisition. Chapter 2
 Data Acquisition Chapter 2 1 st step: get data Data Acquisition Usually data gathered by some geophysical device Most surveys are comprised of linear traverses or transects Typically constant data spacing
Programs for MDE Modeling and Conditional Distribution Calculation
 Programs for MDE Modeling and Conditional Distribution Calculation Sahyun Hong and Clayton V. Deutsch Improved numerical reservoir models are constructed when all available diverse data sources are accounted
Lesson 5 overview. Concepts. Interpolators. Assessing accuracy Exercise 5
 Interpolation Tools Lesson 5 overview Concepts Sampling methods Creating continuous surfaces Interpolation Density surfaces in GIS Interpolators IDW, Spline,Trend, Kriging,Natural neighbors TopoToRaster
SPE Copyright 1999, Society of Petroleum Engineers Inc.
 SPE 56654 Methodology for Variogram Interpretation and Modeling for Improved Reservoir Characterization E. Gringarten, SPE, Landmark Graphics Corp., and C. V. Deutsch, SPE, University of Alberta Copyright
ENGRG Introduction to GIS
 ENGRG 59910 Introduction to GIS Michael Piasecki April 3, 2014 Lecture 11: Raster Analysis GIS Related? 4/3/2014 ENGRG 59910 Intro to GIS 2 1 Why we use Raster GIS In our previous discussion of data models,
A Stochastic Object Model Conditioned to High-Quality Seismic Data
 Math Geosci (2011) 43:763 781 DOI 10.1007/s11004-011-9355-4 A Stochastic Object Model Conditioned to High-Quality Seismic Data Anne Randi Syversveen Ragnar Hauge Jan Inge Tollefsrud Ulf Lægreid Alister
Pre-exploitation mesh optimisation in a Nickel deposits (New- Caledonia) Jacques Deraisme (GV), Olivier Bertoli (GV), Jérôme Michaud (SLN)
 Jacques Deraisme (GV), Olivier Bertoli (GV), Jérôme Michaud (SLN)") Pre-exploitation mesh optimisation in a Nickel deposits (New- Caledonia) Jacques Deraisme (GV), Olivier Bertoli (GV), Jérôme Michaud (SLN) 1 Context Optimising drill spacing pattern: a challenging task.
Pre-exploitation mesh optimisation in a Nickel deposits (New- Caledonia) Jacques Deraisme (GV), Olivier Bertoli (GV), Jérôme Michaud (SLN) 1 Context Optimising drill spacing pattern: a challenging task.
Geological mapping using open
 Geological mapping using open source QGIS MOHSEN ALSHAGHDARI -2017- Abstract Geological mapping is very important to display your field work in a map for geologist and others, many geologists face problems
Rotation and affinity invariance in multiple-point geostatistics
 Rotation and ainity invariance in multiple-point geostatistics Tuanfeng Zhang December, 2001 Abstract Multiple-point stochastic simulation of facies spatial distribution requires a training image depicting
Probabilistic Analysis Tutorial
 Probabilistic Analysis Tutorial 2-1 Probabilistic Analysis Tutorial This tutorial will familiarize the user with the Probabilistic Analysis features of Swedge. In a Probabilistic Analysis, you can define
APPLICATION OF MATLAB IN SEISMIC INTERFEROMETRY FOR SEISMIC SOURCE LOCATION AND INTERPOLATION OF TWO DIMENSIONAL OCEAN BOTTOM SEISMIC DATA.
 APPLICATION OF MATLAB IN SEISMIC INTERFEROMETRY FOR SEISMIC SOURCE LOCATION AND INTERPOLATION OF TWO DIMENSIONAL OCEAN BOTTOM SEISMIC DATA. BY: ISAAC KUMA YEBOAH. Department of Engineering, Regent University
Iterative spatial resampling applied to seismic inverse modeling for lithofacies prediction
 Iterative spatial resampling applied to seismic inverse modeling for lithofacies prediction Cheolkyun Jeong, Tapan Mukerji, and Gregoire Mariethoz Department of Energy Resources Engineering Stanford University
Three critical concerns for marine seismics with portable systems. Source strength and tuning Streamer length 2D vs. 3D
 Three critical concerns for marine seismics with portable systems Source strength and tuning Streamer length 2D vs. 3D Airgun Source Single airgun Multiple airguns signal strength volume 1/3 1 x (200 in
Multiple Point Statistics with Multiple Training Images
 Multiple Point Statistics with Multiple Training Images Daniel A. Silva and Clayton V. Deutsch Abstract Characterization of complex geological features and patterns has been one of the main tasks of geostatistics.
Lab 1: Introduction to ArcGIS
 Lab 1: Introduction to ArcGIS Objectives In this lab you will: 1) Learn the basics of the software package we will be using for the remainder of the semester, and 2) Discover the role that climate and
The Components of Geostatistical Simulation
 This file was created by scanning the printed publication. Errors identified by the software have been corrected; however, some errors may remain. The Components of Geostatistical Simulation Carol A. ~otwayl
Oasis montaj Advanced Mapping
 Oasis montaj Advanced Mapping As more information becomes available in digital format, Earth science specialists are recognizing that it is essential to work with a variety of data from different sources.
Geostatistics 2D GMS 7.0 TUTORIALS. 1 Introduction. 1.1 Contents
 GMS 7.0 TUTORIALS 1 Introduction Two-dimensional geostatistics (interpolation) can be performed in GMS using the 2D Scatter Point module. The module is used to interpolate from sets of 2D scatter points
Effects of multi-scale velocity heterogeneities on wave-equation migration Yong Ma and Paul Sava, Center for Wave Phenomena, Colorado School of Mines
 Effects of multi-scale velocity heterogeneities on wave-equation migration Yong Ma and Paul Sava, Center for Wave Phenomena, Colorado School of Mines SUMMARY Velocity models used for wavefield-based seismic
High Resolution Geomodeling, Ranking and Flow Simulation at SAGD Pad Scale
 High Resolution Geomodeling, Ranking and Flow Simulation at SAGD Pad Scale Chad T. Neufeld, Clayton V. Deutsch, C. Palmgren and T. B. Boyle Increasing computer power and improved reservoir simulation software
Trend Modeling Techniques and Guidelines
 Trend Modeling Techniques and Guidelines Jason A. M c Lennan, Oy Leuangthong, and Clayton V. Deutsch Centre for Computational Geostatistics (CCG) Department of Civil and Environmental Engineering University
Seismic Time Processing. The Basis for Modern Seismic Exploration
 The Future of E&P Seismic Time Processing The Basis for Modern Seismic Exploration Fusion is a leading provider of Seismic Processing for the oil and gas industry from field tapes through final migration.
Object-Based Classification & ecognition. Zutao Ouyang 11/17/2015
 Object-Based Classification & ecognition Zutao Ouyang 11/17/2015 What is Object-Based Classification The object based image analysis approach delineates segments of homogeneous image areas (i.e., objects)
R Package CircSpatial for the Imaging - Kriging - Simulation. of Circular-Spatial Data
 R Package CircSpatial for the Imaging - Kriging - Simulation 2 4-20 -10 0 y 2 4-20 -10 0 10 of Circular-Spatial Data Bill Morphet PhD Advisor Juergen Symanzik April, 2008 1 Circular Random Variable (CRV)
Application of MPS Simulation with Multiple Training Image (MultiTI-MPS) to the Red Dog Deposit
 to the Red Dog Deposit") Application of MPS Simulation with Multiple Training Image (MultiTI-MPS) to the Red Dog Deposit Daniel A. Silva and Clayton V. Deutsch A Multiple Point Statistics simulation based on the mixing of two
Application of MPS Simulation with Multiple Training Image (MultiTI-MPS) to the Red Dog Deposit Daniel A. Silva and Clayton V. Deutsch A Multiple Point Statistics simulation based on the mixing of two
3D modeling of the Quest Projects Geophysical Datasets. Nigel Phillips
 3D modeling of the Quest Projects Geophysical Datasets Nigel Phillips Advanced Geophysical Interpretation Centre Undercover Exploration workshop KEG-25 April 2012 Mineral Physical Properties: density sus.
A027 4D Pre-stack Inversion Workflow Integrating Reservoir Model Control and Lithology Supervised Classification
 A027 4D Pre-stack Inversion Workflow Integrating Reservoir Model Control and Lithology Supervised Classification S. Toinet* (Total E&P Angola), S. Maultzsch (Total), V. Souvannavong (CGGVeritas) & O. Colnard
+ = Spatial Analysis of Raster Data. 2 =Fault in shale 3 = Fault in limestone 4 = no Fault, shale 5 = no Fault, limestone. 2 = fault 4 = no fault
 Spatial Analysis of Raster Data 0 0 1 1 0 0 1 1 1 0 1 1 1 1 1 1 2 4 4 4 2 4 5 5 4 2 4 4 4 2 5 5 4 4 2 4 5 4 3 5 4 4 4 2 5 5 5 3 + = 0 = shale 1 = limestone 2 = fault 4 = no fault 2 =Fault in shale 3 =
Variography Setting up the Parameters When a data file has been loaded, and the Variography tab selected, the following screen will be displayed.
 Variography - Introduction The variogram (or semi-variogram) is a graph relating the variance of the difference in value of a variable at pairs of sample points to the separation distance between those
Application of fuzzy set theory in image analysis. Nataša Sladoje Centre for Image Analysis
 Application of fuzzy set theory in image analysis Nataša Sladoje Centre for Image Analysis Our topics for today Crisp vs fuzzy Fuzzy sets and fuzzy membership functions Fuzzy set operators Approximate
History Matching of Structurally Complex Reservoirs Using a Distance-based Model Parameterization
 History Matching of Structurally Complex Reservoirs Using a Distance-based Model Parameterization Satomi Suzuki, Guillaume Caumon, Jef Caers S. Suzuki, J. Caers Department of Energy Resources Engineering,
Markov Bayes Simulation for Structural Uncertainty Estimation
 P - 200 Markov Bayes Simulation for Structural Uncertainty Estimation Samik Sil*, Sanjay Srinivasan and Mrinal K Sen. University of Texas at Austin, samiksil@gmail.com Summary Reservoir models are built
Curvature. Definition of curvature in 2D and 3D
 Curvature Deformation associated with folding and faulting alters the location and shape of geological surfaces. In Move, the strain caused by deformation can be quantified using restoration algorithms
GeoProbe Geophysical Interpretation Software
 DATA SHEET GeoProbe Geophysical Interpretation Software overview DecisionSpace Geosciences key features Integrated building, editing and interactive deformation of sealed multi-z bodies extracted from
Flexible Lag Definition for Experimental Variogram Calculation
 Flexible Lag Definition for Experimental Variogram Calculation Yupeng Li and Miguel Cuba The inference of the experimental variogram in geostatistics commonly relies on the method of moments approach.
2D Advanced Surface Texture Module for MountainsMap
 2D Advanced Surface Texture Module for MountainsMap Advanced 2D profile filtering and analysis Advanced 2D filtering techniques 2D Fourier analysis & direct filtering of FFT plot Statistical analysis of
Geostatistical Reservoir Characterization of McMurray Formation by 2-D Modeling
 Geostatistical Reservoir Characterization of McMurray Formation by 2-D Modeling Weishan Ren, Oy Leuangthong and Clayton V. Deutsch Department of Civil & Environmental Engineering, University of Alberta
Lecture 21 - Chapter 8 (Raster Analysis, part2)
") GEOL 452/552 - GIS for Geoscientists I Lecture 21 - Chapter 8 (Raster Analysis, part2) Today: Digital Elevation Models (DEMs), Topographic functions (surface analysis): slope, aspect hillshade, viewshed,
GEOL 452/552 - GIS for Geoscientists I Lecture 21 - Chapter 8 (Raster Analysis, part2) Today: Digital Elevation Models (DEMs), Topographic functions (surface analysis): slope, aspect hillshade, viewshed,
Gridding and Contouring in Geochemistry for ArcGIS
 Gridding and Contouring in Geochemistry for ArcGIS The Geochemsitry for ArcGIS extension includes three gridding options: Minimum Curvature Gridding, Kriging and a new Inverse Distance Weighting algorithm.
Uncertainty Quantification for History- Matching of Non-Stationary Models Using Geostatistical Algorithms
 Uncertainty Quantification for History- Matching of Non-Stationary Models Using Geostatistical Algorithms Maria Helena Caeiro 1, Vasily Demyanov 2, Mike Christie 3 and Amilcar Soares 4 Abstract The quantification
Surface Smoothing Using Kriging
 1 AutoCAD Civil 3D has the ability to add data points to a surface based on mathematical criteria. This gives you the ability to strengthen the surface definition in areas where data may be sparse or where
Map Analysis of Raster Data I 3/8/2018
 Map Analysis of Raster Data I /8/8 Spatial Analysis of Raster Data What is Spatial Analysis? = shale = limestone 4 4 4 4 5 5 4 4 4 4 5 5 4 4 4 5 4 5 4 4 4 5 5 5 + = = fault =Fault in shale 4 = no fault
Engineering Geology. Engineering Geology is backbone of civil engineering. Topographic Maps. Eng. Iqbal Marie
 Engineering Geology Engineering Geology is backbone of civil engineering Topographic Maps Eng. Iqbal Marie Maps: are a two dimensional representation, of an area or region. There are many types of maps,
We B3 12 Full Waveform Inversion for Reservoir Characterization - A Synthetic Study
 We B3 12 Full Waveform Inversion for Reservoir Characterization - A Synthetic Study E. Zabihi Naeini* (Ikon Science), N. Kamath (Colorado School of Mines), I. Tsvankin (Colorado School of Mines), T. Alkhalifah
Multi-attribute seismic analysis tackling non-linearity
 Multi-attribute seismic analysis tackling non-linearity Satinder Chopra, Doug Pruden +, Vladimir Alexeev AVO inversion for Lamé parameters (λρ and µρ) has become a common practice as it serves to enhance