3 Ways to Improve Your Regression
|
|
|
- Roy Paul
- 6 years ago
- Views:
Transcription

1 3 Ways to Improve Your Regression Introduction This tutorial will take you through the steps demonstrated in the 3 Ways to Improve Your Regression webinar. First, you will be introduced to a dataset about compressive strength of concrete. Then, you will walk through the steps of building four models: 1) Standard linear regression 2) MARS (Multivariate Adaptive Regression Splines) 3) TreeNet Gradient Boosting 4) Random Forests The last three techniques offer different approaches to handling problems standard linear regression cannot, such as missing values, interactions, and nonlinearities. A final comparison of the models and pros/cons for each will help you tackle your next big regression project. Tutorial Begin by opening Salford Predictive Modeler (SPM):

2 From the menu, select File > Open > Data File or click the folder shortcut: Locate Concrete.xls 1 and click Open. 1 I-Cheng Yeh, "Modeling of strength of high performance concrete using artificial neural networks," Cement and Concrete Research, Vol. 28, No. 12, pp (1998)
.")
3 The Activity Window, pictured below, will appear: On the left side of the window, the variables in the data file are listed. STRENGTH will be our target variable and measures compressive strength of concrete (MPa). The remaining eight variables are components/characteristics of concrete and will act as predictors of strength. On the right, you can see there are 1030 records and 9 numeric variables. In the row of buttons at the bottom of the Activity Window, click View Data. This feature simply displays a spreadsheet, below, for easy viewing of the data.
, click Model.")
4 From the Activity Window (View > Activity Window), click Model. Or, use the Model shortcut:
5 This is where you will set up your first model, a standard linear regression. Select Regression as the Analysis Engine in the bottom right corner of the Model Setup window. Choose STRENGTH in the Target column and the remaining component variables in the Predictor column. Click the Testing tab: Choose No independent testing exploratory model. This is common practice for a linear regression. Click Start.

6 The Regression Results window, below, will appear with summary statistics on the completed model. The two measures you will be comparing for all of the models are MSE and R 2. For this standard linear regression, the MSE is with an R 2 of %. The other tabs in this results window will show you information about the model, such as outliers and coefficients. Method MSE R 2 Linear Regression % MARS - - TreeNet - - Random Forests - -

7 Re-open the Model Setup window: Change the Analysis Engine to MARS. Check that the Target Type is Regression and that all of the variables are correctly selected.

8 Click the Testing tab at the top of the window: Select V-fold cross-validation for 10 folds as a testing method.

9 Click the Options and Limits (MARS) tab: Enter 40 in the Max Basis Functions field. This will create more opportunities for nonlinearities in the data, if necessary. Additionally, you can change the Maximum Interactions field to allow for higher order interactions. Click Start.


10 The MARS Results window, below, will appear with the completed model: The graph shows the number of basis functions in the model plotted against both the GCV and MSE. Click the Summary button at the bottom of the window:

11 This will bring up a Summary Results window similar to the linear regression model. Here, you can see the model achieves an MSE of and an R 2 of %. Method MSE R 2 Linear Regression % MARS % TreeNet - - Random Forests - - This result is a drastic improvement from the previous linear regression. There are several other features in this window that give insight to the model and pose an advantage over regression. Click the Variable Importance tab:

12 Here, you can see AGE and CEMENT contributed most to building the MARS model, while COARSE_AGGREGATE was least important. Click the Basis Functions tab: This tab holds equations for all basis functions in addition to the final model. For those modelers who prefer the traditional output of a regression model, this tab may prove useful to you.

13 To see these basis functions in action, click the Plots tab: These are the 2D plots of the basis functions for each predictor. Click Show All.

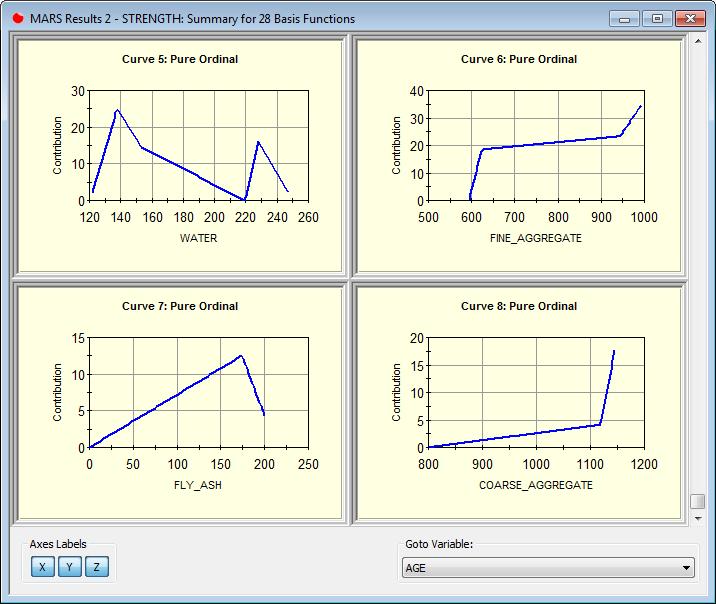
14

15 Each variable is plotted against its contribution to the response variable, STRENGTH. The nonlinear functions are clearly depicted. For example, AGE exhibits a steep increase in contribution to strength during the first 50 days, then levels off. Re-open the Model Setup window: Change the Analysis Engine to TreeNet Gradient Boosting. Again, check the Target Type and Variable Selection.
16 Click the Testing tab: You will also use 10-fold cross-validation in this model for accurate comparisons.

17 Click the TreeNet tab: This tab holds a lot of fine-tuning parameters for adjusting your model. The default option is to grow 200 trees, but you will enter 500 for this particular exercise.

18 Click the Plots and Options tab: Select both one variable and two variable dependence plots for the top 3 variables. (In earlier versions, plots can be created after the model building process by clicking Create Plots in the results window.) Click Start.


19 The TreeNet results window, below, will appear with the completed model: In this results window, you will see the number of trees in the model plotted against either the MSE, MAD, MAPD, or R 2. Click the Summary button to bring up all of these measures for the optimal model:

20 For the Test sample, the TreeNet model achieved an MSE of and an R 2 of %. Method MSE R 2 Linear Regression % MARS % TreeNet % Random Forests This model performs slightly better than MARS, but the important thing to note is the drastic improvement over linear regression. Return to the Results window and click the Display Plots button: This brings up a list of the plots you created during the Model Setup process:

21 Click Show All. The plots above are called partial dependency plots. Each predictor is plotted against its contribution to the response variable, after averaging over contributions from all other predictors. For example, WATER has a positive contribution to STRENGTH over the values 120 to 175, at which it crosses over into negative contribution. Essentially, too much water weakens the concrete. In addition, you will see 3D plots that model the interactions between the top 3 important variables, pictured below.

22 Double-click the individual plots to open in a separate window. From here, you can manipulate the positioning of the 3D graph along with the picture details (mesh, colors, etc.).
23 Re-open the Model Setup window: Change the Analysis Engine to RandomForests.
24 Click the Testing tab: Random Forests uses a bootstrapping technique to build an ensemble of trees. Therefore, there is a built-in test sample, called out-of-bag data, which is a result of unchosen data during bootstrapping. Choose this method for testing. Click Start.

25 The RF Results window, below, will appear: This results window shows the number of trees built in the RF model plotted against the MSE. Click the Summary button:
26 You achieved an MSE of and an R 2 of 90.84%. Method MSE R 2 Linear Regression % MARS % TreeNet % Random Forests % Overall, you were able to decrease the mean error of your model from about 10 to around 5. Additionally, you explored a few different techniques that offered a variety of analysis tools, such as plots and variable rankings. Keep in mind, these results will vary depending on the model-building parameters you choose. Conclusion Now that you ve seen 3 alternate approaches to a regression model, which should you use? This is a tricky question because it depends on your data and modeling needs. All three engines handle missing values, interactions, and nonlinearities; our suggestion is that you try all of them to see which performs best with your data. MARS may be the best choice if you re looking for a traditional regression equation. If you prefer decision trees, try TreeNet or RandomForests. If you re stuck, send us an at support@salfordsystems.com and we ll help you make your decision! Resources Ask for Help! About MARS About TreeNet About RandomForests
Evolution of Regression II: From OLS to GPS to MARS Hands-on with SPM
 Evolution of Regression II: From OLS to GPS to MARS Hands-on with SPM March 2013 Dan Steinberg Mikhail Golovnya Salford Systems Salford Systems 2013 1 Course Outline Today s Webinar: Hands-on companion
NEURAL NETWORKS. Cement. Blast Furnace Slag. Fly Ash. Water. Superplasticizer. Coarse Aggregate. Fine Aggregate. Age
 NEURAL NETWORKS As an introduction, we ll tackle a prediction task with a continuous variable. We ll reproduce research from the field of cement and concrete manufacturing that seeks to model the compressive
Random Forest A. Fornaser
 Random Forest A. Fornaser alberto.fornaser@unitn.it Sources Lecture 15: decision trees, information theory and random forests, Dr. Richard E. Turner Trees and Random Forests, Adele Cutler, Utah State University
SPM Users Guide. This guide elaborates on powerful ways to combine the TreeNet and GPS engines to achieve model compression and more.
 SPM Users Guide Model Compression via ISLE and RuleLearner This guide elaborates on powerful ways to combine the TreeNet and GPS engines to achieve model compression and more. Title: Model Compression
Evolution of Regression III:
 Evolution of Regression III: From OLS to GPS, MARS, CART, TreeNet and RandomForests March 2013 Dan Steinberg Mikhail Golovnya Salford Systems Course Outline Previous Webinars: Regression Problem quick
Putting it all together: Creating a Big Data Analytic Workflow with Spotfire
 Putting it all together: Creating a Big Data Analytic Workflow with Spotfire Authors: David Katz and Mike Alperin, TIBCO Data Science Team In a previous blog, we showed how ultra-fast visualization of
Model Inference and Averaging. Baging, Stacking, Random Forest, Boosting
 Model Inference and Averaging Baging, Stacking, Random Forest, Boosting Bagging Bootstrap Aggregating Bootstrap Repeatedly select n data samples with replacement Each dataset b=1:b is slightly different
v SMS 12.2 Tutorial Observation Prerequisites Requirements Time minutes
 v. 12.2 SMS 12.2 Tutorial Observation Objectives This tutorial will give an overview of using the observation coverage in SMS. Observation points will be created to measure the numerical analysis with
v Observations SMS Tutorials Prerequisites Requirements Time Objectives
 v. 13.0 SMS 13.0 Tutorial Objectives This tutorial will give an overview of using the observation coverage in SMS. Observation points will be created to measure the numerical analysis with measured field
From Building Better Models with JMP Pro. Full book available for purchase here.
 From Building Better Models with JMP Pro. Full book available for purchase here. Contents Acknowledgments... ix About This Book... xi About These Authors... xiii Part 1 Introduction... 1 Chapter 1 Introduction...
Random Forests and Boosting
 Random Forests and Boosting Tree-based methods are simple and useful for interpretation. However they typically are not competitive with the best supervised learning approaches in terms of prediction accuracy.
Fraud Detection Using Random Forest Algorithm
 Fraud Detection Using Random Forest Algorithm Eesha Goel Computer Science Engineering and Technology, GZSCCET, Bhatinda, India eesha1992@rediffmail.com Abhilasha Computer Science Engineering and Technology,
Using Multivariate Adaptive Regression Splines (MARS ) to enhance Generalised Linear Models. Inna Kolyshkina PriceWaterhouseCoopers
 to enhance Generalised Linear Models. Inna Kolyshkina PriceWaterhouseCoopers") Using Multivariate Adaptive Regression Splines (MARS ) to enhance Generalised Linear Models. Inna Kolyshkina PriceWaterhouseCoopers Why enhance GLM? Shortcomings of the linear modelling approach. GLM being
Using Multivariate Adaptive Regression Splines (MARS ) to enhance Generalised Linear Models. Inna Kolyshkina PriceWaterhouseCoopers Why enhance GLM? Shortcomings of the linear modelling approach. GLM being
Preface to the Second Edition. Preface to the First Edition. 1 Introduction 1
 Preface to the Second Edition Preface to the First Edition vii xi 1 Introduction 1 2 Overview of Supervised Learning 9 2.1 Introduction... 9 2.2 Variable Types and Terminology... 9 2.3 Two Simple Approaches
Observation Coverage SURFACE WATER MODELING SYSTEM. 1 Introduction. 2 Opening the Data
 SURFACE WATER MODELING SYSTEM Observation Coverage 1 Introduction An important part of any computer model is the verification of results. Surface water modeling is no exception. Before using a surface
Sandeep Kharidhi and WenSui Liu ChoicePoint Precision Marketing
 Generalized Additive Model and Applications in Direct Marketing Sandeep Kharidhi and WenSui Liu ChoicePoint Precision Marketing Abstract Logistic regression 1 has been widely used in direct marketing applications
The Basics of Decision Trees
 Tree-based Methods Here we describe tree-based methods for regression and classification. These involve stratifying or segmenting the predictor space into a number of simple regions. Since the set of splitting
Your Name: Section: INTRODUCTION TO STATISTICAL REASONING Computer Lab #4 Scatterplots and Regression
 Your Name: Section: 36-201 INTRODUCTION TO STATISTICAL REASONING Computer Lab #4 Scatterplots and Regression Objectives: 1. To learn how to interpret scatterplots. Specifically you will investigate, using
UW Department of Chemistry Lab Lectures Online
 Introduction to Excel and Computer Manipulation of Data Review Appendix A: Introduction to Statistical Analysis. Focus on the meanings and implications of the calculated values and not on the calculations.
Big Data Methods. Chapter 5: Machine learning. Big Data Methods, Chapter 5, Slide 1
 Big Data Methods Chapter 5: Machine learning Big Data Methods, Chapter 5, Slide 1 5.1 Introduction to machine learning What is machine learning? Concerned with the study and development of algorithms that
MIT Samberg Center Cambridge, MA, USA. May 30 th June 2 nd, by C. Rea, R.S. Granetz MIT Plasma Science and Fusion Center, Cambridge, MA, USA
 Exploratory Machine Learning studies for disruption prediction on DIII-D by C. Rea, R.S. Granetz MIT Plasma Science and Fusion Center, Cambridge, MA, USA Presented at the 2 nd IAEA Technical Meeting on
Overview and Practical Application of Machine Learning in Pricing
 Overview and Practical Application of Machine Learning in Pricing 2017 CAS Spring Meeting May 23, 2017 Duncan Anderson and Claudine Modlin (Willis Towers Watson) Mark Richards (Allstate Insurance Company)
High dimensional data analysis
 High dimensional data analysis Cavan Reilly October 24, 2018 Table of contents Data mining Random forests Missing data Logic regression Multivariate adaptive regression splines Data mining Data mining
Allstate Insurance Claims Severity: A Machine Learning Approach
 Allstate Insurance Claims Severity: A Machine Learning Approach Rajeeva Gaur SUNet ID: rajeevag Jeff Pickelman SUNet ID: pattern Hongyi Wang SUNet ID: hongyiw I. INTRODUCTION The insurance industry has
Applications of the k-nearest neighbor method for regression and resampling
 Applications of the k-nearest neighbor method for regression and resampling Objectives Provide a structured approach to exploring a regression data set. Introduce and demonstrate the k-nearest neighbor
What s New in Spotfire DXP 1.1. Spotfire Product Management January 2007
 What s New in Spotfire DXP 1.1 Spotfire Product Management January 2007 Spotfire DXP Version 1.1 This document highlights the new capabilities planned for release in version 1.1 of Spotfire DXP. In this
Subject. Dataset. Copy paste feature of the diagram. Importing the dataset. Copy paste feature into the diagram.
 Subject Copy paste feature into the diagram. When we define the data analysis process into Tanagra, it is possible to copy components (or entire branches of components) towards another location into the
Ensemble methods in machine learning. Example. Neural networks. Neural networks
 Ensemble methods in machine learning Bootstrap aggregating (bagging) train an ensemble of models based on randomly resampled versions of the training set, then take a majority vote Example What if you
PS 6: Regularization. PART A: (Source: HTF page 95) The Ridge regression problem is:
 The Ridge regression problem is:") Economics 1660: Big Data PS 6: Regularization Prof. Daniel Björkegren PART A: (Source: HTF page 95) The Ridge regression problem is: : β "#$%& = argmin (y # β 2 x #4 β 4 ) 6 6 + λ β 4 #89 Consider the
Economics 1660: Big Data PS 6: Regularization Prof. Daniel Björkegren PART A: (Source: HTF page 95) The Ridge regression problem is: : β "#$%& = argmin (y # β 2 x #4 β 4 ) 6 6 + λ β 4 #89 Consider the
Predictive Analysis: Evaluation and Experimentation. Heejun Kim
 Predictive Analysis: Evaluation and Experimentation Heejun Kim June 19, 2018 Evaluation and Experimentation Evaluation Metrics Cross-Validation Significance Tests Evaluation Predictive analysis: training
Lecture 06 Decision Trees I
 Lecture 06 Decision Trees I 08 February 2016 Taylor B. Arnold Yale Statistics STAT 365/665 1/33 Problem Set #2 Posted Due February 19th Piazza site https://piazza.com/ 2/33 Last time we starting fitting
CS294-1 Assignment 2 Report
 CS294-1 Assignment 2 Report Keling Chen and Huasha Zhao February 24, 2012 1 Introduction The goal of this homework is to predict a users numeric rating for a book from the text of the user s review. The
Business Club. Decision Trees
 Business Club Decision Trees Business Club Analytics Team December 2017 Index 1. Motivation- A Case Study 2. The Trees a. What is a decision tree b. Representation 3. Regression v/s Classification 4. Building
Both the polynomial must meet and give same value at t=4 and should look like this
 Polymath Regression tutorial on Polynomial fitting of data The following table shows the raw data for experimental tracer concentration from a reactor which you need to fit using Polymath (refer Example
Network Traffic Measurements and Analysis
 DEIB - Politecnico di Milano Fall, 2017 Sources Hastie, Tibshirani, Friedman: The Elements of Statistical Learning James, Witten, Hastie, Tibshirani: An Introduction to Statistical Learning Andrew Ng:
Overview. Non-Parametrics Models Definitions KNN. Ensemble Methods Definitions, Examples Random Forests. Clustering. k-means Clustering 2 / 8
 Tutorial 3 1 / 8 Overview Non-Parametrics Models Definitions KNN Ensemble Methods Definitions, Examples Random Forests Clustering Definitions, Examples k-means Clustering 2 / 8 Non-Parametrics Models Definitions
Machine Learning: An Applied Econometric Approach Online Appendix
 Machine Learning: An Applied Econometric Approach Online Appendix Sendhil Mullainathan mullain@fas.harvard.edu Jann Spiess jspiess@fas.harvard.edu April 2017 A How We Predict In this section, we detail
Lecture 20: Bagging, Random Forests, Boosting
 Lecture 20: Bagging, Random Forests, Boosting Reading: Chapter 8 STATS 202: Data mining and analysis November 13, 2017 1 / 17 Classification and Regression trees, in a nut shell Grow the tree by recursively
Applying Supervised Learning
 Applying Supervised Learning When to Consider Supervised Learning A supervised learning algorithm takes a known set of input data (the training set) and known responses to the data (output), and trains
SPM Users Guide. Introducing TreeNet. This guide describes the TreeNet Product and illustrates some practical examples of its basic usage and approach
 SPM Users Guide Introducing TreeNet This guide describes the TreeNet Product and illustrates some practical examples of its basic usage and approach 2 TreeNet Introduction TreeNet is a revolutionary advance
Introduction to Classification & Regression Trees
 Introduction to Classification & Regression Trees ISLR Chapter 8 vember 8, 2017 Classification and Regression Trees Carseat data from ISLR package Classification and Regression Trees Carseat data from
Predicting Rare Failure Events using Classification Trees on Large Scale Manufacturing Data with Complex Interactions
 2016 IEEE International Conference on Big Data (Big Data) Predicting Rare Failure Events using Classification Trees on Large Scale Manufacturing Data with Complex Interactions Jeff Hebert, Texas Instruments
SPM Users Guide. RandomForests Modeling Basics. This guide provides an introduction into RandomForests Modeling Basics.
 SPM Users Guide RandomForests Modeling Basics This guide provides an introduction into RandomForests Modeling Basics. Title: RandomForests Modeling Basics Short Description: This guide provides an introduction
Introducing TreeNet Gradient Boosting Machine
 This guide describes the TreeNet product and illustrates some practical examples of its basic usage and approach. 2018 by Minitab Inc. All rights reserved. Minitab, SPM, SPM, Salford Predictive Modeler,
Performance Estimation and Regularization. Kasthuri Kannan, PhD. Machine Learning, Spring 2018
 Performance Estimation and Regularization Kasthuri Kannan, PhD. Machine Learning, Spring 2018 Bias- Variance Tradeoff Fundamental to machine learning approaches Bias- Variance Tradeoff Error due to Bias:
Graphical Analysis of Data using Microsoft Excel [2016 Version]
![Graphical Analysis of Data using Microsoft Excel [2016 Version]](/thumbs/72/67574169.jpg "Graphical Analysis of Data using Microsoft Excel [2016 Version]") Graphical Analysis of Data using Microsoft Excel [2016 Version] Introduction In several upcoming labs, a primary goal will be to determine the mathematical relationship between two variable physical parameters.
Graphical Analysis of Data using Microsoft Excel [2016 Version] Introduction In several upcoming labs, a primary goal will be to determine the mathematical relationship between two variable physical parameters.
GETTING STARTED WITH DATA MINING
 GETTING STARTED WITH DATA MINING Nora Galambos, PhD Senior Data Scientist Office of Institutional Research, Planning & Effectiveness Stony Brook University AIR Forum 2017 Washington, D.C. 1 Using Data
DI TRANSFORM. The regressive analyses. identify relationships
 July 2, 2015 DI TRANSFORM MVstats TM Algorithm Overview Summary The DI Transform Multivariate Statistics (MVstats TM ) package includes five algorithm options that operate on most types of geologic, geophysical,
Data Mining: STATISTICA
 Outline Data Mining: STATISTICA Prepare the data Classification and regression (C & R, ANN) Clustering Association rules Graphic user interface Prepare the Data Statistica can read from Excel,.txt and
Practical Guidance for Machine Learning Applications
 Practical Guidance for Machine Learning Applications Brett Wujek About the authors Material from SGF Paper SAS2360-2016 Brett Wujek Senior Data Scientist, Advanced Analytics R&D ~20 years developing engineering
Data analysis case study using R for readily available data set using any one machine learning Algorithm
 Assignment-4 Data analysis case study using R for readily available data set using any one machine learning Algorithm Broadly, there are 3 types of Machine Learning Algorithms.. 1. Supervised Learning
Lecture 27: Review. Reading: All chapters in ISLR. STATS 202: Data mining and analysis. December 6, 2017
 Lecture 27: Review Reading: All chapters in ISLR. STATS 202: Data mining and analysis December 6, 2017 1 / 16 Final exam: Announcements Tuesday, December 12, 8:30-11:30 am, in the following rooms: Last
Random Forest in Genomic Selection
 Random Forest in genomic selection 1 Dpto Mejora Genética Animal, INIA, Madrid; Universidad Politécnica de Valencia, 20-24 September, 2010. Outline 1 Remind 2 Random Forest Introduction Classification
Comparison of Statistical Learning and Predictive Models on Breast Cancer Data and King County Housing Data
 Comparison of Statistical Learning and Predictive Models on Breast Cancer Data and King County Housing Data Yunjiao Cai 1, Zhuolun Fu, Yuzhe Zhao, Yilin Hu, Shanshan Ding Department of Applied Economics
CSC 411 Lecture 4: Ensembles I
 CSC 411 Lecture 4: Ensembles I Roger Grosse, Amir-massoud Farahmand, and Juan Carrasquilla University of Toronto UofT CSC 411: 04-Ensembles I 1 / 22 Overview We ve seen two particular classification algorithms:
The first thing we ll need is some numbers. I m going to use the set of times and drug concentration levels in a patient s bloodstream given below.
 Graphing in Excel featuring Excel 2007 1 A spreadsheet can be a powerful tool for analyzing and graphing data, but it works completely differently from the graphing calculator that you re used to. If you
How to Decompose Variable Importance from a Support Vector Machine
 How to Decompose Variable Importance from a Support Vector Machine By Randy Collica Sr. Solutions Architect, SAS Institute 11-Dec-15 This note shows how you can use SAS Enterprise Miner 14.1 to develop
CS 179 Lecture 16. Logistic Regression & Parallel SGD
 CS 179 Lecture 16 Logistic Regression & Parallel SGD 1 Outline logistic regression (stochastic) gradient descent parallelizing SGD for neural nets (with emphasis on Google s distributed neural net implementation)
Nonparametric Approaches to Regression
 Nonparametric Approaches to Regression In traditional nonparametric regression, we assume very little about the functional form of the mean response function. In particular, we assume the model where m(xi)
Tips and Guidance for Analyzing Data. Executive Summary
 Tips and Guidance for Analyzing Data Executive Summary This document has information and suggestions about three things: 1) how to quickly do a preliminary analysis of time-series data; 2) key things to
Math 113 Linear Perspective Homework
 Math 113 Linear Perspective Homework 1. As mentioned in the notes, all points in the xy-coordinate plane have -value equal to 0. In fact, = 0 is the equation of the xy-plane. a) What is the equation of
Statistical Methods for Data Mining
 Statistical Methods for Data Mining Kuangnan Fang Xiamen University Email: xmufkn@xmu.edu.cn Tree-based Methods Here we describe tree-based methods for regression and classification. These involve stratifying
Outline. Prepare the data Classification and regression Clustering Association rules Graphic user interface
 Data Mining: i STATISTICA Outline Prepare the data Classification and regression Clustering Association rules Graphic user interface 1 Prepare the Data Statistica can read from Excel,.txt and many other
Scatterplot: The Bridge from Correlation to Regression
 Scatterplot: The Bridge from Correlation to Regression We have already seen how a histogram is a useful technique for graphing the distribution of one variable. Here is the histogram depicting the distribution
CLASSIFICATION FOR SCALING METHODS IN DATA MINING
 CLASSIFICATION FOR SCALING METHODS IN DATA MINING Eric Kyper, College of Business Administration, University of Rhode Island, Kingston, RI 02881 (401) 874-7563, ekyper@mail.uri.edu Lutz Hamel, Department
Final Report: Kaggle Soil Property Prediction Challenge
 Final Report: Kaggle Soil Property Prediction Challenge Saurabh Verma (verma076@umn.edu, (612)598-1893) 1 Project Goal Low cost and rapid analysis of soil samples using infrared spectroscopy provide new
Application of Multivariate Adaptive Regression Splines to Evaporation Losses in Reservoirs
 Open access e-journal Earth Science India, eissn: 0974 8350 Vol. 4(I), January, 20, pp.5-20 http://www.earthscienceindia.info/ Application of Multivariate Adaptive Regression Splines to Evaporation Losses
HMC CS 158, Fall 2017 Problem Set 3 Programming: Regularized Polynomial Regression
 HMC CS 158, Fall 2017 Problem Set 3 Programming: Regularized Polynomial Regression Goals: To open up the black-box of scikit-learn and implement regression models. To investigate how adding polynomial
DATA MINING AND MACHINE LEARNING. Lecture 6: Data preprocessing and model selection Lecturer: Simone Scardapane
 DATA MINING AND MACHINE LEARNING Lecture 6: Data preprocessing and model selection Lecturer: Simone Scardapane Academic Year 2016/2017 Table of contents Data preprocessing Feature normalization Missing
Probabilistic Analysis Tutorial
 Probabilistic Analysis Tutorial 2-1 Probabilistic Analysis Tutorial This tutorial will familiarize the user with the Probabilistic Analysis features of Swedge. In a Probabilistic Analysis, you can define
Both the polynomial must meet and give same value at t=4 and should look like this
 Polymath Regression tutorial on Polynomial fitting of data The following table shows the raw data for experimental tracer concentration from a reactor which you need to fit using Polymath (refer Example
STAT 311 (3 CREDITS) VARIANCE AND REGRESSION ANALYSIS ELECTIVE: ALL STUDENTS. CONTENT Introduction to Computer application of variance and regression
 VARIANCE AND REGRESSION ANALYSIS ELECTIVE: ALL STUDENTS. CONTENT Introduction to Computer application of variance and regression") STAT 311 (3 CREDITS) VARIANCE AND REGRESSION ANALYSIS ELECTIVE: ALL STUDENTS. CONTENT Introduction to Computer application of variance and regression analysis. Analysis of Variance: one way classification,
STAT 311 (3 CREDITS) VARIANCE AND REGRESSION ANALYSIS ELECTIVE: ALL STUDENTS. CONTENT Introduction to Computer application of variance and regression analysis. Analysis of Variance: one way classification,
Predictive Analytics: Demystifying Current and Emerging Methodologies. Tom Kolde, FCAS, MAAA Linda Brobeck, FCAS, MAAA
 Predictive Analytics: Demystifying Current and Emerging Methodologies Tom Kolde, FCAS, MAAA Linda Brobeck, FCAS, MAAA May 18, 2017 About the Presenters Tom Kolde, FCAS, MAAA Consulting Actuary Chicago,
MINI-PAPER A Gentle Introduction to the Analysis of Sequential Data
 MINI-PAPER by Rong Pan, Ph.D., Assistant Professor of Industrial Engineering, Arizona State University We, applied statisticians and manufacturing engineers, often need to deal with sequential data, which
COMM 391 Winter 2014 Term 1. Tutorial 2: Microsoft Excel Using VLookUp and Creating PivotChart
 COMM 391 Winter 2014 Term 1 Tutorial 2: Microsoft Excel Using VLookUp and Creating PivotChart The purpose of this tutorial is to enable you to learn how to use the VLookUp function and create a PivotChart
ADVANCED ANALYTICS USING SAS ENTERPRISE MINER RENS FEENSTRA
 INSIGHTS@SAS: ADVANCED ANALYTICS USING SAS ENTERPRISE MINER RENS FEENSTRA AGENDA 09.00 09.15 Intro 09.15 10.30 Analytics using SAS Enterprise Guide Ellen Lokollo 10.45 12.00 Advanced Analytics using SAS
CSE 158 Lecture 2. Web Mining and Recommender Systems. Supervised learning Regression
 CSE 158 Lecture 2 Web Mining and Recommender Systems Supervised learning Regression Supervised versus unsupervised learning Learning approaches attempt to model data in order to solve a problem Unsupervised
Non-linear regression tutorial
 Non-linear regression tutorial The following table shows the raw data for performing nonlinear regression using Polymath (refer Table E7-4.1, Elements of chemical reaction engineering, 5 th edition) Pco
DS Machine Learning and Data Mining I. Alina Oprea Associate Professor, CCIS Northeastern University
 DS 4400 Machine Learning and Data Mining I Alina Oprea Associate Professor, CCIS Northeastern University January 22 2019 Outline Practical issues in Linear Regression Outliers Categorical variables Lab
Section A1: Gradients of straight lines
 Time To study this unit will take you about 10 hours. Trying out and evaluating the activities with your pupils in the class will be spread over the weeks you have planned to cover the topic. 31 Section
To complete the computer assignments, you ll use the EViews software installed on the lab PCs in WMC 2502 and WMC 2506.
 An Introduction to EViews The purpose of the computer assignments in BUEC 333 is to give you some experience using econometric software to analyse real-world data. Along the way, you ll become acquainted
Machine Learning Duncan Anderson Managing Director, Willis Towers Watson
 Machine Learning Duncan Anderson Managing Director, Willis Towers Watson 21 March 2018 GIRO 2016, Dublin - Response to machine learning Don t panic! We re doomed! 2 This is not all new Actuaries adopt
A Practical Tour of Ensemble (Machine) Learning
 Learning") A Practical Tour of Ensemble (Machine) Learning Nima Hejazi Evan Muzzall Division of Biostatistics, University of California, Berkeley D-Lab, University of California, Berkeley slides: https://googl/wwaqc
A Practical Tour of Ensemble (Machine) Learning Nima Hejazi Evan Muzzall Division of Biostatistics, University of California, Berkeley D-Lab, University of California, Berkeley slides: https://googl/wwaqc
Linear and Quadratic Least Squares
 Linear and Quadratic Least Squares Prepared by Stephanie Quintal, graduate student Dept. of Mathematical Sciences, UMass Lowell in collaboration with Marvin Stick Dept. of Mathematical Sciences, UMass
Notes on Multilayer, Feedforward Neural Networks
 Notes on Multilayer, Feedforward Neural Networks CS425/528: Machine Learning Fall 2012 Prepared by: Lynne E. Parker [Material in these notes was gleaned from various sources, including E. Alpaydin s book
Survey of Math: Excel Spreadsheet Guide (for Excel 2016) Page 1 of 9
 Page 1 of 9") Survey of Math: Excel Spreadsheet Guide (for Excel 2016) Page 1 of 9 Contents 1 Introduction to Using Excel Spreadsheets 2 1.1 A Serious Note About Data Security.................................... 2 1.2
Survey of Math: Excel Spreadsheet Guide (for Excel 2016) Page 1 of 9 Contents 1 Introduction to Using Excel Spreadsheets 2 1.1 A Serious Note About Data Security.................................... 2 1.2
Graphing on Excel. Open Excel (2013). The first screen you will see looks like this (it varies slightly, depending on the version):
. The first screen you will see looks like this (it varies slightly, depending on the version):") Graphing on Excel Open Excel (2013). The first screen you will see looks like this (it varies slightly, depending on the version): The first step is to organize your data in columns. Suppose you obtain
Graphing on Excel Open Excel (2013). The first screen you will see looks like this (it varies slightly, depending on the version): The first step is to organize your data in columns. Suppose you obtain
Learn the various 3D interpolation methods available in GMS
 v. 10.4 GMS 10.4 Tutorial Learn the various 3D interpolation methods available in GMS Objectives Explore the various 3D interpolation algorithms available in GMS, including IDW and kriging. Visualize the
Package IPMRF. August 9, 2017
 Type Package Package IPMRF August 9, 2017 Title Intervention in Prediction Measure (IPM) for Random Forests Version 1.2 Date 2017-08-09 Author Irene Epifanio, Stefano Nembrini Maintainer Irene Epifanio
Lastly, in case you don t already know this, and don t have Excel on your computers, you can get it for free through IT s website under software.
 Welcome to Basic Excel, presented by STEM Gateway as part of the Essential Academic Skills Enhancement, or EASE, workshop series. Before we begin, I want to make sure we are clear that this is by no means
CS 229 Final Project - Using machine learning to enhance a collaborative filtering recommendation system for Yelp
 CS 229 Final Project - Using machine learning to enhance a collaborative filtering recommendation system for Yelp Chris Guthrie Abstract In this paper I present my investigation of machine learning as
A TUTORIAL ON WORD. Katie Gregory
 A TUTORIAL ON WORD Katie Gregory First, CLICK HERE Then, find Microsoft Word under programs and the Microsoft Office 2013 Folder This is what the document should look like when opened. SAVING A WORD DOCUMENT
Model Answers to The Next Pixel Prediction Task
 Model Answers to The Next Pixel Prediction Task December 2, 25. (Data preprocessing and visualization, 8 marks) (a) Solution. In Algorithm we are told that the data was discretized to 64 grey scale values,...,
Geology Geomath Estimating the coefficients of various Mathematical relationships in Geology
 Geology 351 - Geomath Estimating the coefficients of various Mathematical relationships in Geology Throughout the semester you ve encountered a variety of mathematical relationships between various geologic
Using Large Data Sets Workbook Version A (MEI)
") Using Large Data Sets Workbook Version A (MEI) 1 Index Key Skills Page 3 Becoming familiar with the dataset Page 3 Sorting and filtering the dataset Page 4 Producing a table of summary statistics with
Using Large Data Sets Workbook Version A (MEI) 1 Index Key Skills Page 3 Becoming familiar with the dataset Page 3 Sorting and filtering the dataset Page 4 Producing a table of summary statistics with
Neural Networks and Machine Learning Applied to Classification of Cancer. Sachin Govind, Advisor: Namrata Pandya, IMSA
 Neural Networks and Machine Learning Applied to Classification of Cancer Sachin Govind, Advisor: Namrata Pandya, IMSA Cancer Screening Current methods Invasive techniques (biopsy, colonoscopy, etc.) Helical
Scalable Machine Learning in R. with H2O
 Scalable Machine Learning in R with H2O Erin LeDell @ledell DSC July 2016 Introduction Statistician & Machine Learning Scientist at H2O.ai in Mountain View, California, USA Ph.D. in Biostatistics with
Lecture on Modeling Tools for Clustering & Regression
 Lecture on Modeling Tools for Clustering & Regression CS 590.21 Analysis and Modeling of Brain Networks Department of Computer Science University of Crete Data Clustering Overview Organizing data into
Concrete Property Database
 UNIVERSITY OF NOTRE DAME DEPARTMENT OF CIVIL ENGINEERING AND GEOLOGICAL SCIENCES Concrete Property Database Installation Guide and Instruction Manual Adam Knaack Created: 4/23/2009 Table of Contents Introduction...
Introduction to Random Forests. This guide provides a brief introduction to Random Forests.
 Introduction to Random Forests This guide provides a brief introduction to Random Forests. 2018 by Minitab Inc. All rights reserved. Minitab, SPM, SPM Salford Predictive Modeler, Salford Predictive Modeler,