Evolution of Regression II: From OLS to GPS to MARS Hands-on with SPM
|
|
|
- Dayna Hill
- 6 years ago
- Views:
Transcription
1 Evolution of Regression II: From OLS to GPS to MARS Hands-on with SPM March 2013 Dan Steinberg Mikhail Golovnya Salford Systems Salford Systems
2 Course Outline Today s Webinar: Hands-on companion session Regression Problem quick overview Classical OLS the starting point RIDGE/LASSO/GPS regularized regression MARS adaptive non-linear regression Follow Up Webinars CART Regression tree Random Forest ensembles TreeNet Stochastic Gradient Boosting Hybrid TreeNet/GPS models Salford Systems
3 Regression Challenges Preparation of data errors, missing values, etc. Determination of predictors to include in model o Hundreds, thousands, even tens and hundreds of thousands available Transformation or coding of predictors o Conventional approaches consider logarithm, power, inverse, etc.. Detecting and modeling important interactions Possibly huge number of records Complexity of underlying relationship Lack of external knowledge Salford Systems
4 Boston Housing Data Set Concerns the housing values in Boston area Harrison, D. and D. Rubinfeld. Hedonic Prices and the Demand For Clean Air. Journal of Environmental Economics and Management, v5, , 1978 Combined information from 10 separate governmental and educational sources to produce this data set 506 census tracts in City of Boston for the year 1970 o Goal: study relationship between quality of life variables and property values o MV median value of owner-occupied homes in tract ($1,000 s) o CRIM per capita crime rates o NOX concentration of nitric oxides (pp 10 million) o AGE percent built before 1940 o DIS weighted distance to centers of employment o RM average number of rooms per house o LSTAT % lower status of the population o RAD accessibility to radial highways o CHAS borders Charles River (0/1) o INDUS percent non-retail business o TAX property tax rate per $10,000 o PT pupil teacher ratio Salford Systems

 ODBC")
5 Open Data and First Look File..Open Displays recently opened files Options for opening different SPM files Specific file format options for major database formats (SAS, SPSS, R, Excel, CSV) ODBC connectivity to RDBMS Salford Systems


6 Quick Metadata and View Data Click View Data Salford Systems

7 Ready To Model From Menu choose Model From Toolbar choose modeling icon From Activity Window below left, select Model Model dialog starts with tab in red until target has been chosen Salford Systems

8 Setting Up the Regression Select MV as the target (dependent variable) Select allowed predictors (check none=select all) Analysis Type: Regression Analysis Method: MARS Click, Shift, highlight to select groups of predictors and then click Select Predictors for groups of predictors This is all that is required to run an SPM analysis Open file Select target Click START Rest is just options and controls Salford Systems


9 Classical Regression Results 20% random test partition Out of the box regression No attempt to perfect Test MSE= Salford Systems


10 Residual Box Plots Test Data Learn Data Salford Systems
 >20 to be evidence of extreme outliers")
11 Fraction of MSE Due to Largest Residuals Largest Residual Accounts for 13.4% of the total MSE We consider a lift (%MSE / %Residuals) >20 to be evidence of extreme outliers Salford Systems


12 BATTERY PARTITION: Rerun 80/20 Learn test 100 times Note partition sizes are constant All three partitions change each cycle Mean MSE=23.80 Salford Systems


13 BATTERY BOOTSTRAP Other options to obtain measures of what could reasonably expected when predicting from other samples drawn from same population Model Setup, Bootstrap Options, Results Salford Systems

14 MARS Modeling Select MARS from Analysis Method Click Regression for Analysis Type Select MV as the target Can explicitly select all other variables as allowed predictors Salford Systems

15 MARS Modeling Options We will start with MARS defaults Most important controls are: Max Basis Functions Degree of Interaction Defaults: Max BF=15 Max Interaction Level=1 Will always want to experiment but can start with this relatively simple set up Salford Systems
 and one based on an internal penalty on model complexity (no reference to the test")
16 Quick MARS Result Observe that sample partition is as expected: 92 records in test partition We are guaranteed that this partition will not change if we do not change random number seed in preferences Two models are identified as optimal: one based on test sample performance (Prediction squared Error) and one based on an internal penalty on model complexity (no reference to the test sample) Salford Systems

17 Summary displays optimal model details Observe results displayed are for the 15 basis function model MSE on test sample is a remarkably lower We have access to similar results for all other models of any size (later) Salford Systems
 Double click on any row to bring up its details Salford")
18 MARS Selector: Access to all available models Access to 15 models starting with the largest with 15 basis functions (regressors) Progressively smaller models all the way to no model (which might be best) Double click on any row to bring up its details Salford Systems


19 Residual Box Plots MARS Model Test Data Learn Data Salford Systems


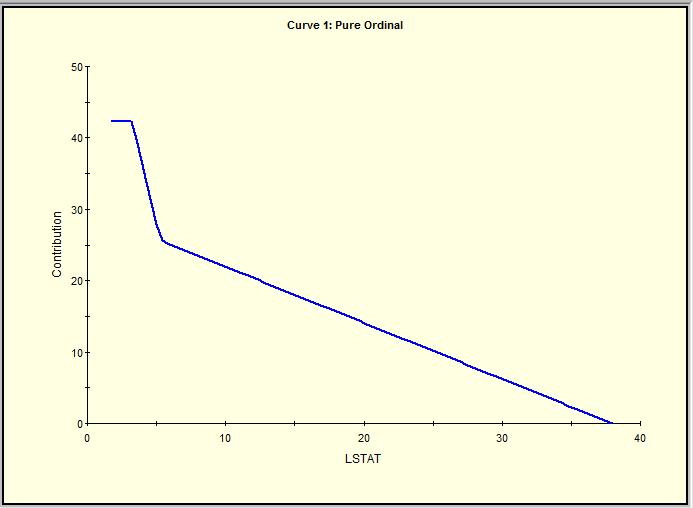
20 How Did MARS do so well? By Transforming the predictors Curves and Surfaces Displays the transforms All are essentially broken line regressions Salford Systems
21 Remaining Graphs Salford Systems

 Salford")
22 Remaining Graphs Most predictors subjected to rather simple transforms Here we see either one line segment (no transform) or two segments allowing a change of slope in the regression at some critical point (knot) Salford Systems


23 MARS Model with ONE Predictor Use LSTAT as lone predictor Look at graph for each sized model Repeatedly double click on different rows of selector table Salford Systems


24 Variations of the MARS Model Salford Systems
25 MARS Uses a forward growing and a backward pruning strategy Forward Stepwise Knot Placement BasFn(s) GCV IndBsFns EfPrms Variable Knot LSTAT RM DIS CRIM PT TAX RAD NOX B Classic Output reports the forward stepping progress of model construction Each step involves a predictor and a knot where regression slope changes A predictor broken via knot contributes TWO predictors to model (two regions) See our MARS course for a detailed discussion of all elements above Salford Systems
26 Backstepping We backstep from largest model to smallest possible Each step eliminates a regressor which may be a region of a raw variable Backstep all the way to the null model Evaluate test sample performance of each model extracted from the backstepping sequence MARS also offers an internal method based on a penalty placed on model complexity if no test data available Report optimal model but give access to all models in the sequence Salford Systems

27 Model Details and Selection Reveals Backstepping. Starts with Largest Model Salford Systems

28 MARS Model as Code Basis Function tab displays the model detail Includes code that would allow model to be rebuilt on same or new data Salford Systems

29 Can we improve the model? 28 built-in MARS experiments designed to help you find the right settings and modeling strategy Salford Systems

30 BATTERY BASIS Salford Systems

31 BATTERY BOOTSTRAP MARS Model Test MSE 5 th percentile=12.82, 95 th percentile=19.89 Median number of basis functions=8 Salford Systems

32 Bootstrap MSE Profiles MARS Models Salford Systems

33 Bootstrapped GPS Coefficient Bounds Predictor Coefficient Order RawVarImp Lower Upper % Selected Constant CHAS = CRIM ZN INDUS NOX RM AGE DIS RAD TAX PT B LSTAT Request Bootstrap to obtain bounds on GPS coefficient estimates May take considerable time on large data sets Salford Systems
34 MARS Observations MARS does its own variable selection. You specify what is allowed. MARS decides what to actually use. MARS automatically handles missing values o o Creates missing value indicators (MVIs) and allows them into model Predictors with missings are interacted with MVI to create a special sub-branch of model just for records without missings for that variable MARS automatically detects interactions o o Forward stepping permits construction of an interaction Interactions are of basis functions (regions of predictors) MARS transforms all variables before it uses them MARS can model the 0/1 binary target well Better to do advance variable selection when there are many (eg use CART decision tree or TreeNet gradient boosting) MARS is not at its best with many predictors having missing values Salford Systems
35 Motivation for Regularized Regression Unsatisfactory regression results based on data modeling physical processes (1970) when predictors correlated o o o o Resulting coefficient estimates could change dramatically with small changes in the data Some coefficient values judged to be much too large Frequent appearance of coefficients with the wrong sign Problem severe with substantial multicollinearity but always present Solution proposed by Hoerl and Kennard, (Technometrics, 1970) was Ridge regression o First proposal by Hoerl just for stabilization of coefficients 1962 o Initially very poorly received by statistics profession Intentionally biased but yields both more satisfactory coefficient estimates and superior generalization o Better performance (test MSE) on previously unseen data Shrinkage of regression coefficients towards zero Salford Systems
36 Lasso Regularized Regression Introduced by Tibshirani in 1996 explicitly as an improvement on the RIDGE regression Least Absolute Shrinkage and Selection Operator Desire to gain the stability and lower variance of ridge regression while also performing variable selection Especially in the context of many possible predictors looking for a simple, stable, low predictive variance model Historical note: The Lasso was inspired by related work in 1993 by Leo Breiman (of CART and RandomForests fame). This was the non-negative garotte. Breiman s simulation studies showed the potential for improved prediction via selection and shrinkage Salford Systems


37 Getting Ready for GPS Generalized PathSeeker Regularized Regression Select GPS engine Specify regression 20% random test sample Salford Systems
 Could elect to go with the ultra-small 3 variable above (MSE=22.")
38 GPS Main Results Window Displays best test sample results for each size of model developed Could contain thousands of models, each of a different size We can simply go to the best model based on test sample results (MSE=21.361) Could elect to go with the ultra-small 3 variable above (MSE=22.66) Salford Systems


39 Ridge Regression vs OLS Ridge Regression Classical Regression Salford Systems


40 Bootstrap Resampling of Run GPS Test MSE percentiles 5 th = th =22.90 OLS Test MSE Percentiles 5 th = th =35.77 Salford Systems
41 GPS Terminology (Elastic Net Extended) All variations of GPS regularized regression are described by a single real number: Elasticity o o o 0 Searches for a very small number of coefficients in model (COMPACT) 1 - Selects predictors and differentially shrinks (LASSO) 2 - No variable selection, just shrinkage (RIDGE) RIDGE elasticity will not be true ridge regression if we limit the number of predictors allowed in model Elasticity can take on any value between 0 and 2 inclusive o o o By contrast the Elastic Net can vary only between 1 and 2 in our terminology Think of elasticity as controlling the premium we put on obtaining a smaller model (fewer coefficients) Elasticities<1 can be essential when dealing with many predictors (text mining, bioinformatics, post-processing of large ensemble models) Salford Systems
42 GPS Penalized Loss Function RIDGE penalty based on Sb 2 squared LASSO penalty based on S b absolute value COMPACT penalty based on S b 0 count Each elasticity is based on fitting a model that minimizes the residual sum of squared errors + penalty Penalty is a to be estimated constant times one of the functions of the b vector Intermediate elasticities are mixtures, e.g. we could have a 50/50 mix of RIDGE and LASSO Salford Systems
43 Regularized Regression - Theory OLS Regression Minimize Ridge: Sum of squared coefficients Mean Squared Error λ Model Complexity Lasso: Sum of absolute coefficients Minimize Regularized Regression Best Subsets: Number of coefficients Any regularized regression approach tries to balance model performance and model complexity λ regularization parameter o λ = Zero-coefficient solution o λ = 0 OLS solution Salford Systems


44 GPS Model Setup Advanced Setup allows specification of a grid of elasticities here 21 evenly spaced between 0 and 2 Default generates 4 elasticities Recommend to use other default settings Salford Systems

45 GPS Modeling Details Specific Elasticities Four different modeling strategies deployed above Each follows a forward stepwise algorithm to build up model Performance of each strategy at selected points along its path are displayed Can review coefficients and all performance measures for every model Salford Systems


46 Details for the 3 coefficient models Ridge will not necessarily show same number of coefficients as the others until close to the end of path Double click on Ridged Lasso column header to bring up more details as shown below Salford Systems

47 Sentinel Solutions Detail Along the path followed by GPS for every elasticity we identify the solution (coefficient vector) best for each performance measure No attention is paid to model size here so you might still prefer to select a model from the graphical display Salford Systems
48 GPS is Forward Stepping Classical ridge regression can be estimated just like an ordinary regression (just solve modified normal equations) but need a grid search over key shrinkage parameter Classical lasso was solved via quadratic programming in a backwards stepping algorithm Innovation in Friedman s Pathseeker (2004) and then Generalized PathSeeker (2008) was to convert difficult backwards stepping algorithm into forward stepping o Imagine problem with 10,000 predictors. Would prefer to forward step to a small solution Forward stepping algorithms applied to all elasticities Salford Systems
49 How to Forward Step At any stage of model development choose between Add a new variable to Update an existing model variable coefficient Step sizes are small, initial coefficients for any model are very small and are updated in very small increments This explains why the Ridge elasticity can have solutions with less than all the variables o o Technically ridge does not select variables, it only shrinks In practice it can only add one variable per step Salford Systems

50 Steps and Points Rarely need to change these settings GPS will update any path up to 5000 times We will collect and display performance details for 200 points from the 5000 steps Performance evaluation is time consuming Skew determines from where along the path we select points to report Steps should be changed only if classic output reports that path was not completed Points can be increased if you want more options for model selection Points can be decreased if you care most about speed and intend to accept best model results Salford Systems

51 Further Modeling Controls If you are working with a very large number of potential predictors it will be essential to limit the number that can eventually be included in the GPS model GPS begins by considering ALL of your variables as potential predictors and will continue to do so during each forward step Once the limit of allowed variables in the model has been reached GPS no longer checks the excluded variables in further model updates This makes for dramatic speed ups in model construction and also dramatic reduction in RAM required for the modeling The GPS correlation control can be used to induce somewhat different paths and models and has been empirically shown to be useful in discovering high performance model. See BATTERY MAXCORR for automated grid searches over this control Salford Systems

52 Try GPS with just ONE Predictor Just RIDGE is selected for display with RED beam positioned at point #1 Progress involves nothing more than refining coefficient until optimal Salford Systems


53 Four Points Along Path At point #1 coefficient= , at point #80=-.2309, at point #136= , at point #187= Salford Systems
54 Path Building Process Zero Coefficient Model A Variable is Added Sequence of 1-variable models A Variable is Added Sequence of 2-variable models A Variable is Added Sequence of 3-variable models Final OLS Solution λ = λ = 0 Variable Selection Strategy Elasticity Parameter controls the variable selection strategy along the path (using the LEARN sample only), it can be between 0 and 2, inclusive o o o Elasticity = 2 fast approximation of Ridge Regression, introduces variables as quickly as possible and then jointly varies the magnitude of coefficients lowest degree of compression Elasticity = 1 fast approximation of Lasso Regression, introduces variables sparingly letting the current active variables develop their coefficients good degree of compression versus accuracy Elasticity = 0 fast approximation of Stepwise Regression, introduces new variables only after the current active variables were fully developed excellent degree of compression but may loose accuracy Salford Systems
55 Points Versus Steps Zero Solution Path 1: Steps Path 2: Steps Path 3: Steps OLS Solution Points Path 1 Path 2 Path 3 Point Selection Strategy Each path will have different number of steps To facilitate model comparison among different paths, the Point Selection Strategy extracts a fixed collection of models into the points grid o This eliminates some of the original irregularity among individual paths and facilitates model extraction and comparison Salford Systems


56 Path Points on Boston Data Path Development Point 30 Point 100 Point 150 Point 190 Each path uses a different variable selection strategy and separate coefficient updates Salford Systems


57 Regularized Logistic Regression All the same GPS ideas apply Specify Logistic Binary Analysis Specify optimality criterion Salford Systems
58 How To Select a Best Model Regularized regression was originally invented to help modelers obtain more intuitively acceptable models Can think of the process as a search engine generating predictive models User decides based on o o Lack of complexity of model Acceptability of coefficients magnitude, signs, predictors included) Clearly can be set to automatic mode Criterion could well be performance on test data Salford Systems
59 What s Next Evolution of Regression, part III o Regression trees (Decision Trees for Regression) o Ensemble models (Ensembles of decision trees, Bagger) o Random Forest (the Bagger perfected) o TreeNet (gradient boosted decision tree regression) o TreeNet/GPS Hybrid models (TreeNet post-processed by GPS models) Hands-on session, part IV Live walk through examples using o Regression trees o Ensemble models o Random Forest o TreeNet o TreeNet/GPS Hybrid models Salford Systems
60 Salford Predictive Modeler SPM Download a current version from our website Version will run without a license key for 10-days Request a license key from unlock@salford-systems.com Request configuration to meet your needs o Data handling capacity o Data mining engines made available Salford Systems 2012
Evolution of Regression III:
 Evolution of Regression III: From OLS to GPS, MARS, CART, TreeNet and RandomForests March 2013 Dan Steinberg Mikhail Golovnya Salford Systems Course Outline Previous Webinars: Regression Problem quick
Overview. Data Mining for Business Intelligence. Shmueli, Patel & Bruce
 Overview Data Mining for Business Intelligence Shmueli, Patel & Bruce Galit Shmueli and Peter Bruce 2010 Core Ideas in Data Mining Classification Prediction Association Rules Data Reduction Data Exploration
Package nodeharvest. June 12, 2015
 Type Package Package nodeharvest June 12, 2015 Title Node Harvest for Regression and Classification Version 0.7-3 Date 2015-06-10 Author Nicolai Meinshausen Maintainer Nicolai Meinshausen
Salford Systems Predictive Modeler Unsupervised Learning. Salford Systems
 Salford Systems Predictive Modeler Unsupervised Learning Salford Systems http://www.salford-systems.com Unsupervised Learning In mainstream statistics this is typically known as cluster analysis The term
SPM Users Guide. This guide elaborates on powerful ways to combine the TreeNet and GPS engines to achieve model compression and more.
 SPM Users Guide Model Compression via ISLE and RuleLearner This guide elaborates on powerful ways to combine the TreeNet and GPS engines to achieve model compression and more. Title: Model Compression
Tutorial 1. Linear Regression
 Tutorial 1. Linear Regression January 11, 2017 1 Tutorial: Linear Regression Agenda: 1. Spyder interface 2. Linear regression running example: boston data 3. Vectorize cost function 4. Closed form solution
3 Ways to Improve Your Regression
 3 Ways to Improve Your Regression Introduction This tutorial will take you through the steps demonstrated in the 3 Ways to Improve Your Regression webinar. First, you will be introduced to a dataset about
Statistical Machine Learning Hilary Term 2018
 Statistical Machine Learning Hilary Term 2018 Pier Francesco Palamara Department of Statistics University of Oxford Slide credits and other course material can be found at: http://www.stats.ox.ac.uk/~palamara/sml18.html
Machine Learning: An Applied Econometric Approach Online Appendix
 Machine Learning: An Applied Econometric Approach Online Appendix Sendhil Mullainathan mullain@fas.harvard.edu Jann Spiess jspiess@fas.harvard.edu April 2017 A How We Predict In this section, we detail
Linear Methods for Regression and Shrinkage Methods
 Linear Methods for Regression and Shrinkage Methods Reference: The Elements of Statistical Learning, by T. Hastie, R. Tibshirani, J. Friedman, Springer 1 Linear Regression Models Least Squares Input vectors
Performance Estimation and Regularization. Kasthuri Kannan, PhD. Machine Learning, Spring 2018
 Performance Estimation and Regularization Kasthuri Kannan, PhD. Machine Learning, Spring 2018 Bias- Variance Tradeoff Fundamental to machine learning approaches Bias- Variance Tradeoff Error due to Bias:
Package KernelKnn. January 16, 2018
 Type Package Title Kernel k Nearest Neighbors Version 1.0.8 Date 2018-01-16 Package KernelKnn January 16, 2018 Author Lampros Mouselimis Maintainer Lampros Mouselimis
Using Multivariate Adaptive Regression Splines (MARS ) to enhance Generalised Linear Models. Inna Kolyshkina PriceWaterhouseCoopers
 to enhance Generalised Linear Models. Inna Kolyshkina PriceWaterhouseCoopers") Using Multivariate Adaptive Regression Splines (MARS ) to enhance Generalised Linear Models. Inna Kolyshkina PriceWaterhouseCoopers Why enhance GLM? Shortcomings of the linear modelling approach. GLM being
Using Multivariate Adaptive Regression Splines (MARS ) to enhance Generalised Linear Models. Inna Kolyshkina PriceWaterhouseCoopers Why enhance GLM? Shortcomings of the linear modelling approach. GLM being
Big Data Methods. Chapter 5: Machine learning. Big Data Methods, Chapter 5, Slide 1
 Big Data Methods Chapter 5: Machine learning Big Data Methods, Chapter 5, Slide 1 5.1 Introduction to machine learning What is machine learning? Concerned with the study and development of algorithms that
CSC 411: Lecture 02: Linear Regression
 CSC 411: Lecture 02: Linear Regression Raquel Urtasun & Rich Zemel University of Toronto Sep 16, 2015 Urtasun & Zemel (UofT) CSC 411: 02-Regression Sep 16, 2015 1 / 16 Today Linear regression problem continuous
FMA901F: Machine Learning Lecture 3: Linear Models for Regression. Cristian Sminchisescu
 FMA901F: Machine Learning Lecture 3: Linear Models for Regression Cristian Sminchisescu Machine Learning: Frequentist vs. Bayesian In the frequentist setting, we seek a fixed parameter (vector), with value(s)
Predictive Analytics: Demystifying Current and Emerging Methodologies. Tom Kolde, FCAS, MAAA Linda Brobeck, FCAS, MAAA
 Predictive Analytics: Demystifying Current and Emerging Methodologies Tom Kolde, FCAS, MAAA Linda Brobeck, FCAS, MAAA May 18, 2017 About the Presenters Tom Kolde, FCAS, MAAA Consulting Actuary Chicago,
Multiple Linear Regression
 Multiple Linear Regression Rebecca C. Steorts, Duke University STA 325, Chapter 3 ISL 1 / 49 Agenda How to extend beyond a SLR Multiple Linear Regression (MLR) Relationship Between the Response and Predictors
Cognalysis TM Reserving System User Manual
 Cognalysis TM Reserving System User Manual Return to Table of Contents 1 Table of Contents 1.0 Starting an Analysis 3 1.1 Opening a Data File....3 1.2 Open an Analysis File.9 1.3 Create Triangles.10 2.0
Chapter 7: Numerical Prediction
 Ludwig-Maximilians-Universität München Institut für Informatik Lehr- und Forschungseinheit für Datenbanksysteme Knowledge Discovery in Databases SS 2016 Chapter 7: Numerical Prediction Lecture: Prof. Dr.
Outline. Topic 16 - Other Remedies. Ridge Regression. Ridge Regression. Ridge Regression. Robust Regression. Regression Trees. Piecewise Linear Model
 Topic 16 - Other Remedies Ridge Regression Robust Regression Regression Trees Outline - Fall 2013 Piecewise Linear Model Bootstrapping Topic 16 2 Ridge Regression Modification of least squares that addresses
SPM Users Guide. Introducing TreeNet. This guide describes the TreeNet Product and illustrates some practical examples of its basic usage and approach
 SPM Users Guide Introducing TreeNet This guide describes the TreeNet Product and illustrates some practical examples of its basic usage and approach 2 TreeNet Introduction TreeNet is a revolutionary advance
Sandeep Kharidhi and WenSui Liu ChoicePoint Precision Marketing
 Generalized Additive Model and Applications in Direct Marketing Sandeep Kharidhi and WenSui Liu ChoicePoint Precision Marketing Abstract Logistic regression 1 has been widely used in direct marketing applications
DS Machine Learning and Data Mining I. Alina Oprea Associate Professor, CCIS Northeastern University
 DS 4400 Machine Learning and Data Mining I Alina Oprea Associate Professor, CCIS Northeastern University September 20 2018 Review Solution for multiple linear regression can be computed in closed form
Comparison of Optimization Methods for L1-regularized Logistic Regression
 Comparison of Optimization Methods for L1-regularized Logistic Regression Aleksandar Jovanovich Department of Computer Science and Information Systems Youngstown State University Youngstown, OH 44555 aleksjovanovich@gmail.com
The Basics of Decision Trees
 Tree-based Methods Here we describe tree-based methods for regression and classification. These involve stratifying or segmenting the predictor space into a number of simple regions. Since the set of splitting
Lecture 13: Model selection and regularization
 Lecture 13: Model selection and regularization Reading: Sections 6.1-6.2.1 STATS 202: Data mining and analysis October 23, 2017 1 / 17 What do we know so far In linear regression, adding predictors always
Fast or furious? - User analysis of SF Express Inc
 CS 229 PROJECT, DEC. 2017 1 Fast or furious? - User analysis of SF Express Inc Gege Wen@gegewen, Yiyuan Zhang@yiyuan12, Kezhen Zhao@zkz I. MOTIVATION The motivation of this project is to predict the likelihood
CHAPTER 3: Data Description
 CHAPTER 3: Data Description You ve tabulated and made pretty pictures. Now what numbers do you use to summarize your data? Ch3: Data Description Santorico Page 68 You ll find a link on our website to a
Random Forest A. Fornaser
 Random Forest A. Fornaser alberto.fornaser@unitn.it Sources Lecture 15: decision trees, information theory and random forests, Dr. Richard E. Turner Trees and Random Forests, Adele Cutler, Utah State University
The Review of Attributes Influencing Housing Prices using Data Mining Methods
 International Journal of Sciences: Basic and Applied Research (IJSBAR) ISSN 2307-4531 (Print & Online) http://gssrr.org/index.php?journal=journalofbasicandapplied ---------------------------------------------------------------------------------------------------------------------------
Exploring Data. This guide describes the facilities in SPM to gain initial insights about a dataset by viewing and generating descriptive statistics.
 This guide describes the facilities in SPM to gain initial insights about a dataset by viewing and generating descriptive statistics. 2018 by Minitab Inc. All rights reserved. Minitab, SPM, SPM Salford
REGULARIZED REGRESSION FOR RESERVING AND MORTALITY MODELS GARY G. VENTER
 REGULARIZED REGRESSION FOR RESERVING AND MORTALITY MODELS GARY G. VENTER TODAY Advances in model estimation methodology Application to data that comes in rectangles Examples ESTIMATION Problems with MLE
2017 ITRON EFG Meeting. Abdul Razack. Specialist, Load Forecasting NV Energy
 2017 ITRON EFG Meeting Abdul Razack Specialist, Load Forecasting NV Energy Topics 1. Concepts 2. Model (Variable) Selection Methods 3. Cross- Validation 4. Cross-Validation: Time Series 5. Example 1 6.
Overview and Practical Application of Machine Learning in Pricing
 Overview and Practical Application of Machine Learning in Pricing 2017 CAS Spring Meeting May 23, 2017 Duncan Anderson and Claudine Modlin (Willis Towers Watson) Mark Richards (Allstate Insurance Company)
Robust Regression. Robust Data Mining Techniques By Boonyakorn Jantaranuson
 Robust Regression Robust Data Mining Techniques By Boonyakorn Jantaranuson Outline Introduction OLS and important terminology Least Median of Squares (LMedS) M-estimator Penalized least squares What is
Using the DATAMINE Program
 6 Using the DATAMINE Program 304 Using the DATAMINE Program This chapter serves as a user s manual for the DATAMINE program, which demonstrates the algorithms presented in this book. Each menu selection
Introduction to Random Forests. This guide provides a brief introduction to Random Forests.
 Introduction to Random Forests This guide provides a brief introduction to Random Forests. 2018 by Minitab Inc. All rights reserved. Minitab, SPM, SPM Salford Predictive Modeler, Salford Predictive Modeler,
Linear Model Selection and Regularization. especially usefull in high dimensions p>>100.
 Linear Model Selection and Regularization especially usefull in high dimensions p>>100. 1 Why Linear Model Regularization? Linear models are simple, BUT consider p>>n, we have more features than data records
Multiresponse Sparse Regression with Application to Multidimensional Scaling
 Multiresponse Sparse Regression with Application to Multidimensional Scaling Timo Similä and Jarkko Tikka Helsinki University of Technology, Laboratory of Computer and Information Science P.O. Box 54,
Nonparametric Approaches to Regression
 Nonparametric Approaches to Regression In traditional nonparametric regression, we assume very little about the functional form of the mean response function. In particular, we assume the model where m(xi)
Regression on SAT Scores of 374 High Schools and K-means on Clustering Schools
 Regression on SAT Scores of 374 High Schools and K-means on Clustering Schools Abstract In this project, we study 374 public high schools in New York City. The project seeks to use regression techniques
Lasso. November 14, 2017
 Lasso November 14, 2017 Contents 1 Case Study: Least Absolute Shrinkage and Selection Operator (LASSO) 1 1.1 The Lasso Estimator.................................... 1 1.2 Computation of the Lasso Solution............................
Generalized Additive Model
 Generalized Additive Model by Huimin Liu Department of Mathematics and Statistics University of Minnesota Duluth, Duluth, MN 55812 December 2008 Table of Contents Abstract... 2 Chapter 1 Introduction 1.1
VISUALIZATION TECHNIQUES UTILIZING THE SENSITIVITY ANALYSIS OF MODELS
 VISUALIZATION TECHNIQUES UTILIZING THE SENSITIVITY ANALYSIS OF MODELS Ivo Kondapaneni, Pavel Kordík, Pavel Slavík Department of Computer Science and Engineering, Faculty of Eletrical Engineering, Czech
DS Machine Learning and Data Mining I. Alina Oprea Associate Professor, CCIS Northeastern University
 DS 4400 Machine Learning and Data Mining I Alina Oprea Associate Professor, CCIS Northeastern University January 24 2019 Logistics HW 1 is due on Friday 01/25 Project proposal: due Feb 21 1 page description
Data Analysis and Solver Plugins for KSpread USER S MANUAL. Tomasz Maliszewski
 Data Analysis and Solver Plugins for KSpread USER S MANUAL Tomasz Maliszewski tmaliszewski@wp.pl Table of Content CHAPTER 1: INTRODUCTION... 3 1.1. ABOUT DATA ANALYSIS PLUGIN... 3 1.3. ABOUT SOLVER PLUGIN...
GLMSELECT for Model Selection
 Winnipeg SAS User Group Meeting May 11, 2012 GLMSELECT for Model Selection Sylvain Tremblay SAS Canada Education Copyright 2010 SAS Institute Inc. All rights reserved. Proc GLM Proc REG Class Statement
Applying Supervised Learning
 Applying Supervised Learning When to Consider Supervised Learning A supervised learning algorithm takes a known set of input data (the training set) and known responses to the data (output), and trains
Nonparametric Classification Methods
 Nonparametric Classification Methods We now examine some modern, computationally intensive methods for regression and classification. Recall that the LDA approach constructs a line (or plane or hyperplane)
PS 6: Regularization. PART A: (Source: HTF page 95) The Ridge regression problem is:
 The Ridge regression problem is:") Economics 1660: Big Data PS 6: Regularization Prof. Daniel Björkegren PART A: (Source: HTF page 95) The Ridge regression problem is: : β "#$%& = argmin (y # β 2 x #4 β 4 ) 6 6 + λ β 4 #89 Consider the
Economics 1660: Big Data PS 6: Regularization Prof. Daniel Björkegren PART A: (Source: HTF page 95) The Ridge regression problem is: : β "#$%& = argmin (y # β 2 x #4 β 4 ) 6 6 + λ β 4 #89 Consider the
Leveling Up as a Data Scientist. ds/2014/10/level-up-ds.jpg
 Model Optimization Leveling Up as a Data Scientist http://shorelinechurch.org/wp-content/uploa ds/2014/10/level-up-ds.jpg Bias and Variance Error = (expected loss of accuracy) 2 + flexibility of model
Gradient LASSO algoithm
 Gradient LASSO algoithm Yongdai Kim Seoul National University, Korea jointly with Yuwon Kim University of Minnesota, USA and Jinseog Kim Statistical Research Center for Complex Systems, Korea Contents
Classification/Regression Trees and Random Forests
 Classification/Regression Trees and Random Forests Fabio G. Cozman - fgcozman@usp.br November 6, 2018 Classification tree Consider binary class variable Y and features X 1,..., X n. Decide Ŷ after a series
From Building Better Models with JMP Pro. Full book available for purchase here.
 From Building Better Models with JMP Pro. Full book available for purchase here. Contents Acknowledgments... ix About This Book... xi About These Authors... xiii Part 1 Introduction... 1 Chapter 1 Introduction...
Lecture 27: Review. Reading: All chapters in ISLR. STATS 202: Data mining and analysis. December 6, 2017
 Lecture 27: Review Reading: All chapters in ISLR. STATS 202: Data mining and analysis December 6, 2017 1 / 16 Final exam: Announcements Tuesday, December 12, 8:30-11:30 am, in the following rooms: Last
( ) = Y ˆ. Calibration Definition A model is calibrated if its predictions are right on average: ave(response Predicted value) = Predicted value.
 = Y ˆ. Calibration Definition A model is calibrated if its predictions are right on average: ave(response Predicted value) = Predicted value.") Calibration OVERVIEW... 2 INTRODUCTION... 2 CALIBRATION... 3 ANOTHER REASON FOR CALIBRATION... 4 CHECKING THE CALIBRATION OF A REGRESSION... 5 CALIBRATION IN SIMPLE REGRESSION (DISPLAY.JMP)... 5 TESTING
Calibration OVERVIEW... 2 INTRODUCTION... 2 CALIBRATION... 3 ANOTHER REASON FOR CALIBRATION... 4 CHECKING THE CALIBRATION OF A REGRESSION... 5 CALIBRATION IN SIMPLE REGRESSION (DISPLAY.JMP)... 5 TESTING
DATA MINING AND MACHINE LEARNING. Lecture 6: Data preprocessing and model selection Lecturer: Simone Scardapane
 DATA MINING AND MACHINE LEARNING Lecture 6: Data preprocessing and model selection Lecturer: Simone Scardapane Academic Year 2016/2017 Table of contents Data preprocessing Feature normalization Missing
Enterprise Miner Tutorial Notes 2 1
 Enterprise Miner Tutorial Notes 2 1 ECT7110 E-Commerce Data Mining Techniques Tutorial 2 How to Join Table in Enterprise Miner e.g. we need to join the following two tables: Join1 Join 2 ID Name Gender
Data mining techniques for actuaries: an overview
 Data mining techniques for actuaries: an overview Emiliano A. Valdez joint work with Banghee So and Guojun Gan University of Connecticut Advances in Predictive Analytics (APA) Conference University of
Preface to the Second Edition. Preface to the First Edition. 1 Introduction 1
 Preface to the Second Edition Preface to the First Edition vii xi 1 Introduction 1 2 Overview of Supervised Learning 9 2.1 Introduction... 9 2.2 Variable Types and Terminology... 9 2.3 Two Simple Approaches
Chapter 6: Linear Model Selection and Regularization
 Chapter 6: Linear Model Selection and Regularization As p (the number of predictors) comes close to or exceeds n (the sample size) standard linear regression is faced with problems. The variance of the
SPM Users Guide. RandomForests Modeling Basics. This guide provides an introduction into RandomForests Modeling Basics.
 SPM Users Guide RandomForests Modeling Basics This guide provides an introduction into RandomForests Modeling Basics. Title: RandomForests Modeling Basics Short Description: This guide provides an introduction
Regularized Committee of Extreme Learning Machine for Regression Problems
 Regularized Committee of Extreme Learning Machine for Regression Problems Pablo Escandell-Montero, José M. Martínez-Martínez, Emilio Soria-Olivas, Josep Guimerá-Tomás, Marcelino Martínez-Sober and Antonio
Advanced and Predictive Analytics with JMP 12 PRO. JMP User Meeting 9. Juni Schwalbach
 Advanced and Predictive Analytics with JMP 12 PRO JMP User Meeting 9. Juni 2016 -Schwalbach Definition Predictive Analytics encompasses a variety of statistical techniques from modeling, machine learning
Random Forests and Boosting
 Random Forests and Boosting Tree-based methods are simple and useful for interpretation. However they typically are not competitive with the best supervised learning approaches in terms of prediction accuracy.
Multivariate Capability Analysis
 Multivariate Capability Analysis Summary... 1 Data Input... 3 Analysis Summary... 4 Capability Plot... 5 Capability Indices... 6 Capability Ellipse... 7 Correlation Matrix... 8 Tests for Normality... 8
SUPERVISED LEARNING METHODS. Stanley Liang, PhD Candidate, Lassonde School of Engineering, York University Helix Science Engagement Programs 2018
 SUPERVISED LEARNING METHODS Stanley Liang, PhD Candidate, Lassonde School of Engineering, York University Helix Science Engagement Programs 2018 2 CHOICE OF ML You cannot know which algorithm will work
Machine Learning Duncan Anderson Managing Director, Willis Towers Watson
 Machine Learning Duncan Anderson Managing Director, Willis Towers Watson 21 March 2018 GIRO 2016, Dublin - Response to machine learning Don t panic! We re doomed! 2 This is not all new Actuaries adopt
Lasso Regression: Regularization for feature selection
 Lasso Regression: Regularization for feature selection CSE 416: Machine Learning Emily Fox University of Washington April 12, 2018 Symptom of overfitting 2 Often, overfitting associated with very large
MIT 801. Machine Learning I. [Presented by Anna Bosman] 16 February 2018
![MIT 801. Machine Learning I. [Presented by Anna Bosman] 16 February 2018](/thumbs/77/76295965.jpg "MIT 801. Machine Learning I. [Presented by Anna Bosman] 16 February 2018") MIT 801 [Presented by Anna Bosman] 16 February 2018 Machine Learning What is machine learning? Artificial Intelligence? Yes as we know it. What is intelligence? The ability to acquire and apply knowledge
MIT 801 [Presented by Anna Bosman] 16 February 2018 Machine Learning What is machine learning? Artificial Intelligence? Yes as we know it. What is intelligence? The ability to acquire and apply knowledge
Information Criteria Methods in SAS for Multiple Linear Regression Models
 Paper SA5 Information Criteria Methods in SAS for Multiple Linear Regression Models Dennis J. Beal, Science Applications International Corporation, Oak Ridge, TN ABSTRACT SAS 9.1 calculates Akaike s Information
REPLACING MLE WITH BAYESIAN SHRINKAGE CAS ANNUAL MEETING NOVEMBER 2018 GARY G. VENTER
 REPLACING MLE WITH BAYESIAN SHRINKAGE CAS ANNUAL MEETING NOVEMBER 2018 GARY G. VENTER ESTIMATION Problems with MLE known since Charles Stein 1956 paper He showed that when estimating 3 or more means, shrinking
StatCalc User Manual. Version 9 for Mac and Windows. Copyright 2018, AcaStat Software. All rights Reserved.
 StatCalc User Manual Version 9 for Mac and Windows Copyright 2018, AcaStat Software. All rights Reserved. http://www.acastat.com Table of Contents Introduction... 4 Getting Help... 4 Uninstalling StatCalc...
Allstate Insurance Claims Severity: A Machine Learning Approach
 Allstate Insurance Claims Severity: A Machine Learning Approach Rajeeva Gaur SUNet ID: rajeevag Jeff Pickelman SUNet ID: pattern Hongyi Wang SUNet ID: hongyiw I. INTRODUCTION The insurance industry has
22s:152 Applied Linear Regression
 22s:152 Applied Linear Regression Chapter 22: Model Selection In model selection, the idea is to find the smallest set of variables which provides an adequate description of the data. We will consider
Yelp Recommendation System
 Yelp Recommendation System Jason Ting, Swaroop Indra Ramaswamy Institute for Computational and Mathematical Engineering Abstract We apply principles and techniques of recommendation systems to develop
Multicollinearity and Validation CIVL 7012/8012
 Multicollinearity and Validation CIVL 7012/8012 2 In Today s Class Recap Multicollinearity Model Validation MULTICOLLINEARITY 1. Perfect Multicollinearity 2. Consequences of Perfect Multicollinearity 3.
Putting it all together: Creating a Big Data Analytic Workflow with Spotfire
 Putting it all together: Creating a Big Data Analytic Workflow with Spotfire Authors: David Katz and Mike Alperin, TIBCO Data Science Team In a previous blog, we showed how ultra-fast visualization of
scikit-learn (Machine Learning in Python)
") scikit-learn (Machine Learning in Python) (PB13007115) 2016-07-12 (PB13007115) scikit-learn (Machine Learning in Python) 2016-07-12 1 / 29 Outline 1 Introduction 2 scikit-learn examples 3 Captcha recognize
scikit-learn (Machine Learning in Python) (PB13007115) 2016-07-12 (PB13007115) scikit-learn (Machine Learning in Python) 2016-07-12 1 / 29 Outline 1 Introduction 2 scikit-learn examples 3 Captcha recognize
Predict Outcomes and Reveal Relationships in Categorical Data
 PASW Categories 18 Specifications Predict Outcomes and Reveal Relationships in Categorical Data Unleash the full potential of your data through predictive analysis, statistical learning, perceptual mapping,
Example 1 of panel data : Data for 6 airlines (groups) over 15 years (time periods) Example 1
 over 15 years (time periods) Example 1") Panel data set Consists of n entities or subjects (e.g., firms and states), each of which includes T observations measured at 1 through t time period. total number of observations : nt Panel data have
Panel data set Consists of n entities or subjects (e.g., firms and states), each of which includes T observations measured at 1 through t time period. total number of observations : nt Panel data have
Network Traffic Measurements and Analysis
 DEIB - Politecnico di Milano Fall, 2017 Sources Hastie, Tibshirani, Friedman: The Elements of Statistical Learning James, Witten, Hastie, Tibshirani: An Introduction to Statistical Learning Andrew Ng:
A Method for Comparing Multiple Regression Models
 CSIS Discussion Paper No. 141 A Method for Comparing Multiple Regression Models Yuki Hiruta Yasushi Asami Department of Urban Engineering, the University of Tokyo e-mail: hiruta@ua.t.u-tokyo.ac.jp asami@csis.u-tokyo.ac.jp
Introducing Categorical Data/Variables (pp )
") Notation: Means pencil-and-paper QUIZ Means coding QUIZ Definition: Feature Engineering (FE) = the process of transforming the data to an optimal representation for a given application. Scaling (see Chs.
Notation: Means pencil-and-paper QUIZ Means coding QUIZ Definition: Feature Engineering (FE) = the process of transforming the data to an optimal representation for a given application. Scaling (see Chs.
Further Maths Notes. Common Mistakes. Read the bold words in the exam! Always check data entry. Write equations in terms of variables
 Further Maths Notes Common Mistakes Read the bold words in the exam! Always check data entry Remember to interpret data with the multipliers specified (e.g. in thousands) Write equations in terms of variables
22s:152 Applied Linear Regression
 22s:152 Applied Linear Regression Chapter 22: Model Selection In model selection, the idea is to find the smallest set of variables which provides an adequate description of the data. We will consider
Mapping of Hierarchical Activation in the Visual Cortex Suman Chakravartula, Denise Jones, Guillaume Leseur CS229 Final Project Report. Autumn 2008.
 Mapping of Hierarchical Activation in the Visual Cortex Suman Chakravartula, Denise Jones, Guillaume Leseur CS229 Final Project Report. Autumn 2008. Introduction There is much that is unknown regarding
Q: Which month has the lowest sale? Answer: Q:There are three consecutive months for which sale grow. What are they? Answer: Q: Which month
 Lecture 1 Q: Which month has the lowest sale? Q:There are three consecutive months for which sale grow. What are they? Q: Which month experienced the biggest drop in sale? Q: Just above November there
Nearest Neighbor Predictors
 Nearest Neighbor Predictors September 2, 2018 Perhaps the simplest machine learning prediction method, from a conceptual point of view, and perhaps also the most unusual, is the nearest-neighbor method,
CS 229 Midterm Review
 CS 229 Midterm Review Course Staff Fall 2018 11/2/2018 Outline Today: SVMs Kernels Tree Ensembles EM Algorithm / Mixture Models [ Focus on building intuition, less so on solving specific problems. Ask
TreeNet. Stochastic Gradient Boosting. An Implementation of the MART methodology by Salford Systems
 TreeNet Stochastic Gradient Boosting An Implementation of the MART methodology by Salford Systems A Robust Multi-Tree Technology for Data Mining, Predictive Modeling and Data Processing 8880 Rio San Diego
Model Inference and Averaging. Baging, Stacking, Random Forest, Boosting
 Model Inference and Averaging Baging, Stacking, Random Forest, Boosting Bagging Bootstrap Aggregating Bootstrap Repeatedly select n data samples with replacement Each dataset b=1:b is slightly different
7. Collinearity and Model Selection
 Sociology 740 John Fox Lecture Notes 7. Collinearity and Model Selection Copyright 2014 by John Fox Collinearity and Model Selection 1 1. Introduction I When there is a perfect linear relationship among
Frequently Asked Questions Updated 2006 (TRIM version 3.51) PREPARING DATA & RUNNING TRIM
 PREPARING DATA & RUNNING TRIM") Frequently Asked Questions Updated 2006 (TRIM version 3.51) PREPARING DATA & RUNNING TRIM * Which directories are used for input files and output files? See menu-item "Options" and page 22 in the manual.
Frequently Asked Questions Updated 2006 (TRIM version 3.51) PREPARING DATA & RUNNING TRIM * Which directories are used for input files and output files? See menu-item "Options" and page 22 in the manual.
An overview for regression tree
 An overview for regression tree Abstract PhD (C.) Adem Meta University Ismail Qemali Vlore, Albania Classification and regression tree is a non-parametric methodology. CART is a methodology that divides
Support Vector Machines
 Support Vector Machines Chapter 9 Chapter 9 1 / 50 1 91 Maximal margin classifier 2 92 Support vector classifiers 3 93 Support vector machines 4 94 SVMs with more than two classes 5 95 Relationshiop to
Notes based on: Data Mining for Business Intelligence
 Chapter 9 Classification and Regression Trees Roger Bohn April 2017 Notes based on: Data Mining for Business Intelligence 1 Shmueli, Patel & Bruce 2 3 II. Results and Interpretation There are 1183 auction
GLM II. Basic Modeling Strategy CAS Ratemaking and Product Management Seminar by Paul Bailey. March 10, 2015
 GLM II Basic Modeling Strategy 2015 CAS Ratemaking and Product Management Seminar by Paul Bailey March 10, 2015 Building predictive models is a multi-step process Set project goals and review background
RESAMPLING METHODS. Chapter 05
 1 RESAMPLING METHODS Chapter 05 2 Outline Cross Validation The Validation Set Approach Leave-One-Out Cross Validation K-fold Cross Validation Bias-Variance Trade-off for k-fold Cross Validation Cross Validation