Spreadsheet View and Basic Statistics Concepts
|
|
|
- Sherman Shepherd
- 6 years ago
- Views:
Transcription

1 Spreadsheet View and Basic Statistics Concepts GeoGebra 3.2 Workshop Handout 9 Judith and Markus Hohenwarter Table of Contents 1. Introduction to GeoGebra s Spreadsheet View 2 2. Record to Spreadsheet Feature 4 3. Relative Copy and Linear Equations 7 4. Investigating Number Patterns 9 5. Scatter Plot and Best Fit Line Challenge of the Day: Explore Basic Statistics Commands 15
, algebraically (e.g., coordinates of points, equations), and in spreadsheet cells.")
2 1. Introduction to GeoGebra s Spreadsheet View The dynamic mathematics software GeoGebra provides three different views of mathematical objects: a Graphics view, a, numeric Algebra view and a Spreadsheet view. They allow you to display mathematical objects in three different representations: graphically (e.g., points, function graphs), algebraically (e.g., coordinates of points, equations), and in spreadsheet cells. Thereby, all representations of the same object are linked dynamically and adapt automatically to changes made to any of the representations, no matter how they were initially created. Toolbar Algebra View Graphics View Spreadsheet View Input Bar Geometric Constructions Using the construction tools available in the Toolbar you can do geometric constructions in the Graphics view with the mouse. Select any construction tool from the Toolbar and read the Toolbar help (next to the toolbar) in order to find out how to use the selected tool. Any object you create in the Graphics view also has an algebraic representation in the Algebra view. Note that you are able to move objects in the Graphics view by dragging them with the mouse. At the same time, their algebraic representations are dynamically updated in the Algebra view. Every icon in the toolbar represents a toolbox that contains a selection of similar construction tools. In order to open a toolbox, you need to click on the small arrow in the lower right corner of the toolbar icon. 2
3 Hint: Construction tools are organized by the nature of resulting objects. You will find tools that create different types of points in the Point toolbox (default icon ) and tools that allow you to apply geometric transformations in the Transformation toolbox (default icon ). Algebraic Input and Commands Using the Input bar you can directly enter algebraic expressions in GeoGebra. After hitting the Enter-key your algebraic input appears in the Algebra view while its graphical representation is automatically displayed in the Graphics view. For example, the input f(x) = x^2 gives you the function f in the Algebra view and its function graph in the Graphics view. In the Algebra view, mathematical objects are organized as free or dependent objects. If you create a new object without using any other existing objects, it is classified as a free object. If your newly created object was created by using other existing objects, it is classified as a dependent object. Hint: If you want to hide the algebraic representation of an object in the Algebra view, you can specify the object as an auxiliary object: Right click (MacOS: Ctrlclick) on the corresponding object in the Algebra view and select Auxiliary Object from the appearing context menu. By default, auxiliary objects are not shown in the Algebra view, but you can change this setting by selecting the item Auxiliary Objects from the View menu. Note that you are able to modify objects in the Algebra view as well: Make sure that you activate the Move tool before you double click on a free object in the Algebra view. In the appearing textbox you can directly edit the algebraic representation of the object. After hitting the Enter-key, the graphical representation of the object will automatically adapt to your changes. If you double click on a dependent object in the Algebra view, a dialog window appears allowing you to redefine the object. GeoGebra also offers a wide range of commands that can be entered into the Input bar. You can open the list of commands in the right corner of the Input bar by clicking on the button Command. After selecting a command from this list (or typing its name directly into the Input bar) you can press the F1-key to get information about the syntax and arguments required to apply the corresponding command. Spreadsheet Cells Input In GeoGebra s Spreadsheet view every cell has a specific name that allows you to directly address each cell. For example, the cell in column A and row 1 is named A1. 3
4 Note: These cell names can be used in expressions and commands in order to address the content of the corresponding cell. Into the spreadsheet cells you can enter not only numbers, but all types of mathematical objects that are supported by GeoGebra (e.g., coordinates of points, functions, commands). If possible, GeoGebra immediately displays the graphical representation of the object you enter into a spreadsheet cell in the Graphics view as well. Thereby, the name of the object matches the name of the spreadsheet cell used to initially create it (e.g., A5, C1). Note: By default, spreadsheet objects are classified as auxiliary objects in the Algebra view. You can show or hide these auxiliary objects by selecting Auxiliary Objects from the View menu. Customize the User Interface and Toolbar The user interface of GeoGebra can be customized by using the View menu. For example, you can hide different parts of the interface (e.g., the Algebra view) by unchecking the corresponding menu item in the View menu (e.g., Algebra View ). Note: In this way, you can also show or hide the coordinate axes and a coordinate grid. The toolbar can be customized by selecting Customize Toolbar from the Tools menu. Highlight the tool or toolbox you want to remove from the toolbar in the list on the left hand side of the appearing dialog window and click button Remove > in order to remove the tool/toolbox from the toolbar. You can restore the default toolbar by clicking on the button Restore Default Toolbar in the left lower corner of the dialog window. 2. Record to Spreadsheet Feature Preparations Open a new GeoGebra file. Show the Spreadsheet view (View menu). Hide the Algebra view (View menu). 4
 Create point A by entering A = (a, 2a) into the Input bar.")
5 Instructions 1 Create a slider with default interval and increment 1. Hint: Select tool Slider and click in the Graphics view to set the position for the slider. In the appearing dialog window change the increment to 1 and click the Apply button. 2 A = (a, 2a) Create point A by entering A = (a, 2a) into the Input bar. Hint: The value of slider a determines the x-coordinate of point A while the y-coordinate is a multiple of this value. 3 Show the label of point A in the Graphics view. 4 5 Change the value of slider a to examine different positions of point A. Use tools Move Graphics View, as well as Zoom In and Zoom Out to adjust the visible part of the Graphics view and make point A visible in all positions. 5
6 6 Turn on the trace of point A. 7 Hint: Right click (MacOS: Ctrl-click) on point A and select Trace On from the appearing context menu. Change the value of slider a to examine the trace point A leaves for every slider position. 8 Set the value of slider a to Record the coordinates for different positions of point A to the spreadsheet: (1) Select tool Record to Spreadsheet. Then, click on point A in order to highlight it. Note: The coordinates for the actual position of point A are immediately entered into cells A1 (x-coordinate) and B1 (y-coordinate) of the spreadsheet. (2) Now, change the value of slider a in order to record the coordinates of all other possible positions of point A to the spreadsheet as well. Note: Do not switch to another tool before moving the slider. Additional Tasks Task 1: Examine the pattern of y-values in column B You could give this construction to your students and let them explore the pattern in column B, which is created by the y-coordinates of different positions of point A. Encourage your students to make a prediction about a function graph that runs through all different positions of point A. Have your students enter the corresponding function into the Input bar in order to check if their prediction was correct (e.g., students enter f(x) = 2x to create a line through all points). Task 2: Create a new problem Change the y-coordinate of point A in order to create a new problem: Right click (MacOS: Ctrl-click) on point A and select Properties from the appearing context menu. In tab Basic you can change the y-coordinate of point A in the text field Definition to, for example, a^2. Use the other tabs of the Properties dialog in order to change the color (tab Color ) or size (tab Style ) of point A. Close the Properties dialog when you have made all desired changes. 6

7 Repeat steps 7 to 9 of the instructions above in order to record the coordinates of the new positions of point A to the spreadsheet. Note: If you didn t delete the old values in columns A and B, GeoGebra automatically uses the next two empty columns (e.g., columns C and D) in order to record the new values for x-coordinates and y-coordinates. 3. Relative Copy and Linear Equations Preparations Open a new GeoGebra file. Show the Spreadsheet view (View menu). Hide the Algebra view (View menu). 7
8 Instructions 1 2 (0, 0) 3 (1, 1) Activate tool Move Graphics View and drag the origin of the coordinate system close to the lower left corner of the Graphics view. In the Spreadsheet view, click on cell A1 enter the point coordinates (0, 0). In the Spreadsheet view, click on cell A2 enter the point coordinates (1, 1). 4 Show the labels of both points in the Graphics view. 5 6 Relative copy the inserted point coordinates to other cells in column A: (1) Highlight both cells A1 and A2 by using the mouse. (2) Click on the little square at the lower right corner of the highlighted cell range. (3) Hold the mouse button down and drag the pointer down to cell A11. Use tools Move Graphics View, as well as Zoom In and Zoom Out to adjust the visible part of the Graphics view and make all points visible. Additional Tasks Task 1: Examine the coordinates of the point sequence What sequence of numbers is created if you apply the relative copy feature of the GeoGebra spreadsheet the way it is described above? Hint: Examine the x-coordinates of all created points and come up with a conjecture about how they are related. Then, check your conjecture using the y- coordinates of the points. Task 2: Find the matching equation Make a prediction about an equation that would create a graph going through all points of this sequence. Enter this equation into the Input bar in order to check your prediction. 8
.")
9 Task 3: Create a new problem Change the coordinates of the initial points in order to create a sequence of points that can be examined by your students. Version 1: Change the initial points in the Spreadsheet view Double click in cell A2 and change the coordinates of the corresponding point to (1, 2). After hitting the Enter-key, all points that depend on point A2 automatically adapt to this change, both in the Spreadsheet view as well as in the Graphics view. Version 2: Change the initial points in the Graphics view Activate tool Move and drag point A2 to a different position in the coordinate system. Immediately, all dependent points dynamically adapt to these changes both in the Graphics view as well as in the Spreadsheet view. Note: In order to restrict the coordinates of the points to be integers, you can change the option Point Capturing in the Options menu to On (Grid). You can display the coordinate grid by selecting Grid from the View menu. Hint: By changing the coordinates of point A1 as well you are able to create problems that result in linear equations of the form y = m x + b which do not run through the origin of the coordinate system. 4. Investigating Number Patterns Let s investigate how the surface of a cube changes depending on the length of its edges. Preparations with Paper and Pencil Calculate the surface of a cube for the given length e of its edges. Pick at least two edge lengths from each table but do not pick the same numbers as your neighbor. Edge Surface Edge Surface

10 Preparations in GeoGebra Open a new GeoGebra file. Show the Spreadsheet view (View menu). Hide the Algebra view (View menu). In the Options menu set the Labeling to New Points Only. Instructions Create a Scatter Plot from your Data 1 2 Enter the following numbers into the spreadsheet cells of column A: A1: 1 A2: 2 Highlight cells A1 and A2. Relative copy the values to cell A10 in order to create a sequence of different edge lengths. Hint: This creates the integers from 1 to In column B, enter the surface values you calculated earlier next to the corresponding edge length of the cube. Hint: You may collaborate with your neighbors to complete the table. 10
11 4 Select cell B1 and relative copy the formula down to cell B10. 5 Create a Scatter Plot from this data: 6 (1) Use the mouse to highlight all cells of columns A and B that contain numbers. (2) Right click (MacOS: Ctrl-click) on one of the highlighted cells and select Create List of Points from the appearing context menu. Note: The values in column A determine the x-coordinates and the values in column B specify the y-coordinates of the plotted points. Hint: The points created from the data are displayed in the Algebra view as a list of points. By default, GeoGebra calls this list L 1. Use tool Move Graphics View in order to change the scale of the y-axis so that all points are visible in the Graphics view. Hint: Select tool Move Graphics View. Click on the y-axis and drag it down until you can see the 600 tick mark. Investigate the Number Pattern in Column B 7 In cell C2, enter the formula =B2-B1 to compute the difference of the two successive surface values. Hint: After entering the equal sign, you can click on cell B2 in order to enter its name into the active cell C2. 8 Select cell C2 and relative copy the formula down to cell C10. 9 In cell D3, enter the formula =C3-C2 to compute the difference of the two successive differences. 10 Select cell D3 and relative copy the formula down to cell D10. Task 1 Examine the number sequences in columns C and D. Make a conjecture about the polynomial function that runs through all points plotted in the Graphics view and allows you to compute the surface of a cube for any given edge length e. Is it possible to determine the degree of this polynomial by investigating the sequences of differences you generated in columns C and D? Explain to your neighbor why we were repeatedly calculating differences of successive values and what they actually mean. Is it possible to determine the coefficient of the polynomial by investigating the sequences of differences you generated in columns C and D? 11
12 Would this also work if the values in column A are not successive integers (e.g., 1, 3, 5, )? Give a reason for your answer. Check your Conjecture about the Polynomial Create a slider n with interval from 0 to 5 and increment 1. Change the orientation of the slider from Horizontal to Vertical. Create a slider a with interval from -5 to 5 and increment 1. Change the orientation of the slider from Horizontal to Vertical. Enter the polynomial f(x) = a * x^n in order to create a polynomial of degree n with coefficient a. Note: Both the degree n as well as the coefficient a can be changed by using the corresponding sliders. Change the values of sliders a and n to match your conjecture. Does the polynomial run through all points plotted in the Graphics view? Enhance your Construction Insert the polynomial s equation as a dynamic text in the Graphics view. Hint: Select tool Insert Text and click on the Graphics view to open the text edit dialog window. (1) Enter f(x) = into the text edit dialog window. (2) Click on the graph of the polynomial to insert it s name into the text edit dialog window. Note: GeoGebra will enter the syntax necessary for dynamic text automatically. (3) Click on the OK button. Insert a checkbox that allows you to show/hide the polynomial s equation. Hint: Select tool Checkbox to Show/Hide Objects and click on the Graphics view to open the checkbox dialog window. (1) Enter the caption Show equation. (2) Click on the little arrow to open list of available objects. (3) Select text1 from this list and click the Apply button. Activate the Move tool and try out if your checkbox controls the visibility of the text. Open the Properties dialog and enhance the layout of the objects in the Graphics view (e.g., change the color of the polynomial and points, match the color of the text with the color of the polynomial, fix the position of the slider, checkbox, and text in the Graphics view). 12

13 Task 2 Try if this concept of investigating sequences of differences of two successive function values works for all polynomials f(x) = a x n. Hint: You can enter a formula into cell B1 and relative copy it down to cell B10 in order to create a list of function values. Don t forget to start the formula with an equal sign (e.g., = x^2) What modifications in the Spreadsheet view and Graphics view are necessary to be able to easily determine the constant of polynomials f(x) = a x n + b? 5. Scatter Plot and Best Fit Line Preparations Open a new GeoGebra file. Show the Spreadsheet view (View menu). Hide the Algebra view (View menu). In the Options menu set the Labeling to New Points Only. 13
14 Instructions 1 2 Enter the following numbers into the spreadsheet cells of column A: A1: 1 A2: 5 A3: 2 A4: 8 A5: -2 Enter the following numbers into the spreadsheet cells of column B: B1: -1 B2: 2 B3: 3 B4: 4 B5: 1 3 Create a Scatter Plot from this data: 4 (1) Use the mouse to highlight all cells of columns A and B that contain numbers. (2) Right click (MacOS: Ctrl-click) on one of the highlighted cells and select Create List of Points from the appearing context menu. Note: The values in column A determine the x-coordinates and the values in column B specify the y-coordinates of the plotted points. Use tool Best Fit Line in order to create the line that best fits your data points. Hint: Activate tool Best Fit Line and select all data points using a selection rectangle: Click in the upper left corner of the Graphics view. Hold the mouse key down while moving the pointer to the lower right corner of the Graphics view in order to specify the selection rectangle. 5 Change color and thickness of the line using the Properties dialog. 6 Using this construction you can easily demonstrate how outliers impact the best fit line of a data set: Drag one of the points with the mouse and explore how this modification influences the best fit line. Note: You can easily change the initial data in the Spreadsheet view as well. Importing Data from other Spreadsheets Note: GeoGebra allows you to copy and paste data from other spreadsheet software into the GeoGebra spreadsheet: Select and copy the data you want to import (e.g., use the keyboard shortcut Ctrl-C in order to copy the data to your computer s clipboard). Note: You need to press both keys (e.g., Ctrl-key and C-key) at the same time in order to apply a keyboard shortcut. Open a GeoGebra window and show the Spreadsheet view. 14
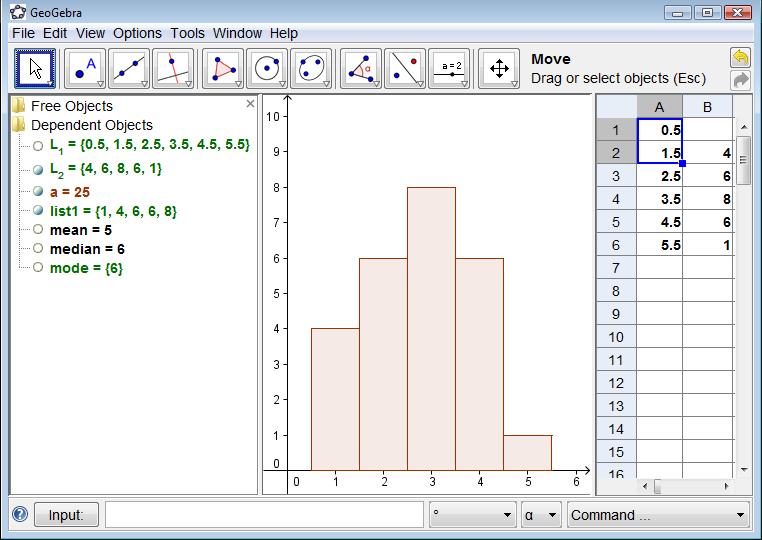
15 Click on the spreadsheet cell that should contain the first data value. Paste the data from your computer s clipboard into GeoGebra s Spreadsheet view. In order to do so, you can either use the keyboard shortcut Ctrl-V or right click (MacOS: Ctrl-click) on the highlighted cell and select Paste from the appearing context menu. 6. Challenge of the Day: Explore Basic Statistics Commands Yesterday, you gave a mathematics quiz to the 25 students of your 1 st period math class. After the quiz, you asked your students to rate the difficulty of the quiz on a scale from 1 ( very easy ) to 5 ( very difficult ). 4 of your students rated the quiz very easy (1) 6 students rated the quiz easy (2) 6 other students rated the quiz difficult (4) 1 student rated the quiz very difficult (5) The rest of the students thought the difficulty of the quiz was ok (3). Task 1: Create a histogramm Enter the data into GeoGebra s spreadsheet and create a histogram that visualizes this data. Hints: If you don t know how to use command Histogram, enter the command into the Input bar and press the F1 key. Note: Class boundaries determine the position and width of the bars of the histogram. The absolute number of students that rated the difficulty of the quiz for each item determines the height of the histogram bars. Choose the class boundaries so that the actual rating score is displayed in the middle of each histogram bar. You need to create a list of the data in each column before you can use the Histogram command Note: Highlight all numbers in one column and right click (MacOS: Ctrlclick) on one of the highlighted cells. Select Create List from the appearing context menu. Task 2: Determine mean, median, and mode 1. Make a prediction for mean, median, and mode of the data you collected. Hint: You can use command Sort in order to sort the list of frequencies of students who rated the difficulty of the quiz in each category. 2. Check your prediction using the commands Mean, Median, and Mode. 15
16 16
Quickstart for Desktop Version
 Quickstart for Desktop Version What is GeoGebra? Dynamic Mathematics Software in one easy-to-use package For learning and teaching at all levels of education Joins interactive 2D and 3D geometry, algebra,
GeoGebra Introduction for Middle and High School Teachers
 GeoGebra Introduction for Middle and High School Teachers GeoGebra Workshop Handout Judith and Markus Hohenwarter www.geogebra.org Table of Contents 1. Introduction and Installation of GeoGebra 3 2. Basic
Quickstart for Web and Tablet App
 Quickstart for Web and Tablet App What is GeoGebra? Dynamic Mathematic Software in one easy-to-use package For learning and teaching at all levels of education Joins interactive 2D and 3D geometry, algebra,
GeoGebra. 10 Lessons. maths.com. Gerrit Stols. For more info and downloads go to:
 GeoGebra in 10 Lessons For more info and downloads go to: http://school maths.com Gerrit Stols Acknowledgements Download GeoGebra from http://www.geogebra.org GeoGebra is dynamic mathematics open source
For more info and downloads go to: Gerrit Stols
 For more info and downloads go to: http://school-maths.com Gerrit Stols Acknowledgements GeoGebra is dynamic mathematics open source (free) software for learning and teaching mathematics in schools. It
GeoGebra Institute of Malaysia
 Introduction GeoGebra Institute of Malaysia We, as mathematics educators, need to teach our students to think critically and to do mathematics as mathematicians do. We need to let them construct their
SPREADSHEET (Excel 2007)
") SPREADSHEET (Excel 2007) 1 U N I T 0 4 BY I F T I K H A R H U S S A I N B A B U R Spreadsheet Microsoft Office Excel 2007 (or Excel) is a computer program used to enter, analyze, and present quantitative
SPREADSHEET (Excel 2007) 1 U N I T 0 4 BY I F T I K H A R H U S S A I N B A B U R Spreadsheet Microsoft Office Excel 2007 (or Excel) is a computer program used to enter, analyze, and present quantitative
Technology Assignment: Scatter Plots
 The goal of this assignment is to create a scatter plot of a set of data. You could do this with any two columns of data, but for demonstration purposes we ll work with the data in the table below. You
Pre-Lab Excel Problem
 Pre-Lab Excel Problem Read and follow the instructions carefully! Below you are given a problem which you are to solve using Excel. If you have not used the Excel spreadsheet a limited tutorial is given
= 3 + (5*4) + (1/2)*(4/2)^2.
 + (1/2)*(4/2)^2.") Physics 100 Lab 1: Use of a Spreadsheet to Analyze Data by Kenneth Hahn and Michael Goggin In this lab you will learn how to enter data into a spreadsheet and to manipulate the data in meaningful ways.
Physics 100 Lab 1: Use of a Spreadsheet to Analyze Data by Kenneth Hahn and Michael Goggin In this lab you will learn how to enter data into a spreadsheet and to manipulate the data in meaningful ways.
Triangle Inequality Theorem
 Triangle Inequality Theorem Preparation Open a new GeoGebra file For this construction, we will not use the coordinate axes or the Algebra window. Click on the View menu on the top of the page. Select
Custom Tools and Customizing the Toolbar
 Custom Tools and Customizing the Toolbar GeoGebra Workshop Handout 7 Judith and Markus Hohenwarter www.geogebra.org Table of Contents 1. The Theorem of Phythagoras 2 2. Creating Custom Tools 4 3. Saving
Creating and Enhancing Dynamic Worksheets with GeoGebra
 Creating and Enhancing Dynamic Worksheets with GeoGebra GeoGebra Workshop Handout 6 Judith and Markus Hohenwarter www.geogebra.org Updated by Steve Phelps giohio.pbworks.com Table of Contents 1. Introduction:
Microsoft Excel 2007
 Microsoft Excel 2007 1 Excel is Microsoft s Spreadsheet program. Spreadsheets are often used as a method of displaying and manipulating groups of data in an effective manner. It was originally created
Websites Geogebra Homepage: Use the Webstart Version of Geogebra or download a stand alone version.
 GeoGebra Workshop 24 th May 2010 Paul Robinson, IT Tallaght Websites Geogebra Homepage: http://www.geogebra.org/cms/ Use the Webstart Version of Geogebra or download a stand alone version. Geogebra Forum:
Microsoft How to Series
 Microsoft How to Series Getting Started with EXCEL 2007 A B C D E F Tabs Introduction to the Excel 2007 Interface The Excel 2007 Interface is comprised of several elements, with four main parts: Office
WEEK NO. 12 MICROSOFT EXCEL 2007
 WEEK NO. 12 MICROSOFT EXCEL 2007 LESSONS OVERVIEW: GOODBYE CALCULATORS, HELLO SPREADSHEET! 1. The Excel Environment 2. Starting A Workbook 3. Modifying Columns, Rows, & Cells 4. Working with Worksheets
Designed by Jason Wagner, Course Web Programmer, Office of e-learning NOTE ABOUT CELL REFERENCES IN THIS DOCUMENT... 1
 Excel Essentials Designed by Jason Wagner, Course Web Programmer, Office of e-learning NOTE ABOUT CELL REFERENCES IN THIS DOCUMENT... 1 FREQUENTLY USED KEYBOARD SHORTCUTS... 1 FORMATTING CELLS WITH PRESET
Computer Applications Final Exam Study Guide
 Name: Computer Applications Final Exam Study Guide Microsoft Word 1. To use -and-, position the pointer on top of the selected text, and then drag the selected text to the new location. 2. The Clipboard
GeoGebra 4. Introduction and Point Plotting
 GeoGebra 4 Introduction and Point Plotting GeoGebra basics Setting up the Interface Steps required: If not visible then show the Input Bar, through the View option on the Toolbar. Make sure that the Algebra
Introduction to. Version 4.2.
 Introduction to Version 4.2 www.geogebra.org Introduction to GeoGebra Last modified: November 6, 2012 Written for GeoGebra 4.2 This book covers the basic introduction to the dynamic mathematics software
Introduction to. Judith and Markus Hohenwarter
 Introduction to Judith and Markus Hohenwarter www.geogebra.org Introduction to GeoGebra Last modified: November 9, 2011 Written for GeoGebra 4.0 This book covers the basic introduction to the dynamic mathematics
Activity: page 1/10 Introduction to Excel. Getting Started
 Activity: page 1/10 Introduction to Excel Excel is a computer spreadsheet program. Spreadsheets are convenient to use for entering and analyzing data. Although Excel has many capabilities for analyzing
Models for Nurses: Quadratic Model ( ) Linear Model Dx ( ) x Models for Doctors:
 Linear Model Dx ( ) x Models for Doctors:") The goal of this technology assignment is to graph several formulas in Excel. This assignment assumes that you using Excel 2007. The formula you will graph is a rational function formed from two polynomials,
The goal of this technology assignment is to graph several formulas in Excel. This assignment assumes that you using Excel 2007. The formula you will graph is a rational function formed from two polynomials,
Creating a Spreadsheet by Using Excel
 The Excel window...40 Viewing worksheets...41 Entering data...41 Change the cell data format...42 Select cells...42 Move or copy cells...43 Delete or clear cells...43 Enter a series...44 Find or replace
Status Bar: Right click on the Status Bar to add or remove features.
 Excel 2013 Quick Start Guide The Excel Window File Tab: Click to access actions like Print, Save As, etc. Also to set Excel options. Ribbon: Logically organizes actions onto Tabs, Groups, and Buttons to
1 Introduction to Using Excel Spreadsheets
 Survey of Math: Excel Spreadsheet Guide (for Excel 2007) Page 1 of 6 1 Introduction to Using Excel Spreadsheets This section of the guide is based on the file (a faux grade sheet created for messing with)
Rockefeller College MPA Excel Workshop: Clinton Impeachment Data Example
 Rockefeller College MPA Excel Workshop: Clinton Impeachment Data Example This exercise is a follow-up to the MPA admissions example used in the Excel Workshop. This document contains detailed solutions
Statistics with a Hemacytometer
 Statistics with a Hemacytometer Overview This exercise incorporates several different statistical analyses. Data gathered from cell counts with a hemacytometer is used to explore frequency distributions
Total Number of Students in US (millions)
") The goal of this technology assignment is to graph a formula on your calculator and in Excel. This assignment assumes that you have a TI 84 or similar calculator and are using Excel 2007. The formula you
The goal of this technology assignment is to graph a formula on your calculator and in Excel. This assignment assumes that you have a TI 84 or similar calculator and are using Excel 2007. The formula you
SAS Visual Analytics 8.2: Working with Report Content
 SAS Visual Analytics 8.2: Working with Report Content About Objects After selecting your data source and data items, add one or more objects to display the results. SAS Visual Analytics provides objects
Data Management Project Using Software to Carry Out Data Analysis Tasks
 Data Management Project Using Software to Carry Out Data Analysis Tasks This activity involves two parts: Part A deals with finding values for: Mean, Median, Mode, Range, Standard Deviation, Max and Min
Using Microsoft Word. Tables
 Using Microsoft Word are a useful way of arranging information on a page. In their simplest form, tables can be used to place information in lists. More complex tables can be used to arrange graphics on
Survey of Math: Excel Spreadsheet Guide (for Excel 2016) Page 1 of 9
 Page 1 of 9") Survey of Math: Excel Spreadsheet Guide (for Excel 2016) Page 1 of 9 Contents 1 Introduction to Using Excel Spreadsheets 2 1.1 A Serious Note About Data Security.................................... 2 1.2
Survey of Math: Excel Spreadsheet Guide (for Excel 2016) Page 1 of 9 Contents 1 Introduction to Using Excel Spreadsheets 2 1.1 A Serious Note About Data Security.................................... 2 1.2
Introduction to. Judith and Markus Hohenwarter
 Introduction to Judith and Markus Hohenwarter www.geogebra.org Introduction to GeoGebra Last modified: April 12, 2012 Written for GeoGebra 4.0 This book covers the basic introduction to the dynamic mathematics
Introduction to Microsoft Excel 2010
 Introduction to Microsoft Excel 2010 This class is designed to cover the following basics: What you can do with Excel Excel Ribbon Moving and selecting cells Formatting cells Adding Worksheets, Rows and
San Francisco State University
 San Francisco State University Michael Bar Instructions for Excel 1. Plotting analytical function. 2 Suppose that you need to plot the graph of a function f ( x) = x on the interval [ 5,5]. Step 1: make
Excel Main Screen. Fundamental Concepts. General Keyboard Shortcuts Open a workbook Create New Save Preview and Print Close a Workbook
 Excel 2016 Main Screen Fundamental Concepts General Keyboard Shortcuts Open a workbook Create New Save Preview and Print Close a Ctrl + O Ctrl + N Ctrl + S Ctrl + P Ctrl + W Help Run Spell Check Calculate
Introduction to Excel 2013
 Introduction to Excel 2013 Copyright 2014, Software Application Training, West Chester University. A member of the Pennsylvania State Systems of Higher Education. No portion of this document may be reproduced
1. Math symbols Operation Symbol Example Order
 Excel 2 Microsoft Excel 2013 Mercer County Library System Brian M. Hughes, County Executive Excel s Order of Calculation 1. Math symbols Operation Symbol Example Order Parentheses ( ) =(4+2)*8 1st Exponents
Microsoft Office Excel 2007: Basic. Course Overview. Course Length: 1 Day. Course Overview
 Microsoft Office Excel 2007: Basic Course Length: 1 Day Course Overview This course teaches the basic functions and features of Excel 2007. After an introduction to spreadsheet terminology and Excel's
Homework 1 Excel Basics
 Homework 1 Excel Basics Excel is a software program that is used to organize information, perform calculations, and create visual displays of the information. When you start up Excel, you will see the
EXCEL 2003 DISCLAIMER:
 EXCEL 2003 DISCLAIMER: This reference guide is meant for experienced Microsoft Excel users. It provides a list of quick tips and shortcuts for familiar features. This guide does NOT replace training or
Microsoft Excel Chapter 3. Working with Large Worksheets, Charting, and What-If Analysis
 Microsoft Excel 2013 Chapter 3 Working with Large Worksheets, Charting, and What-If Analysis Objectives Rotate text in a cell Create a series of month names Copy, paste, insert, and delete cells Format
Unit 12. Electronic Spreadsheets - Microsoft Excel. Desired Outcomes
 Unit 12 Electronic Spreadsheets - Microsoft Excel Desired Outcomes Student understands Excel workbooks and worksheets Student can navigate in an Excel workbook and worksheet Student can use toolbars and
GeoGebra Workshop. (Short Version)
") GeoGebra Workshop (Short Version) Contents Introduction... 2 What is GeoGebra?... 2 Get GeoGebra... 2 Workshop Format... 2 GeoGebra Layout... 3 Examples... 5 The Incenter and Incircle... 5 The Sine Function
GeoGebra Workshop (Short Version) Contents Introduction... 2 What is GeoGebra?... 2 Get GeoGebra... 2 Workshop Format... 2 GeoGebra Layout... 3 Examples... 5 The Incenter and Incircle... 5 The Sine Function
Microsoft Access 2010
 Microsoft Access 2010 Chapter 2 Querying a Database Objectives Create queries using Design view Include fields in the design grid Use text and numeric data in criteria Save a query and use the saved query
Starting Excel application
 MICROSOFT EXCEL 1 2 Microsoft Excel: is a special office program used to apply mathematical operations according to reading a cell automatically, just click on it. It is called electronic tables Starting
Years after US Student to Teacher Ratio
 The goal of this assignment is to create a scatter plot of a set of data. You could do this with any two columns of data, but for demonstration purposes we ll work with the data in the table below. The
SystemVue 2011 Fundamentals (version ) LAB EXERCISE 1. SystemVue Basics
 LAB EXERCISE 1. SystemVue Basics") SystemVue 2011 Fundamentals (version 1-2012) LAB EXERCISE 1 SystemVue Basics This lab exercise introduces the basic use model of SystemVue, including using the built-in templates, running analyses and
SystemVue 2011 Fundamentals (version 1-2012) LAB EXERCISE 1 SystemVue Basics This lab exercise introduces the basic use model of SystemVue, including using the built-in templates, running analyses and
Getting Started With Excel
 Chapter 1 Getting Started With Excel This chapter will familiarize you with various basic features of Excel. Specific features which you need to solve a problem will be introduced as the need arises. When
GeoGebra Quickstart A quick reference guide for GeoGebra
 GeoGebra Quickstart A quick reference guide for GeoGebra GeoGebra is free educational mathematics software that joins dynamic geometry, algebra and calculus. In the most simple manner, you can do constructions
Chemistry Excel. Microsoft 2007
 Chemistry Excel Microsoft 2007 This workshop is designed to show you several functionalities of Microsoft Excel 2007 and particularly how it applies to your chemistry course. In this workshop, you will
Scientific Graphing in Excel 2013
 Scientific Graphing in Excel 2013 When you start Excel, you will see the screen below. Various parts of the display are labelled in red, with arrows, to define the terms used in the remainder of this overview.
Microsoft Access 2013
 Microsoft Access 2013 Chapter 2 Querying a Database Objectives Create queries using Design view Include fields in the design grid Use text and numeric data in criteria Save a query and use the saved query
Microsoft Access 2013
 Microsoft Access 2013 Chapter 2 Querying a Database Objectives Create queries using Design view Include fields in the design grid Use text and numeric data in criteria Save a query and use the saved query
Microsoft Office Excel 2010: Basic. Course Overview. Course Length: 1 Day. Course Overview
 Microsoft Office Excel 2010: Basic Course Length: 1 Day Course Overview This course teaches the basic functions and features of Excel 2010. After an introduction to spreadsheet terminology and Excel's
Introduction to Microsoft Excel 2010
 Introduction to Microsoft Excel 2010 This class is designed to cover the following basics: What you can do with Excel Excel Ribbon Moving and selecting cells Formatting cells Adding Worksheets, Rows and
Microsoft Excel 2010 Tutorial
 1 Microsoft Excel 2010 Tutorial Excel is a spreadsheet program in the Microsoft Office system. You can use Excel to create and format workbooks (a collection of spreadsheets) in order to analyze data and
PowerPoint 2016 Building a Presentation
 PowerPoint 2016 Building a Presentation What is PowerPoint? PowerPoint is presentation software that helps users quickly and efficiently create dynamic, professional-looking presentations through the use
Separate Text Across Cells The Convert Text to Columns Wizard can help you to divide the text into columns separated with specific symbols.
 Chapter 7 Highlights 7.1 The Use of Formulas and Functions 7.2 Creating Charts 7.3 Using Chart Toolbar 7.4 Changing Source Data of a Chart Separate Text Across Cells The Convert Text to Columns Wizard
Text box. Command button. 1. Click the tool for the control you choose to draw in this case, the text box.
 Visual Basic Concepts Hello, Visual Basic See Also There are three main steps to creating an application in Visual Basic: 1. Create the interface. 2. Set properties. 3. Write code. To see how this is done,
Select the Points You ll Use. Tech Assignment: Find a Quadratic Function for College Costs
 In this technology assignment, you will find a quadratic function that passes through three of the points on each of the scatter plots you created in an earlier technology assignment. You will need the
COMPUTER TECHNOLOGY SPREADSHEETS BASIC TERMINOLOGY. A workbook is the file Excel creates to store your data.
 SPREADSHEETS BASIC TERMINOLOGY A Spreadsheet is a grid of rows and columns containing numbers, text, and formulas. A workbook is the file Excel creates to store your data. A worksheet is an individual
Excel Lesson 1 Microsoft Excel Basics
 Microsoft Excel Basics Microsoft Office 2010 Introductory 1 Objectives Define the terms spreadsheet and worksheet. Identify the parts of a worksheet. Start Excel, open an existing workbook, and save a
Three-Dimensional (Surface) Plots
 Plots") Three-Dimensional (Surface) Plots Creating a Data Array 3-Dimensional plots (surface plots) are often useful for visualizing the behavior of functions and identifying important mathematical/physical features
Three-Dimensional (Surface) Plots Creating a Data Array 3-Dimensional plots (surface plots) are often useful for visualizing the behavior of functions and identifying important mathematical/physical features
Microsoft Excel 2013: Excel Basics June 2014
 Microsoft Excel 2013: Excel Basics June 2014 Description Excel is a powerful spreadsheet program. Please note that in this class we will use Excel 2010 or 2013. Learn how to create spreadsheets, enter
lab MS Excel 2010 active cell
 MS Excel is an example of a spreadsheet, a branch of software meant for performing different kinds of calculations, numeric data analysis and presentation, statistical operations and forecasts. The main
Scientific Graphing in Excel 2007
 Scientific Graphing in Excel 2007 When you start Excel, you will see the screen below. Various parts of the display are labelled in red, with arrows, to define the terms used in the remainder of this overview.
GeoGebra for Synthetic Geometry
 ICT & MATHS Module 1 GeoGebra for Synthetic Geometry Published by The National Centre for Technology in Education in association with the Project Maths Development Team. Permission granted to reproduce
Number of Regions An Introduction to the TI-Nspire CAS Student Worksheet Created by Melissa Sutherland, State University of New York at Geneseo
 1 Name Number of Regions An Introduction to the TI-Nspire CAS Student Worksheet Created by Melissa Sutherland, State University of New York at Geneseo Below you will find copies of the notes provided on
Microsoft Excel 2010 Part 2: Intermediate Excel
 CALIFORNIA STATE UNIVERSITY, LOS ANGELES INFORMATION TECHNOLOGY SERVICES Microsoft Excel 2010 Part 2: Intermediate Excel Spring 2014, Version 1.0 Table of Contents Introduction...3 Working with Rows and
Contents. Group 3 Excel Handouts 2010
 Contents Function Library... 2 Function Operators... 2 Order of Multiple Operators... 2 Function Library... 3 Formula Auditing... 4 Name Cells... 7 Comments... 8 Show Ink... 9 Show Ink is a colorful way
Excel Basics. TJ McKeon
 Excel Basics TJ McKeon What is Excel? Electronic Spreadsheet in a rows and columns layout Can contain alphabetical and numerical data (text, dates, times, numbers) Allows for easy calculations and mathematical
DataPro Quick Start Guide
 DataPro Quick Start Guide Introduction The DataPro application provides the user with the ability to download and analyze data acquired using the ULTRA-LITE PRO range of Auto Meter products. Please see
Microsoft Excel Chapter 3. Working with Large Worksheets, Charting, and What-If Analysis
 Microsoft Excel 2013 Chapter 3 Working with Large Worksheets, Charting, and What-If Analysis Objectives Rotate text in a cell Create a series of month names Copy, paste, insert, and delete cells Format
Office of Instructional Technology
 Office of Instructional Technology Microsoft Excel 2016 Contact Information: 718-254-8565 ITEC@citytech.cuny.edu Contents Introduction to Excel 2016... 3 Opening Excel 2016... 3 Office 2016 Ribbon... 3
Creating & Using Tables
 Creating & Using Tables in Microsoft Word 2000 Created by and for: Internet and Technology Training Services Office of Information Technology What is a Table? A table is a structure that is divided into
Fathom Dynamic Data TM Version 2 Specifications
 Data Sources Fathom Dynamic Data TM Version 2 Specifications Use data from one of the many sample documents that come with Fathom. Enter your own data by typing into a case table. Paste data from other
MS Office for Engineers
 MS Office for Engineers Lesson 4 Excel 2 Pre-reqs/Technical Skills Basic knowledge of Excel Completion of Excel 1 tutorial Basic computer use Expectations Read lesson material Implement steps in software
SUM - This says to add together cells F28 through F35. Notice that it will show your result is
 COUNTA - The COUNTA function will examine a set of cells and tell you how many cells are not empty. In this example, Excel analyzed 19 cells and found that only 18 were not empty. COUNTBLANK - The COUNTBLANK
EXCEL 2007 TIP SHEET. Dialog Box Launcher these allow you to access additional features associated with a specific Group of buttons within a Ribbon.
 EXCEL 2007 TIP SHEET GLOSSARY AutoSum a function in Excel that adds the contents of a specified range of Cells; the AutoSum button appears on the Home ribbon as a. Dialog Box Launcher these allow you to
Chapter 3: Rate Laws Excel Tutorial on Fitting logarithmic data
 Chapter 3: Rate Laws Excel Tutorial on Fitting logarithmic data The following table shows the raw data which you need to fit to an appropriate equation k (s -1 ) T (K) 0.00043 312.5 0.00103 318.47 0.0018
Chapter 2 Assignment (due Thursday, April 19)
") (due Thursday, April 19) Introduction: The purpose of this assignment is to analyze data sets by creating histograms and scatterplots. You will use the STATDISK program for both. Therefore, you should
(due Thursday, April 19) Introduction: The purpose of this assignment is to analyze data sets by creating histograms and scatterplots. You will use the STATDISK program for both. Therefore, you should
Day : Date : Objects : Open MS Excel program. Subject : * Open Excel application. Select : start. Choose: programs. Choose : Microsoft Office
 1 2 Day : Date : Objects : Open MS Excel program. Subject : * Open Excel application. Select : start Choose: programs Choose : Microsoft Office Select: Excel * Close the Excel program Click on the Close
Name: Dr. Fritz Wilhelm Lab 1, Presentation of lab reports Page # 1 of 7 5/17/2012 Physics 120 Section: ####
 Name: Dr. Fritz Wilhelm Lab 1, Presentation of lab reports Page # 1 of 7 Lab partners: Lab#1 Presentation of lab reports The first thing we do is to create page headers. In Word 2007 do the following:
Use the Move tool to drag A around and see how the automatically constructed objects (like G or the perpendicular and parallel lines) are updated.
 are updated.") Math 5335 Fall 2015 Lab #0: Installing and using GeoGebra This semester you will have a number of lab assignments which require you to use GeoGebra, a dynamic geometry program. GeoGebra lets you explore
Math 5335 Fall 2015 Lab #0: Installing and using GeoGebra This semester you will have a number of lab assignments which require you to use GeoGebra, a dynamic geometry program. GeoGebra lets you explore
GeoGebra Workbook 2 More Constructions, Measurements and Sliders
 GeoGebra Workbook 2 More Constructions, Measurements and Sliders Paddy Johnson and Tim Brophy www.ul.ie/cemtl/ Table of Contents 1. Square Construction and Measurement 2 2. Circumscribed Circle of a Triangle
Excel tutorial Introduction
 Office button Excel tutorial Introduction Microsoft Excel is an electronic spreadsheet. You can use it to organize your data into rows and columns. You can also use it to perform mathematical calculations
2. Getting Started When you start GeoGebra, you will see a version of the following window. 1
 Math 5335 Fall 2018 Lab #0: Installing and using GeoGebra This semester you will have a number of lab assignments which require you to use GeoGebra, a dynamic geometry program. GeoGebra lets you explore
SAMLab Tip Sheet #4 Creating a Histogram
 Creating a Histogram Another great feature of Excel is its ability to visually display data. This Tip Sheet demonstrates how to create a histogram and provides a general overview of how to create graphs,
Introduction to Microsoft Excel
 Create it Introduction to Microsoft Excel It's the beginning of the year (or you just got your new computer) and you want to create an electronic grade book to keep track of student achievement and do
Microsoft Excel 2016 / 2013 Basic & Intermediate
 Microsoft Excel 2016 / 2013 Basic & Intermediate Duration: 2 Days Introduction Basic Level This course covers the very basics of the Excel spreadsheet. It is suitable for complete beginners without prior
Microsoft Excel 2010 Handout
 Microsoft Excel 2010 Handout Excel is an electronic spreadsheet program you can use to enter and organize data, and perform a wide variety of number crunching tasks. Excel helps you organize and track
Module 4 : Spreadsheets
 Module 4 : Spreadsheets What is a spreadsheet program? A spreadsheet program allows you to store, organise and analyse information. Applications of spreadsheets focus on generating numeric information
Microsoft Excel Lab: Data Analysis
 1 Microsoft Excel Lab: The purpose of this lab is to prepare the student to use Excel as a tool for analyzing data taken in other courses. The example used here comes from a Freshman physics lab with measurements
Excel Formulas & Functions I CS101
 Excel Formulas & Functions I CS101 Topics Covered Use statistical functions Use cell references Use AutoFill Write formulas Use the RANK.EQ function Calculation in Excel Click the cell where you want to
How to use Excel Spreadsheets for Graphing
 How to use Excel Spreadsheets for Graphing 1. Click on the Excel Program on the Desktop 2. You will notice that a screen similar to the above screen comes up. A spreadsheet is divided into Columns (A,
Iwrite this realizing it is my final Technology
 TECHNOLOGY tips Sliders and Parameters Extend Interactive Software This department offers a forum where teachers can share innovative classroom activities and ideas related to teaching and learning mathematics
EXCEL 2007 GETTING STARTED
 EXCEL 2007 GETTING STARTED TODAY S DESTINATION Quick Access Toolbar Customize it! Office Button Click Excel Options BREAK DOWN OF TABS & RIBBON Tab Name Contains Information relating to Contains the following