WJEC MATHEMATICS INTERMEDIATE GRAPHS STRAIGHT LINE GRAPHS (PLOTTING)
|
|
|
- Shauna Brook Edwards
- 5 years ago
- Views:
Transcription

1 WJEC MATHEMATICS INTERMEDIATE GRAPHS STRAIGHT LINE GRAPHS (PLOTTING) 1
2 Contents Some Simple Straight Lines y = mx + c Parallel Lines Perpendicular Lines Plotting Equations Shaded Regions Credits WJEC Question bank 2
3 Some Simple Straight Lines There are some basic straight lines that you should be able to draw. y = x The line of y = x is a diagonal line that does through (0,0). y = x The line y = x goes is a diagonal line, opposite to y = x 3
4 y =? If you need to plot a graph of y =? (For example, y = 3 as seen below), you need to find the number on the y axis and draw a horizontal line. x =? If you need to plot a graph of x =? (For example, x = 3 as seen below), you need to find the number on the x axis and draw a vertical line. Common Confusion! Yes, the y axis is the vertical axis, but the line y = 4 is a horizontal line And yes, the x axis is the horizontal axis, but the line x = 4 is a vertical line 4
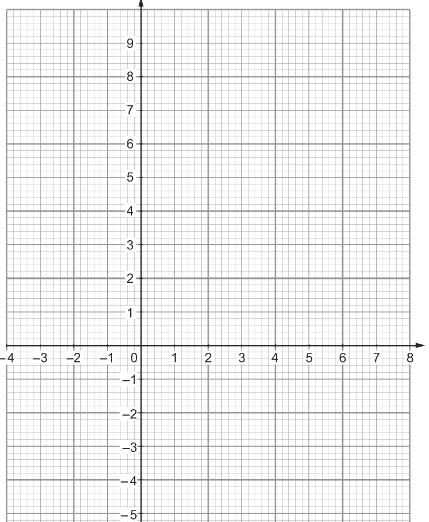
5 Exercise G2 1. Plot, and label, the following lines of the graph paper below a. y = 4 b. y = 2 c. y = 1 d. y = 5 e. y = 2 f. y = 1 2. Plot, and label, the following lines of the graph paper below a. x = 2 b. x = 5 c. x = 3 d. x = 4 e. x = 1 f. x = 0 5
6 y = mx + c You may be shown a straight line and asked to write the equation of that line. The formula we use is; y = mx + c where; m is the gradient of the line c is where the line crosses the y axis Example Write the equation of the following line in the form y = mx + c So for the above line length of vertical The gradient of the line is = 1 length of horizontal 2 The line passes through the y axis at 1 The equation is y = 1 2 x Finding the Gradient To find the gradient, use the line to draw a right angled triangle: length of vertical length of horizontal If the line goes up the gradient is positive. If the line goes down, the gradient is negative 2 1 For this line, length of vertical The gradient is = 2 = 2 lengthof horizontal 1 The line passes through the y axis at -3 The equation is y = 2x 3 6
7 Exercise G3 Write the equations of the following lines Parallel Lines Parallel lines have the SAME GRADENT. y = 1 x y = 1 x y = 1 x 1 2 Gradient of Parallel Lines You can see from the equations of these parallel lines that the gradients are the same. 7
8 Perpendicular Lines The gradients of two lines that are perpendicular (meet at a right angle) MULTIPLY TO GIVE -1 y = 1 2 x + 2 Gradient of Perpendicular Lines Multiply the gradients together 1 2 = 1 2 So the lines are perpendicular Example Question Write the equation of a line that is parallel to y = 3x + 2 and a line that is perpendicular to y = 3x + 2 Note: You only need to change the gradient, the value of c does not affect whether lines are parallel or perpendicular. Parallel line: y = 3x + 1 Perpendicular line: y = 1 3 x + 1 Exercise G4 Write the equation of a line that is perpendicular and a line that is parallel to the following equations: a. y = 2x + 1 e. y = 1 x b. y = 4x 2 f. y = 1 c. y = 12x 4 x d. y = 1 2 x + 4 y = 2x = 1 3 So the lines are perpendicular 8
9 Plotting Straight Lines You may be given an equation and be asked to draw the line. To do this, you will need to create a table of points Substitute these x values into the x on the top x equation to find y on the bottom y the y value that goes with it Once you have these points, plot them and the connect them with a line Example Plot the line y = 2x 3 on the graph paper below. Step one Draw your table of points x y If using 1, 2, 3 isn't easy use three different values of x instead Substitute the x values into the equation (See the booklet Substitution for more help with this) 2(1) 3 = 2 3 = 1 2(2) 3 = 4 3 = 1 2(3) 3 = 6 3 = 3 x y We now have three coordinate points (1,-1) (2,1) and (3,3) 9
10 To complete the question, plot the points and join them up with a line. Make sure the equation is in the form y = mx + c If the question gives you the equation in a different form, rearrange it e.g. x + y = 4 becomes y = x + 4 Make sure your line uses the entire space of the graph Exercise G5 Plot the following lines y = x + 2 y = 2x y = 3x 5 y = 1 2 x
11 Exam Questions G
12
 that is contained within all the lines.")
13 Shaded Regions (Inequalities) Common questions will give you multiple straight line equations. Once all the equations have been plotted there will be a region (part of the graph) that is contained within all the lines. Example Using the axes below, find the region defined by the following inequalities x 2 y 1 x + 2y 4 Don't be worried by the inequalities. For now, assume they are all '=' signs, rearrange them to the correct form, and plot them. Once you have drawn all the lines, you will find an area created by the three lines. This is the region that you need to shade. 13
14 Exam Questions G
15
WJEC MATHEMATICS INTERMEDIATE NUMBER STANDARD FORM
 WJEC MATHEMATICS INTERMEDIATE NUMBER STANDARD FORM 1 Contents Expressing numbers in standard form Adjusting numbers in standard form Calculations using standard form #1: Multiplication Calculations using
Revision Topic 11: Straight Line Graphs
 Revision Topic : Straight Line Graphs The simplest way to draw a straight line graph is to produce a table of values. Example: Draw the lines y = x and y = 6 x. Table of values for y = x x y - - - - =
Mathematics (www.tiwariacademy.com)
") () Miscellaneous Exercise on Chapter 10 Question 1: Find the values of k for which the line is (a) Parallel to the x-axis, (b) Parallel to the y-axis, (c) Passing through the origin. Answer 1: The given
() Miscellaneous Exercise on Chapter 10 Question 1: Find the values of k for which the line is (a) Parallel to the x-axis, (b) Parallel to the y-axis, (c) Passing through the origin. Answer 1: The given
Chapter 12: Quadratic and Cubic Graphs
 Chapter 12: Quadratic and Cubic Graphs Section 12.1 Quadratic Graphs x 2 + 2 a 2 + 2a - 6 r r 2 x 2 5x + 8 2y 2 + 9y + 2 All the above equations contain a squared number. They are therefore called quadratic
Forms of Linear Equations
 6. 1-6.3 Forms of Linear Equations Name Sec 6.1 Writing Linear Equations in Slope-Intercept Form *Recall that slope intercept form looks like y = mx + b, where m = slope and b = y=intercept 1) Writing
Review for Mastery Using Graphs and Tables to Solve Linear Systems
 3-1 Using Graphs and Tables to Solve Linear Systems A linear system of equations is a set of two or more linear equations. To solve a linear system, find all the ordered pairs (x, y) that make both equations
ax + by = 0. x = c. y = d.
 Review of Lines: Section.: Linear Inequalities in Two Variables The equation of a line is given by: ax + by = c. for some given numbers a, b and c. For example x + y = 6 gives the equation of a line. A
Chapter 1. Linear Equations and Straight Lines. 2 of 71. Copyright 2014, 2010, 2007 Pearson Education, Inc.
 Chapter 1 Linear Equations and Straight Lines 2 of 71 Outline 1.1 Coordinate Systems and Graphs 1.4 The Slope of a Straight Line 1.3 The Intersection Point of a Pair of Lines 1.2 Linear Inequalities 1.5
About Graphing Lines
 About Graphing Lines TABLE OF CONTENTS About Graphing Lines... 1 What is a LINE SEGMENT?... 1 Ordered Pairs... 1 Cartesian Co-ordinate System... 1 Ordered Pairs... 2 Line Segments... 2 Slope of a Line
DISTANCE FORMULA: to find length or distance =( ) +( )
 +( )") MATHEMATICS ANALYTICAL GEOMETRY DISTANCE FORMULA: to find length or distance =( ) +( ) A. TRIANGLES: Distance formula is used to show PERIMETER: sum of all the sides Scalene triangle: 3 unequal sides Isosceles
MATHEMATICS ANALYTICAL GEOMETRY DISTANCE FORMULA: to find length or distance =( ) +( ) A. TRIANGLES: Distance formula is used to show PERIMETER: sum of all the sides Scalene triangle: 3 unequal sides Isosceles
JUST THE MATHS SLIDES NUMBER 5.2. GEOMETRY 2 (The straight line) A.J.Hobson
 A.J.Hobson") JUST THE MATHS SLIDES NUMBER 5.2 GEOMETRY 2 (The straight line) by A.J.Hobson 5.2.1 Preamble 5.2.2 Standard equations of a straight line 5.2.3 Perpendicular straight lines 5.2.4 Change of origin UNIT 5.2
JUST THE MATHS SLIDES NUMBER 5.2 GEOMETRY 2 (The straight line) by A.J.Hobson 5.2.1 Preamble 5.2.2 Standard equations of a straight line 5.2.3 Perpendicular straight lines 5.2.4 Change of origin UNIT 5.2
The Straight Line. m is undefined. Use. Show that mab
 The Straight Line What is the gradient of a horizontal line? What is the equation of a horizontal line? So the equation of the x-axis is? What is the gradient of a vertical line? What is the equation of
S56 (5.3) Higher Straight Line.notebook June 22, 2015
 Higher Straight Line.notebook June 22, 2015") Daily Practice 5.6.2015 Q1. Simplify Q2. Evaluate L.I: Today we will be revising over our knowledge of the straight line. Q3. Write in completed square form x 2 + 4x + 7 Q4. State the equation of the line
Daily Practice 5.6.2015 Q1. Simplify Q2. Evaluate L.I: Today we will be revising over our knowledge of the straight line. Q3. Write in completed square form x 2 + 4x + 7 Q4. State the equation of the line
Advanced Algebra. Equation of a Circle
 Advanced Algebra Equation of a Circle Task on Entry Plotting Equations Using the table and axis below, plot the graph for - x 2 + y 2 = 25 x -5-4 -3 0 3 4 5 y 1 4 y 2-4 3 2 + y 2 = 25 9 + y 2 = 25 y 2
2 Unit Bridging Course Day 2 Linear functions I: Gradients
 1 / 33 2 Unit Bridging Course Day 2 Linear functions I: Gradients Clinton Boys 2 / 33 Linear functions Linear functions are a particularly simple and special type of functions. They are widely used in
slope rise run Definition of Slope
 The Slope of a Line Mathematicians have developed a useful measure of the steepness of a line, called the slope of the line. Slope compares the vertical change (the rise) to the horizontal change (the
Math 1313 Prerequisites/Test 1 Review
 Math 1313 Prerequisites/Test 1 Review Test 1 (Prerequisite Test) is the only exam that can be done from ANYWHERE online. Two attempts. See Online Assignments in your CASA account. Note the deadline too.
Section Graphs and Lines
 Section 1.1 - Graphs and Lines The first chapter of this text is a review of College Algebra skills that you will need as you move through the course. This is a review, so you should have some familiarity
Graphing Linear Equations
 Graphing Linear Equations A.REI.10 Understand that the graph of an equation in two variables is the set of all its solutions plotted in the coordinate plane. What am I learning today? How to graph a linear
graphing_9.1.notebook March 15, 2019
 1 2 3 Writing the equation of a line in slope intercept form. In order to write an equation in y = mx + b form you will need the slope "m" and the y intercept "b". We will subsitute the values for m and
UNIT NUMBER 5.2. GEOMETRY 2 (The straight line) A.J.Hobson
 A.J.Hobson") JUST THE MATHS UNIT NUMBER 5.2 GEOMETRY 2 (The straight line) b A.J.Hobson 5.2.1 Preamble 5.2.2 Standard equations of a straight line 5.2. Perpendicular straight lines 5.2.4 Change of origin 5.2.5 Exercises
JUST THE MATHS UNIT NUMBER 5.2 GEOMETRY 2 (The straight line) b A.J.Hobson 5.2.1 Preamble 5.2.2 Standard equations of a straight line 5.2. Perpendicular straight lines 5.2.4 Change of origin 5.2.5 Exercises
 CHAPTER - 10 STRAIGHT LINES Slope or gradient of a line is defined as m = tan, ( 90 ), where is angle which the line makes with positive direction of x-axis measured in anticlockwise direction, 0 < 180
Topic. Section 4.1 (3, 4)
") Topic.. California Standards: 6.0: Students graph a linear equation and compute the x- and y-intercepts (e.g., graph x + 6y = ). They are also able to sketch the region defined by linear inequality (e.g.,
Topic.. California Standards: 6.0: Students graph a linear equation and compute the x- and y-intercepts (e.g., graph x + 6y = ). They are also able to sketch the region defined by linear inequality (e.g.,
Coordinate Geometry. Coordinate geometry is the study of the relationships between points on the Cartesian plane
 Coordinate Geometry Coordinate geometry is the study of the relationships between points on the Cartesian plane What we will explore in this tutorial (a) Explore gradient I. Identify the gradient of a
QUADRATIC AND CUBIC GRAPHS
 NAME SCHOOL INDEX NUMBER DATE QUADRATIC AND CUBIC GRAPHS KCSE 1989 2012 Form 3 Mathematics Working Space 1. 1989 Q22 P1 (a) Using the grid provided below draw the graph of y = -2x 2 + x + 8 for values
of Straight Lines 1. The straight line with gradient 3 which passes through the point,2
 Learning Enhancement Team Model answers: Finding Equations of Straight Lines Finding Equations of Straight Lines stud guide The straight line with gradient 3 which passes through the point, 4 is 3 0 Because
Unit 3 Higher topic list
 This is a comprehensive list of the topics to be studied for the Edexcel unit 3 modular exam. Beside the topics listed are the relevant tasks on www.mymaths.co.uk that students can use to practice. Logon
Sketching Straight Lines (Linear Relationships)
") Sketching Straight Lines (Linear Relationships) The slope of the line is m = y x = y 2 y 1 = rise run. Horizontal lines have the form y = b and have slope m = 0. Vertical lines have the form x = a and
Sketching Straight Lines (Linear Relationships) The slope of the line is m = y x = y 2 y 1 = rise run. Horizontal lines have the form y = b and have slope m = 0. Vertical lines have the form x = a and
Intro. To Graphing Linear Equations
 Intro. To Graphing Linear Equations The Coordinate Plane A. The coordinate plane has 4 quadrants. B. Each point in the coordinate plain has an x-coordinate (the abscissa) and a y-coordinate (the ordinate).
The Rectangular Coordinate System and Equations of Lines. College Algebra
 The Rectangular Coordinate System and Equations of Lines College Algebra Cartesian Coordinate System A grid system based on a two-dimensional plane with perpendicular axes: horizontal axis is the x-axis
PARRENTHORN HIGH SCHOOL Mathematics Department. YEAR 11 GCSE PREPARATION Revision Booklet
 PARRENTHORN HIGH SCHOOL Mathematics Department YEAR GCSE PREPARATION Revision Booklet Name: _ Class: Teacher: GEOMETRY & MEASURES Area, Perimeter, Volume & Circles AREA FORMULAS Area is the space a 2D
You should be able to plot points on the coordinate axis. You should know that the the midpoint of the line segment joining (x, y 1 1
 Name GRAPHICAL REPRESENTATION OF DATA: You should be able to plot points on the coordinate axis. You should know that the the midpoint of the line segment joining (x, y 1 1 ) and (x, y ) is x1 x y1 y,.
Graphing Linear Equations
 Graphing Linear Equations Question 1: What is a rectangular coordinate system? Answer 1: The rectangular coordinate system is used to graph points and equations. To create the rectangular coordinate system,
SNAP Centre Workshop. Graphing Lines
 SNAP Centre Workshop Graphing Lines 45 Graphing a Line Using Test Values A simple way to linear equation involves finding test values, plotting the points on a coordinate plane, and connecting the points.
WJEC LEVEL 2 CERTIFICATE 9550/01 ADDITIONAL MATHEMATICS
 Surname Other Names Centre Number 0 Candidate Number WJEC LEVEL 2 CERTIFICATE 9550/01 ADDITIONAL MATHEMATICS A.M. MONDAY, 24 June 2013 2 1 hours 2 ADDITIONAL MATERIALS A calculator will be required for
List of Topics for Analytic Geometry Unit Test
 List of Topics for Analytic Geometry Unit Test 1. Finding Slope 2. Rule of 4 (4 forms of a line) Graph, Table of Values, Description, Equation 3. Find the Equations- Vertical and Horizontal Lines 4. Standard
Math 2 Coordinate Geometry Part 3 Inequalities & Quadratics
 Math 2 Coordinate Geometry Part 3 Inequalities & Quadratics 1 DISTANCE BETWEEN TWO POINTS - REVIEW To find the distance between two points, use the Pythagorean theorem. The difference between x 1 and x
Overview for Families
 unit: Graphing Equations Mathematical strand: Algebra The following pages will help you to understand the mathematics that your child is currently studying as well as the type of problems (s)he will solve
FLC Ch 3. Ex 1 Plot the points Ex 2 Give the coordinates of each point shown. Sec 3.2: Solutions and Graphs of Linear Equations
 Math 100 Elementary Algebra Sec 3.1: The Rectangular Coordinate System x-axis and y-axis origin ordered pair x-coordinate y-coordinate quadrants (I, II, III, and IV) Rectangular/Cartesian Coordinate System
Int 2 Checklist (Unit 1) Int 2 Checklist (Unit 1) Percentages
 Int 2 Checklist (Unit 1) Percentages") Percentages Know that appreciation means an increase in value and depreciation means a decrease in value Calculate simple interest over 1 year Calculate simple interest over a certain number of months
Percentages Know that appreciation means an increase in value and depreciation means a decrease in value Calculate simple interest over 1 year Calculate simple interest over a certain number of months
9.1 Linear Inequalities in Two Variables Date: 2. Decide whether to use a solid line or dotted line:
 9.1 Linear Inequalities in Two Variables Date: Key Ideas: Example Solve the inequality by graphing 3y 2x 6. steps 1. Rearrange the inequality so it s in mx ± b form. Don t forget to flip the inequality
Education Resources. This section is designed to provide examples which develop routine skills necessary for completion of this section.
 Education Resources Straight Line Higher Mathematics Supplementary Resources Section A This section is designed to provide examples which develop routine skills necessary for completion of this section.
3.1. 3x 4y = 12 3(0) 4y = 12. 3x 4y = 12 3x 4(0) = y = x 0 = 12. 4y = 12 y = 3. 3x = 12 x = 4. The Rectangular Coordinate System
 4y = 12. 3x 4y = 12 3x 4(0) = y = x 0 = 12. 4y = 12 y = 3. 3x = 12 x = 4. The Rectangular Coordinate System") 3. The Rectangular Coordinate System Interpret a line graph. Objectives Interpret a line graph. Plot ordered pairs. 3 Find ordered pairs that satisfy a given equation. 4 Graph lines. 5 Find x- and y-intercepts.
3. The Rectangular Coordinate System Interpret a line graph. Objectives Interpret a line graph. Plot ordered pairs. 3 Find ordered pairs that satisfy a given equation. 4 Graph lines. 5 Find x- and y-intercepts.
Rational Numbers: Graphing: The Coordinate Plane
 Rational Numbers: Graphing: The Coordinate Plane A special kind of plane used in mathematics is the coordinate plane, sometimes called the Cartesian plane after its inventor, René Descartes. It is one
GCSE-AS Mathematics Bridging Course. Chellaston School. Dr P. Leary (KS5 Coordinator) Monday Objectives. The Equation of a Line.
 Monday Objectives. The Equation of a Line.") GCSE-AS Mathematics Bridging Course Chellaston School Dr (KS5 Coordinator) Monday Objectives The Equation of a Line Surds Linear Simultaneous Equations Tuesday Objectives Factorising Quadratics & Equations
GCSE-AS Mathematics Bridging Course Chellaston School Dr (KS5 Coordinator) Monday Objectives The Equation of a Line Surds Linear Simultaneous Equations Tuesday Objectives Factorising Quadratics & Equations
Vocabulary Unit 2-3: Linear Functions & Healthy Lifestyles. Scale model a three dimensional model that is similar to a three dimensional object.
 Scale a scale is the ratio of any length in a scale drawing to the corresponding actual length. The lengths may be in different units. Scale drawing a drawing that is similar to an actual object or place.
Section 18-1: Graphical Representation of Linear Equations and Functions
 Section 18-1: Graphical Representation of Linear Equations and Functions Prepare a table of solutions and locate the solutions on a coordinate system: f(x) = 2x 5 Learning Outcome 2 Write x + 3 = 5 as
Linear Functions. College Algebra
 Linear Functions College Algebra Linear Function A linear function is a function whose graph is a straight line. Linear functions can be written in the slope-intercept form of a line: f(x) = mx + b where
Section 1.1 The Distance and Midpoint Formulas
 Section 1.1 The Distance and Midpoint Formulas 1 y axis origin x axis 2 Plot the points: ( 3, 5), (0,7), ( 6,0), (6,4) 3 Distance Formula y x 4 Finding the Distance Between Two Points Find the distance
STRAIGHT LINE GRAPHS THE COORDINATES OF A POINT. The coordinates of any point are written as an ordered pair (x, y)
") THE COORDINATES OF A POINT STRAIGHT LINE GRAPHS The coordinates of any point are written as an ordered pair (x, y) Point P in the diagram has coordinates (2, 3). Its horizontal distance along the x axis
THE COORDINATES OF A POINT STRAIGHT LINE GRAPHS The coordinates of any point are written as an ordered pair (x, y) Point P in the diagram has coordinates (2, 3). Its horizontal distance along the x axis
Important Things to Remember on the SOL
 Notes Important Things to Remember on the SOL Evaluating Expressions *To evaluate an expression, replace all of the variables in the given problem with the replacement values and use (order of operations)
Sec 4.1 Coordinates and Scatter Plots. Coordinate Plane: Formed by two real number lines that intersect at a right angle.
 Algebra I Chapter 4 Notes Name Sec 4.1 Coordinates and Scatter Plots Coordinate Plane: Formed by two real number lines that intersect at a right angle. X-axis: The horizontal axis Y-axis: The vertical
Math-2. Lesson 3-1. Equations of Lines
 Math-2 Lesson 3-1 Equations of Lines How can an equation make a line? y = x + 1 x -4-3 -2-1 0 1 2 3 Fill in the rest of the table rule x + 1 f(x) -4 + 1-3 -3 + 1-2 -2 + 1-1 -1 + 1 0 0 + 1 1 1 + 1 2 2 +
Practice Test (page 391) 1. For each line, count squares on the grid to determine the rise and the run. Use slope = rise
 1. For each line, count squares on the grid to determine the rise and the run. Use slope = rise") Practice Test (page 91) 1. For each line, count squares on the grid to determine the rise and the. Use slope = rise 4 Slope of AB =, or 6 Slope of CD = 6 9, or Slope of EF = 6, or 4 Slope of GH = 6 4,
Practice Test (page 91) 1. For each line, count squares on the grid to determine the rise and the. Use slope = rise 4 Slope of AB =, or 6 Slope of CD = 6 9, or Slope of EF = 6, or 4 Slope of GH = 6 4,
1. Use the Trapezium Rule with five ordinates to find an approximate value for the integral
 1. Use the Trapezium Rule with five ordinates to find an approximate value for the integral Show your working and give your answer correct to three decimal places. 2 2.5 3 3.5 4 When When When When When
Year 7 Set 1 : Unit 1 : Number 1. Learning Objectives: Level 5
 Year 7 Set 1 : Unit 1 : Number 1 I can place decimals in order of size I can place negative numbers in order of size I can add and subtract negative numbers I can set out and do addition, subtraction,
Vertical Line Test a relationship is a function, if NO vertical line intersects the graph more than once
 Algebra 2 Chapter 2 Domain input values, X (x, y) Range output values, Y (x, y) Function For each input, there is exactly one output Example: Vertical Line Test a relationship is a function, if NO vertical
Chapter 1 Section 1 Solving Linear Equations in One Variable
 Chapter Section Solving Linear Equations in One Variable A linear equation in one variable is an equation which can be written in the form: ax + b = c for a, b, and c real numbers with a 0. Linear equations
Example 1: Give the coordinates of the points on the graph.
 Ordered Pairs Often, to get an idea of the behavior of an equation, we will make a picture that represents the solutions to the equation. A graph gives us that picture. The rectangular coordinate plane,
Click on the topic to go to the page
 Click on the topic to go to the page A B C 3D Pythagoras 3D Trigonometry and Pythagoras accuracy calculation with bounds 164 addition of decimals 389 of fractions 269 of money 457 of negative numbers of
Mathematics Department Inverclyde Academy
 Common Factors I can gather like terms together correctly. I can substitute letters for values and evaluate expressions. I can multiply a bracket by a number. I can use common factor to factorise a sum
Section 4.4: Parabolas
 Objective: Graph parabolas using the vertex, x-intercepts, and y-intercept. Just as the graph of a linear equation y mx b can be drawn, the graph of a quadratic equation y ax bx c can be drawn. The graph
GRAPHING WORKSHOP. A graph of an equation is an illustration of a set of points whose coordinates satisfy the equation.
 GRAPHING WORKSHOP A graph of an equation is an illustration of a set of points whose coordinates satisfy the equation. The figure below shows a straight line drawn through the three points (2, 3), (-3,-2),
If three points A (h, 0), P (a, b) and B (0, k) lie on a line, show that: a b 1.
, P (a, b) and B (0, k) lie on a line, show that: a b 1.") ASSIGNMENT ON STRAIGHT LINES LEVEL 1 (CBSE/NCERT/STATE BOARDS) 1 Find the angle between the lines joining the points (0, 0), (2, 3) and the points (2, 2), (3, 5). 2 What is the value of y so that the line
ASSIGNMENT ON STRAIGHT LINES LEVEL 1 (CBSE/NCERT/STATE BOARDS) 1 Find the angle between the lines joining the points (0, 0), (2, 3) and the points (2, 2), (3, 5). 2 What is the value of y so that the line
Section 3.1 Objective 1: Plot Points in the Rectangular Coordinate System Video Length 12:35
 Section 3.1 Video Guide The Rectangular Coordinate System and Equations in Two Variables Objectives: 1. Plot Points in the Rectangular Coordinate System 2. Determine If an Ordered Pair Satisfies an Equation
Stage 7 Checklists Have you reached this Standard?
 Stage 7 Checklists Have you reached this Standard? Main Criteria for the whole year. J K L Use positive integer powers and associated real roots Apply the four operations with decimal numbers Write a quantity
 Specific Objectives Students will understand that that the family of equation corresponds with the shape of the graph. Students will be able to create a graph of an equation by plotting points. In lesson
Curriculum Plan Overview
 Curriculum Plan Overview Subject: Maths Year group: 10 Term Title of unit/ Topic Learning Autumn Term 1 Fractions Collecting and Analysing Data Equations Find and use equivalent fractions, simplify fractions,
CHAPTER 2 REVIEW COORDINATE GEOMETRY MATH Warm-Up: See Solved Homework questions. 2.2 Cartesian coordinate system
 CHAPTER 2 REVIEW COORDINATE GEOMETRY MATH6 2.1 Warm-Up: See Solved Homework questions 2.2 Cartesian coordinate system Coordinate axes: Two perpendicular lines that intersect at the origin O on each line.
.(3, 2) Co-ordinate Geometry Co-ordinates. Every point has two co-ordinates. Plot the following points on the plane. A (4, 1) D (2, 5) G (6, 3)
 Co-ordinate Geometry Co-ordinates. Every point has two co-ordinates. Plot the following points on the plane. A (4, 1) D (2, 5) G (6, 3)") Co-ordinate Geometry Co-ordinates Every point has two co-ordinates. (3, 2) x co-ordinate y co-ordinate Plot the following points on the plane..(3, 2) A (4, 1) D (2, 5) G (6, 3) B (3, 3) E ( 4, 4) H (6,
Co-ordinate Geometry Co-ordinates Every point has two co-ordinates. (3, 2) x co-ordinate y co-ordinate Plot the following points on the plane..(3, 2) A (4, 1) D (2, 5) G (6, 3) B (3, 3) E ( 4, 4) H (6,
Graphs and transformations, Mixed Exercise 4
 Graphs and transformations, Mixed Exercise 4 a y = x (x ) 0 = x (x ) So x = 0 or x = The curve crosses the x-axis at (, 0) and touches it at (0, 0). y = x x = x( x) As a = is negative, the graph has a
Writing and Graphing Linear Equations. Linear equations can be used to represent relationships.
 Writing and Graphing Linear Equations Linear equations can be used to represent relationships. Linear equation An equation whose solutions form a straight line on a coordinate plane. Collinear Points that
Section 10.1 Polar Coordinates
 Section 10.1 Polar Coordinates Up until now, we have always graphed using the rectangular coordinate system (also called the Cartesian coordinate system). In this section we will learn about another system,
Use of Number Maths Statement Code no: 1 Student: Class: At Junior Certificate level the student can: Apply the knowledge and skills necessary to perf
 Use of Number Statement Code no: 1 Apply the knowledge and skills necessary to perform mathematical calculations 1 Recognise simple fractions, for example 1 /4, 1 /2, 3 /4 shown in picture or numerical
GAUTENG DEPARTMENT OF EDUCATION SENIOR SECONDARY INTERVENTION PROGRAMME. MATHEMATICS Grade 11 SESSION 17 LEARNER NOTES
 TRANSFORMATIONS Learner note: Transformations are easy to master and you can score well in questions involving this topic. Ensure that you know the different algebraic transformation rules. LESSON OVERVIEW
AQA GCSE Maths - Higher Self-Assessment Checklist
 AQA GCSE Maths - Higher Self-Assessment Checklist Number 1 Use place value when calculating with decimals. 1 Order positive and negative integers and decimals using the symbols =,, , and. 1 Round to
demonstrate an understanding of the exponent rules of multiplication and division, and apply them to simplify expressions Number Sense and Algebra
 MPM 1D - Grade Nine Academic Mathematics This guide has been organized in alignment with the 2005 Ontario Mathematics Curriculum. Each of the specific curriculum expectations are cross-referenced to the
4038 ADDITIONAL MATHEMATICS TOPIC 2: GEOMETRY AND TRIGONOMETRY SUB-TOPIC 2.2 COORDINATE GEOMETRY IN TWO DIMENSIONS
 4038 ADDITIONAL MATHEMATICS TOPIC : GEOMETRY AND TRIGONOMETRY SUB-TOPIC. COORDINATE GEOMETRY IN TWO DIMENSIONS CONTENT OUTLINE. Condition for two lines to be parallel or perpendicular. Mid-point of line
Bramhall high school Year 9 Assessment descriptor Mathematics
 Grade Description Exceeding Calculate with fractional powers. Calculate exactly with surds. 8/9 Establish the exact values of sinθ and cosθ for θ = 0, 30, 45, 60 and 90, the exact value of tanθ for θ =
Barrhead High School Mathematics Department. National 4 Mathematics. Learning Intentions & Success Criteria: Assessing My Progress
 Barrhead High School Mathematics Department National 4 Mathematics Learning Intentions & Success Criteria: Assessing My Progress Expressions and Formulae Topic Learning Intention Success Criteria I understand
Summary Of Topics covered in Year 7. Topic All pupils should Most pupils should Some pupils should Learn formal methods for
 Summary Of Topics covered in Year 7 Topic All pupils should Most pupils should Some pupils should Learn formal methods for Have a understanding of computing multiplication Use the order of basic number
Algebra 1 Semester 2 Final Review
 Team Awesome 011 Name: Date: Period: Algebra 1 Semester Final Review 1. Given y mx b what does m represent? What does b represent?. What axis is generally used for x?. What axis is generally used for y?
Algebra Unit 2: Linear Functions Notes. Slope Notes. 4 Types of Slope. Slope from a Formula
 Undefined Slope Notes Types of Slope Zero Slope Slope can be described in several ways: Steepness of a line Rate of change rate of increase or decrease Rise Run Change (difference) in y over change (difference)
A function: A mathematical relationship between two variables (x and y), where every input value (usually x) has one output value (usually y)
, where every input value (usually x) has one output value (usually y)") SESSION 9: FUNCTIONS KEY CONCEPTS: Definitions & Terminology Graphs of Functions - Straight line - Parabola - Hyperbola - Exponential Sketching graphs Finding Equations Combinations of graphs TERMINOLOGY
SESSION 9: FUNCTIONS KEY CONCEPTS: Definitions & Terminology Graphs of Functions - Straight line - Parabola - Hyperbola - Exponential Sketching graphs Finding Equations Combinations of graphs TERMINOLOGY
MATHEMATICAL METHODS UNITS 3 AND Sketching Polynomial Graphs
 Maths Methods 1 MATHEMATICAL METHODS UNITS 3 AND 4.3 Sketching Polnomial Graphs ou are required to e ale to sketch the following graphs. 1. Linear functions. Eg. = ax + These graphs when drawn will form
SLOPE A MEASURE OF STEEPNESS through 7.1.5
 SLOPE A MEASURE OF STEEPNESS 7.1. through 7.1.5 Students have used the equation = m + b throughout this course to graph lines and describe patterns. When the equation is written in -form, the m is the
UNIT 3 EXPRESSIONS AND EQUATIONS Lesson 3: Creating Quadratic Equations in Two or More Variables
 Guided Practice Example 1 Find the y-intercept and vertex of the function f(x) = 2x 2 + x + 3. Determine whether the vertex is a minimum or maximum point on the graph. 1. Determine the y-intercept. The
4. TANGENTS AND NORMALS
 4. TANGENTS AND NORMALS 4. Equation of the Tangent at a Point Recall that the slope of a curve at a point is the slope of the tangent at that point. The slope of the tangent is the value of the derivative
Year 10 Mathematics Scheme of Work. Higher and Foundation
 Year 10 Mathematics Scheme of Work Higher and Foundation Tiers Sets 1 and 2 will do the Higher specification. Sets 3 and 4 will do the Higher specification but with a focus on the topics that overlap Higher
1.8 Coordinate Geometry. Copyright Cengage Learning. All rights reserved.
 1.8 Coordinate Geometry Copyright Cengage Learning. All rights reserved. Objectives The Coordinate Plane The Distance and Midpoint Formulas Graphs of Equations in Two Variables Intercepts Circles Symmetry
Section 3.1 Graphing Using the Rectangular Coordinate System
 Objectives Section 3.1 Graphing Using the Rectangular Coordinate System n Construct a rectangular coordinate system n Plot ordered pairs and determine the coordinates of a point n Graph paired data n Read
An angle that has a measure less than a right angle.
 Unit 1 Study Strategies: Two-Dimensional Figures Lesson Vocab Word Definition Example Formed by two rays or line segments that have the same 1 Angle endpoint. The shared endpoint is called the vertex.
8.2 Graph and Write Equations of Parabolas
 8.2 Graph and Write Equations of Parabolas Where is the focus and directrix compared to the vertex? How do you know what direction a parabola opens? How do you write the equation of a parabola given the
Input/Output Machines
 UNIT 1 1 STUDENT BOOK / Machines LESSON Quick Review t Home c h o o l This is an / machine It can be used to make a growing pattern Each input is multiplied by 9 to get the output If you input 1, the output
Equation of a Straight Line - Past Paper Questions
 Equation of a Straight Line - Past Paper Questions 1) Four straight line graphs are shown below. Which one of these above could represent the line with equation 2x + y = 3? Give 2 reasons to justify your
Year 11 Key Performance Indicators Maths (Number)
") Key Performance Indicators Maths (Number) M11.1 N1: Four operations with decimals and using the order of operations correctly. Solve problems using mathematical reasoning. Four rules of negative numbers
Key Performance Indicators Maths (Number) M11.1 N1: Four operations with decimals and using the order of operations correctly. Solve problems using mathematical reasoning. Four rules of negative numbers
Cecil Jones Academy Mathematics Fundamentals
 Year 10 Fundamentals Core Knowledge Unit 1 Unit 2 Estimate with powers and roots Calculate with powers and roots Explore the impact of rounding Investigate similar triangles Explore trigonometry in right-angled
Graphing Linear Equations and Inequalities: Graphing Linear Equations and Inequalities in One Variable *
 OpenStax-CNX module: m18877 1 Graphing Linear Equations and Inequalities: Graphing Linear Equations and Inequalities in One Variable * Wade Ellis Denny Burzynski This work is produced by OpenStax-CNX and
7Coordinate. geometry UNCORRECTED PAGE PROOFS. 7.1 Kick off with CAS
 7.1 Kick off with CAS 7Coordinate geometry 7. Distance between two points 7.3 Midpoint of a line segment 7.4 Parallel lines and perpendicular lines 7.5 Applications 7.6 Review 7.1 Kick off with CAS U N
2.1 Solutions to Exercises
 Last edited 9/6/17.1 Solutions to Exercises 1. P(t) = 1700t + 45,000. D(t) = t + 10 5. Timmy will have the amount A(n) given by the linear equation A(n) = 40 n. 7. From the equation, we see that the slope